Is California’s Apartment Market Broken?
20
Is California’s Apartment Market Broken? e Relationship Between Zoning, Rents, and Multifamily Development Cecile Murray University of Chicago Jenny Schuetz Brookings Institution July 2019
Transcript of Is California’s Apartment Market Broken?
Is California’s Apartment Market Broken?The Relationship Between Zoning, Rents, andMultifamily Development
Cecile MurrayUniversity of Chicago
Jenny SchuetzBrookings Institution
July 2019

Terner Center Land Use Working Paper Series • 2019
3
AbstractAs California’s gap between incomes and housing costs continues to widen, state and local policymakers are grap-pling with ways to improve affordability. One approach is to encourage development of smaller, less costly housing types, especially apartments in multifamily buildings. In well-functioning housing markets, developers will choose to build apartments where land is expensive and housing demand is strong. However, single-family homeowners often seek to limit apartments through restrictive zoning. In this paper, we use a newly collected dataset of land use regulations to analyze how California’s local governments regulate apartment development and whether zoning is limiting multifamily construction. Results indicate that California cities use multiple channels to restrict apart-ments. Jurisdictions that set lower allowed densities and building heights issued fewer multifamily permits from 2013 to 2017. Results also show that the amount of multi-family development is not strongly correlated with rents, contrary to urban economic theory.
IntroductionAs California’s gap between incomes and housing costs continues to widen, state and local policymakers are grap-pling with ways to improve affordability (Bliss, 2019; Brin-klow, 2019; Dillon, 2019; Hsieh and Moretti, 2018; Ygle-sias, 2018). One approach is to encourage development of smaller, less costly housing types. Apartments in multi-family buildings are cheaper than single-family detached homes in the same location, because they use less land per home. Stacking homes vertically also has environmental benefits, because apartments have lower energy usage and allow more efficient use of water and sewer infrastructure. Relative to low-density single-family homes, apartments also allow more people to live in desirable locations—places with an abundance of jobs, access to mass transit, good schools, and other amenities. In well-functioning housing markets, developers will build more apartments where land is expensive and demand for housing is strong. However, apartments are politically unpopular among single-family homeowners, who use zoning to deter or prevent multi-family development.
In this paper, we investigate whether apartment develop-ment in California has been constrained by local zoning. Our analysis uses new data collected by the Terner Cali-fornia Residential Land Use Survey (TCRLUS). Specifically,
we ask how local governments regulate apartment devel-opment. We also test for correlation between the number of multifamily permits and zoning metrics, controlling for local economic factors that affect the supply and demand for multifamily housing.
BackgroundApartments are an important but unpopular part of the housing ecosystem.A fundamental principle of urban economics is that, in loca-tions with high land values, developers will build at higher density, e.g. use less land per unit of housing (Alonso, 1962; Mills, 1967; Muth, 1969). For instance, a developer building a single-family subdivision in an area with expensive land will choose to create smaller lots and will build larger homes on these lots, compared to a subdivision developed on cheaper land (Dye and McMillen, 2007). Stacking homes vertically in multifamily structures allows developers to build more housing units on a given parcel of land (Ahlfeldt and McMillen, 2015; Clapp et al., 2012; Gyourko and Saiz, 2006; Wheaton, 1978). Therefore cities and neighborhoods with high underlying land values should build relatively denser housing, including a larger number of apartments.
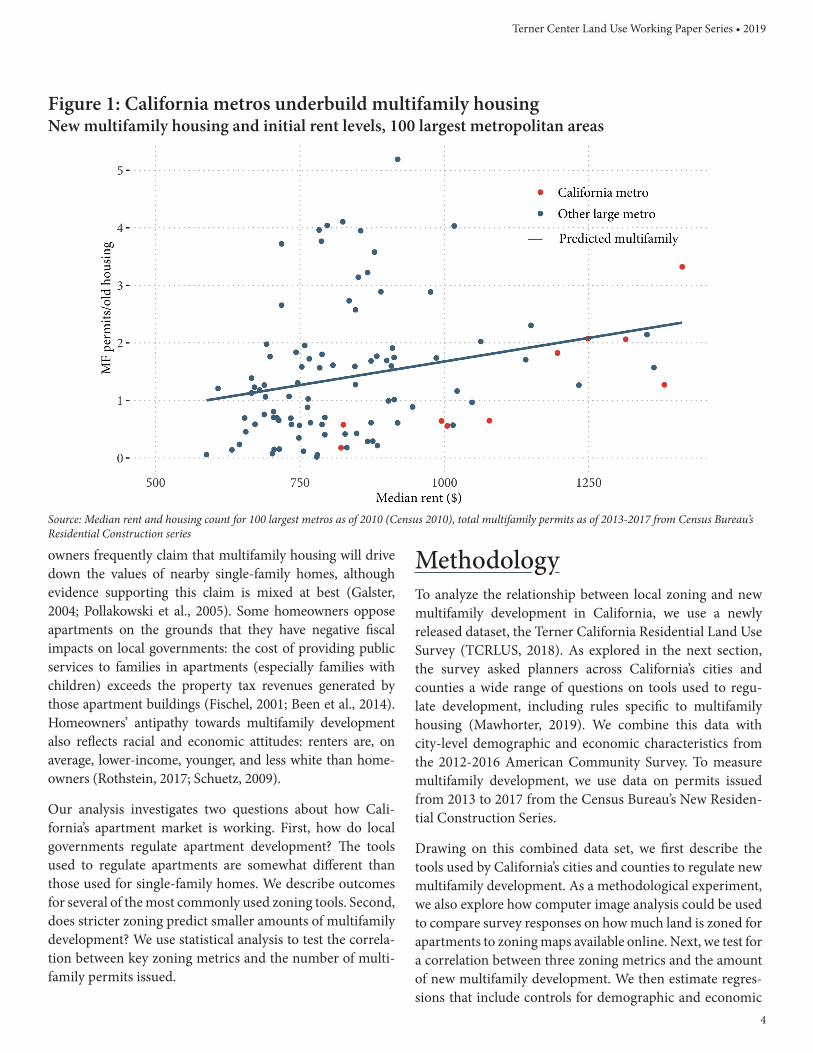
Figure 1 illustrates this relationship across U.S. metropolitan areas. The horizontal axis shows median rents in 2010 and the vertical axis shows the number of multifamily permits issued from 2013 to 2017. Throughout this paper, permits are normalized by the size of each city’s initial housing stock, to adjust for differences in scale across communi-ties. The graph clearly shows a positive relationship: metros with higher initial rents issued more permits for apartments in the subsequent years, as predicted by urban economic theory. But nearly all of California’s metropolitan areas issued fewer multifamily permits than would be predicted, based on their initial rents (dots below the regression line issued fewer permits than expected, while dots above the line issued more permits). This suggests that housing markets in California—and other high cost metros such as New York, Boston, Washington DC and Honolulu—are not increasing their apartment supply despite strong financial incentives for developers in the form of high rents.
California’s metros and other high-cost housing markets may not be adding enough apartments not because of lack of demand, but because many homeowners are opposed to new multifamily development in their communities (Glaeser et al., 2005; Fischel, 2001; Schuetz, 2008; Schuetz, 2009). Home-
Terner Center Land Use Working Paper Series • 2019
4
owners frequently claim that multifamily housing will drive down the values of nearby single-family homes, although evidence supporting this claim is mixed at best (Galster, 2004; Pollakowski et al., 2005). Some homeowners oppose apartments on the grounds that they have negative fiscal impacts on local governments: the cost of providing public services to families in apartments (especially families with children) exceeds the property tax revenues generated by those apartment buildings (Fischel, 2001; Been et al., 2014). Homeowners’ antipathy towards multifamily development also reflects racial and economic attitudes: renters are, on average, lower-income, younger, and less white than home-owners (Rothstein, 2017; Schuetz, 2009).
Our analysis investigates two questions about how Cali-fornia’s apartment market is working. First, how do local governments regulate apartment development? The tools used to regulate apartments are somewhat different than those used for single-family homes. We describe outcomes for several of the most commonly used zoning tools. Second, does stricter zoning predict smaller amounts of multifamily development? We use statistical analysis to test the correla-tion between key zoning metrics and the number of multi-family permits issued.
MethodologyTo analyze the relationship between local zoning and new multifamily development in California, we use a newly released dataset, the Terner California Residential Land Use Survey (TCRLUS, 2018). As explored in the next section, the survey asked planners across California’s cities and counties a wide range of questions on tools used to regu-late development, including rules specific to multifamily housing (Mawhorter, 2019). We combine this data with city-level demographic and economic characteristics from the 2012-2016 American Community Survey. To measure multifamily development, we use data on permits issued from 2013 to 2017 from the Census Bureau’s New Residen-tial Construction Series.
Drawing on this combined data set, we first describe the tools used by California’s cities and counties to regulate new multifamily development. As a methodological experiment, we also explore how computer image analysis could be used to compare survey responses on how much land is zoned for apartments to zoning maps available online. Next, we test for a correlation between three zoning metrics and the amount of new multifamily development. We then estimate regres-sions that include controls for demographic and economic
Figure 1: California metros underbuild multifamily housingNew multifamily housing and initial rent levels, 100 largest metropolitan areas
Source: Median rent and housing count for 100 largest metros as of 2010 (Census 2010), total multifamily permits as of 2013-2017 from Census Bureau’s Residential Construction series
Terner Center Land Use Working Paper Series • 2019
5
characteristics, as well as zoning. The results on zoning are robust to additional controls: restrictive apartment zoning is correlated with fewer multifamily permits, even including economic characteristics.
FindingsHow do local governments in California regulate apartment development?Local governments have a wide range of tools to regulate development, and may use different tools for different land uses. For instance, the cornerstone of single-family zoning is minimum lot size: how much land is required for each single-family detached home. However, minimum lot size is a less important metric for regulation multifamily develop-ment. TCRLUS asked a wide range of questions about how California’s local governments regulate multifamily devel-opment, including dimensional requirements and devel-opment process. However, some of these questions were infrequently answered and contain missing values for many jurisdictions, or have relatively little variation in the answers given. We focus on three multifamily zoning metrics and two zoning process questions that appear most complete and have fairly wide variation.
Our three multifamily zoning metrics are the share of land zoned for multifamily, the maximum number of units allowed per acre, and maximum building height. These three metrics provide a sense of how much multifamily
development a city’s zoning regime allows, and how dense such development can be. Additionally, we examine the responses to two questions about the building permit appli-cation process: namely, the frequency with which jurisdic-tions receive applications for modestly-sized multifamily projects and the average approval time for multifamily proj-ects that do not require any zoning variances or changes. Understanding the frequency of applications across cities sheds light on whether developers are even attempting to build in the majority of cities, and understanding reported approval times helps indicate how onerous city planners perceive their approval processes to be. Lengthy or uncer-tain processes add to the cost of development, and may deter developers from pursuing projects.
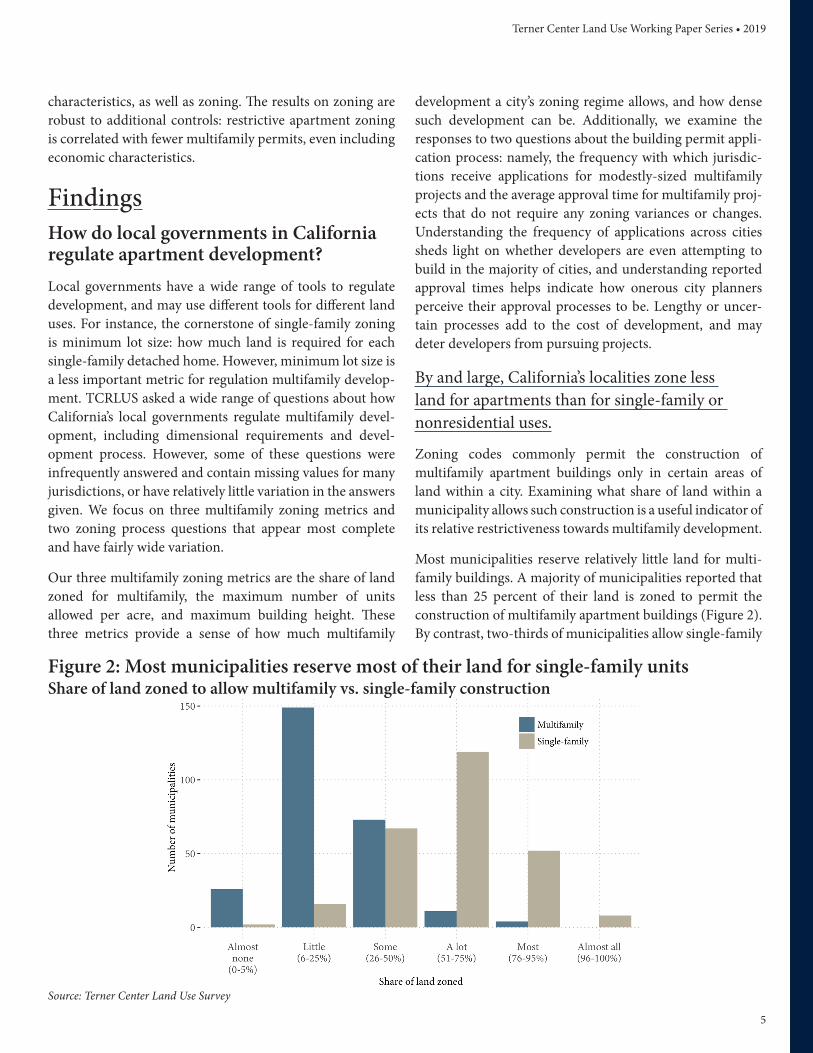
By and large, California’s localities zone less land for apartments than for single-family or nonresidential uses.
Zoning codes commonly permit the construction of multifamily apartment buildings only in certain areas of land within a city. Examining what share of land within a municipality allows such construction is a useful indicator of its relative restrictiveness towards multifamily development.
Most municipalities reserve relatively little land for multi-family buildings. A majority of municipalities reported that less than 25 percent of their land is zoned to permit the construction of multifamily apartment buildings (Figure 2). By contrast, two-thirds of municipalities allow single-family
Source: Terner Center Land Use Survey
Figure 2: Most municipalities reserve most of their land for single-family unitsShare of land zoned to allow multifamily vs. single-family construction
Terner Center Land Use Working Paper Series • 2019
6
homes on more than 50 percent of land. Even non-residen-tial uses, which are typically more restricted than residen-tial development, are allowed on a larger share of land than multifamily in most municipalities. While it is theoretically possible that a municipality with only a small amount of land zoned for multifamily could accommodate substantial development, if that land allows very high density of apart-ments, the small land shares for multifamily compared to other uses are a useful signal of local government priorities.
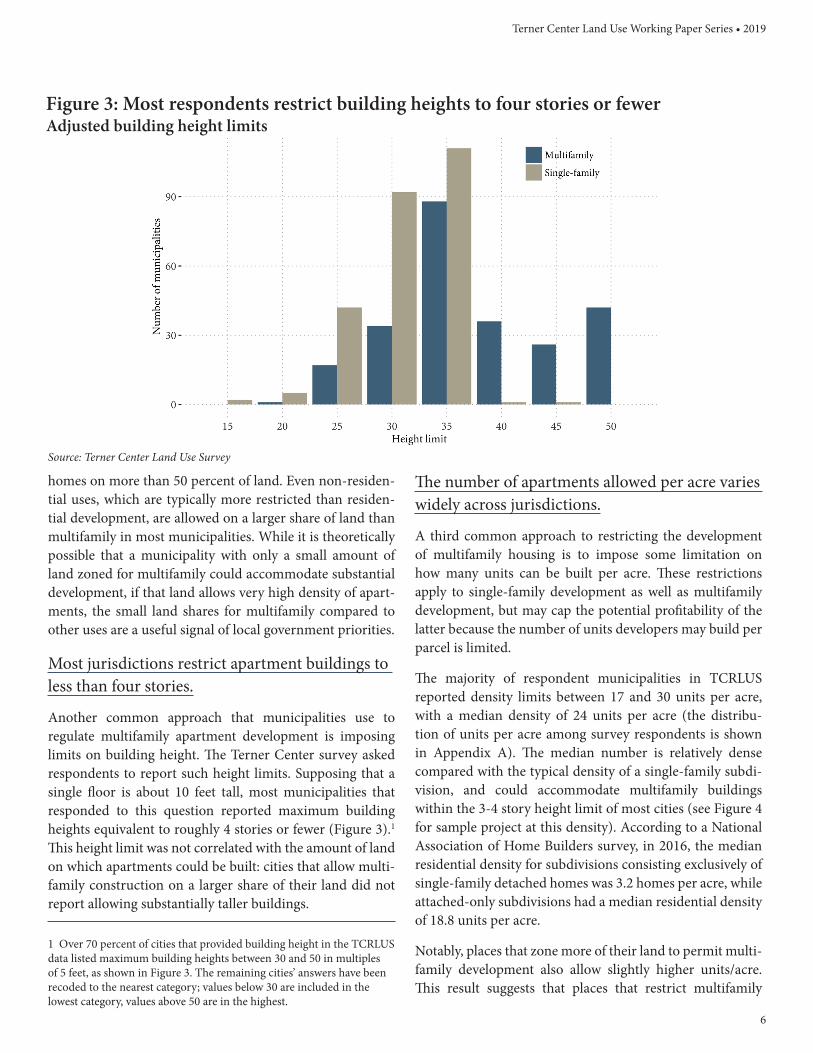
Most jurisdictions restrict apartment buildings to less than four stories.
Another common approach that municipalities use to regulate multifamily apartment development is imposing limits on building height. The Terner Center survey asked respondents to report such height limits. Supposing that a single floor is about 10 feet tall, most municipalities that responded to this question reported maximum building heights equivalent to roughly 4 stories or fewer (Figure 3).1 This height limit was not correlated with the amount of land on which apartments could be built: cities that allow multi-family construction on a larger share of their land did not report allowing substantially taller buildings.
1 Over 70 percent of cities that provided building height in the TCRLUS data listed maximum building heights between 30 and 50 in multiples of 5 feet, as shown in Figure 3. The remaining cities’ answers have been recoded to the nearest category; values below 30 are included in the lowest category, values above 50 are in the highest.
The number of apartments allowed per acre varies widely across jurisdictions.
A third common approach to restricting the development of multifamily housing is to impose some limitation on how many units can be built per acre. These restrictions apply to single-family development as well as multifamily development, but may cap the potential profitability of the latter because the number of units developers may build per parcel is limited.
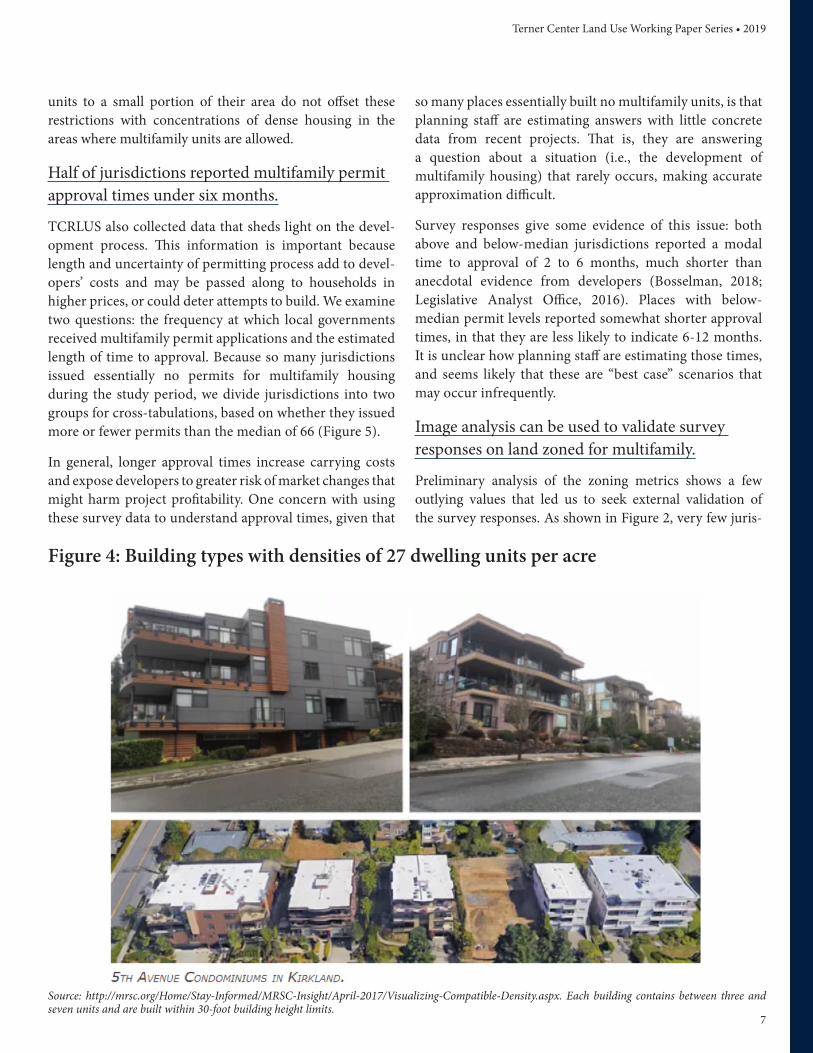
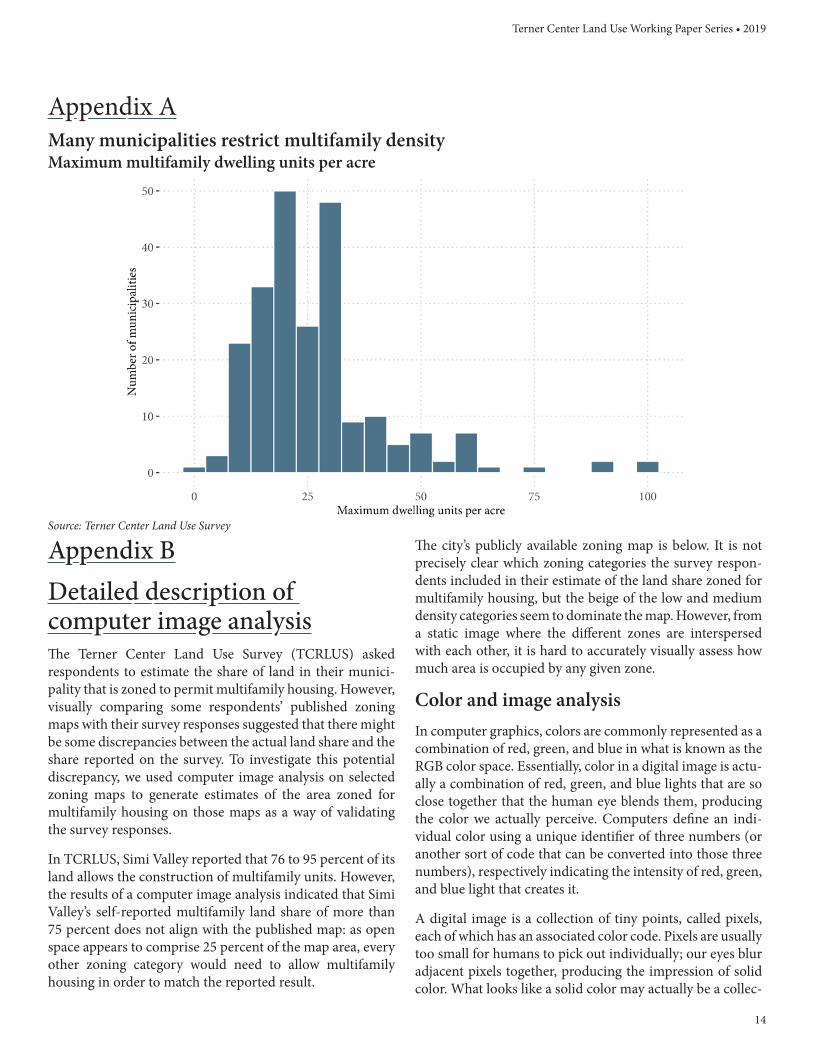
The majority of respondent municipalities in TCRLUS reported density limits between 17 and 30 units per acre, with a median density of 24 units per acre (the distribu-tion of units per acre among survey respondents is shown in Appendix A). The median number is relatively dense compared with the typical density of a single-family subdi-vision, and could accommodate multifamily buildings within the 3-4 story height limit of most cities (see Figure 4 for sample project at this density). According to a National Association of Home Builders survey, in 2016, the median residential density for subdivisions consisting exclusively of single-family detached homes was 3.2 homes per acre, while attached-only subdivisions had a median residential density of 18.8 units per acre.
Notably, places that zone more of their land to permit multi-family development also allow slightly higher units/acre. This result suggests that places that restrict multifamily
Figure 3: Most respondents restrict building heights to four stories or fewerAdjusted building height limits
Source: Terner Center Land Use Survey
Terner Center Land Use Working Paper Series • 2019
7
units to a small portion of their area do not offset these restrictions with concentrations of dense housing in the areas where multifamily units are allowed.
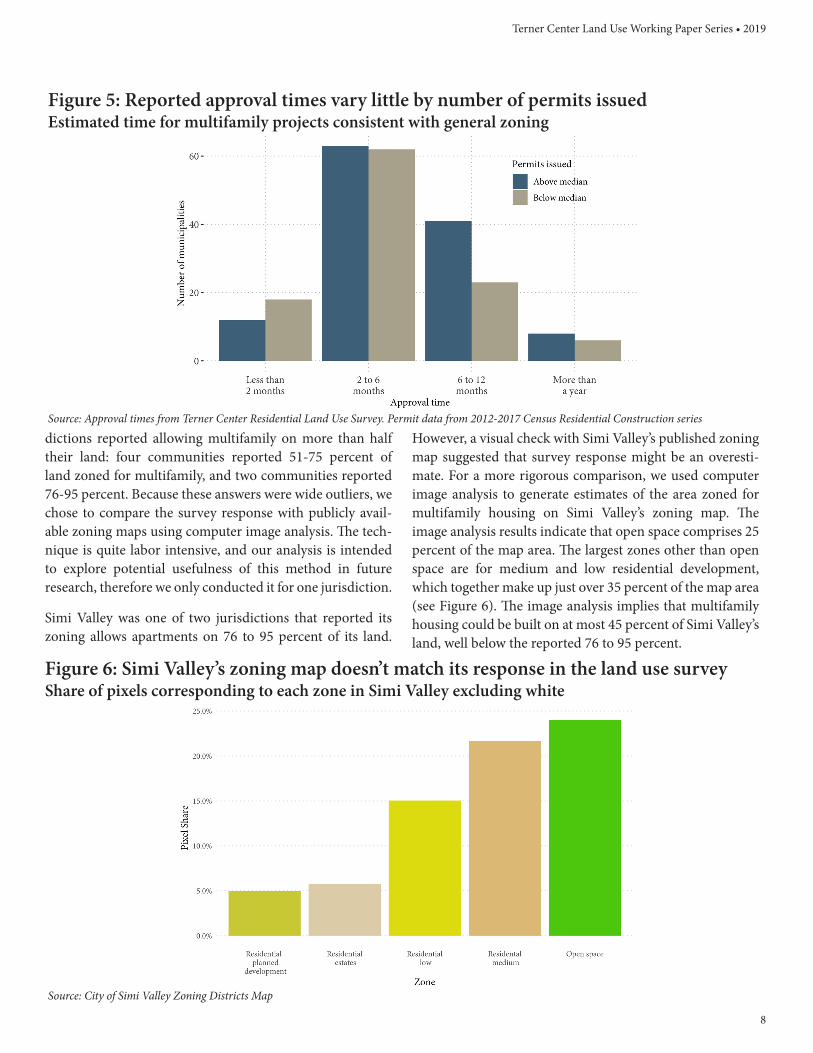
Half of jurisdictions reported multifamily permit approval times under six months.
TCRLUS also collected data that sheds light on the devel-opment process. This information is important because length and uncertainty of permitting process add to devel-opers’ costs and may be passed along to households in higher prices, or could deter attempts to build. We examine two questions: the frequency at which local governments received multifamily permit applications and the estimated length of time to approval. Because so many jurisdictions issued essentially no permits for multifamily housing during the study period, we divide jurisdictions into two groups for cross-tabulations, based on whether they issued more or fewer permits than the median of 66 (Figure 5).
In general, longer approval times increase carrying costs and expose developers to greater risk of market changes that might harm project profitability. One concern with using these survey data to understand approval times, given that
so many places essentially built no multifamily units, is that planning staff are estimating answers with little concrete data from recent projects. That is, they are answering a question about a situation (i.e., the development of multifamily housing) that rarely occurs, making accurate approximation difficult.
Survey responses give some evidence of this issue: both above and below-median jurisdictions reported a modal time to approval of 2 to 6 months, much shorter than anecdotal evidence from developers (Bosselman, 2018; Legislative Analyst Office, 2016). Places with below-median permit levels reported somewhat shorter approval times, in that they are less likely to indicate 6-12 months. It is unclear how planning staff are estimating those times, and seems likely that these are “best case” scenarios that may occur infrequently.
Image analysis can be used to validate survey responses on land zoned for multifamily.
Preliminary analysis of the zoning metrics shows a few outlying values that led us to seek external validation of the survey responses. As shown in Figure 2, very few juris-
Source: http://mrsc.org/Home/Stay-Informed/MRSC-Insight/April-2017/Visualizing-Compatible-Density.aspx. Each building contains between three and seven units and are built within 30-foot building height limits.
Figure 4: Building types with densities of 27 dwelling units per acre
Terner Center Land Use Working Paper Series • 2019
8
dictions reported allowing multifamily on more than half their land: four communities reported 51-75 percent of land zoned for multifamily, and two communities reported 76-95 percent. Because these answers were wide outliers, we chose to compare the survey response with publicly avail-able zoning maps using computer image analysis. The tech-nique is quite labor intensive, and our analysis is intended to explore potential usefulness of this method in future research, therefore we only conducted it for one jurisdiction.
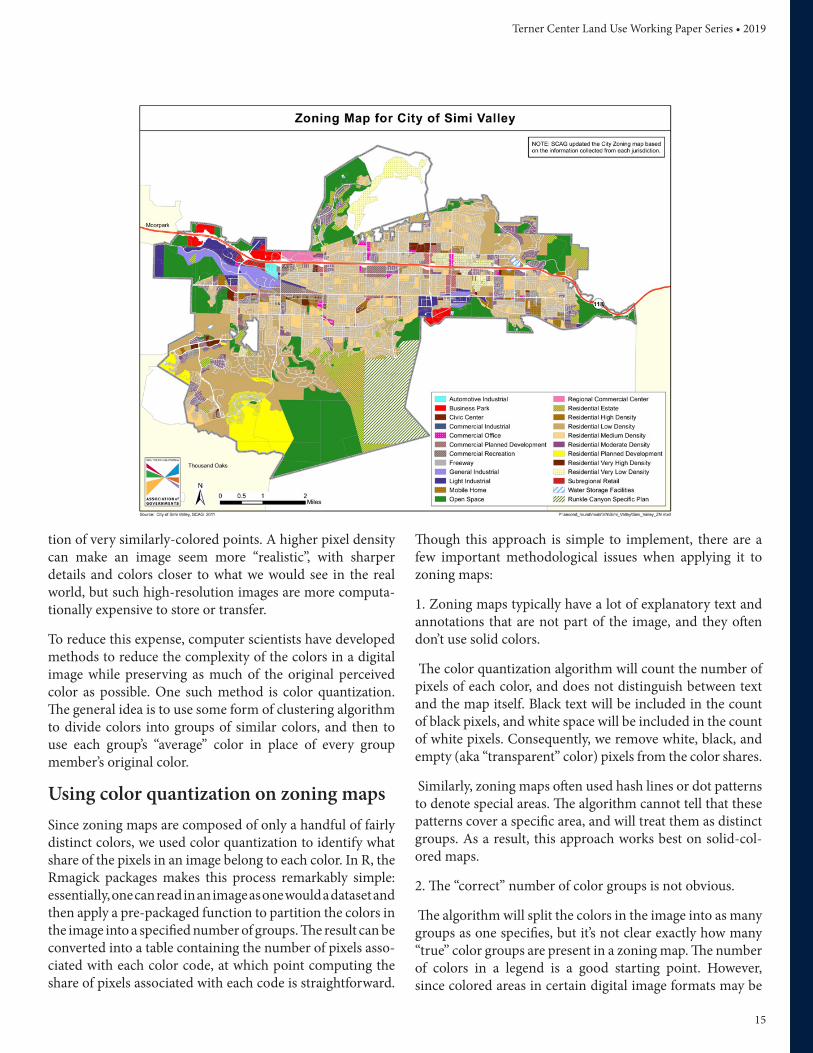
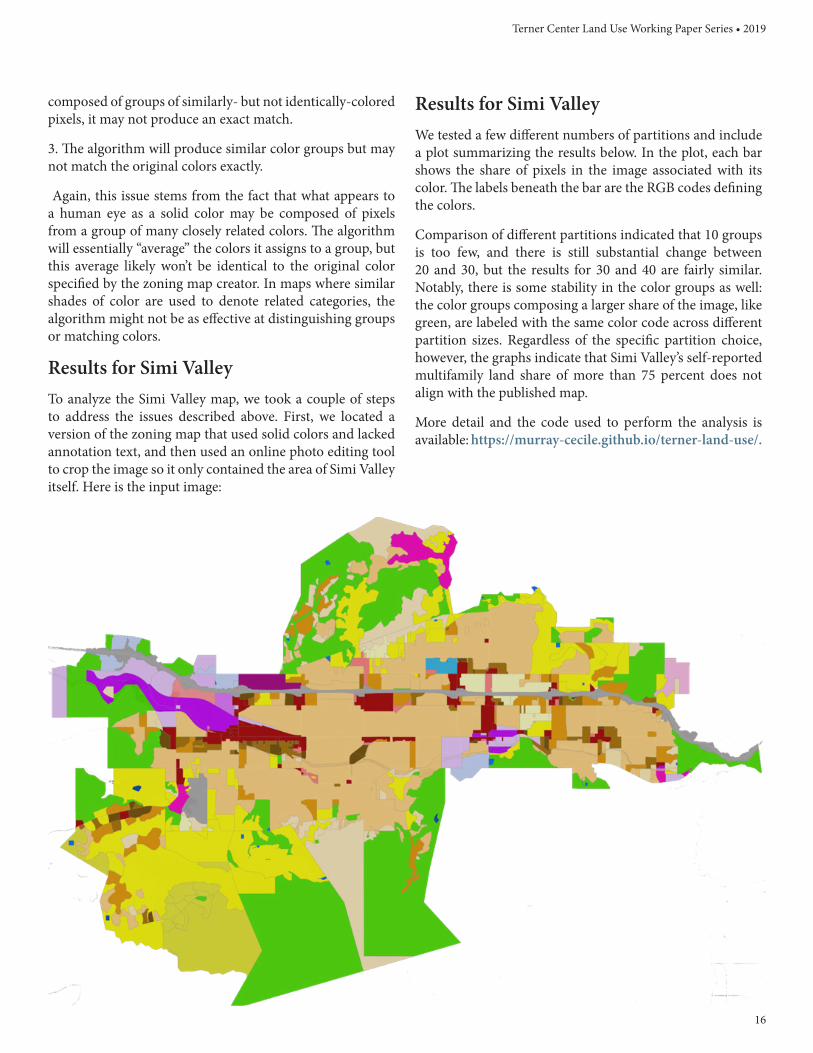
Simi Valley was one of two jurisdictions that reported its zoning allows apartments on 76 to 95 percent of its land.
However, a visual check with Simi Valley’s published zoning map suggested that survey response might be an overesti-mate. For a more rigorous comparison, we used computer image analysis to generate estimates of the area zoned for multifamily housing on Simi Valley’s zoning map. The image analysis results indicate that open space comprises 25 percent of the map area. The largest zones other than open space are for medium and low residential development, which together make up just over 35 percent of the map area (see Figure 6). The image analysis implies that multifamily housing could be built on at most 45 percent of Simi Valley’s land, well below the reported 76 to 95 percent.
Figure 5: Reported approval times vary little by number of permits issuedEstimated time for multifamily projects consistent with general zoning
Source: Approval times from Terner Center Residential Land Use Survey. Permit data from 2012-2017 Census Residential Construction series
Source: City of Simi Valley Zoning Districts Map
Figure 6: Simi Valley’s zoning map doesn’t match its response in the land use surveyShare of pixels corresponding to each zone in Simi Valley excluding white
Terner Center Land Use Working Paper Series • 2019
9
Source: Median rent and housing count from ACS 2008-2012, total multifamily permits 2013-2017 from Census Bureau’s Residential Construction series
Figure 7: Rents do not consistently predict apartment development in CaliforniaNew multifamily permits versus rents in California municipalities by metro area
Terner Center Land Use Working Paper Series • 2019
10
Table 1: California cities with highest rents issued almost no multifamily permits, 2013-17
More information on how the computer image analysis was conducted and detailed results are described in Appendix B.
Does stricter zoning predict less multi-family permitting?In this section, we examine the relationship between zoning, housing market conditions, and the amount of new multi-family development. Contrary to urban economics models, California’s most expensive cities built very few apartments over the past five years. Developers may be deterred from even applying to build apartments in communities where they anticipate being denied. Cities with greater restrictions on apartment density—measured by the number of units allowed per acre and building height—issued fewer multi-family permits. Cities with large populations issued more permits for apartments.
Most California cities build very little multifamily housing.
Census building permits data indicate that very little multi-family housing has been built in California cities in recent years. Of the respondents to TCRLUS, only a handful built more than 50 new units between 2013 and 2017, and most built fewer such units than their demographic and economic characteristics would predict.
Notably, even the cities with the highest rents permitted almost no multifamily housing units during this period. This finding runs contradictory to what economic theory would
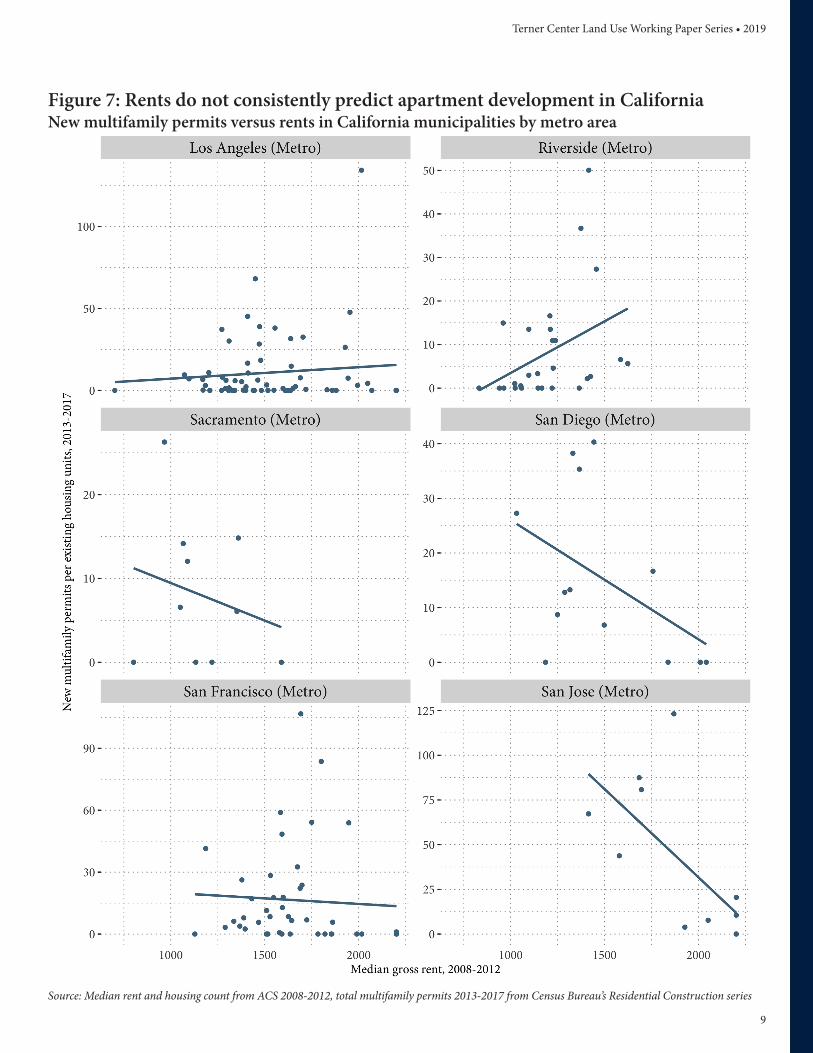
predict—namely, that high prices would drive developers to supply more units—and illustrates how poorly housing markets in California cities are functioning. In fact, Figure 7 shows that in four of the six largest metropolitan areas—Sacramento, San Diego, San Francisco, and San Jose—the correlation between rents and construction appears to be negative. The metro area with the strongest positive relationship in Riverside, a relatively affordable housing market by California standards. The positive relationship in the Los Angeles metro is largely due to Irvine, which permitted nearly twice as much multifamily as the next most productive city.
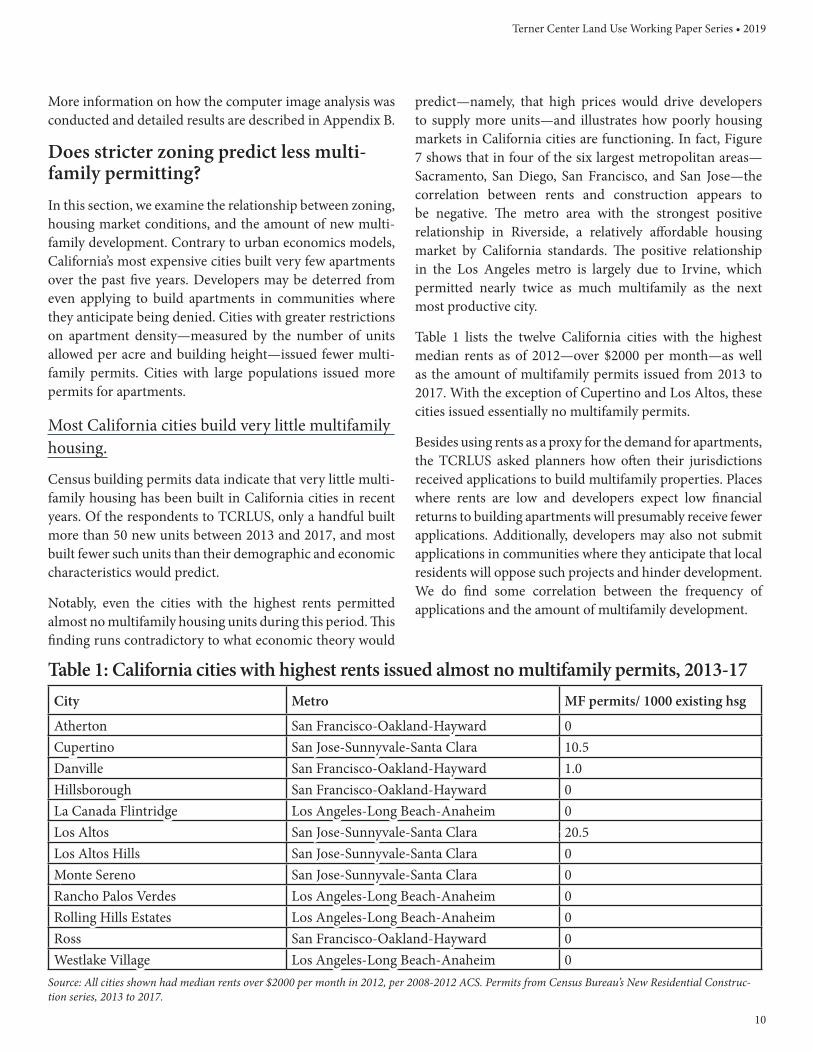
Table 1 lists the twelve California cities with the highest median rents as of 2012—over $2000 per month—as well as the amount of multifamily permits issued from 2013 to 2017. With the exception of Cupertino and Los Altos, these cities issued essentially no multifamily permits.
Besides using rents as a proxy for the demand for apartments, the TCRLUS asked planners how often their jurisdictions received applications to build multifamily properties. Places where rents are low and developers expect low financial returns to building apartments will presumably receive fewer applications. Additionally, developers may also not submit applications in communities where they anticipate that local residents will oppose such projects and hinder development. We do find some correlation between the frequency of applications and the amount of multifamily development.
City Metro MF permits/ 1000 existing hsg
Atherton San Francisco-Oakland-Hayward 0Cupertino San Jose-Sunnyvale-Santa Clara 10.5Danville San Francisco-Oakland-Hayward 1.0Hillsborough San Francisco-Oakland-Hayward 0La Canada Flintridge Los Angeles-Long Beach-Anaheim 0Los Altos San Jose-Sunnyvale-Santa Clara 20.5Los Altos Hills San Jose-Sunnyvale-Santa Clara 0Monte Sereno San Jose-Sunnyvale-Santa Clara 0Rancho Palos Verdes Los Angeles-Long Beach-Anaheim 0Rolling Hills Estates Los Angeles-Long Beach-Anaheim 0Ross San Francisco-Oakland-Hayward 0Westlake Village Los Angeles-Long Beach-Anaheim 0
Source: All cities shown had median rents over $2000 per month in 2012, per 2008-2012 ACS. Permits from Census Bureau’s New Residential Construc-tion series, 2013 to 2017.
Terner Center Land Use Working Paper Series • 2019
11
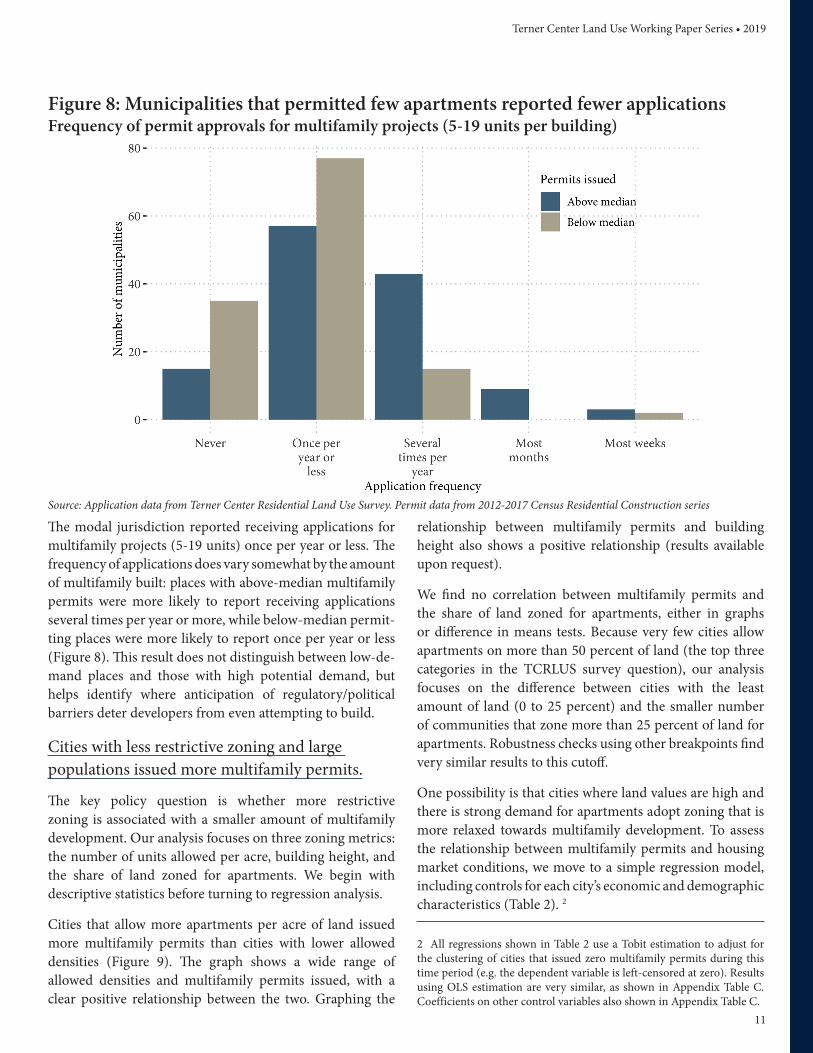
The modal jurisdiction reported receiving applications for multifamily projects (5-19 units) once per year or less. The frequency of applications does vary somewhat by the amount of multifamily built: places with above-median multifamily permits were more likely to report receiving applications several times per year or more, while below-median permit-ting places were more likely to report once per year or less (Figure 8). This result does not distinguish between low-de-mand places and those with high potential demand, but helps identify where anticipation of regulatory/political barriers deter developers from even attempting to build.
Cities with less restrictive zoning and large populations issued more multifamily permits.
The key policy question is whether more restrictive zoning is associated with a smaller amount of multifamily development. Our analysis focuses on three zoning metrics: the number of units allowed per acre, building height, and the share of land zoned for apartments. We begin with descriptive statistics before turning to regression analysis.
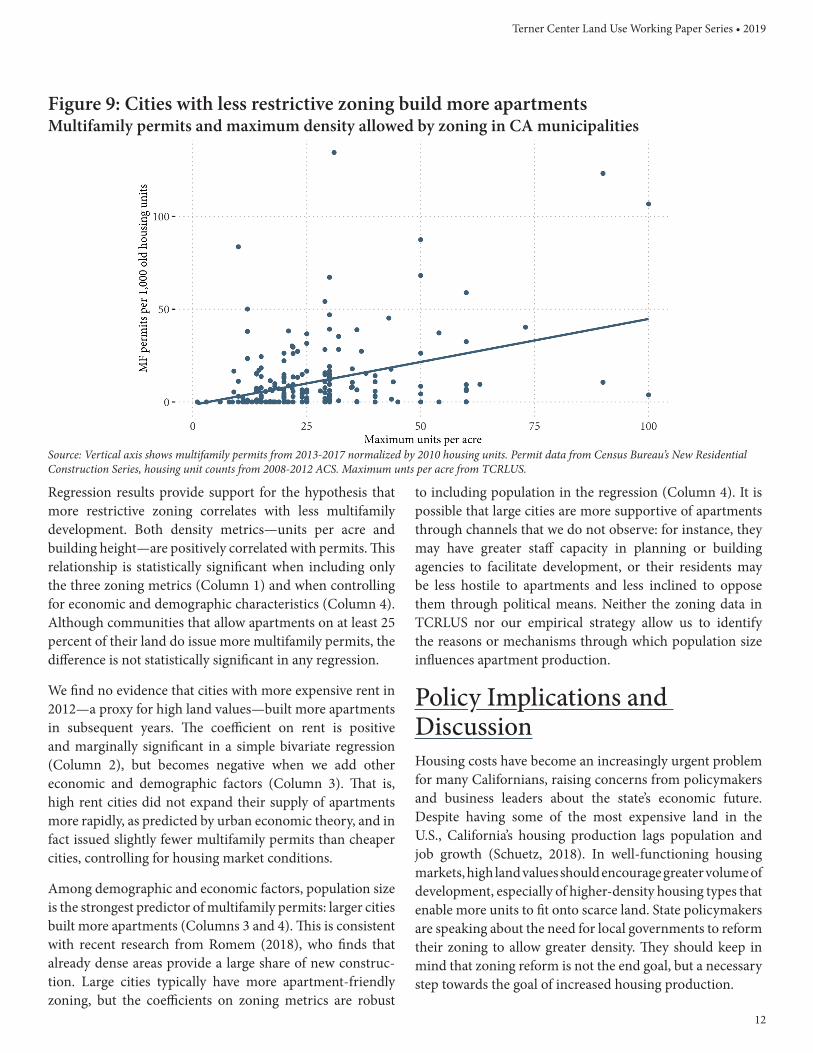
Cities that allow more apartments per acre of land issued more multifamily permits than cities with lower allowed densities (Figure 9). The graph shows a wide range of allowed densities and multifamily permits issued, with a clear positive relationship between the two. Graphing the
relationship between multifamily permits and building height also shows a positive relationship (results available upon request).
We find no correlation between multifamily permits and the share of land zoned for apartments, either in graphs or difference in means tests. Because very few cities allow apartments on more than 50 percent of land (the top three categories in the TCRLUS survey question), our analysis focuses on the difference between cities with the least amount of land (0 to 25 percent) and the smaller number of communities that zone more than 25 percent of land for apartments. Robustness checks using other breakpoints find very similar results to this cutoff.
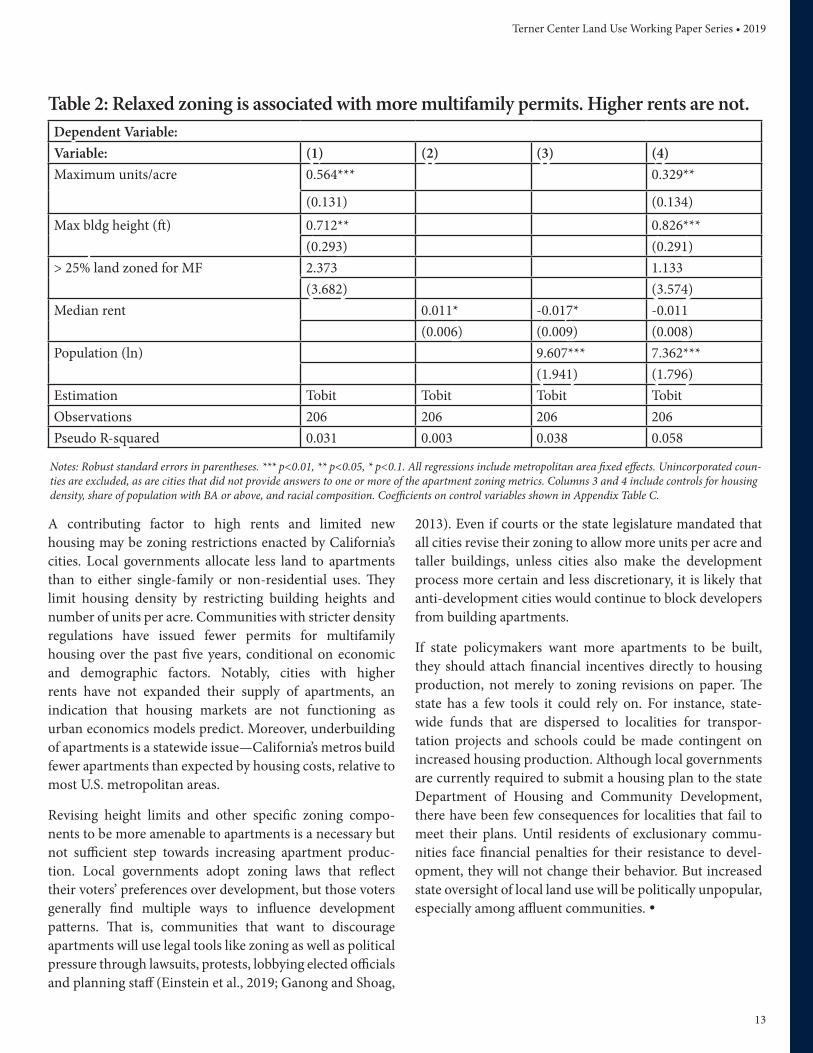
One possibility is that cities where land values are high and there is strong demand for apartments adopt zoning that is more relaxed towards multifamily development. To assess the relationship between multifamily permits and housing market conditions, we move to a simple regression model, including controls for each city’s economic and demographic characteristics (Table 2). 2
2 All regressions shown in Table 2 use a Tobit estimation to adjust for the clustering of cities that issued zero multifamily permits during this time period (e.g. the dependent variable is left-censored at zero). Results using OLS estimation are very similar, as shown in Appendix Table C. Coefficients on other control variables also shown in Appendix Table C.
Figure 8: Municipalities that permitted few apartments reported fewer applicationsFrequency of permit approvals for multifamily projects (5-19 units per building)
Source: Application data from Terner Center Residential Land Use Survey. Permit data from 2012-2017 Census Residential Construction series
Terner Center Land Use Working Paper Series • 2019
12
Regression results provide support for the hypothesis that more restrictive zoning correlates with less multifamily development. Both density metrics—units per acre and building height—are positively correlated with permits. This relationship is statistically significant when including only the three zoning metrics (Column 1) and when controlling for economic and demographic characteristics (Column 4). Although communities that allow apartments on at least 25 percent of their land do issue more multifamily permits, the difference is not statistically significant in any regression.
We find no evidence that cities with more expensive rent in 2012—a proxy for high land values—built more apartments in subsequent years. The coefficient on rent is positive and marginally significant in a simple bivariate regression (Column 2), but becomes negative when we add other economic and demographic factors (Column 3). That is, high rent cities did not expand their supply of apartments more rapidly, as predicted by urban economic theory, and in fact issued slightly fewer multifamily permits than cheaper cities, controlling for housing market conditions.
Among demographic and economic factors, population size is the strongest predictor of multifamily permits: larger cities built more apartments (Columns 3 and 4). This is consistent with recent research from Romem (2018), who finds that already dense areas provide a large share of new construc-tion. Large cities typically have more apartment-friendly zoning, but the coefficients on zoning metrics are robust
Figure 9: Cities with less restrictive zoning build more apartments Multifamily permits and maximum density allowed by zoning in CA municipalities
to including population in the regression (Column 4). It is possible that large cities are more supportive of apartments through channels that we do not observe: for instance, they may have greater staff capacity in planning or building agencies to facilitate development, or their residents may be less hostile to apartments and less inclined to oppose them through political means. Neither the zoning data in TCRLUS nor our empirical strategy allow us to identify the reasons or mechanisms through which population size influences apartment production.
Policy Implications and DiscussionHousing costs have become an increasingly urgent problem for many Californians, raising concerns from policymakers and business leaders about the state’s economic future. Despite having some of the most expensive land in the U.S., California’s housing production lags population and job growth (Schuetz, 2018). In well-functioning housing markets, high land values should encourage greater volume of development, especially of higher-density housing types that enable more units to fit onto scarce land. State policymakers are speaking about the need for local governments to reform their zoning to allow greater density. They should keep in mind that zoning reform is not the end goal, but a necessary step towards the goal of increased housing production.
Source: Vertical axis shows multifamily permits from 2013-2017 normalized by 2010 housing units. Permit data from Census Bureau’s New Residential Construction Series, housing unit counts from 2008-2012 ACS. Maximum unts per acre from TCRLUS.
Terner Center Land Use Working Paper Series • 2019
13
Table 2: Relaxed zoning is associated with more multifamily permits. Higher rents are not.
A contributing factor to high rents and limited new housing may be zoning restrictions enacted by California’s cities. Local governments allocate less land to apartments than to either single-family or non-residential uses. They limit housing density by restricting building heights and number of units per acre. Communities with stricter density regulations have issued fewer permits for multifamily housing over the past five years, conditional on economic and demographic factors. Notably, cities with higher rents have not expanded their supply of apartments, an indication that housing markets are not functioning as urban economics models predict. Moreover, underbuilding of apartments is a statewide issue—California’s metros build fewer apartments than expected by housing costs, relative to most U.S. metropolitan areas.
Revising height limits and other specific zoning compo-nents to be more amenable to apartments is a necessary but not sufficient step towards increasing apartment produc-tion. Local governments adopt zoning laws that reflect their voters’ preferences over development, but those voters generally find multiple ways to influence development patterns. That is, communities that want to discourage apartments will use legal tools like zoning as well as political pressure through lawsuits, protests, lobbying elected officials and planning staff (Einstein et al., 2019; Ganong and Shoag,
2013). Even if courts or the state legislature mandated that all cities revise their zoning to allow more units per acre and taller buildings, unless cities also make the development process more certain and less discretionary, it is likely that anti-development cities would continue to block developers from building apartments.
If state policymakers want more apartments to be built, they should attach financial incentives directly to housing production, not merely to zoning revisions on paper. The state has a few tools it could rely on. For instance, state-wide funds that are dispersed to localities for transpor-tation projects and schools could be made contingent on increased housing production. Although local governments are currently required to submit a housing plan to the state Department of Housing and Community Development, there have been few consequences for localities that fail to meet their plans. Until residents of exclusionary commu-nities face financial penalties for their resistance to devel-opment, they will not change their behavior. But increased state oversight of local land use will be politically unpopular, especially among affluent communities.
Notes: Robust standard errors in parentheses. *** p<0.01, ** p<0.05, * p<0.1. All regressions include metropolitan area fixed effects. Unincorporated coun-ties are excluded, as are cities that did not provide answers to one or more of the apartment zoning metrics. Columns 3 and 4 include controls for housing density, share of population with BA or above, and racial composition. Coefficients on control variables shown in Appendix Table C.
Dependent Variable:Variable: (1) (2) (3) (4)Maximum units/acre 0.564*** 0.329**
(0.131) (0.134)Max bldg height (ft) 0.712** 0.826***
(0.293) (0.291)> 25% land zoned for MF 2.373 1.133
(3.682) (3.574)Median rent 0.011* -0.017* -0.011
(0.006) (0.009) (0.008)Population (ln) 9.607*** 7.362***
(1.941) (1.796)Estimation Tobit Tobit Tobit TobitObservations 206 206 206 206Pseudo R-squared 0.031 0.003 0.038 0.058
Terner Center Land Use Working Paper Series • 2019
14
Appendix BDetailed description of computer image analysisThe Terner Center Land Use Survey (TCRLUS) asked respondents to estimate the share of land in their munici-pality that is zoned to permit multifamily housing. However, visually comparing some respondents’ published zoning maps with their survey responses suggested that there might be some discrepancies between the actual land share and the share reported on the survey. To investigate this potential discrepancy, we used computer image analysis on selected zoning maps to generate estimates of the area zoned for multifamily housing on those maps as a way of validating the survey responses.
In TCRLUS, Simi Valley reported that 76 to 95 percent of its land allows the construction of multifamily units. However, the results of a computer image analysis indicated that Simi Valley’s self-reported multifamily land share of more than 75 percent does not align with the published map: as open space appears to comprise 25 percent of the map area, every other zoning category would need to allow multifamily housing in order to match the reported result.
The city’s publicly available zoning map is below. It is not precisely clear which zoning categories the survey respon-dents included in their estimate of the land share zoned for multifamily housing, but the beige of the low and medium density categories seem to dominate the map. However, from a static image where the different zones are interspersed with each other, it is hard to accurately visually assess how much area is occupied by any given zone.
Color and image analysisIn computer graphics, colors are commonly represented as a combination of red, green, and blue in what is known as the RGB color space. Essentially, color in a digital image is actu-ally a combination of red, green, and blue lights that are so close together that the human eye blends them, producing the color we actually perceive. Computers define an indi-vidual color using a unique identifier of three numbers (or another sort of code that can be converted into those three numbers), respectively indicating the intensity of red, green, and blue light that creates it.
A digital image is a collection of tiny points, called pixels, each of which has an associated color code. Pixels are usually too small for humans to pick out individually; our eyes blur adjacent pixels together, producing the impression of solid color. What looks like a solid color may actually be a collec-
Appendix AMany municipalities restrict multifamily density Maximum multifamily dwelling units per acre
Source: Terner Center Land Use Survey
Terner Center Land Use Working Paper Series • 2019
15
tion of very similarly-colored points. A higher pixel density can make an image seem more “realistic”, with sharper details and colors closer to what we would see in the real world, but such high-resolution images are more computa-tionally expensive to store or transfer.
To reduce this expense, computer scientists have developed methods to reduce the complexity of the colors in a digital image while preserving as much of the original perceived color as possible. One such method is color quantization. The general idea is to use some form of clustering algorithm to divide colors into groups of similar colors, and then to use each group’s “average” color in place of every group member’s original color.
Using color quantization on zoning mapsSince zoning maps are composed of only a handful of fairly distinct colors, we used color quantization to identify what share of the pixels in an image belong to each color. In R, the Rmagick packages makes this process remarkably simple: essentially, one can read in an image as one would a dataset and then apply a pre-packaged function to partition the colors in the image into a specified number of groups. The result can be converted into a table containing the number of pixels asso-ciated with each color code, at which point computing the share of pixels associated with each code is straightforward.
Though this approach is simple to implement, there are a few important methodological issues when applying it to zoning maps:
1. Zoning maps typically have a lot of explanatory text and annotations that are not part of the image, and they often don’t use solid colors.
The color quantization algorithm will count the number of pixels of each color, and does not distinguish between text and the map itself. Black text will be included in the count of black pixels, and white space will be included in the count of white pixels. Consequently, we remove white, black, and empty (aka “transparent” color) pixels from the color shares.
Similarly, zoning maps often used hash lines or dot patterns to denote special areas. The algorithm cannot tell that these patterns cover a specific area, and will treat them as distinct groups. As a result, this approach works best on solid-col-ored maps.
2. The “correct” number of color groups is not obvious.
The algorithm will split the colors in the image into as many groups as one specifies, but it’s not clear exactly how many “true” color groups are present in a zoning map. The number of colors in a legend is a good starting point. However, since colored areas in certain digital image formats may be
Terner Center Land Use Working Paper Series • 2019
16
composed of groups of similarly- but not identically-colored pixels, it may not produce an exact match.
3. The algorithm will produce similar color groups but may not match the original colors exactly.
Again, this issue stems from the fact that what appears to a human eye as a solid color may be composed of pixels from a group of many closely related colors. The algorithm will essentially “average” the colors it assigns to a group, but this average likely won’t be identical to the original color specified by the zoning map creator. In maps where similar shades of color are used to denote related categories, the algorithm might not be as effective at distinguishing groups or matching colors.
Results for Simi ValleyTo analyze the Simi Valley map, we took a couple of steps to address the issues described above. First, we located a version of the zoning map that used solid colors and lacked annotation text, and then used an online photo editing tool to crop the image so it only contained the area of Simi Valley itself. Here is the input image:
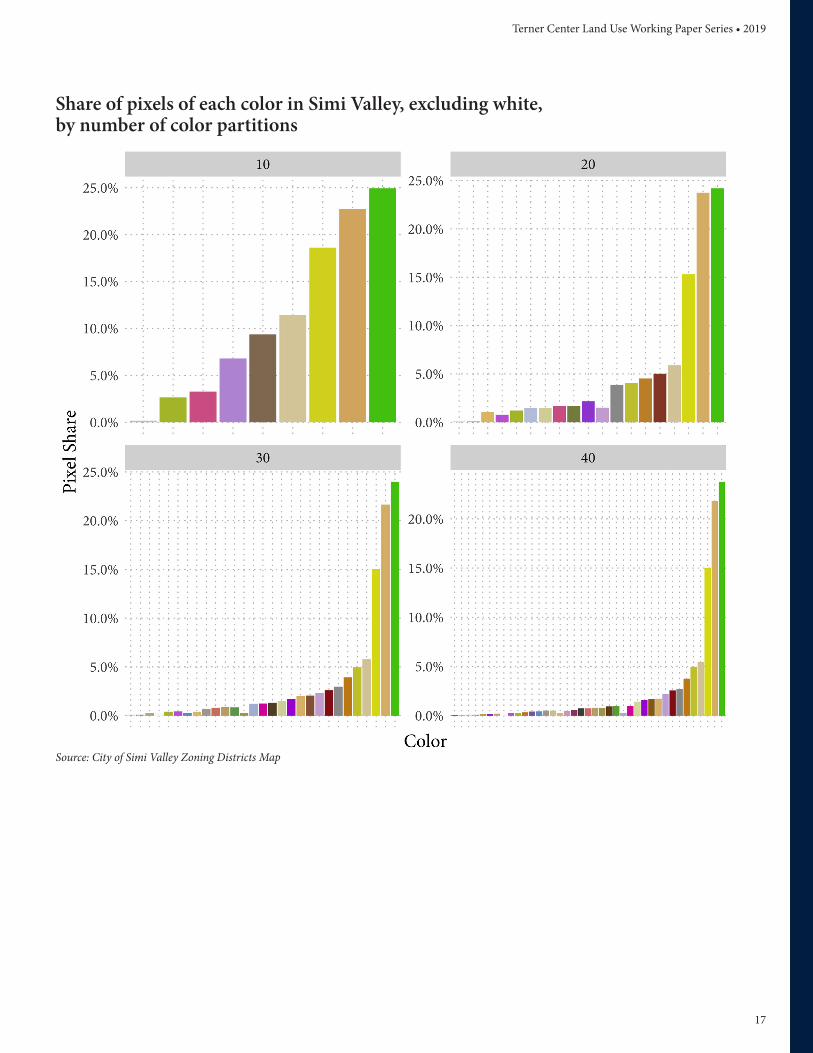
Results for Simi ValleyWe tested a few different numbers of partitions and include a plot summarizing the results below. In the plot, each bar shows the share of pixels in the image associated with its color. The labels beneath the bar are the RGB codes defining the colors.
Comparison of different partitions indicated that 10 groups is too few, and there is still substantial change between 20 and 30, but the results for 30 and 40 are fairly similar. Notably, there is some stability in the color groups as well: the color groups composing a larger share of the image, like green, are labeled with the same color code across different partition sizes. Regardless of the specific partition choice, however, the graphs indicate that Simi Valley’s self-reported multifamily land share of more than 75 percent does not align with the published map.
More detail and the code used to perform the analysis is available: https://murray-cecile.github.io/terner-land-use/.
Terner Center Land Use Working Paper Series • 2019
17
Source: City of Simi Valley Zoning Districts Map
Share of pixels of each color in Simi Valley, excluding white, by number of color partitions
Terner Center Land Use Working Paper Series • 2019
18
Appendix C Robustness checks on regressions
Notes: Robust standard errors in parentheses. *** p<0.01, ** p<0.05, * p<0.1. All regressions include metropolitan area fixed effects. Unincorporated coun-ties are excluded, as are cities that did not provide answers to one or more of the apartment zoning metrics.
Dependent Variable: Multifamily permits/1000 hsg
Variable: (1) (2) (3) (4) (5)
Maximum units/acre 0.443** 0.564*** 0.329**
(0.189) (0.131) (0.134)
Max bldg height (ft) 0.471* 0.712** 0.826***
(0.255) (0.293) (0.291)
> 25% land zoned for MF 0.529 2.373 1.133
(2.946) (3.682) (3.574)
Median rent 0.011* -0.017* -0.011
(0.006) (0.009) (0.008)
Population (ln) 9.607*** 7.362***
(1.941) (1.796)
Housing/sq mi (ln) -0.842 -2.761
(3.236) (3.109)
BA+ 70.19*** 64.99***
(21.080) (19.970)
Black -31.820 -35.780
(43.990) (40.320)
Hispanic 30.58** 32.78***
(13.230) (12.210)
Asian 37.99** 30.68**
(15.030) (13.880)
Estimation OLS Tobit Tobit Tobit Tobit
Observations 206 206 206 206 206
Pseudo R-squared 0.187 0.0309 0.0027 0.0379 0.0575
Terner Center Land Use Working Paper Series • 2019
19
Ahlfeldt, G. & McMillen, D. (2015). “The Vertical City: The price of land and the height of buildings in Chicago 1870-2010.” Spatial Economics Research Centre: SERC Discussion Paper SERCDP0180.
Alonso, W. (1964). Location and Land Use. Cambridge MA: Harvard University Press.
Been, V. Madar, J., & McDonnell, S. (2014). “Urban Land-Use Regulation: Are homevoters overtaking the growth machine?” Journal of Empirical Legal Studies 11(2): 227-265.
Bliss, L. (2019). “California’s New Governor Would Punish Cities Over Affordable Housing.” Citylab. Retrieved from: https://www.citylab.com/transportation/2019/01/gavin-newsom-housing-reform-transportation-budget-homeless/580192/.
Bosselman, A. (2018). “It all adds up: The growing costs that prevent new housing in California.” SPUR. Retrieved from: https://www.spur.org/news/2018-05-09/it-all-adds-growing-costs-prevent-new-housing-california
Brinklow, A. (2019). “Sen. Scott Wiener makes sweeping revisions to transit-housing bill.” Curbed. Retrieved from: https://sf.curbed.com/2019/3/12/18261929/wiener-sb50-transit-housing-amendments-affordable-ferry-california
Clapp, J, Bardos, K., & Wong, S.K. (2012). Empirical estimation of the option premium for residential redevelopment. Regional Science and Urban Economics 42(2): 240-256.
Dillon, L. (2019). “California housing crisis podcast: Where’s the home building for the middle class?” Los Angeles Times Jan 26 2019.
Dye, R. & McMillen, D. (2007). “Teardowns and land values in the Chicago metropolitan area.” Journal of Urban Economics 61(1): 45-63.
Einstein, K., Palmer, M., & Glick, D. (2019). “Who Participates in Local Government? Evidence from Meeting Minutes.” Perspectives on Politics 17(1): 28-46.
Fischel, W. (2001). The Homevoter Hypothesis. Cambridge, MA: Harvard University Press.
Ganong, P. & Shoag, D. (2017). “Why Has Regional Income Convergence in the U.S. Declined?” Journal of Urban Economics 102: 76-90.
Glaeser, E., Schuetz, J., & Ward, B. (2006). “Regulation and the Rise of Housing Prices in Greater Boston.” Pioneer Institute for Public Policy Research Policy Brief PB-2006-1.
Gyourko, J. & Molloy, R. (2014). “Regulation and Housing Supply.” In Gilles, D., Henderson, J.V., & Strange, W. (eds). Hand-book of Regional and Urban Economics, Vol 5B. Amsterdam: Elsevier: pp. 1289-1338.
Gyourko, J. & Saiz, A. (2006). “Construction Costs and the Supply of Housing Structure.” Journal of Regional Science 46(4): 661-680.
Hilber, C. & Vermeulen, W. (2016). “The Impact of Supply Constraints on House Prices in England.” The Economic Journal 126(591): 358-405.
Hsieh, C.-T. & Moretti, E. (2018). “Housing Constraints and Spatial Misallocation.” NBER Working Paper W21154.
Legislative Analyst Office. (2016). “The 2016-2017 Budget: Considering changes to streamline local housing approvals.” Retrieved from: https://lao.ca.gov/reports/2016/3470/Streamline-Local-Housing-Approvals.pdf.
Mawhorter, S. (2019). “Housing Policies in California Cities: Seeking Local Solutions to a Statewide Shortfall.” University of California at Berkeley, Terner Center for Housing Innovation working paper.
Mills, E. (1967). “An Aggregative Model of Resource Allocation in a Metropolitan Area.” American Economic Review 57(2): 197-210.
References
Terner Center Land Use Working Paper Series • 2019
20
Muth, R. (1969). Cities and Housing. Chicago: University of Chicago Press.
Pollakowski, H., Ritchay, D., & Weinrobe, Z. (2005). “Effects of Mixed-Income, Multifamily Rental Housing Developments on Single-Family Housing Values.” MIT Center for Real Estate working paper.
Quigley, J. & Raphael, S. (2004). “Is Housing Unaffordable? Why Isn’t It More Affordable?” Journal of Economic Perspectives 18(1): 191-214.
Romem, I. (2018). “America’s New Metropolitan Landscape: Pockets of Dense Construction in a Dormant Suburban Inte-rior.” BuildZoom blog. Retrieved from: https://www.buildzoom.com/blog/pockets-of-dense-construction-in-a-dor-mant-suburban-interior.
Rothstein, R. (2017). The Color of Law. New York: Liveright Publishing Corporation.
Schuetz, J. (2008). “Guarding the Town Walls: Mechanisms and motives for restricting multifamily housing in Massachu-setts.” Real Estate Economics 36(3): 555-586.
Schuetz, J. (2009). “No Renters in My Suburban Backyard: Land use regulation and rental housing.” Journal of Policy Anal-ysis and Management 28(2): 296-320.
Wheaton, W. (1978). “Urban Spatial Development with Durable but Replaceable Capital.” Journal of Urban Economics 3.
Yglesias, M. (2018). “Gavin Newsom promised to fix California’s housing crisis. Here’s a bill that would do that.” Vox.
AcknowledgementsThanks to the Terner Center for Housing Innovation at the University of California at Berkeley for data, technical advice, and financial support.