IRTP-D Self-Assessment Report (Final) - ICANN
47
IRTP Part “D” Working Group Self-Assessment January 2015
Transcript of IRTP-D Self-Assessment Report (Final) - ICANN

IRTP Part “D” Working Group Self-Assessment
January 2015

IRTP-D Self-Assessment-2015
Administrator’s Report
Table of Contents
1. REPORT OVERVIEW ........................................................................................................ 3
2. SELF-ASSESSMENT BACKGROUND .................................................................................. 4
3. SELF-ASSESSMENT RESULTS: IRTP PART “D” ................................................................... 5
A) SURVEY POPULATION, RESPONSE RATE, AND QUESTIONNAIRE LENGTH .............................................. 5 B) PERSONAL IDENTIFICATION ......................................................................................................... 6 C) SURVEY LOGISTICS .................................................................................................................... 8
4. EFFECTIVENESS EVALUATIONS BY SECTION ................................................................... 10
A) HOW THE RESULTS ARE PRESENTED ........................................................................................... 10 B) KEY RESULTS SUMMARY BY QUESTION/COMPONENT .................................................................... 12
5. EFFECTIVENESS EXTENSIONS AND EXTRAPOLATIONS .................................................... 13
A) EFFECTIVENESS OF THE WORKING GROUP OVERALL ...................................................................... 13 B) EFFECTIVENESS BY MAJOR SECTION ........................................................................................... 14
6. DEMOGRAPHICS VARIABLES AND CORRELATIONS ........................................................ 16
A) EXPERIENCE: “YEARS ACTIVE INVOLVEMENT WITH ICANN” ........................................................... 16 B) INTENSITY: “HOURS PER WEEK SPENT ON ICANN ACTIVITIES” ....................................................... 17 C) RECRUITMENT SOURCES: “HOW DID YOU FIRST LEARN ABOUT THIS WG?” ........................................ 17 D) CORRELATIONS ...................................................................................................................... 18
7. ADMINISTRATOR’S OBSERVATIONS AND RECOMMENDATIONS .................................... 19
A) PARTICIPATION RATES ............................................................................................................. 19 B) RATING SCALE ....................................................................................................................... 19 C) ONLINE SURVEY TOOL ............................................................................................................. 20 D) SELF-ASSESSMENT’S FUTURE .................................................................................................... 20
APPENDIX 1: COMPLETE WG SELF-ASSESSMENT SCREENSHOTS ............................................ 21
APPENDIX 2: INVITATION E-MAILS ....................................................................................... 29
Exhibit 1: Raw Data Tables/Charts (14 pages) Exhibit 2: Data Extrapolations (2 pages)
[2]

IRTP-D Self-Assessment-2015
Administrator’s Report
1. Report Overview This report, including its appendices and exhibits, was prepared by the ICANN Survey Administrator1 and is intended to be an exhaustive presentation of the Self-Assessment conducted for the IRTP Part “D” Working Group. As a result, it is necessarily long and, in certain sections, contains statistical information that may be of varying interest to some readers. The following table is intended to provide additional explanation about each Chapter, Appendix, and Exhibit so that readers may find information quickly that interests them:
Chapter Description of Contents 2 Background information covering the Self-Assessment origin, objectives, and structural
design elements. 3 Results for the IRTP-D PDP WG including population, response rate, questionnaire length,
and logistics (e.g., invitations, methodology, survey period). 4 Introduces the raw data tables/charts (Exhibit 1), explains how the results are presented,
and provides an effectiveness ranking of the 15 survey questions. 5 Explains how a series of data extrapolations were obtained from the raw data including
effectiveness ratings for the overall WG and each of the four major sections (Exhibit 2). 6 Provides summary data concerning the demographics variables utilized in the survey and
briefly discusses correlations to the 15 questions and to each other. 7 Administrator’s observations about the survey experience.
Appendix 1 Screenshots of the entire Self-Assessment (7 pages) for those who may not be familiar with the instructions, design, mechanics, and specific questions asked.
Appendix 2 E-mail invitation and reminders sent to WG members. Exhibit 1 Primary raw data (14 pages) showing each a tabulation of effectiveness ratings, charts,
and individual comments submitted for each Section. Exhibit 2 Extrapolations of the raw data (2 pages) that summarize ratings for the Working Group
and each of the 4 major Sections. Disclaimer: This report does not purport to interpret the meaning of the survey results, which is left to the ICANN Chartering Organization based upon the raw data presented herein.
1 External Consultant under contract to the ICANN Policy Department.
[3]

IRTP-D Self-Assessment-2015
Administrator’s Report
2. Self-Assessment Background This chapter briefly discusses the origins of the Working Group (WG) Self-Assessment as well as its structural design. In the spring of 2013, the Standing Committee on Improvements Implementation (SCI) began to consider a survey to explore the effectiveness of the Working Group Guidelines. Staff suggested an alternative approach that would combine the idea of the survey with the concept of a “WG Self-Assessment” which had been identified within the original framework, but was never instantiated. The SCI accepted this recommendation and, circa June-July, development began on a new instrument structured into three core components of a dynamic system containing: Inputs → Processes → Outputs. The major sections of the questionnaire appear below:
• Participant Identification …includes name, email address, organization, and WG role. • Section 1-Inputs ...evaluates effectiveness of the charter/mission, team members, tools, and
resources. • Section 2-Processes ...evaluates effectiveness of WG norms, operations, logistics, and decision-
making. • Section 3-Products and Outputs …evaluates effectiveness in achieving the mission as well as
quality of the deliverables. • Section 4-Personal Dimensions …assesses the member’s personal Engagement, Fulfillment, and
Willingness-to-Serve in the future. • Demographics …inquires how the member learned about the WG, years of involvement with
ICANN, and average hours/week spent on ICANN activities. For Sections 1-4, detailed questions were developed to more narrowly evaluate each one (15 in total excluding free-form comment fields). To view the survey, including the introduction, instructions, and individual questions by section, please see Appendix 1 in which screenshots are presented in the original sequence. After its initial development, the questionnaire was tested with members of the “Thick Whois” Working Group. Those results were published and are available at this link: https://community.icann.org/x/_ZMQAw
[4]

IRTP-D Self-Assessment-2015
Administrator’s Report
3. Self-Assessment Results: IRTP Part “D” This chapter addresses the member population, response rates, questionnaire length, identification data, and certain logistics including email invitations, methodology, and survey period. A) Survey Population, Response Rate, and Questionnaire Length The IRTP-D Working Group’s roster contained 21 members according to the Membership Wiki page which was confirmed with ICANN Staff. There were a total of eleven (11) completed responses registered in QuestionPro for an overall response rate of 52%. Survey Length: Based upon prior testing, the average length of time to complete the survey was estimated to be less than 30 minutes and that information was communicated in the welcome message. The median length of time to complete the entire questionnaire, as computed by QuestionPro from the 11 actual respondents, was 8.1 minutes. Three individuals spent less than 3 minutes answering the questionnaire and the highest amount of time devoted exceeded 52 minutes2. Figure 4 shows the percent distribution of time (adjusted data) spent by the 11 respondents within 10 minute increments. While a majority of participants (73% or 8) completed the survey in less than 10 minutes, 18% took between 10-20 minutes. As noted above, only one individual required more than 20 minutes.
2 Administrator’s Note: No other result was close to that amount of time; therefore, it was determined to be an “outlier” and manually adjusted to 21 minutes for the purposes of this analysis. The assumption being made is that the individual may have been multi-tasking or otherwise distracted, which contributed to the extra time being clocked.
[5]

IRTP-D Self-Assessment-2015
Administrator’s Report
Interestingly, and as might be expected, there is a positive relationship between the time (in minutes) consumed for the survey and the number of explanatory comments submitted (see Figure 5). Of the 6 respondents who spent 8 minutes or less on the Self-Assessment, no written comments were entered. Those who provided additional written input recorded slightly longer periods of time working with the survey instrument. The person who consumed more than 20 minutes offered a text comment in 4 out of 5 sections, which may have contributed, at least in part, to the additional time devoted. Overall, there were 5 places within the questionnaire where individuals could enter written comments. With 11 participants, there were 55 total comment opportunities; however, only 14 actual comments were submitted (25%), which helps to explain why the IRTP-D’s median amount of time to complete the questionnaire was considerably lower than expected based on original instrument testing3. B) Personal Identification The SCI considered the option of having a completely anonymous survey; however, in the absence of any identifying data, it would be difficult to differentiate and eliminate a specious response from one that was genuine, but provided a wholesale negative (or positive) assessment. After weighing the pros and cons, in order to ensure survey input integrity, the decision was made to collect (as required fields) the following minimal personal information:
• Name and Email Address • Organization (Drop-Down List) • Working Group Role
3 Administrator’s Note: For future Self-Assessments, the introductory welcome note should be amended to indicate that, based upon experience with other Working Groups, the questionnaire should take between 10-20 minutes depending upon the amount of written feedback provided.
[6]

IRTP-D Self-Assessment-2015
Administrator’s Report
Recognizing that some prospective respondents may be concerned about divulging their names and contact information, the following statement concerning privacy was placed prominently in the survey introduction (see Appendix 1):
Confidentiality: We will be asking you for identifying information to ensure that each response is valid. Your individual responses will not be accessible by anyone other than the ICANN Survey Administrator (external contractor) and they will not be disclosed or published in a way that could be matched to your identity.
IRTP-D Organizational Affiliations4 One of the three personal identification questions asked respondents to select the Primary Organizational Affiliation from a drop-down list. Of the 11 completed surveys, Table 1a below shows the actual responses for each organization listed (sorted high to low by number of completed responses): Table 1a
Primary Organizational Affiliation Count PctRegistrar Stakeholder Group (GNSO) 5 45%Business Constituency (GNSO) 2 18%Intellectual Property Constituency (GNSO) 1 9%Non-Commercial Users Constituency (GNSO) 1 9%Registry Stakeholder Group (GNSO) 1 9%Other 1 9%Internet Services Provider Constituency (GNSO) 0 0%Not-for-Profit Operational Concerns Constituency (GNSO) 0 0%Non-Commercial Stakeholder Group (NCSG) 0 0%At-Large Advisory Committee (ALAC) 0 0%Other ICANN SO/AC 0 0%Representing Self 0 0%Total Population......................... 11 100%
Identification Data: Organizational Affiliation
Each respondent was also asked to identify his/her role within the Working Group. Table 1b shows that 9 out of 11 participants (82%) were “Contributing Members” plus one functioning in a leadership position and one observer.
4 Administrator’s Note: As a result of having so few questionnaires completed at the organizational level, there will be no cross-tabulations reported for this Self-Assessment.
[7]

IRTP-D Self-Assessment-2015
Administrator’s Report
Table 1b
Working Group Role Count PctLeader (Chair, Co-Chair, Vice-Chair, Other Officer) 1 9%Contributing Member 9 82%Background Contributor 0 0%Liaison 0 0%Observer 1 9%Advisor/Consultant 0 0%Support (e.g., secretary, technical, administrative) 0 0%Other 0 0%Total 11 100%
Identification Data: Working Group Role
C) Survey Logistics Invitations: An initial email invitation was forwarded to the IRTP-D WG Members by Staff (on behalf of James Bladel-Chair) on 15 November 2014 and two follow-up reminders were sent on 15 December 2014 and 5 January 2015 (see Appendix 2 for email contents). Methodology: An online survey was developed using QuestionPro (http://www.questionpro.com). Most of the substantive questions were framed as shown in Figure 1 below: Figure 1.
[8]

IRTP-D Self-Assessment-2015
Administrator’s Report
Respondents were asked to rate their assessments of the Working Group’s effectiveness (Scale 1-Highly Ineffective to 7-Highly Effective) for each element within three sections: Inputs, Processes, and Products/Outputs. These components were defined briefly so that participants would know what specific characteristics were to be evaluated. A scale was presented to the right of each service element with radio buttons, which could be turned on/off with a mouse click. Other than a few required identification and demographic questions, respondents were able to SKIP (N/A) any question. A free-form Comment section followed each major section in which respondents were encouraged to provide “supplementary explanations or other supporting information that will help the Chartering Organization understand and interpret your input.” Survey Period: The Self-Assessment was announced on 15 November 2014 and responses were completed as shown in the following table:
Week Dates Respondents Percent 1-2 16 Nov – 30 Nov 1 9% 3-4 1 Dec – 16 Dec (1) 6 55% 5 17 Dec – 23 Dec (2) 0 0%
6-7 24 Dec – 4 Jan (Holidays) 0 0% 8 5 Jan – 9 Jan (3) 4 36%
Totals….. 11 100%
(1) First official close date (2) Extended close date (3) Third and final close date
As is frequently mentioned in the survey literature, a disproportionate percentage of responses usually occurs in the first week or two of the period; however, in this case, only one response (9%) was received during first two weeks. The highest response rate occurred in weeks 3-4 (55%) and an additional four WG members (36%) participated after a final reminder was sent on 5 January 2015.
[9]

IRTP-D Self-Assessment-2015
Administrator’s Report
4. Effectiveness Evaluations by Section As explained in Chapter 2, the Self-Assessment comprised 15 individual questions organized into 4 major sections. This Chapter discusses the results of those 15 questions; whereas, Chapter 5 contains analytical extensions and extrapolations for each major section as well as overall. Chapter 6 discusses the outcomes of the segmentation/demographics information. A) How the Results Are Presented Exhibit 1 contains the raw data results for each of the 15 individual questions organized by Section (1-Inputs, 2-Processes, 3-Products/Outputs, 4-Personal Dimensions). To understand how the data is reported, see the following example below (Table 2) extracted from Section 1-Inputs. The third question in that section dealt with “C) Representativeness.” Table 2.
1-Highly Ineffective 0 0%2 0 0%3 1 9%4 1 9%5 1 9%6 4 36%7-Highly Effective 4 36%SKIP 0 0%
Total 11 100%
Mean 5.82Median 6.00Mode 6.00Std Deviation 1.33
Low High95% Confidence Interval (Mean) 4.5 7.1
C) Representativeness...where 1=Highly Ineffective means narrow, skewed, selective, unbalanced; and 7=Highly Effective means broad, diverse, balanced
0%
0%
9%
9%
9%
36%
36%
0%
0% 10% 20% 30% 40%
1-Highly Ineffective
2
3
4
5
6
7-Highly Effective
SKIP
C) Representativeness
In the data table, each of the ratings (1-Highly Ineffective to 7-Highly Effective) is shown in the leftmost column and the raw counts and relative percentages are contained in columns 2 and 3, respectively. Under each distribution of ratings, the Mean (statistical average), Median (middle observation), and Mode5 (most popular) are presented along with Low and High values constituting a 95% statistical
5 Administrator’s Note: In the event that a mode was shared between two equal values, the lower one was selected because it will always be closer to the mean and median.
[10]

IRTP-D Self-Assessment-2015
Administrator’s Report
confidence interval within which the true population mean can be inferred to occur (assuming a normal distribution). For the Mean row, if the value is greater than 4.00 (scale mid-point), the cell is highlighted green; if it is exactly equal to 4.00, it is colored yellow; and if it is lower than 4.00, it is highlighted pink6. This display convention was followed throughout the reporting to make it easier to spot areas of potential strength or weakness. To the right of the data table, there is a chart showing the ratings distribution by percentage. For this particular question, it can be seen visually that, although there was some dispersion in the ratings, most respondents (72%) were favorable concerning the Representativeness of the WG, thus contributing to a Mean of 5.82 and Median/Mode of 6.00. Immediately following each section’s data tables and charts, the individual comments are presented verbatim (i.e., unedited) in the following format (Table 3). It should be noted that comments were only solicited for each major section - not each individual question. The arrangement of the comments is essentially random; that is, there is no inherent logic to the order of the comments in any section. This was done to fulfill the promise of protecting individual identities from being matched to particular answers. The comments are numbered simply to facilitate reference. Table 3.
No. Comments:
1
The charter was clear however the implementation of the policy remains user un-friendly. The charter did not address that. We lacked security expertise, in particular with the 'prevent the hacker' discussion. We're not representing the registrants, we're mostly representing the registrars. I tried my best to speak for the registrants, with limited effect (measurements recommendation). Rest was ok, though there should be support for Linux.
2Help in coordination & logistics by staff were great, access to statistics were less so--not sure if stats were not kept or were kept from WG
3 A lot of good points have been made from different viewpoints (registrars, resgitries, 2ndary market etc) - a good 'team' has built up over the 4 IRTP working groups
Section 1-Inputs
At the end of the survey, one final question was asked whether the respondent wished to provide any additional comments. Those submissions are presented on the last page of Exhibit 1, labeled “Section 6-Overall Feedback.”
6 Administrator’s Note: It turned out that, in this Self-Assessment, no mean value scored below 4.00; therefore, all means are highlighted green.
[11]
IRTP-D Self-Assessment-2015
Administrator’s Report
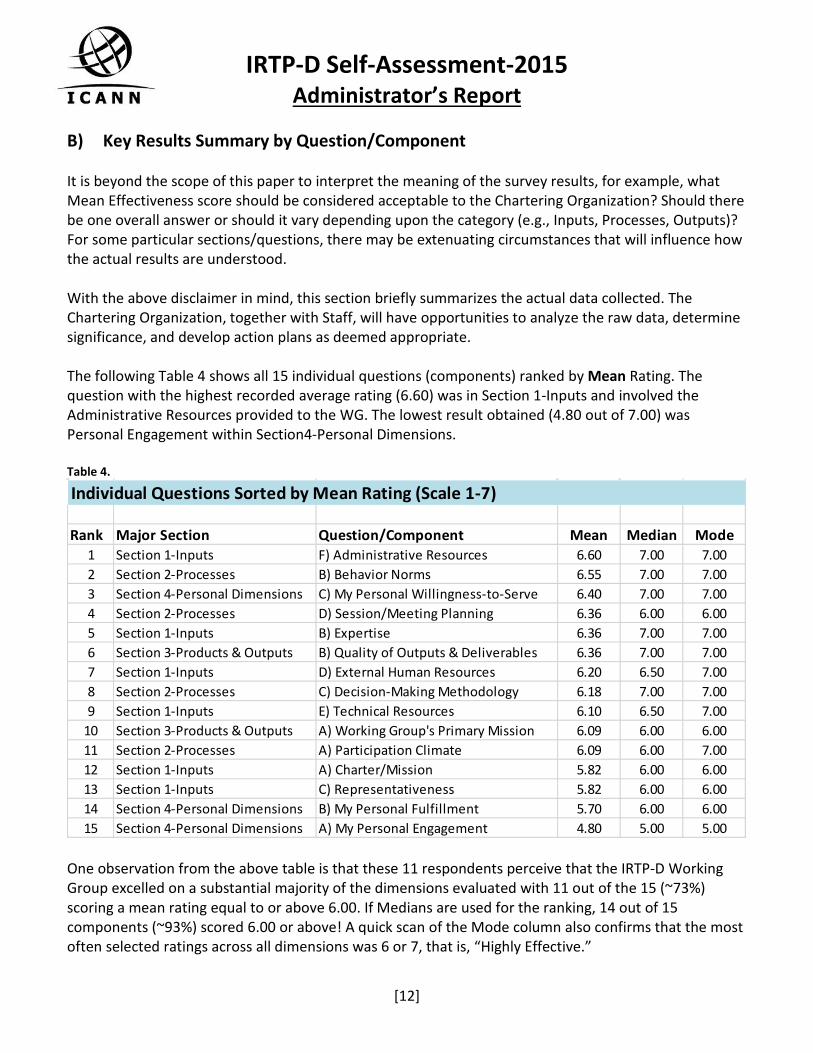
B) Key Results Summary by Question/Component It is beyond the scope of this paper to interpret the meaning of the survey results, for example, what Mean Effectiveness score should be considered acceptable to the Chartering Organization? Should there be one overall answer or should it vary depending upon the category (e.g., Inputs, Processes, Outputs)? For some particular sections/questions, there may be extenuating circumstances that will influence how the actual results are understood. With the above disclaimer in mind, this section briefly summarizes the actual data collected. The Chartering Organization, together with Staff, will have opportunities to analyze the raw data, determine significance, and develop action plans as deemed appropriate. The following Table 4 shows all 15 individual questions (components) ranked by Mean Rating. The question with the highest recorded average rating (6.60) was in Section 1-Inputs and involved the Administrative Resources provided to the WG. The lowest result obtained (4.80 out of 7.00) was Personal Engagement within Section4-Personal Dimensions. Table 4.
Rank Major Section Question/Component Mean Median Mode1 Section 1-Inputs F) Administrative Resources 6.60 7.00 7.002 Section 2-Processes B) Behavior Norms 6.55 7.00 7.003 Section 4-Personal Dimensions C) My Personal Willingness-to-Serve 6.40 7.00 7.004 Section 2-Processes D) Session/Meeting Planning 6.36 6.00 6.005 Section 1-Inputs B) Expertise 6.36 7.00 7.006 Section 3-Products & Outputs B) Quality of Outputs & Deliverables 6.36 7.00 7.007 Section 1-Inputs D) External Human Resources 6.20 6.50 7.008 Section 2-Processes C) Decision-Making Methodology 6.18 7.00 7.009 Section 1-Inputs E) Technical Resources 6.10 6.50 7.00
10 Section 3-Products & Outputs A) Working Group's Primary Mission 6.09 6.00 6.0011 Section 2-Processes A) Participation Climate 6.09 6.00 7.0012 Section 1-Inputs A) Charter/Mission 5.82 6.00 6.0013 Section 1-Inputs C) Representativeness 5.82 6.00 6.0014 Section 4-Personal Dimensions B) My Personal Fulfillment 5.70 6.00 6.0015 Section 4-Personal Dimensions A) My Personal Engagement 4.80 5.00 5.00
Individual Questions Sorted by Mean Rating (Scale 1-7)
One observation from the above table is that these 11 respondents perceive that the IRTP-D Working Group excelled on a substantial majority of the dimensions evaluated with 11 out of the 15 (~73%) scoring a mean rating equal to or above 6.00. If Medians are used for the ranking, 14 out of 15 components (~93%) scored 6.00 or above! A quick scan of the Mode column also confirms that the most often selected ratings across all dimensions was 6 or 7, that is, “Highly Effective.”
[12]
IRTP-D Self-Assessment-2015
Administrator’s Report
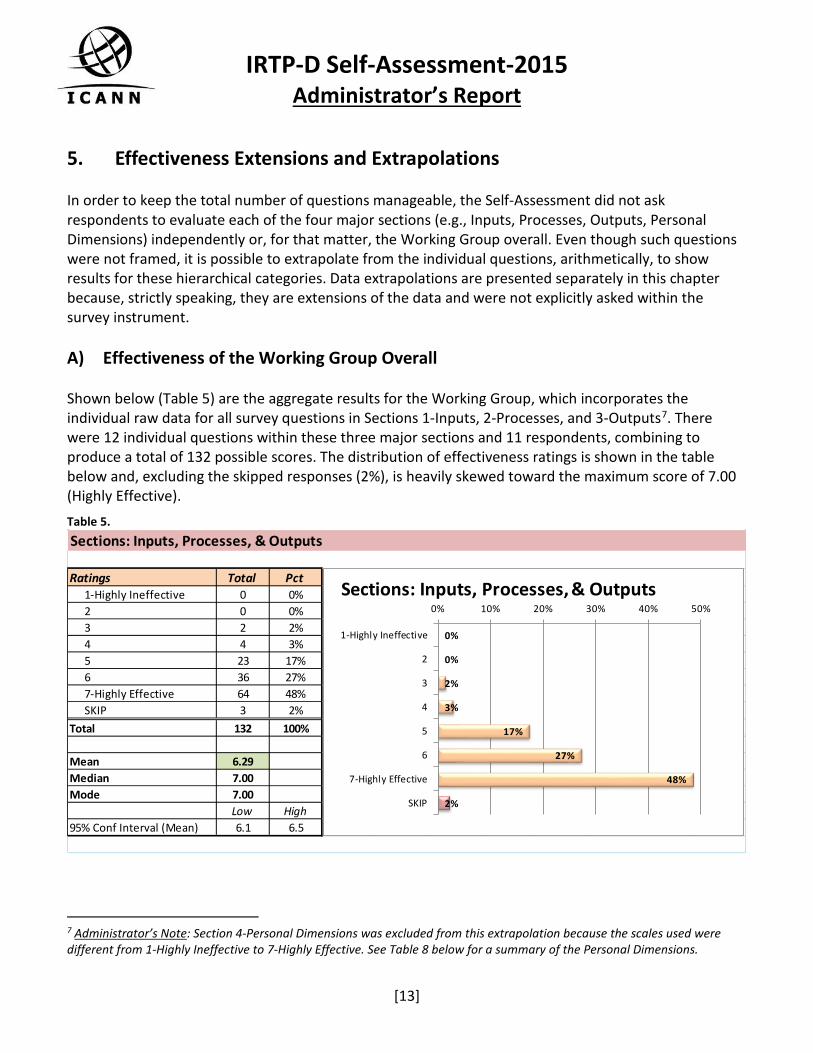
5. Effectiveness Extensions and Extrapolations In order to keep the total number of questions manageable, the Self-Assessment did not ask respondents to evaluate each of the four major sections (e.g., Inputs, Processes, Outputs, Personal Dimensions) independently or, for that matter, the Working Group overall. Even though such questions were not framed, it is possible to extrapolate from the individual questions, arithmetically, to show results for these hierarchical categories. Data extrapolations are presented separately in this chapter because, strictly speaking, they are extensions of the data and were not explicitly asked within the survey instrument. A) Effectiveness of the Working Group Overall Shown below (Table 5) are the aggregate results for the Working Group, which incorporates the individual raw data for all survey questions in Sections 1-Inputs, 2-Processes, and 3-Outputs7. There were 12 individual questions within these three major sections and 11 respondents, combining to produce a total of 132 possible scores. The distribution of effectiveness ratings is shown in the table below and, excluding the skipped responses (2%), is heavily skewed toward the maximum score of 7.00 (Highly Effective). Table 5.
Ratings Total Pct1-Highly Ineffective 0 0%2 0 0%3 2 2%4 4 3%5 23 17%6 36 27%7-Highly Effective 64 48%SKIP 3 2%
Total 132 100%
Mean 6.29Median 7.00Mode 7.00
Low High95% Conf Interval (Mean) 6.1 6.5
Sections: Inputs, Processes, & Outputs
0%
0%
2%
3%
17%
27%
48%
2%
0% 10% 20% 30% 40% 50%
1-Highly Ineffective
2
3
4
5
6
7-Highly Effective
SKIP
Sections: Inputs, Processes, & Outputs
7 Administrator’s Note: Section 4-Personal Dimensions was excluded from this extrapolation because the scales used were different from 1-Highly Ineffective to 7-Highly Effective. See Table 8 below for a summary of the Personal Dimensions.
[13]

IRTP-D Self-Assessment-2015
Administrator’s Report
While it may not be statistically accurate to conclude that the respondent pool would have rated the WG’s overall effectiveness in the 6-7 range had that question been asked specifically, it is not unreasonable to note that this grouping of participants (52% of the total) evaluated some questions low, other questions in the middle, and many questions high. Analyzing those ratings across the spectrum of components suggests that, on balance, the respondents perceived the WG’s effectiveness as very near the maximum of the evaluation scale. B) Effectiveness by Major Section Exhibit 2 provides a data table and chart for each of the four major sections of the survey. Again, strictly speaking, questions were not asked about these aggregate categories; however, if the questions are representative of the section, the extrapolated statistics in Table 6 (sorted high to low based on the Means) represent reasonable inferences from the raw data. Table 6.
Rank Major Section Mean Median Mode1 Section 2-Processes 6.44 7.00 7.002 Section 3-Products & Outputs 6.31 6.50 7.003 Section 1-Inputs 6.19 7.00 7.004 Section 4-Personal Dimensions 5.83 6.00 7.00
Major Sections Sorted by Mean Effectiveness
The highest effectiveness result was obtained for Section 2-Processes (see Table 7 below) with a Mean of 6.44, a Median of 7.00, and a Mode of 7.00. Table 7.
Ratings Total Pct1-Highly Ineffective 0 0%2 0 0%3 0 0%4 0 0%5 10 23%6 11 25%7-Highly Effective 23 52%SKIP 0 0%
Total 44 100%
Mean 6.44Median 7.00Mode 7.00
Low High95% Conf Interval (Mean) 6.2 6.7
Section 2-Processes
0%
0%
0%
0%
23%
25%
52%
0%
0% 10% 20% 30% 40% 50% 60%
1-Highly Ineffective
2
3
4
5
6
7-Highly Effective
SKIP
Section 2-Processes
[14]
IRTP-D Self-Assessment-2015
Administrator’s Report
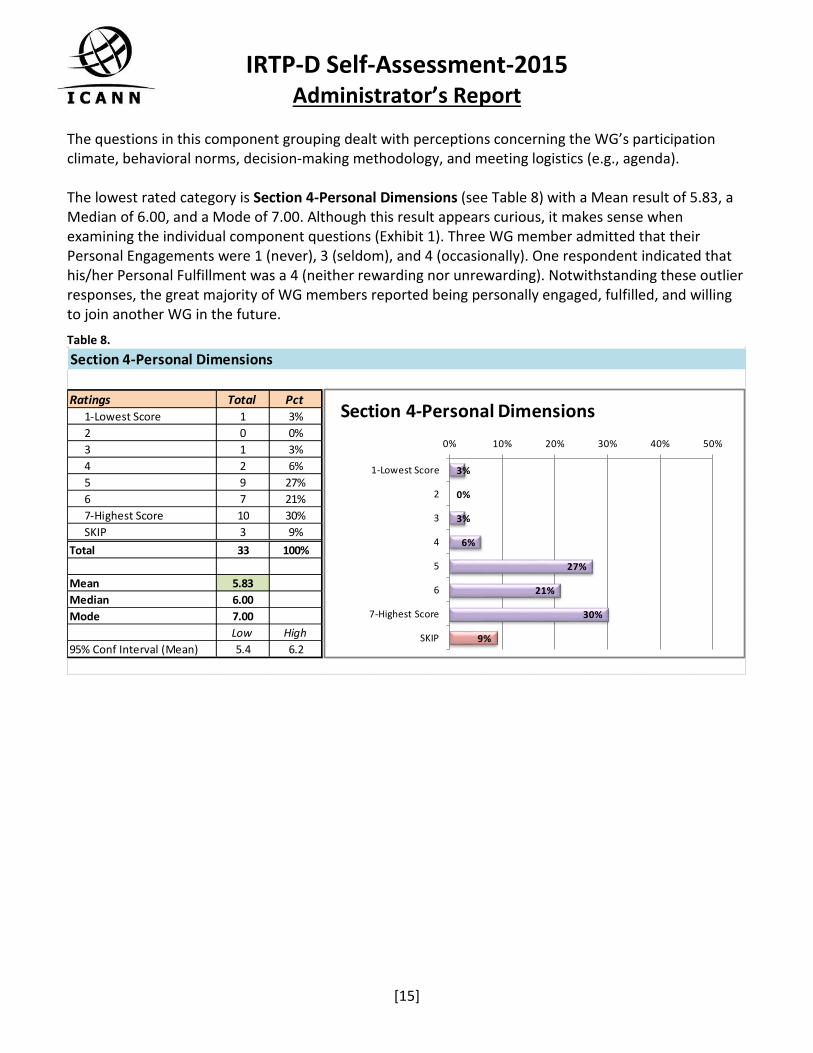
The questions in this component grouping dealt with perceptions concerning the WG’s participation climate, behavioral norms, decision-making methodology, and meeting logistics (e.g., agenda). The lowest rated category is Section 4-Personal Dimensions (see Table 8) with a Mean result of 5.83, a Median of 6.00, and a Mode of 7.00. Although this result appears curious, it makes sense when examining the individual component questions (Exhibit 1). Three WG member admitted that their Personal Engagements were 1 (never), 3 (seldom), and 4 (occasionally). One respondent indicated that his/her Personal Fulfillment was a 4 (neither rewarding nor unrewarding). Notwithstanding these outlier responses, the great majority of WG members reported being personally engaged, fulfilled, and willing to join another WG in the future. Table 8.
Ratings Total Pct1-Lowest Score 1 3%2 0 0%3 1 3%4 2 6%5 9 27%6 7 21%7-Highest Score 10 30%SKIP 3 9%
Total 33 100%
Mean 5.83Median 6.00Mode 7.00
Low High95% Conf Interval (Mean) 5.4 6.2
Section 4-Personal Dimensions
3%
0%
3%
6%
27%
21%
30%
9%
0% 10% 20% 30% 40% 50%
1-Lowest Score
2
3
4
5
6
7-Highest Score
SKIP
Section 4-Personal Dimensions
[15]

IRTP-D Self-Assessment-2015
Administrator’s Report
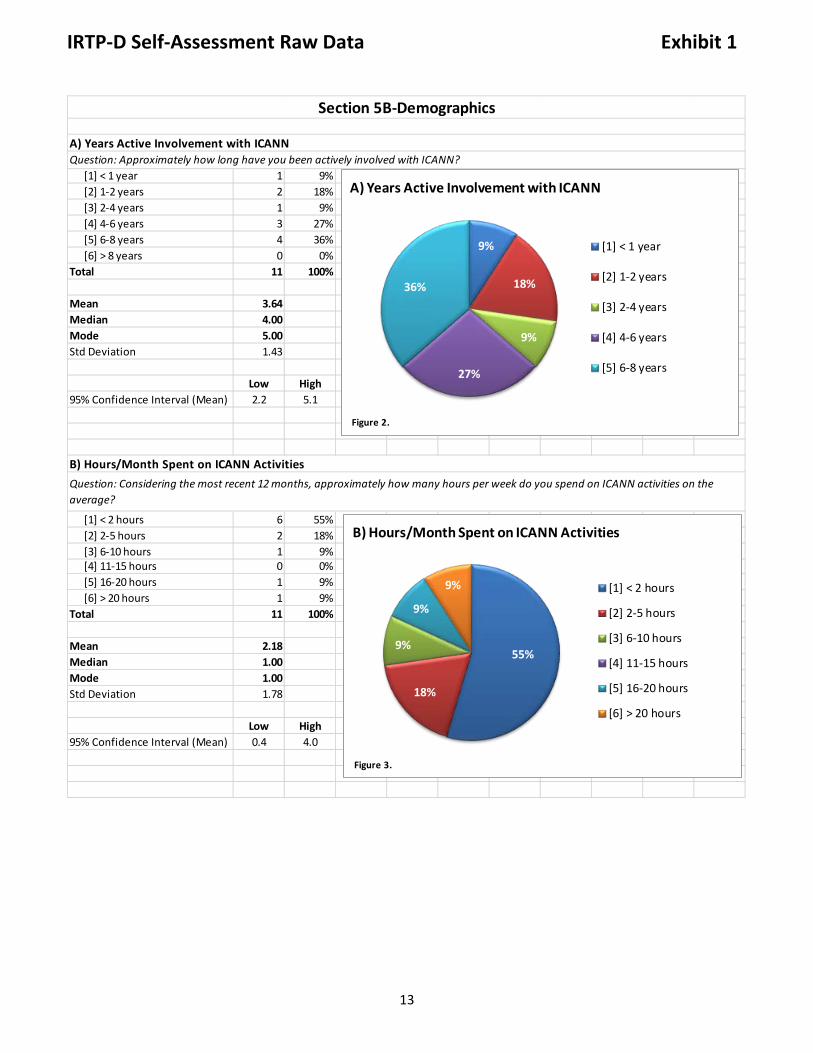
6. Demographics Variables and Correlations Staff proposed that certain demographic data be collected based upon the hypothesis that viewpoints and perceptions could vary significantly based upon one or more of these variables. Incorporating segmentation into the survey design was intended to permit the individual results to be (a) stratified according to engagement variables and, optionally, (b) assigned differential weights based upon engagement experience and/or intensity. As is commonly recommended by design experts, this information was placed at the end of the instrument and was marked “required” in order to complete the questionnaire properly. The specific questions can be viewed on the last page of Appendix 1. A) Experience: “Years Active Involvement with ICANN” Respondents were asked to select one of 6 options8 corresponding to how many years they have spent working with ICANN. The range was expressed as: Scale 1 2 3 4 5 6 Years < 1 1-2 2-4 4-6 6-8 > 8 On average, the 11 respondents fell into category 3 or 2-4 years involvement with ICANN although this sample was well dispersed among the groupings (see Figure 2). Cumulatively, 7 out of 11 (63.6%) of the respondents indicated that they have been actively involved with ICANN for four or more years. One individual in this sample self-identified as having less than 1 year of active involvement with ICANN.
8 Administrator’s Note: There were no responses in the above 8 years category, therefore, that grouping was removed from the chart and analysis.
[16]

IRTP-D Self-Assessment-2015
Administrator’s Report
B) Intensity: “Hours per Week Spent on ICANN Activities” Respondents were asked to select one of 6 options corresponding to the average number of hours per week spent on ICANN activities. The scale for these responses is presented below: Scale 1 2 3 4 5 6 Hours/Week < 2 2-5 6-10 11-15 16-20 > 20 As shown in the accompanying Figure 3, the most popular answer, chosen by 6 participants (55%), and also the median value, was 1 or less than 2 hours/week. Combining the lowest two groupings shows that 73% spend less than or equal to 5 hours/week on ICANN activities. Two WG members (18%) indicated that they devote more than 15 hours/week to ICANN activities. C) Recruitment Sources: “How did you first learn about this WG?” WG members were asked to identify how they came to be involved with this Working Group. Although not technically demographic, this question was asked in this section to help understand the most common methods by which members were informed about the WG. The following Table 9 shows a breakdown of the most popular answers among the 11 respondents:
[17]

IRTP-D Self-Assessment-2015
Administrator’s Report
Table 9.
Count PctI was informed or invited by my SG/C or ICANN-affiliated organization 5 36%I was contacted by an ICANN Staff member 2 14%I was contacted by an individual seeking to recruit volunteers 1 7%I learned about the WG through one of ICANN's websites (or Wikis) 2 14%I learned about the WG from another organization external to ICANN 0 0%A professional colleague or associate informed me about the WG 2 14%Other (Please describe) 2 14%Total 14 100%
How did you first learn about this WG (Select any/all that apply)?
Note that the total of 14 exceeds the number of respondents (11) because this question allowed multiple choices to be selected. Those two individuals who selected “Other” indicated that they had been on previous IRTP Working Groups and learned about “Part D” from their prior associations. D) Correlations One hypothesis held during survey design was that there might be useful relationships between the demographic variables9 and certain individual questions, for example, would those who spend relatively more hours on ICANN activities hold a different perceptions concerning WG effectiveness than those who work fewer hours. To test this hypothesis, correlation coefficients were calculated for each of the two demographic variables plus Working Group Role and all 15 questions. In general, no significant correlations were obtained; therefore, for brevity’s sake and due to the small sample size, those data have been omitted from this report10.
9 Administrator’s Note: From a survey design perspective, demographic variables were selected in such a way that they are independent of each other; otherwise, they would tend to measure the same underlying phenomenon. 10 Administrator’s Note: For anyone interested, these correlation tables are available upon request.
[18]

IRTP-D Self-Assessment-2015
Administrator’s Report
7. Administrator’s Observations and Recommendations This chapter contains a few observations and recommendations concerning the Working Group Self-Assessment. A) Participation Rates The level of participation in this survey (52%) was significantly higher than initially experienced in the original test group (25% “Thick Whois” Sep 2013). This healthy result can be attributed, in part, to having extended the close date twice each with a gentle reminder being sent to WG members. Information concerning the survey period, extensions, and effects of the reminders is presented in Chapter 3-C. In this particular case, the Survey Administrator recommended to Staff that the target minimum for this particular population be set at 8 responses or approximately one-third of the member roster. After the second deadline expired, there were still only 7 completed questionnaires at which time it was decided to extend one additional time (after the 2014 holidays) at which point 4 additional responses were received for a grand total of 11. Given this Administrator’s experience with many different ICANN surveys over 6 years, there should always be an expectation of extending the deadline at least once and, most likely, multiple times in order to ensure that the sample is adequately representative of the population. B) Rating Scale The rating construct employed for this survey was a 7-point behaviorally anchored Likert scale from 1-Highly Ineffective to 7-Highly Effective. This particular scale was chosen for its simplicity and because SCI members and Staff believed that individuals would not be unduly “stretched” in considering a slightly wider set of values than is available in a typical 5-point scale. One disadvantage to a 5-point scale is that, by providing fewer choices, the results tend to aggregate around the central point or 3, which makes it more difficult to differentiate among responses using statistics. If some percentage of a survey population reinterprets the scale as being similar to giving a grade (e.g., A - F) and is unwilling to utilize the extreme values (1 or 5), then the scale immediately devolves to 3 points. For future WG Self-Assessments, the 7-point scale is recommended.
[19]

IRTP-D Self-Assessment-2015
Administrator’s Report
C) Online Survey Tool The online software tool used for this survey was provided by QuestionPro. This particular system was selected for several reasons:
• It has been used successfully on other ICANN surveys; • The cost to obtain a “Corporate Edition” license (including the most important key features
needed) is comparatively low; • The tool contains excellent help, instructions, data downloads, and other useful
features/functions; and • The company continues to make substantial investments in the software adding new features,
capabilities, and extensions. While QuestionPro served the needs of this Survey Administrator, it should be noted that all raw data was exported/downloaded into Excel for subsequent analysis, charting, and reporting. Although there are many online reports available within QuestionPro, this Administrator found it more efficient and productive to develop a detailed analysis using Microsoft Excel. In general, given the relatively low cost and plethora of features, QuestionPro was an excellent choice; however, depending upon any particular survey’s complexity and need for statistical analysis of the data, facility with Excel is recommended versus reliance on the standard reports. D) Self-Assessment’s Future As noted elsewhere in the report, the IRTP-D represents the first instance of a Self-Assessment being conducted since the original test (Thick Whois WG) was authorized under the auspices of the Standing Committee on Improvements Implementation (SCI) in 2013. Under most circumstances, a Chartering Organization will specify, within the WG’s formal Charter, if a Self-Assessment is to be conducted at the conclusion of deliberations. If this report and its evaluative process is deemed to have produced useful information, it is recommended that Chartering Organizations, such as the GNSO Council, continue requesting Self-Assessments in order to build up a repository of data concerning Working Group effectiveness. As patterns emerge about the successes and failures within the WG process, it may be appropriate to be more selective in requesting that Self-Assessments be completed.
[20]

IRTP-D Self-Assessment-2015
Administrator’s Report
Appendix 1: Complete WG Self-Assessment Screenshots There are 7 screenshots presented in this Appendix extracted from QuestionPro - the online survey tool selected for this project. Each screenshot corresponds to a page in the actual survey. These pages provide the exact sequence, specific language used, as well as the visual context in which the Self-Assessment was conducted. ICANN Survey Administrator
[21]

IRTP-D Self-Assessment-2015
Administrator’s Report
[22]

IRTP-D Self-Assessment-2015
Administrator’s Report
[23]

IRTP-D Self-Assessment-2015
Administrator’s Report
[24]

IRTP-D Self-Assessment-2015
Administrator’s Report
[25]

IRTP-D Self-Assessment-2015
Administrator’s Report
[26]

IRTP-D Self-Assessment-2015
Administrator’s Report
[27]

IRTP-D Self-Assessment-2015
Administrator’s Report
[28]

IRTP-D Self-Assessment-2015
Administrator’s Report
Appendix 2: Invitation E-Mails Three e-mails were sent to IRTP-D WG members, the first on 25 November 2014 and two successive reminders on 15 December 2014 and 5 January 2015. The contents of those messages are shown below: E-Mail Survey Invitation Forwarded by Staff on behalf of James Bladel (Chair) on 25 November 2014 From: Lars HOFFMANN <[email protected]> Date: Tuesday, 25 November 2014 18:36 To: "[email protected]" <[email protected]> Subject: [gnso-irtpd] Self-Assessment Dear all – I am writing on behalf of James, the Group’s Chair, and would like to ask you kindly to read carefully through the message below. Many thanks and best wishes, Lars http://irtp-d.questionpro.com Dear IRTP Part D Working Group Members, On 26 March 2014, the GNSO Council approved a process and questionnaire for Working Groups to conduct Self-Assessments when their work has been substantially finished. The goal is to provide Chartering Organizations, such as the GNSO Council, important information about how well its Working Groups are functioning through an examination of their Inputs -> Processes -> Outputs ultimately leading to continuing improvements. Our Working Group has been identified to participate in this process the details of which are provided below:
• The survey tool is hosted by QuestionPro at this link: http://irtp-d.questionpro.com. Please do not share this link with anyone other than our team members.
• Background information and instructions are contained within the instrument. There is no login requirement, so you will not need user credentials.
• Simply answer the questions (most use a 1-7 rating scale) on each page (7 total) and, when you reach the end, click “Record My Answers!” If you receive a “Thank You” response, your feedback was successfully populated. There is a provision to Save and Continue Later if you are interrupted and cannot finish the survey in one session.
• Based upon earlier testing with another WG, the survey should take between 15-30 minutes depending upon the number of comments you choose to provide.
• If you would like to browse the questions in advance, they are published on the ICANN Community Wiki at:https://community.icann.org/x/nTXxAg.
[29]

IRTP-D Self-Assessment-2015
Administrator’s Report
• The survey will be open for two weeks and will close on: Tuesday 16 December 2014 (23:59 UTC)
An external ICANN consultant, Ken Bour ([email protected]), will monitor the completion process, provide brief status updates to me and Lars Hoffman, and be available to provide technical assistance if needed by any of our team members. He will also be the only person who has access to your individual responses according to the following clause which you will see on the questionnaire welcome page: Confidentiality: We will be asking you for identifying information to ensure that each response is valid. Your individual responses will not be accessible by anyone other than the ICANN Staff Administrator and they will not be disclosed or published in a way that could be matched to your identity. Once the survey period has closed, Ken will produce a report summarizing the findings which will be shared with our team, the GNSO Council, the Stakeholder Groups and Constituencies, and other interested parties. I appreciate your willingness to provide feedback about the IRTP Part D Working Group and your participation in it. Regards, James Second E-Mail Survey Reminder Sent by Staff on 15 December 2014 Dear all, Only five members of the WG have participated (out of 21 total) in the self assessment (see below) and it would be great to get this number up. If you have not done so, please take 10min and answer the questions http://irtp-d.questionpro.com. Many thanks and best wishes, Lars PS: Please note that the deadline has been extended and so you will receive one more reminder on 22 December, unless you all fill in the assessment by then, of course.
[30]

IRTP-D Self-Assessment-2015
Administrator’s Report
Third E-Mail Survey Reminder Sent by Staff on 5 January 2015 From: [email protected] [mailto:[email protected]] On Behalf Of Lars Hoffmann Sent: Monday, January 05, 2015 4:45 PM To: [email protected] Subject: [gnso-irtpd] FINAL reminder Importance: High Dear all, Happy 2015 to you all! This is the final reminder to full in the IRTP self assessment survey. We only had 7 (seven) responses. For the outcome to be statistically solid we would need ideally 10 or more responses. A report on this survey will be published laste January and the finding made available to the GNSO Council and all GNSO Stakeholder Groups / Constituencies. If you have not already done so, please take a few minutes and make your voice heard. http://irtp-d.questionpro.com Many thanks and best wishes, Lars
[31]

IRTP-D Self-Assessment Raw Data Exhibit 1
1-Highly Ineffective 0 0%2 0 0%3 0 0%4 1 9%5 3 27%6 4 36%7-Highly Effective 3 27%SKIP 0 0%
Total 11 100%
Mean 5.82Median 6.00Mode 6.00Std Deviation 0.98
Low High95% Confidence Interval (Mean) 4.8 6.8
1-Highly Ineffective 0 0%2 0 0%3 1 9%4 0 0%5 0 0%6 3 27%7-Highly Effective 7 64%SKIP 0 0%
Total 11 100%
Mean 6.36Median 7.00Mode 7.00Std Deviation 1.21
Low High95% Confidence Interval (Mean) 5.2 7.6
B) Expertise...where 1=Highly Ineffective means that, collectively, team members did not possess an appropriate level of knowledge/skill to fulfill the mission; and 7=Highly Effective means that team members, collectively, were appropriately knowledgeable and skilled to accomplish the mission
Section 1-Inputs...includes the charter/mission, team members, tools, and resources
A) Charter/Mission...where 1=Highly Ineffective means confusing, vague, ill-structured, unbounded, unrealistic (e.g., time, constraints), unachievable; and 7=Highly Effective means understandable, clear, well-structured, bounded, realistic (e.g., time, constraints), achievable
0%
0%
0%
9%
27%
36%
27%
0%
0% 10% 20% 30% 40%
1-Highly Ineffective
2
3
4
5
6
7-Highly Effective
SKIP
A) Charter/Mission
0%
0%
9%
0%
0%
27%
64%
0%
0% 20% 40% 60% 80%
1-Highly Ineffective
2
3
4
5
6
7-Highly Effective
SKIP
B) Expertise
Administrator’s Note:
Mean = statistical average Median = the middle value in an ordered series Mode = most commonly occurring value in a series
1

IRTP-D Self-Assessment Raw Data Exhibit 1
1-Highly Ineffective 0 0%2 0 0%3 1 9%4 1 9%5 1 9%6 4 36%7-Highly Effective 4 36%SKIP 0 0%
Total 11 100%
Mean 5.82Median 6.00Mode 6.00Std Deviation 1.33
Low High95% Confidence Interval (Mean) 4.5 7.1
1-Highly Ineffective 0 0%2 0 0%3 0 0%4 1 9%5 1 9%6 3 27%7-Highly Effective 5 45%SKIP 1 9%
Total 11 100%
Mean 6.20Median 6.50Mode 7.00Std Deviation 1.03
Low High95% Confidence Interval (Mean) 5.2 7.2
C) Representativeness...where 1=Highly Ineffective means narrow, skewed, selective, unbalanced; and 7=Highly Effective means broad, diverse, balanced
D) External Human Resources(e.g., briefings, experts, consultants, liaisons) ...where 1=Highly Ineffective means inappropriate, inadequate, untimely, not helpful/useful; and 7=Highly Effective means appropriate, adequate, timely, helpful/useful
Section 1-Inputs...includes the charter/mission, team members, tools, and resources
0%
0%
9%
9%
9%
36%
36%
0%
0% 10% 20% 30% 40%
1-Highly Ineffective
2
3
4
5
6
7-Highly Effective
SKIP
C) Representativeness
0%
0%
0%
9%
9%
27%
45%
9%
0% 10% 20% 30% 40% 50%
1-Highly Ineffective
2
3
4
5
6
7-Highly Effective
SKIP
D) External Human Resources
2

IRTP-D Self-Assessment Raw Data Exhibit 1
1-Highly Ineffective 0 0%2 0 0%3 0 0%4 1 9%5 2 18%6 2 18%7-Highly Effective 5 45%SKIP 1 9%
Total 11 100%
Mean 6.10Median 6.50Mode 7.00Std Deviation 1.10
Low High95% Confidence Interval (Mean) 5.0 7.2
1-Highly Ineffective 0 0%2 0 0%3 0 0%4 0 0%5 1 9%6 2 18%7-Highly Effective 7 64%SKIP 1 9%
Total 11 100%
Mean 6.60Median 7.00Mode 7.00Std Deviation 0.70
Low High95% Confidence Interval (Mean) 5.9 7.3
(e.g., systems, tools, platforms, templates) ...where 1=Highly Ineffective means difficult, challenging, clumsy, awkward, tedious, slow, not helpful/useful; and 7=Highly Effective means easy, straightforward, clear, efficient, fast, helpful/useful
F) Administrative Resources(e.g., support, guidelines, documentation) ...where 1=Highly Ineffective means inappropriate, inadequate, untimely, not helpful/useful; and 7=Highly Effective means appropriate, adequate, timely, helpful/useful
Section 1-Inputs...includes the charter/mission, team members, tools, and resources
E) Technical Resources
0%
0%
0%
9%
18%
18%
45%
9%
0% 10% 20% 30% 40% 50%
1-Highly Ineffective
2
3
4
5
6
7-Highly Effective
SKIP
E) Technical Resources
0%
0%
0%
0%
9%
18%
64%
9%
0% 20% 40% 60% 80%
1-Highly Ineffective
2
3
4
5
6
7-Highly Effective
SKIP
F) Administrative Resources
3

IRTP-D Self-Assessment Raw Data Exhibit 1
COMMENTS
No. Comments:
1
The charter was clear however the implementation of the policy remains user un-friendly. The charter did not address that. We lacked security expertise, in particular with the 'prevent the hacker' discussion. We're not representing the registrants, we're mostly representing the registrars. I tried my best to speak for the registrants, with limited effect (measurements recommendation). Rest was ok, though there should be support for Linux.
2Help in coordination & logistics by staff were great, access to statistics were less so--not sure if stats were not kept or were kept from WG
3 A lot of good points have been made from different viewpoints (registrars, resgitries, 2ndary market etc) - a good 'team' has built up over the 4 IRTP working groups
Section 1-Inputs
4

IRTP-D Self-Assessment Raw Data Exhibit 1
1-Highly Ineffective 0 0%2 0 0%3 0 0%4 0 0%5 4 36%6 2 18%7-Highly Effective 5 45%SKIP 0 0%
Total 11 100%
Mean 6.09Median 6.00Mode 7.00Std Deviation 0.94
Low High95% Confidence Interval (Mean) 5.1 7.0
1-Highly Ineffective 0 0%2 0 0%3 0 0%4 0 0%5 1 9%6 3 27%7-Highly Effective 7 64%SKIP 0 0%
Total 11 100%
Mean 6.55Median 7.00Mode 7.00Std Deviation 0.69
Low High95% Confidence Interval (Mean) 5.9 7.2
...where 1=Highly Ineffective means disruptive, argumentative, disrespectful, hostile, domineering; and 7=Highly Effective means accommodating, respectful, collaborative, consensus-building
Section 2-Processes...includes norms, operations, logistics, and decision-making
A) Participation Climate...where 1=Highly Ineffective means inhospitable, unilateral, frustrating, unproductive; and 7=Highly Effective means inviting, inclusive, accepting, respectful, productive
B) Behavior Norms
0%
0%
0%
0%
36%
18%
45%
0%
0% 10% 20% 30% 40% 50%
1-Highly Ineffective
2
3
4
5
6
7-Highly Effective
SKIP
A) Participation Climate
0%
0%
0%
0%
9%
27%
64%
0%
0% 20% 40% 60% 80%
1-Highly Ineffective
2
3
4
5
6
7-Highly Effective
SKIP
B) Behavior Norms
5

IRTP-D Self-Assessment Raw Data Exhibit 1
1-Highly Ineffective 0 0%2 0 0%3 0 0%4 0 0%5 4 36%6 1 9%7-Highly Effective 6 55%SKIP 0 0%
Total 11 100%
Mean 6.18Median 7.00Mode 7.00Std Deviation 0.98
Low High95% Confidence Interval (Mean) 5.2 7.2
1-Highly Ineffective 0 0%2 0 0%3 0 0%4 0 0%5 1 9%6 5 45%7-Highly Effective 5 45%SKIP 0 0%
Total 11 100%
Mean 6.36Median 6.00Mode 6.00Std Deviation 0.67
Low High95% Confidence Interval (Mean) 5.7 7.0
C) Decision-Making Methodology (e.g., Consensus)...where 1=Highly Ineffective means broken, ignored, not observed, disrespected; and 7=Highly Effective means honored, followed, observed, respected
D) Session/Meeting Planning (e.g., Agendas) ...where 1=Highly Ineffective means disorganized, haphazard, unstructured, untimely notice; and 7=Highly Effective means organized, disciplined, structured, timely notice
Section 2-Processes...includes norms, operations, logistics, and decision-making
0%
0%
0%
0%
36%
9%
55%
0%
0% 10% 20% 30% 40% 50% 60%
1-Highly Ineffective
2
3
4
5
6
7-Highly Effective
SKIP
C) Decision-Making Methodology (e.g., Consensus)
0%
0%
0%
0%
9%
45%
45%
0%
0% 10% 20% 30% 40% 50%
1-Highly Ineffective
2
3
4
5
6
7-Highly Effective
SKIP
D) Session/Meeting Planning (e.g., Agendas)
6

IRTP-D Self-Assessment Raw Data Exhibit 1
COMMENTS
No. Comments:
1Not all contributing members contributed. Decisions were sometimes already made, and a minority report solution was mentioned at some point. I'm glad it didn't have to come to that.
2 Agendas were general, would be helpful for leader to outline questions/issues unresolved from last session to start agenda of next session
3It's not always possible for all members to make the calls - WG's on a *monday* are particularly affected by national/state/religious holidays, plus there is some level of 'working-group-fatigue' hapenning, but the mailling list discussions make up for it
Section 2-Processes
7

IRTP-D Self-Assessment Raw Data Exhibit 1
1-Highly Ineffective 0 0%2 0 0%3 0 0%4 0 0%5 3 27%6 4 36%7-Highly Effective 4 36%SKIP 0 0%
Total 11 100%
Mean 6.09Median 6.00Mode 6.00Std Deviation 0.83
Low High95% Confidence Interval (Mean) 5.3 6.9
1-Highly Ineffective 0 0%2 0 0%3 0 0%4 0 0%5 2 18%6 3 27%7-Highly Effective 6 55%SKIP 0 0%
Total 11 100%
Mean 6.36Median 7.00Mode 7.00Std Deviation 0.81
Low High95% Confidence Interval (Mean) 5.6 7.2
...where 1=Highly Ineffective means incomplete, inadequate, materially deficient/flawed, unsupported; and 7=Highly Effective means complete, thorough, exhaustive, reasoned, supported
Section 3-Products & Outputs
A) Working Group's Primary Mission...where 1=Highly Ineffective means not achieved, fulfilled, and/or accomplished per the Charter; and 7=Highly Effective means completely achieved, fulfilled, and/or accomplished as directed
B) Quality of Outputs & Deliverables
0%
0%
0%
0%
27%
36%
36%
0%
0% 10% 20% 30% 40%
1-Highly Ineffective
2
3
4
5
6
7-Highly Effective
SKIP
A) Working Group's Primary Mission
0%
0%
0%
0%
18%
27%
55%
0%
0% 10% 20% 30% 40% 50% 60%
1-Highly Ineffective
2
3
4
5
6
7-Highly Effective
SKIP
B) Quality of Outputs & Deliverables
8

IRTP-D Self-Assessment Raw Data Exhibit 1
COMMENTS
No. Comments:
1 In as far as possible given the charter.
2 the amount of work done in a short(ish) timeframe and self imposed deadlines has been astounding
Section 3-Products & Outputs
9

IRTP-D Self-Assessment Raw Data Exhibit 1
1-Participated Never 1 9%2 0 0%3 1 9%4 1 9%5 4 36%6 1 9%7-Particip'd Extensively 2 18%SKIP 1 9%
Total 11 100%
Mean 4.80Median 5.00Mode 5.00Std Deviation 1.81
Low High95% Confidence Interval (Mean) 3.0 6.6
1-Highly Unrewarding 0 0%2 0 0%3 0 0%4 1 9%5 3 27%6 4 36%7-Highly Rewarding 2 18%SKIP 1 9%
Total 11 100%
Mean 5.70Median 6.00Mode 6.00Std Deviation 0.95
Low High95% Confidence Interval (Mean) 4.8 6.6
...considering the time, energy, and work efforts I contributed to this WG where 1=Highly Unrewarding and 7=Highly Rewarding
Section 4-Personal Dimensions
A) My Personal Engagement...in helping the WG accomplish its mission where 1=Participated Never and 7=Participated Extensively
B) My Personal Fulfillment
9%
0%
9%
9%
36%
9%
18%
9%
0% 10% 20% 30% 40%
1-Participated Never
2
3
4
5
6
7-Particip'd Extensively
SKIP
A) My Personal Engagement
0%
0%
0%
9%
27%
36%
18%
9%
0% 10% 20% 30% 40%
1-Highly Unrewarding
2
3
4
5
6
7-Highly Rewarding
SKIP
B) My Personal Fulfillment
10

IRTP-D Self-Assessment Raw Data Exhibit 1
1-Extremely Unreceptive 0 0%2 0 0%3 0 0%4 0 0%5 2 18%6 2 18%7-Extremely Receptive 6 55%SKIP 1 9%
Total 11 100%
Mean 6.40Median 7.00Mode 7.00Std Deviation 0.84
Low High95% Confidence Interval (Mean) 5.6 7.2
...assuming all other conditions are suitable (e.g., subject, interest, need, fit, availability), I assess my willingness to serve on a future ICANN Working Group as 1=Extremely Unreceptive and 7=Extremely Receptive
Section 4-Personal Dimensions
C) My Personal Willingness-to-Serve
0%
0%
0%
0%
18%
18%
55%
9%
0% 10% 20% 30% 40% 50% 60%
1-Extremely Unreceptive
2
3
4
5
6
7-Extremely Receptive
SKIP
C) My Personal Willingness-to-Serve
COMMENTS
No. Comments:
1 I joined relatively late to the group, but gave it my full engagement and remain willing to serve.
2 My engagement varied with particular issues, nature of the beast.
3
I feel as a registrar with a primarily small business and home-user clientbase that the interests of small registrars, registrants and general domain owners are exceptionally important, and that giving up appx 2 days of my week every week on working groups is (currently) a price we are prepared to pay. I would like to see some form of 'incentive' for WG participants - reduced ICANN fees, better coffee at teh meetings, special coloured badges at events etc would be a small way to 'reard' those who give up their time. I single out James Bladel and Volker Grieman who have worked very very hard on IRTP etc
4
This was my first time serving on a working group and so this, to some degree my level of engagement. That side, I was quite pleased to have a front row seat and observe how an effective, well-organised process within ICANN works. I'm definitely motivated by this experience to continue my participation in future working groups.
Section 4-Personal Dimensions
11

IRTP-D Self-Assessment Raw Data Exhibit 1
Abbrev Count PctI was informed or invited by my SG/C or ICANN-affiliated organization SG/C 5 36%I was contacted by an ICANN Staff member Staff 2 14%I was contacted by an individual seeking to recruit volunteers Recruiter 1 7%I learned about the WG through one of ICANN's websites (or Wikis) Website 2 14%I learned about the WG from another organization external to ICANN External 0 0%A professional colleague or associate informed me about the WG Colleague 2 14%Other (Please describe) Other 2 14%Total 14 100%
Note: Two (2) noted that they had participated in previous IRTP WGs
Section 5A-Demographics
How did you first learn about this WG (Select any/all that apply)?
36%
14%
7%
14%
0%
14%
14%
0% 10% 20% 30% 40%
SG/C
Staff
Recruiter
Website
External
Colleague
Other
How did you first learn about this WG (Select any/all that apply)?
12
IRTP-D Self-Assessment Raw Data Exhibit 1
[1] < 1 year 1 9%[2] 1-2 years 2 18%[3] 2-4 years 1 9%[4] 4-6 years 3 27%[5] 6-8 years 4 36%[6] > 8 years 0 0%
Total 11 100%
Mean 3.64Median 4.00Mode 5.00Std Deviation 1.43
Low High95% Confidence Interval (Mean) 2.2 5.1
[1] < 2 hours 6 55%[2] 2-5 hours 2 18%[3] 6-10 hours 1 9%[4] 11-15 hours 0 0%[5] 16-20 hours 1 9%[6] > 20 hours 1 9%
Total 11 100%
Mean 2.18Median 1.00Mode 1.00Std Deviation 1.78
Low High95% Confidence Interval (Mean) 0.4 4.0
B) Hours/Month Spent on ICANN ActivitiesQuestion: Considering the most recent 12 months, approximately how many hours per week do you spend on ICANN activities on the average?
Section 5B-Demographics
A) Years Active Involvement with ICANNQuestion: Approximately how long have you been actively involved with ICANN?
9%
18%
9%
27%
36%
A) Years Active Involvement with ICANN
[1] < 1 year
[2] 1-2 years
[3] 2-4 years
[4] 4-6 years
[5] 6-8 years
Figure 2.
55%
18%
9%
9%
9%
B) Hours/Month Spent on ICANN Activities
[1] < 2 hours
[2] 2-5 hours
[3] 6-10 hours
[4] 11-15 hours
[5] 16-20 hours
[6] > 20 hours
Figure 3.
13

IRTP-D Self-Assessment Raw Data Exhibit 1
FINAL OVERALL COMMENTS
No. Comments:
1I appreciate the volunteering work and honesty many members show. What we need is more objective data and more end user input. That will bring balance and more effective policies.
2
I believe WG should be more willing / accustomed / encouraged / facilitated to bring in external expertise on a add hoc as needed basis for independent advice. Also conduct more data research and analysis to avoid endless talking about scenarios.
IRPD-D exhibited burnout of its members, including myself, partly because it was non polemic, and slightly mundane except for registrars whose natural work it and business it encompassed.
Section 6-Overall Feedback
14

IRTP-D Self-Assessment Data Extrapolations Exhibit 2
Ratings Total Pct1-Highly Ineffective 0 0%2 0 0%3 2 3%4 4 6%5 8 12%6 18 27%7-Highly Effective 31 47%SKIP 3 5%
Total 66 100%
Mean 6.19Median 7.00Mode 7.00
Low High95% Conf Interval (Mean) 5.9 6.5
Ratings Total Pct1-Highly Ineffective 0 0%2 0 0%3 0 0%4 0 0%5 10 23%6 11 25%7-Highly Effective 23 52%SKIP 0 0%
Total 44 100%
Mean 6.44Median 7.00Mode 7.00
Low High95% Conf Interval (Mean) 6.2 6.7
Ratings by Major Survey Section
Section 1-Inputs
Section 2-Processes
0%
0%
3%
6%
12%
27%
5%
0% 10% 20% 30% 40%
1-Highly Ineffective
2
3
4
5
6
7-Highly Effective
SKIP
Section 1-Inputs
0%
0%
0%
0%
23%
25%
52%
0%
0% 10% 20% 30% 40% 50% 60%
1-Highly Ineffective
2
3
4
5
6
7-Highly Effective
SKIP
Section 2-Processes
Administrator’s Note:
Each of these pages contains data extrapolation tables for each major section of the questionnaire (see Administrator’s Report, Chapter 5). As a result, the value of N is different since the number of individual questions varied by section.
1

IRTP-D Self-Assessment Data Extrapolations Exhibit 2
Ratings Total Pct1-Highly Ineffective 0 0%2 0 0%3 0 0%4 0 0%5 5 23%6 7 32%7-Highly Effective 10 45%SKIP 0 0%
Total 22 100%
Mean 6.31Median 6.50Mode 7.00
Low High95% Conf Interval (Mean) 6.0 6.6
Ratings Total Pct1-Lowest Score 1 3%2 0 0%3 1 3%4 2 6%5 9 27%6 7 21%7-Highest Score 10 30%SKIP 3 9%
Total 33 100%
Mean 5.83Median 6.00Mode 7.00
Low High95% Conf Interval (Mean) 5.4 6.2
Section 4-Personal Dimensions
Section 3-Products & Outputs
Ratings by Major Survey Section
0%
0%
0%
0%
23%
32%
45%
0%
0% 10% 20% 30% 40% 50%
1-Highly Ineffective
2
3
4
5
6
7-Highly Effective
SKIP
Section 3-Products & Outputs
3%
0%
3%
6%
27%
21%
30%
9%
0% 10% 20% 30% 40% 50%
1-Lowest Score
2
3
4
5
6
7-Highest Score
SKIP
Section 4-Personal Dimensions
2