IRS GLUT4 Paper - pandemicsurvivor.files.wordpress.com
9
Volume 8 • Issue 6 • 1000429 J Stem Cell Res Ther, an open access journal ISSN: 2157-7633 Open Access Research Article Journal of Stem Cell Research & Therapy J o u r n a l o f S t e m C e ll R e s e a r c h & T h e r a p y ISSN: 2157-7633 Raghavan, J Stem Cell Res Ther 2018, 8:6 DOI: 10.4172/2157-7633.1000429 Abstract Insulin and IGF signaling require a family of scaffold proteins, also called as Insulin Receptor Substrate (IRS) proteins to integrate extracellular signals into intracellular responses, leading to cellular effects. Two main IRS proteins in humans are IRS1 and IRS2 and are widely expressed in most human and mammalian tissues. In this study, IRS1, IRS2, GLUT4 gene expression is quantified in Umbilical Cord (UC) cell line by semi quantitative- PCR. The internal control β-actin was used to normalize the IRS1, IRS2, GLUT4 gene expression levels. This is the first example of UC cells being induced by a ligand in expressing genes that regulate glucose and insulin levels. Metadichol ® treatment at different concentrations on UC cells showed upregulation of IRS1, IRS2 and GLUT4. 100 pg/mL concentrations showed the highest upregulation of IRS1, IRS2 and GLUT4 expression. 1 ng and 100 ng/mL treatment showed marginal. Metadichol ® is in addition a TNF alpha inhibitor and also inhibits Plasminogen Activation Inhibitor (PAI1) also known as SERPINE1. These genes play an important role in diabetes. The experimental results fully correlated with curated literature data using Bioinformatics software. Network analysis show the uniqueness of shared genes, IRS1, IRS2, GLUT4, TNF, PAI1, acting through multiple pathways that target multiple diseases. Umbilical Cord Cells Treatment with Metadichol IRS Proteins and GLUT4 Expression and Implications for Diabetes Palayakotai R Raghavan* Nanorx Inc., PO Box 131, Chappaqua, NY 10514, USA *Corresponding author: Palayakotai R Raghavan, Nanorx Inc., PO Box 131, Chappaqua, NY 10514, USA, Tel: 9146710224; E-mail: [email protected] Received May 31, 2018; Accepted June 12, 2018; Published June 18, 2018 Citation: Raghavan PR (2018) Umbilical Cord Cells Treatment with Metadichol ® IRS Proteins and GLUT4 Expression and Implications for diabetes. Stem Cell Res Ther 8: 429. doi: 10.4172/2157-7633.1000429 Copyright: © 2018 Raghavan PR. This is an open-access article distributed under the terms of the Creative Commons Attribution License, which permits unrestricted use, distribution, and reproduction in any medium, provided the original author and source are credited. Keywords: GLUT4; Genes; Diabetes; Glucose uptake; GSK3, IGF1, PI#K Abbreviations: IRS: Insulin Receptor Substrate; UC: Umbilical Cord; PAI: Plasminogen Activation Inhibitor; UBC: Umbilical Cord Blood; MSC: Mesenchymal Stem Cell; T2DM: Type 2 Diabetes Mellitus; AKT: Protein Kinase B; PBMCs: Peripheral Blood Mononuclear Cells; IR: Insulin Resistance; PCR: Polymerase Chain Reaction Introduction e increased incidence of Diabetes Mellitus (DM) worldwide reinforces the search for new approaches to prevent the progression of diabetes and its complications [1]. Stem cells are the next frontier in medicine. Stem cells are thought to have significant therapeutic and biotechnological potential [2]. Stem cell therapy will not only replace damaged or dysfunctional cells but deliver therapeutic proteins aſter they have been engineered to do so. is field is paving the way for novel therapeutic interventions through cellular therapies and tissue engineering approaches that are reshaping the biomedical field. e remarkable flexibility of different cell subsets obtained from human embryonic and adult tissues from sources like bone marrow, UC useful in evaluating these cells in the treatment of diabetes and its complications and hold great promise for pancreatic beta cell replacement therapy for diabetes. Umbilical Cord Blood (UBC) contains Mesenchymal Stem Cells (MSCs) that are precursors of certain types of cells (e.g., bone, cartilage, fat or muscle) [3-5]. MSCs are multipotent stromal cells that can differentiate into a variety of cell types which have been shown to improve metabolic control [6] in experimental models of Type 2 Diabetes (T2D). A recently published study by Si [7] showed that infusion of autologous MSCs managed to improve hyperglycemia in T2D rats. Beneficial effects of MSC therapy resulted in enhanced insulin sensitivity via increased signaling of IRS1. Also, AKT (Protein kinase B PKB) phosphorylation leads to translocation of GLUT4 or also known as SLC2A4 (glucose transporter type 4) on cell membrane upon insulin administration in the muscle, liver, and adipose tissue of MSC treated animals [8,9]. ere are several problems that limit the use of MSCs for diabetes therapy [10]. Mottaghi [11] showed that poor engraſtment and limited differentiation under in vivo conditions are major obstacles for efficient therapeutic use of MSCs. Hyperglycemia leads to reactive oxygen species overproduction which triggers apoptosis and thereby decreases MSC viability after transplantation. Another large accessible source of adult stem cells is Peripheral Blood Mononuclear Cells (PBMCs). It can be frozen and stored for later use. PBMCs contain many different progenitor cell types and are expandable as they can be cultured and reprogrammed to produce Induced Pluripotent Stem Cells (iPSCs) [12] for clinical applications in regenerative medicine. Blood glucose concentration is tightly regulated in humans. GLUT4 is what maintains whole-body glucose homeostasis. Both insulin and exercise acutely stimulate GLUT4 recruitment to the cell surfaces of muscle and adipose cells independent of transcription or translation [13]. Insulin and IGF signaling requires a family of IRS proteins to integrate extracellular signals into intracellular responses, leading to cellular effects [14]. ere are two main IRS proteins in humans, IRS1 and IRS2, that are widely expressed in most human and mammalian tissues. IRS1 and IRS2 mediate the control of various cellular processes by insulin [15]. Insulin binding to the α-subunit of the insulin receptor results in the phosphorylation of IRS1 and IRS2 which leads, via several intermediary steps, to activation of AKT (protein kinase B) [16]. Insulin Resistance (IR) can result from deficits in any part of the insulin signaling pathway resulting in inadequate response to insulin [17].
Transcript of IRS GLUT4 Paper - pandemicsurvivor.files.wordpress.com

Volume 8 • Issue 6 • 1000429J Stem Cell Res Ther, an open access journalISSN: 2157-7633
Open AccessResearch Article
Journal ofStem Cell Research & TherapyJo
urna
l of S
temCell Research&
Therapy
ISSN: 2157-7633
Raghavan, J Stem Cell Res Ther 2018, 8:6DOI: 10.4172/2157-7633.1000429
AbstractInsulin and IGF signaling require a family of scaffold proteins, also called as Insulin Receptor Substrate (IRS)
proteins to integrate extracellular signals into intracellular responses, leading to cellular effects. Two main IRS proteins in humans are IRS1 and IRS2 and are widely expressed in most human and mammalian tissues. In this study, IRS1, IRS2, GLUT4 gene expression is quantified in Umbilical Cord (UC) cell line by semi quantitative- PCR. The internal control β-actin was used to normalize the IRS1, IRS2, GLUT4 gene expression levels. This is the first example of UC cells being induced by a ligand in expressing genes that regulate glucose and insulin levels. Metadichol® treatment at different concentrations on UC cells showed upregulation of IRS1, IRS2 and GLUT4. 100 pg/mL concentrations showed the highest upregulation of IRS1, IRS2 and GLUT4 expression. 1 ng and 100 ng/mL treatment showed marginal. Metadichol® is in addition a TNF alpha inhibitor and also inhibits Plasminogen Activation Inhibitor (PAI1) also known as SERPINE1. These genes play an important role in diabetes. The experimental results fully correlated with curated literature data using Bioinformatics software. Network analysis show the uniqueness of shared genes, IRS1, IRS2, GLUT4, TNF, PAI1, acting through multiple pathways that target multiple diseases.
Umbilical Cord Cells Treatment with Metadichol IRS Proteins and GLUT4 Expression and Implications for DiabetesPalayakotai R Raghavan*Nanorx Inc., PO Box 131, Chappaqua, NY 10514, USA
*Corresponding author: Palayakotai R Raghavan, Nanorx Inc., PO Box 131, Chappaqua, NY 10514, USA, Tel: 9146710224; E-mail: [email protected]
Received May 31, 2018; Accepted June 12, 2018; Published June 18, 2018
Citation: Raghavan PR (2018) Umbilical Cord Cells Treatment with Metadichol® IRS Proteins and GLUT4 Expression and Implications for diabetes. Stem Cell Res Ther 8: 429. doi: 10.4172/2157-7633.1000429
Copyright: © 2018 Raghavan PR. This is an open-access article distributed under the terms of the Creative Commons Attribution License, which permits unrestricted use, distribution, and reproduction in any medium, provided the original author and source are credited.
Keywords: GLUT4; Genes; Diabetes; Glucose uptake; GSK3, IGF1,PI#K
Abbreviations: IRS: Insulin Receptor Substrate; UC: UmbilicalCord; PAI: Plasminogen Activation Inhibitor; UBC: Umbilical Cord Blood; MSC: Mesenchymal Stem Cell; T2DM: Type 2 Diabetes Mellitus; AKT: Protein Kinase B; PBMCs: Peripheral Blood Mononuclear Cells; IR: Insulin Resistance; PCR: Polymerase Chain Reaction
IntroductionThe increased incidence of Diabetes Mellitus (DM) worldwide
reinforces the search for new approaches to prevent the progression of diabetes and its complications [1]. Stem cells are the next frontier in medicine. Stem cells are thought to have significant therapeutic and biotechnological potential [2]. Stem cell therapy will not only replace damaged or dysfunctional cells but deliver therapeutic proteins after they have been engineered to do so. This field is paving the way for novel therapeutic interventions through cellular therapies and tissue engineering approaches that are reshaping the biomedical field. The remarkable flexibility of different cell subsets obtained from human embryonic and adult tissues from sources like bone marrow, UC useful in evaluating these cells in the treatment of diabetes and its complications and hold great promise for pancreatic beta cell replacement therapy for diabetes. Umbilical Cord Blood (UBC) contains Mesenchymal Stem Cells (MSCs) that are precursors of certain types of cells (e.g., bone, cartilage, fat or muscle) [3-5].
MSCs are multipotent stromal cells that can differentiate into a variety of cell types which have been shown to improve metabolic control [6] in experimental models of Type 2 Diabetes (T2D). A recently published study by Si [7] showed that infusion of autologous MSCs managed to improve hyperglycemia in T2D rats. Beneficial effects of MSC therapy resulted in enhanced insulin sensitivity via increased signaling of IRS1. Also, AKT (Protein kinase B PKB) phosphorylation leads to translocation of GLUT4 or also known as SLC2A4 (glucose transporter type 4) on cell membrane upon insulin administration in the muscle, liver, and adipose tissue of MSC treated animals [8,9].
There are several problems that limit the use of MSCs for diabetes therapy [10]. Mottaghi [11] showed that poor engraftment and limited differentiation under in vivo conditions are major obstacles for efficient therapeutic use of MSCs. Hyperglycemia leads to reactive oxygen species overproduction which triggers apoptosis and thereby decreases MSC viability after transplantation.
Another large accessible source of adult stem cells is Peripheral Blood Mononuclear Cells (PBMCs). It can be frozen and stored for later use. PBMCs contain many different progenitor cell types and are expandable as they can be cultured and reprogrammed to produce Induced Pluripotent Stem Cells (iPSCs) [12] for clinical applications in regenerative medicine.
Blood glucose concentration is tightly regulated in humans. GLUT4 is what maintains whole-body glucose homeostasis. Both insulin and exercise acutely stimulate GLUT4 recruitment to the cell surfaces of muscle and adipose cells independent of transcription or translation [13]. Insulin and IGF signaling requires a family of IRS proteins to integrate extracellular signals into intracellular responses, leading to cellular effects [14]. There are two main IRS proteins in humans, IRS1 and IRS2, that are widely expressed in most human and mammalian tissues. IRS1 and IRS2 mediate the control of various cellular processes by insulin [15]. Insulin binding to the α-subunit of the insulin receptor results in the phosphorylation of IRS1 and IRS2 which leads, via several intermediary steps, to activation of AKT (protein kinase B) [16]. Insulin Resistance (IR) can result from deficits in any part of the insulin signaling pathway resulting in inadequate response to insulin [17].
Citation: Raghavan PR (2018) Umbilical Cord Cells Treatment with Metadichol® IRS Proteins and GLUT4 Expression and Implications for diabetes. Stem Cell Res Ther 8: 429. doi: 10.4172/2157-7633.1000429
Page 2 of 9
Volume 8 • Issue 6 • 1000429J Stem Cell Res Ther, an open access journalISSN: 2157-7633
We have recently shown that UBC treatment with Metadichol, a nano-formulation of long chain lipid alcohols derived from food sources [18] at picogram levels leads to enriched cells containing CD34 [19]. We present here data that treating UBC cells with Metadichol at low concentrations leads to multifold increases of IRS1 and IRS2 and also GLUT4 expressions that potentially have a role as discussed above in diabetes.
ExperimentalThe work was commerically outsourced and carried out by Skanda
Life Sciences Pvt. Ltd Bangalore India and Primers (Table 1) synthesized at Eurofins Genomics, India.
Preparation of test samples
Metadichol (5 mg/mL) stock was diluted to obtain desired concentrations of 0.001, 0.1, 1, 100, 1000 ng/mL test solutions.
Cell lines and treatment
UC cells were cultured in MSC expansion medium with reduced Serum, 100 units/mL of penicillin G and 100 µg/mL of Streptomycin at 37°C, 5% CO2 incubator.
Treatment for analysis of IRS1, IRS2 and GLUT4 gene expression by semi quantitative RT and RT PCR
The cells were aspirated from the 80% confluence culture flask and centrifuged at 1500 rpm for 5 mins. The cell pellet was then resuspended in 1 mL of complete media and 1 × 10⁶ cells/dish was seeded to each well of the 96 well microtiter plates. After 24 hrs incubation, cells were treated with Metadichol at various concentrations followed by 48 hrs incubation. Post incubation, the cells are harvested for RNA isolation.
RNA isolation and sample preparation
UC cells were washed twice with PBS and to the adherent cells 2 mL of TRIzol (per T25 flask) was added and transferred to the tube and vortexed. Samples were allowed to stand for 5 mins at room temperature. Added 0.2 mL of chloroform per 1 mL of TRIzol used. Closed the tube and shaken vigorously for 15 seconds. The tube was allowed to stand at room temperature for 5 mins. The resulting mixture was centrifuged
at 10,000 rpm for 15 mins at 4°C. The colourless upper aqueous phase was transferred to a new clean tube. 0.5 mL of isopropanol was added per 1 mL of TRIzol used, mixed gently by inverting the sample 5 times and incubated at room temperature for 5 mins. Then it was centrifuged at 10,000 rpm for 10 mins at 4°C. Supernatant was discarded and the RNA pellet was washed by adding 1 mL of 70% ethanol. Mix gently by inverting the sample a few times. It was then centrifuged for 5 mins at 14,000 rpm at 4°C. Supernatant was discarded by inverting the tube on a clean tissue paper. Later, the pellet was dried by incubating in a dry bath for 5 mins at 55°c. The pellet was then resuspended in 25 µl of DEPC treated water.
Reverse Transcriptase Polymerase Chain Reaction (RT PCR)
A semi quantitative Reverse Transcriptase Polymerase Chain Reaction (RT PCR) was carried out using Techno Prime system to determine the levels of β-actin, IRS1, IRS2, GLUT4 mRNA expressions. The cDNA was synthesized from 2 µg of RNA using the Verso cDNA synthesis kit (Thermo Fischer Scientific) with oligo dT primer according to the manufacturer’s instructions. The reaction volume was set to 20 μl and cDNA synthesis was performed at 42°C for 60 mins, followed by RT inactivation at 85°C for 5 mins.
Semi quantitative PCR reaction
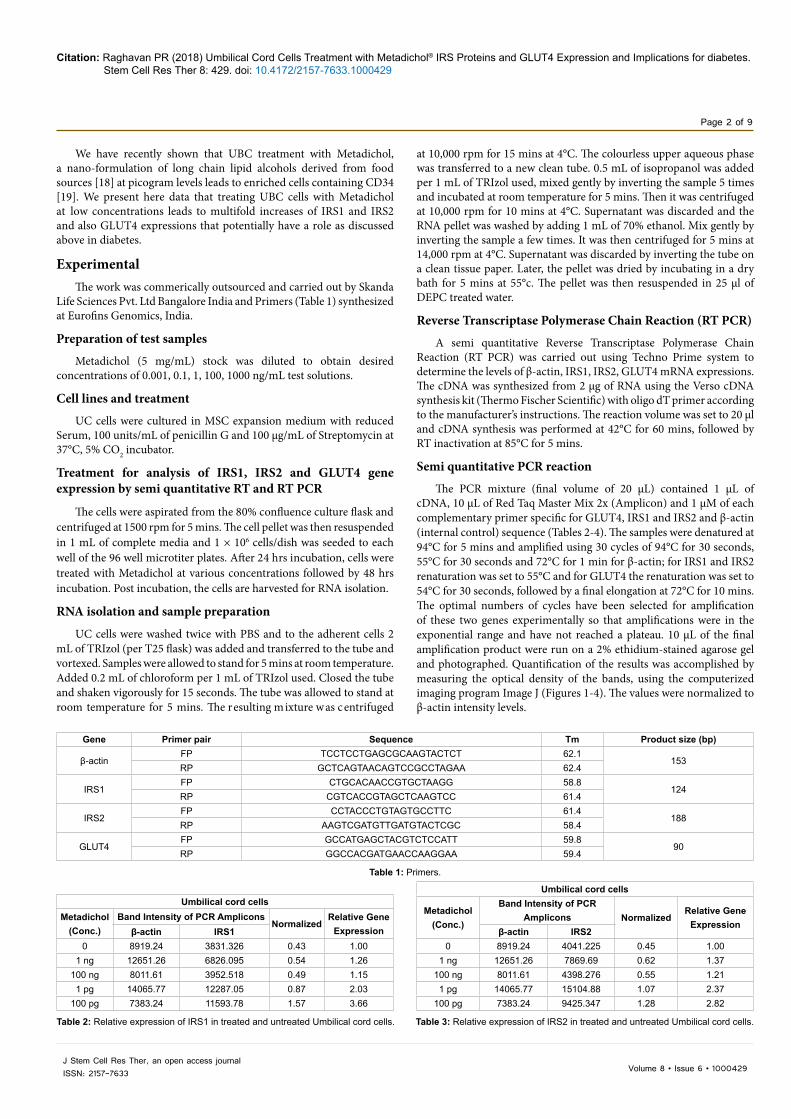
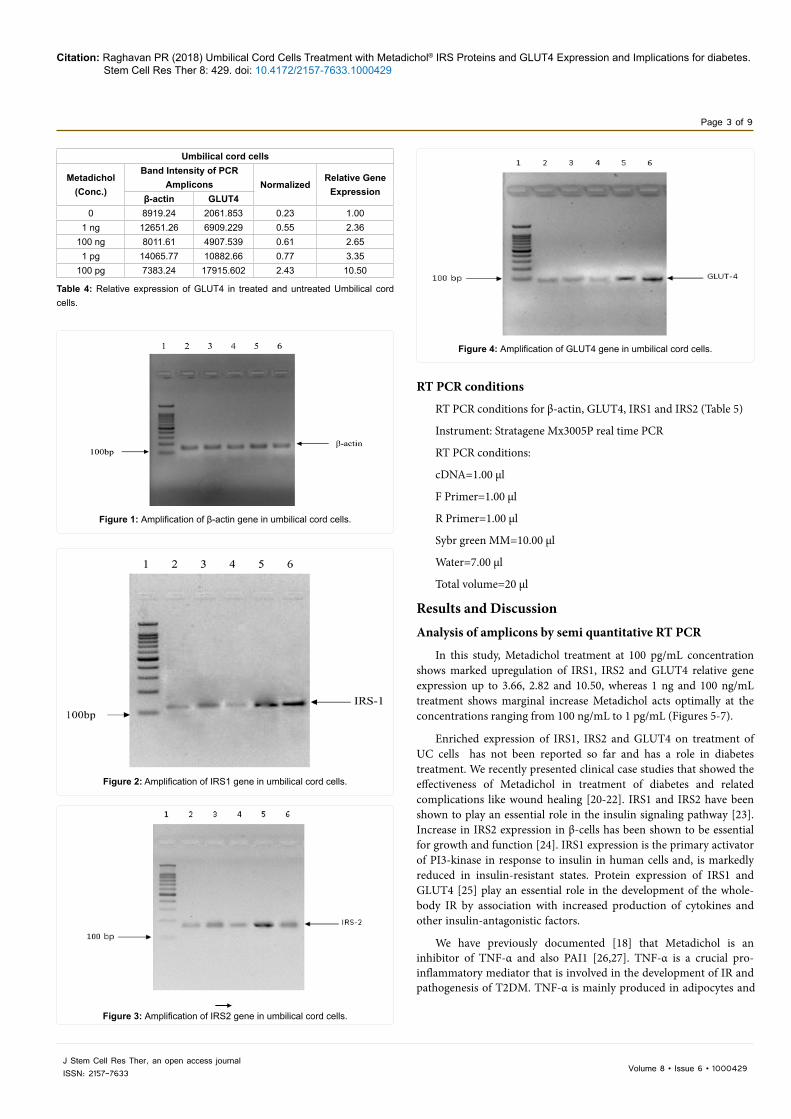
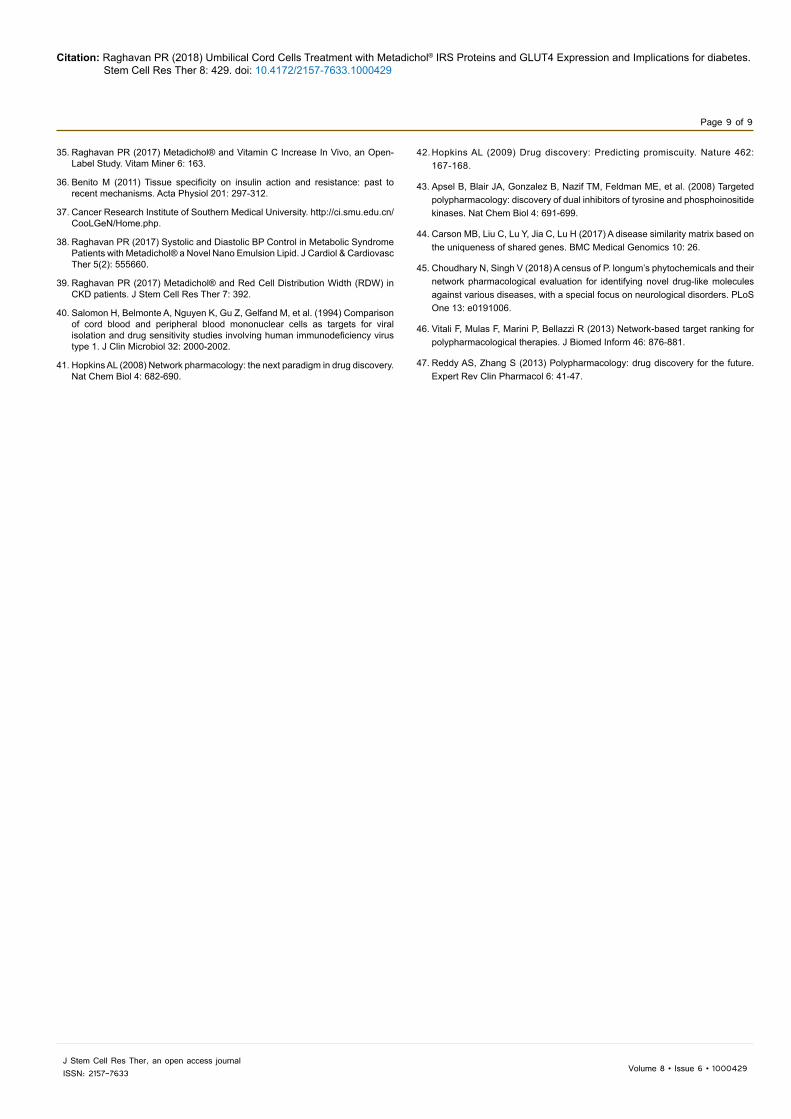
The PCR mixture (final volume of 20 µL) contained 1 µL of cDNA, 10 µL of Red Taq Master Mix 2x (Amplicon) and 1 µM of each complementary primer specific for GLUT4, IRS1 and IRS2 and β-actin (internal control) sequence (Tables 2-4). The samples were denatured at 94°C for 5 mins and amplified using 30 cycles of 94°C for 30 seconds, 55°C for 30 seconds and 72°C for 1 min for β-actin; for IRS1 and IRS2 renaturation was set to 55°C and for GLUT4 the renaturation was set to 54°C for 30 seconds, followed by a final elongation at 72°C for 10 mins. The optimal numbers of cycles have been selected for amplification of these two genes experimentally so that amplifications were in the exponential range and have not reached a plateau. 10 µL of the final amplification product were run on a 2% ethidium-stained agarose gel and photographed. Quantification of the results was accomplished by measuring the optical density of the bands, using the computerized imaging program Image J (Figures 1-4). The values were normalized to β-actin intensity levels.
Gene Primer pair Sequence Tm Product size (bp)
β-actinFP TCCTCCTGAGCGCAAGTACTCT 62.1
153RP GCTCAGTAACAGTCCGCCTAGAA 62.4
IRS1FP CTGCACAACCGTGCTAAGG 58.8
124RP CGTCACCGTAGCTCAAGTCC 61.4
IRS2FP CCTACCCTGTAGTGCCTTC 61.4
188RP AAGTCGATGTTGATGTACTCGC 58.4
GLUT4FP GCCATGAGCTACGTCTCCATT 59.8
90RP GGCCACGATGAACCAAGGAA 59.4
Table 1: Primers.
Umbilical cord cellsMetadichol
(Conc.)Band Intensity of PCR Amplicons
NormalizedRelative Gene
Expressionβ-actin IRS10 8919.24 3831.326 0.43 1.00
1 ng 12651.26 6826.095 0.54 1.26100 ng 8011.61 3952.518 0.49 1.151 pg 14065.77 12287.05 0.87 2.03
100 pg 7383.24 11593.78 1.57 3.66
Table 2: Relative expression of IRS1 in treated and untreated Umbilical cord cells.
Umbilical cord cells
Metadichol (Conc.)
Band Intensity of PCR Amplicons Normalized
Relative Gene Expression
β-actin IRS20 8919.24 4041.225 0.45 1.00
1 ng 12651.26 7869.69 0.62 1.37100 ng 8011.61 4398.276 0.55 1.211 pg 14065.77 15104.88 1.07 2.37
100 pg 7383.24 9425.347 1.28 2.82
Table 3: Relative expression of IRS2 in treated and untreated Umbilical cord cells.
Citation: Raghavan PR (2018) Umbilical Cord Cells Treatment with Metadichol® IRS Proteins and GLUT4 Expression and Implications for diabetes. Stem Cell Res Ther 8: 429. doi: 10.4172/2157-7633.1000429
Page 3 of 9
Volume 8 • Issue 6 • 1000429J Stem Cell Res Ther, an open access journalISSN: 2157-7633
RT PCR conditions
RT PCR conditions for β-actin, GLUT4, IRS1 and IRS2 (Table 5)
Instrument: Stratagene Mx3005P real time PCR
RT PCR conditions:
cDNA=1.00 µl
F Primer=1.00 µl
R Primer=1.00 µl
Sybr green MM=10.00 µl
Water=7.00 µl
Total volume=20 µl
Results and DiscussionAnalysis of amplicons by semi quantitative RT PCR
In this study, Metadichol treatment at 100 pg/mL concentration shows marked upregulation of IRS1, IRS2 and GLUT4 relative gene expression up to 3.66, 2.82 and 10.50, whereas 1 ng and 100 ng/mL treatment shows marginal increase Metadichol acts optimally at the concentrations ranging from 100 ng/mL to 1 pg/mL (Figures 5-7).
Enriched expression of IRS1, IRS2 and GLUT4 on treatment of UC cells has not been reported so far and has a role in diabetes treatment. We recently presented clinical case studies that showed the effectiveness of Metadichol in treatment of diabetes and related complications like wound healing [20-22]. IRS1 and IRS2 have been shown to play an essential role in the insulin signaling pathway [23]. Increase in IRS2 expression in β-cells has been shown to be essential for growth and function [24]. IRS1 expression is the primary activator of PI3-kinase in response to insulin in human cells and, is markedly reduced in insulin-resistant states. Protein expression of IRS1 and GLUT4 [25] play an essential role in the development of the whole-body IR by association with increased production of cytokines and other insulin-antagonistic factors.
We have previously documented [18] that Metadichol is an inhibitor of TNF-α and also PAI1 [26,27]. TNF-α is a crucial pro-inflammatory mediator that is involved in the development of IR and pathogenesis of T2DM. TNF-α is mainly produced in adipocytes and
Umbilical cord cells
Metadichol (Conc.)
Band Intensity of PCR Amplicons Normalized
Relative Gene Expression
β-actin GLUT40 8919.24 2061.853 0.23 1.00
1 ng 12651.26 6909.229 0.55 2.36100 ng 8011.61 4907.539 0.61 2.651 pg 14065.77 10882.66 0.77 3.35
100 pg 7383.24 17915.602 2.43 10.50
Table 4: Relative expression of GLUT4 in treated and untreated Umbilical cord cells.
Figure 1: Amplification of β-actin gene in umbilical cord cells.
Figure 3: Amplification of IRS2 gene in umbilical cord cells.
Figure 2: Amplification of IRS1 gene in umbilical cord cells.
Figure 4: Amplification of GLUT4 gene in umbilical cord cells.

Citation: Raghavan PR (2018) Umbilical Cord Cells Treatment with Metadichol® IRS Proteins and GLUT4 Expression and Implications for diabetes. Stem Cell Res Ther 8: 429. doi: 10.4172/2157-7633.1000429
Page 4 of 9
Volume 8 • Issue 6 • 1000429J Stem Cell Res Ther, an open access journalISSN: 2157-7633
peripheral tissues and induces tissue-specific inflammation through generation of ROS and activation of various transcriptional mediated pathways. The raised level of TNF-α induces IR in adipocytes and peripheral tissues by impairing the insulin signaling through serine phosphorylation that leads to the development of T2DM. Blocking TNF induced inflammation is one of the effective strategies for the treatment of IR and T2DM. Elevated concentrations of PAI1 have been
observed consistently in blood from patients with IR, diabetes [28,29]. PAI1 levels are 5-10 folds higher consistent with direct effects observed in vitro, increased levels correlate with elevated concentrations in blood of triglycerides and hyperinsulinemia.
Human diseases are linked via complex gene networks. Literature curated experimental data show that gene clusters are driving the core mechanisms among multiple related diseases. Comparative Toxicogenomics Database (CTD) is a robust, publicly available database that provides experimentally curated information about gene – disease relationships [30]. These data are integrated with biological processes and pathway data can lead to understanding the mechanisms of underlying diseases. Complex diseases such as diabetes involve many genes, and these act through multiple pathways and other target related diseases. Using CTD software the diseases, pathways and biological
FluorophoreTarget gene
Treatment groups
Cq or CtCq or Ct
MeanCq or Ct Std. Dev
SYBR GLUT4 Control 16.44 16.44 0SYBR GLUT4 Control 17 17 0SYBR GLUT4 Control 16.8 16.8 0SYBR GLUT4 1 ng 15.34 15.34 0SYBR GLUT4 1 ng 16.19 16.19 0SYBR GLUT4 1 pg 16.83 16.83 0SYBR GLUT4 1 pg 17.13 17.13 0SYBR GLUT4 100 pg 16.87 16.87 0SYBR GLUT4 100 pg 16.45 16.45 0SYBR GLUT4 100 pg 15.95 15.95 0SYBR GLUT4 100 ng 16.02 16.02 0SYBR GLUT4 100 ng 14.7 14.7 0SYBR GLUT4 100 ng 15.68 15.68 0SYBR IRS1 Control 16.46 16.46 0SYBR IRS1 Control 16.94 16.94 0SYBR IRS1 Control 16.61 16.61 0SYBR IRS1 1 ng 15.77 15.77 0SYBR IRS1 1 ng 16.11 16.11 0SYBR IRS1 1 ng 15.83 15.83 0SYBR IRS1 1 pg 16.55 16.55 0SYBR IRS1 1 pg 16.89 16.89 0SYBR IRS1 100 pg 18.01 18.01 0SYBR IRS1 100 pg 16.87 16.87 0SYBR IRS1 100 pg 16.65 16.65 0SYBR IRS1 100 ng 15.25 15.25 0SYBR IRS1 100 ng 14.75 14.75 0SYBR IRS1 100 ng 15.71 15.71 0SYBR IRS2 Control 17.23 17.23 0SYBR IRS2 Control 16.35 16.35 0SYBR IRS2 1 ng 15.93 15.93 0SYBR IRS2 1 ng 16.03 16.03 0SYBR IRS2 1 pg 17.14 17.14 0SYBR IRS2 1 pg 18.09 18.09 0SYBR IRS2 100 pg 17.3 17.3 0SYBR IRS2 100 pg 17.59 17.59 0SYBR IRS2 100 ng 14.62 14.62 0SYBR IRS2 100 ng 15.11 15.11 0SYBR β-actin 100 ng 18.41 18.41 0SYBR β-actin 1 ng 17.76 17.76 0SYBR β-actin 1 pg 20.31 20.31 0SYBR β-actin 100 pg 22.62 22.62 0SYBR β-actin 100 ng 17.37 17.37 0SYBR β-actin 1 ng 19.12 19.12 0SYBR β-actin 1 pg 20.34 20.34 0SYBR β-actin 100 pg 22.18 22.18 0SYBR β-actin Control 17.87 17.87 0SYBR β-actin 100 ng 18.21 18.21 0SYBR β-actin 1 ng 17.95 17.95 0SYBR β-actin 100 pg 22.45 22.45 0SYBR β-actin Control 18.14 18.14 0
Table 5: RT PCR raw data.
Figure 5: Relative expression of IRS1 gene in untreated and treated umbilical cord cells.
Figure 6: Relative expression of IRS2 gene in untreated and treated umbilical cord cells.
Figure 7: Relative expression of GLUT4 gene in untreated and treated umbilical cord cells.

Citation: Raghavan PR (2018) Umbilical Cord Cells Treatment with Metadichol® IRS Proteins and GLUT4 Expression and Implications for diabetes. Stem Cell Res Ther 8: 429. doi: 10.4172/2157-7633.1000429
Page 5 of 9
Volume 8 • Issue 6 • 1000429J Stem Cell Res Ther, an open access journalISSN: 2157-7633
Pathway Pathway ID P-value Annotated Genes Quantity Annotated GenesType II diabetes mellitus KEGG:hsa04930 5.85E-12 4 IRS1, IRS2, SLC2A4, TNFAdipocytokine signaling pathway KEGG:hsa04920 3.10E-11 4 IRS1, IRS2, SLC2A4, TNFInsulin resistance KEGG:hsa04931 1.85E-10 4 IRS1, IRS2, SLC2A4, TNFIRS activation REACT:R-HSA-74713 1.09E-07 2 IRS1, IRS2AMPK signaling pathway KEGG:hsa04152 2.15E-07 3 IRS1, IRS2, SLC2A4FoxO signaling pathway KEGG:hsa04068 2.86E-07 3 IRS1, IRS2, SLC2A4Insulin signaling pathway KEGG:hsa04910 3.27E-07 3 IRS1, IRS2, SLC2A4Non-alcoholic fatty liver disease (NAFLD) KEGG:hsa04932 4.12E-07 3 IRS1, IRS2, TNFSignal attenuation REACT:R-HSA-74749 4.92E-07 2 IRS1, IRS2Developmental Biology REACT:R-HSA-1266738 1.95E-06 4 IRS1, IRS2, SLC2A4, TNFGrowth hormone receptor signaling REACT:R-HSA-982772 3.28E-06 2 IRS1, IRS2Regulation of lipolysis in adipocytes KEGG:hsa04923 1.56E-05 2 IRS1, IRS2Signaling by Interleukins REACT:R-HSA-449147 1.84E-05 3 IRS1, IRS2, TNFLongevity regulating pathway-multiple species KEGG:hsa04213 2.06E-05 2 IRS1, IRS2Constitutive Signaling by Aberrant PI3K in Cancer REACT:R-HSA-2219530 2.27E-05 2 IRS1, IRS2PI3K Cascade REACT:R-HSA-109704 3.36E-05 2 IRS1, IRS2PI5P, PP2A and IER3 Regulate PI3K/AKT Signaling REACT:R-HSA-6811558 4.07E-05 2 IRS1, IRS2Transcriptional regulation of white adipocyte differentiation REACT:R-HSA-381340 4.17E-05 2 SLC2A4, TNFLongevity regulating pathway KEGG:hsa04211 4.26E-05 2 IRS1, IRS2PI3K/AKT Signaling in Cancer REACT:R-HSA-2219528 4.36E-05 2 IRS1, IRS2Negative regulation of the PI3K/AKT network REACT:R-HSA-199418 4.76E-05 2 IRS1, IRS2AGE-RAGE signaling pathway in diabetic complications KEGG:hsa04933 5.28E-05 2 SERPINE1, TNFCytokine Signaling in Immune system REACT:R-HSA-1280215 5.44E-05 3 IRS1, IRS2, TNFChagas disease (American trypanosomiasis) KEGG:hsa05142 5.61E-05 2 SERPINE1, TNF
Table 6: Pathways table.
OntologyHighest
GO LevelGO Term Name GO Term ID P-value
Annotated Genes Quantity
Annotated Genes
Biological Process 9 glucose import GO:0046323 4.85E-11 4 IRS1,IRS2,SLC2A4,TNF
Biological Process 8 glucose transmembrane transport GO:1904659 1.99E-10 4 IRS1,IRS2,SLC2A4,TNF
Biological Process 7 hexose transmembrane transport GO:0008645 2.84E-10 4 IRS1,IRS2,SLC2A4,TNF
Biological Process 6 monosaccharide transmembrane transport GO:0015749 3.04E-10 4 IRS1,IRS2,SLC2A4,TNF
Biological Process 5 carbohydrate transmembrane transport GO:0034219 3.25E-10 4 IRS1,IRS2,SLC2A4,TNF
Biological Process 5 carbohydrate transport GO:0008643 7.45E-10 4 IRS1,IRS2,SLC2A4,TNF
Biological Process 4cellular response to oxygen-containing compound
GO:1901701 7.31E-09 5 IRS1,IRS2,SERPINE1,SLC2A4,TNF
Biological Process 4 regulation of lipid catabolic process GO:0050994 1.50E-08 3 IRS1,IRS2,TNF
Biological Process 6 regulation of glucose import GO:0046324 4.01E-08 3 IRS1,IRS2,TNF
Biological Process 3 response to oxygen-containing compound GO:1901700 4.95E-08 5 IRS1,IRS2,SERPINE1,SLC2A4,TNF
Biological Process 5 regulation of glucose transmembrane transport GO:0010827 8.11E-08 3 IRS1,IRS2,TNF
Biological Process 4 cellular response to organonitrogen compound GO:0071417 1.11E-07 4 IRS1,IRS2,SLC2A4,TNF
Biological Process 3 carbohydrate metabolic process GO:0005975 1.58E-07 4 IRS1,IRS2,SLC2A4,TNF
Biological Process 4 cellular response to nitrogen compound GO:1901699 2.19E-07 4 IRS1,IRS2,SLC2A4,TNF
Biological Process 3 positive regulation of lipid metabolic process GO:0045834 2.37E-07 3 IRS1,IRS2,TNF
Biological Process 5 positive regulation of fatty acid beta-oxidation GO:0032000 3.94E-07 2 IRS1,IRS2
Biological Process 5 positive regulation of protein kinase B signaling GO:0051897 4.92E-07 3 IRS1,IRS2,TNF
Biological Process 3positive regulation of small molecule metabolic process
GO:0062013 5.81E-07 3 IRS1,IRS2,TNF
Biological Process 5 regulation of insulin secretion GO:0050796 5.92E-07 3 IRS1,IRS2,TNF
Biological Process 4 cellular response to organic substance GO:0071310 6.84E-07 5 IRS1,IRS2,SERPINE1,SLC2A4,TNF
Biological Process 2 positive regulation of transport GO:0051050 8.06E-07 4 IRS1,IRS2,SERPINE1,TNF
Biological Process 5 glucose metabolic process GO:0006006 8.31E-07 3 IRS1,IRS2,TNF
Biological Process 4 response to organonitrogen compound GO:0010243 8.68E-07 4 IRS1,IRS2,SLC2A4,TNF
Biological Process 6 cellular response to insulin stimulus GO:0032869 9.13E-07 3 IRS1,IRS2,SLC2A4
Biological Process 4 insulin secretion GO:0030073 9.71E-07 3 IRS1,IRS2,TNF

Citation: Raghavan PR (2018) Umbilical Cord Cells Treatment with Metadichol® IRS Proteins and GLUT4 Expression and Implications for diabetes. Stem Cell Res Ther 8: 429. doi: 10.4172/2157-7633.1000429
Page 6 of 9
Volume 8 • Issue 6 • 1000429J Stem Cell Res Ther, an open access journalISSN: 2157-7633
Biological Process 4 regulation of peptide hormone secretion GO:0090276 9.86E-07 3 IRS1,IRS2,TNF
Biological Process 5 positive regulation of fatty acid oxidation GO:0046321 9.95E-07 2 IRS1,IRS2
Biological Process 3 response to hormone GO:0009725 1.07E-06 4 IRS1,IRS2,SLC2A4,TNF
Biological Process 5 carbohydrate homeostasis GO:0033500 1.13E-06 3 IRS1,IRS2,SLC2A4
Biological Process 6 glucose homeostasis GO:0042593 1.13E-06 3 IRS1,IRS2,SLC2A4
Biological Process 5positive regulation of glycogen biosynthetic process
GO:0045725 1.31E-06 2 IRS1,IRS2
Biological Process 5 regulation of fatty acid beta-oxidation GO:0031998 1.31E-06 2 IRS1,IRS2
Biological Process 5 regulation of protein kinase B signaling GO:0051896 1.33E-06 3 IRS1,IRS2,TNF
Biological Process 3 response to nitrogen compound GO:1901698 1.38E-06 4 IRS1,IRS2,SLC2A4,TNF
Biological Process 4 hexose metabolic process GO:0019318 1.39E-06 3 IRS1,IRS2,TNF
Biological Process 5 cellular response to cytokine stimulus GO:0071345 1.61E-06 4 IRS1,IRS2,SLC2A4,TNF
Biological Process 4positive regulation of glycogen metabolic process
GO:0070875 1.67E-06 2 IRS1,IRS2
Biological Process 5 peptide hormone secretion GO:0030072 1.71E-06 3 IRS1,IRS2,TNF
Biological Process 3 cellular response to chemical stimulus GO:0070887 1.72E-06 5 IRS1,IRS2,SERPINE1,SLC2A4,TNF
Biological Process 3 response to organic substance GO:0010033 1.86E-06 5 IRS1,IRS2,SERPINE1,SLC2A4,TNF
Biological Process 5 response to insulin GO:0032868 1.89E-06 3 IRS1,IRS2,SLC2A4
Biological Process 4 protein kinase B signaling GO:0043491 2.05E-06 3 IRS1,IRS2,TNF
Biological Process 3 regulation of hormone secretion GO:0046883 2.05E-06 3 IRS1,IRS2,TNF
Biological Process 4 response to cytokine GO:0034097 2.11E-06 4 IRS1,IRS2,SLC2A4,TNF
Biological Process 3 monosaccharide metabolic process GO:0005996 2.23E-06 3 IRS1,IRS2,TNF
Biological Process 4 positive regulation of lipid catabolic process GO:0050996 2.29E-06 2 IRS1,IRS2
Biological Process 4positive regulation of mononuclear cell migration
GO:0071677 2.52E-06 2 SERPINE1,TNF
Biological Process 2 regulation of biological quality GO:0065008 3.00E-06 5 IRS1,IRS2,SERPINE1,SLC2A4,TNF
Biological Process 4 lipid catabolic process GO:0016042 3.15E-06 3 IRS1,IRS2,TNF
Biological Process 4 hormone secretion GO:0046879 3.31E-06 3 IRS1,IRS2,TNF
Biological Process 5 cellular response to peptide hormone stimulus GO:0071375 3.35E-06 3 IRS1,IRS2,SLC2A4
Biological Process 7 glucose import in response to insulin stimulus GO:0044381 3.55E-06 2 IRS1,SLC2A4
Biological Process 4 hormone transport GO:0009914 3.70E-06 3 IRS1,IRS2,TNF
Biological Process 5 regulation of glucan biosynthetic process GO:0010962 3.83E-06 2 IRS1,IRS2
Biological Process 6 regulation of glycogen biosynthetic process GO:0005979 3.83E-06 2 IRS1,IRS2
Biological Process 4 positive regulation of cellular catabolic process GO:0031331 3.95E-06 3 IRS1,IRS2,TNF
Biological Process 3 cellular response to endogenous stimulus GO:0071495 3.97E-06 4 IRS1,IRS2,SLC2A4,TNF
Biological Process 5 regulation of fatty acid oxidation GO:0046320 4.13E-06 2 IRS1,IRS2
Biological Process 5 interleukin-7-mediated signaling pathway GO:0038111 4.75E-06 2 IRS1,IRS2
Biological Process 5 cellular response to peptide GO:1901653 5.01E-06 3 IRS1,IRS2,SLC2A4
Biological Process 6 cellular response to interleukin-7 GO:0098761 5.08E-06 2 IRS1,IRS2
Biological Process 4positive regulation of fatty acid metabolic process
GO:0045923 5.08E-06 2 IRS1,IRS2
Biological Process 5 response to interleukin-7 GO:0098760 5.08E-06 2 IRS1,IRS2
Biological Process 2 secretion by cell GO:0032940 5.14E-06 4 IRS1,IRS2,SERPINE1,TNF
Biological Process 5 regulation of glycogen metabolic process GO:0070873 5.42E-06 2 IRS1,IRS2
Biological Process 4 regulation of lipid metabolic process GO:0019216 5.79E-06 3 IRS1,IRS2,TNF
Biological Process 5regulation of polysaccharide biosynthetic process
GO:0032885 6.13E-06 2 IRS1,IRS2
Biological Process 3 positive regulation of catabolic process GO:0009896 6.14E-06 3 IRS1,IRS2,TNF
Biological Process 4 transmembrane transport GO:0055085 6.49E-06 4 IRS1,IRS2,SLC2A4,TNF
Biological Process 4positive regulation of glucose metabolic process
GO:0010907 6.50E-06 2 IRS1,IRS2
Table 7: Biological processes.

Citation: Raghavan PR (2018) Umbilical Cord Cells Treatment with Metadichol® IRS Proteins and GLUT4 Expression and Implications for diabetes. Stem Cell Res Ther 8: 429. doi: 10.4172/2157-7633.1000429
Page 7 of 9
Volume 8 • Issue 6 • 1000429J Stem Cell Res Ther, an open access journalISSN: 2157-7633
Disease Name P-value Annotated Genes Quantity Annotated Genes
Diabetes Mellitus, Experimental 9.35E-14 5 IRS1, IRS2, SERPINE1, SLC2A4, TNF
Insulin Resistance 2.43E-11 4 IRS1, IRS2, SLC2A4, TNF
Diabetes Mellitus 4.78E-11 5 IRS1, IRS2, SERPINE1, SLC2A4, TNF
Hyperinsulinism 5.11E-11 4 IRS1, IRS2, SLC2A4, TNF
Glucose Metabolism Disorders 5.40E-11 5 IRS1, IRS2, SERPINE1, SLC2A4, TNF
Diabetes Mellitus, Type 2 2.27E-09 4 IRS1, IRS2, SLC2A4, TNF
Endocrine System Diseases 9.94E-09 5 IRS1, IRS2, SERPINE1, SLC2A4, TNF
Liver Neoplasms 4.68E-08 4 IRS1, IRS2, SERPINE1, TNF
Metabolic Diseases 5.36E-08 5 IRS1, IRS2, SERPINE1, SLC2A4, TNF
Nutritional and Metabolic Diseases 7.80E-08 5 IRS1, IRS2, SERPINE1, SLC2A4, TNF
Arteriosclerosis 1.94E-07 3 IRS1, SERPINE1, TNF
Arterial Occlusive Diseases 2.31E-07 3 IRS1, SERPINE1, TNF
Overweight 8.99E-07 3 IRS1, SERPINE1, TNF
Heart Diseases 9.75E-07 4 IRS1, SERPINE1, SLC2A4, TNF
Obesity 1.11E-06 3 IRS1, SERPINE1, TNF
Over-nutrition 1.11E-06 3 IRS1, SERPINE1, TNF
Carcinoma, Hepatocellular 1.69E-06 3 IRS1, IRS2, TNF
Nutrition Disorders 2.20E-06 3 IRS1, SERPINE1, TNF
Digestive System Neoplasms 2.37E-06 4 IRS1, IRS2, SERPINE1, TNF
Stomach Neoplasms 2.93E-06 3 IRS2, SERPINE1, TNF
Stomach Diseases 3.66E-06 3 IRS2, SERPINE1, TNF
Cardiovascular Diseases 4.01E-06 4 IRS1, SERPINE1, SLC2A4, TNF
Body Weight 4.03E-06 3 IRS1, SERPINE1, TNF
Liver Diseases 1.02E-05 4 IRS1, IRS2, SERPINE1, TNF
Kidney Failure, Chronic 1.18E-05 2 SERPINE1, TNF
Skin Diseases, Vascular 1.28E-05 2 SERPINE1, TNF
Renal Insufficiency, Chronic 1.39E-05 2 SERPINE1, TNF
Atherosclerosis 1.68E-05 2 SERPINE1, TNF
Thrombosis 2.06E-05 2 SERPINE1, TNF
Table 8: Diseases.
Figure 8: Metadichol’s proposed mechanism of action.
Figure 9: Metadichol expressed gene network.
process [31] impacted by IRS, IRS2, TNF, SERPINE1 (PAI1) and GLUT4 (SLC2A4) are shown in Tables 6-8.
The highly significant p values suggest that the genes have more interactions among themselves than what would be expected for a random set of proteins of similar size, drawn from the genome. Such enrichment indicates that the proteins are biologically connected, as a group. The curated experimental results indicate that the disease

Citation: Raghavan PR (2018) Umbilical Cord Cells Treatment with Metadichol® IRS Proteins and GLUT4 Expression and Implications for diabetes. Stem Cell Res Ther 8: 429. doi: 10.4172/2157-7633.1000429
Page 8 of 9
Volume 8 • Issue 6 • 1000429J Stem Cell Res Ther, an open access journalISSN: 2157-7633
predictions correlate with experimental results that clinical case studies we have reported [18,32-35]. The top 5 processes of pathways, biological processes and diseases are all pointing to a clear role in diabetes-related symptoms.
Based on a proposed model by Benito [36] on this we postulate Metadichol’s mode of actions in diabetes as shown in Figure 8. The mechanism shows that downfield genes like IGF1, AKT1, PIK and GSK3 have important roles by their interactions with the Metadichol expressed genes.
We further analysed the gene cluster (Figure 9) using CoolGen software [37] which shows the importance of the interactions of genes/enzymes. Based on our proposed mechanism (Figure 8) the key genes/enzymes, IRS, IRS2, SLC2A4, IGF, PI3k, INSR, GSK3 are highly connected to multiple genes and enzymes that have an important role in insulin signaling. The network also suggests that it will be useful in cardiovascular diseases (CVD) and kidney diseases and we have confirmed through clinical case studies, Metadichol’s role in these diseases as well [38,39].
ConclusionSince adult stem cells are present in PBMCs which have similar
expression profiles to UBC [40], one could expect similar actions by Metadichol on these cells leading to observed improvements that we have documented in diabetes patients [21-23]. The study shows highly related biologically functional gene clusters are the key in targeting diseases. A paradigm shift has been proposed in designing drug design from “one drug one target” to “one drug multiple targets” [41-43]. Our results show that network-based approach clearly seems to be more viable [44-46]. Our work reveals the unique complex interactions between Metadichol which is a nano formulation of mixture of straight chain aliphatic alcohols and cellular proteins but also the influence of their interactions on the function and behaviour of the system. Metadichol is the first in a class of molecules that targets multiple genes and through multiple pathways and thus multiple disease targets which could be the next wave of the future of drug discovery [47].
References
1. Weir GC, Cavelti-Weder C, Bonner-Weir S (2011) Stem cell approaches for diabetes: towards beta cell replacement. Genome Medicine 3: 61.
2. Bernardi S, Severini GM, Zauli G, Secchiero P (2012) Cell-based therapies for diabetic complications. Exp Diabetes Res, Vol. 2012.
3. Arutyunyan I, Elchaninov A, Makarov A, Fatkhudinov T (2016) Umbilical Cord as Prospective Source for Mesenchymal Stem Cell-Based Therapy. Stem Cells Int, Vol. 2016.
4. Pittenger MF, Mackay AM, Beck SC, Jaiswal RK, Douglas R, et al. (1999) Multilineage potential of adult human mesenchymal stem cells. Science 284: 143-147.
5. Salem HK, Thiemermann C (2010) Mesenchymal stromal cells: current understanding and clinical status. Stem Cells 28: 585-596.
6. Pileggi A (2012) Mesenchymal stem cells for the treatment of diabetes. Diabetes 61: 1355-1336.
7. Si Y, Zhao Y, Hao H, Liu J, Guo Y, et al. (2012) Infusion of mesenchymal stem cells ameliorates hyperglycemia in type 2 diabetic rats: identification of a novel role in improving insulin sensitivity. Diabetes 61: 1616-1625.
8. Huang S, Czech MP (2007) The GLUT4 Glucose Transporter. Cell Metabolism 5: 237-252.
9. Herman MA, Kahn BB (2006) Glucose transport and sensing in the maintenance of glucose homeostasis and metabolic harmony. J Clin Invest 116: 1767-1775.
10. Tolar J, Nauta AJ, Osborn MJ, Mortari AP, McElmurry RT, et al. (2007) Sarcoma derived from cultured mesenchymal stem cells. Stem Cells 25: 371-379.
11. Mottaghi S, Larijani B, Sharifi AM (2012) A novel approach to enhance efficacy of hypoxic preconditioned mesenchymal stem cells for cell therapy of diabetes. Med Hypotheses 79: 717-718.
12. Staerk J, Dawlaty MM, Gao Q, Maetzel D, Hanna J, et al. (2010) Reprogramming of human peripheral blood cells to induced pluripotent stem cells. Cell Stem Cell 7: 20-24.
13. Copps KD, White MF (2012) Regulation of insulin sensitivity by serine/threonine phosphorylation of insulin receptor substrate proteins IRS1 and IRS2. Diabetologia 55: 2565-2582.
14. White MF(2006) Regulating insulin signaling and b-cell function through IRS proteins. Can J Physiol Pharmacol 84: 725-737.
15. Samuel VT, Shulman GI (2012) Mechanisms for insulin resistance: common threads and missing links. Cell 148: 852-871.
16. Boura-Halfon S, Zick Y (2009) Phosphorylation of IRS proteins, insulin action, and insulin resistance. Am J Physiol Endocrinol Metab 296: 581-591.
17. Kahn SE, Hull RL, Utzschneider KM (2006) Mechanisms linking obesity to insulin resistance and type 2 diabetes. Nature 444: 840-846.
18. Raghavan PR, US Patents: 8,722,093 (2014); 9,034,383 (2015); 9,006,292 (2015).
19. Raghavan PR (2018) Metadichol® and CD34 Expression in Umbilical Cord Cells. J Stem Cell Res Ther 8: 409.
20. Raghavan PR (2016) Metadichol and Type 2 Diabetes A case report. Journal of the Science of Healing Outcomes 8: 5-10.
21. Raghavan PR (2010) Case Report of Type1. Diabetes. Journal of the Science of Healing Outcomes 2: 24.
22. Raghavan PR (2018) Metadichol® and Healthy Skin: One Approach many Possible Cures. J Clin Exp Dermatol Res 9:1.
23. Lavin DP, White MF, Brazil DP (2016) IRS proteins and diabetic complications. Diabetologia 59: 2280-2291.
24. Withers DJ (1999) IRS-2 coordinates IGF-1 receptor-mediated beta-cell development and peripheral insulin signaling. Nat Genet 23: 32-40.
25. Kampmann U, Christensen B, Nielsen TS, Pedersen SB, Ørskov L, et al. (2011) GLUT4 and UBC9 Protein Expression Is Reduced in Muscle from Type 2 Diabetic Patients with Severe Insulin Resistance. PLoS One 6: e27854.
26. Akash MSH, Rehman K, Liaqat A (2018) Tumor Necrosis Factor-Alpha: Role in Development of Insulin Resistance and Pathogenesis of Type 2 Diabetes Mellitus. J Cell Biochem 119: 105-110.
27. Juhan-Vague I, Vague P, Alessi MC, Badier C, Valadier J, et al. (1987) Relationships between plasma insulin triglyceride, body mass index, and plasminogen activator inhibitor-1. Diabete Metab 13: 331-336.
28. Vague P, Juhan-Vague I, Aillaud MF, Badier C, Viard R, et al. (1986) Correlation between blood fibrinolytic activity, plasminogen activator inhibitor level, plasma insulin level, and relative body weight in normal and obese subjects. Metabolism 35: 250-253.
29. U Smith (2002) Impaired (‘diabetic’) insulin signaling and action occur in fat cells long before glucose intolerance. Is insulin resistance initiated in the adipose tissue? Int J Obes Relat Metab Disord 26: 897-904.
30. Davis AP, Grondin CJ, Johnson RJ, Sciaky D, King BL, et al. (2017) The Comparative Toxicogenomics Database: update 2017. Nucleic Acids Res 45: D972-D978.
31. Curated data were retrieved from the Comparative Toxicogenomics Database (CTD), MDI Biological Laboratory, Salisbury Cove, Maine, and NC State University, Raleigh, North Carolina. World Wide Web (URL: http://ctdbase.org/). (May 2018).
32. Raghavan PR (2017) Systolic and Diastolic BP Control in Metabolic Syndrome Patients with Metadichol® a Novel Nano Emulsion Lipid. J Cardiol & Cardiovasc Ther 5: 555660.
33. Raghavan PR (2017) Metadichol® Induced High Levels of Vitamin C: Case Studies. Vitam Miner 6: 169.
34. Raghavan PR (2017) Metadichol® and Red Cell Distribution Width (RDW) in CKD patients. J Stem Cell Res Ther 7: 392.
Citation: Raghavan PR (2018) Umbilical Cord Cells Treatment with Metadichol® IRS Proteins and GLUT4 Expression and Implications for diabetes. Stem Cell Res Ther 8: 429. doi: 10.4172/2157-7633.1000429
Page 9 of 9
Volume 8 • Issue 6 • 1000429J Stem Cell Res Ther, an open access journalISSN: 2157-7633
35. Raghavan PR (2017) Metadichol® and Vitamin C Increase In Vivo, an Open-Label Study. Vitam Miner 6: 163.
36. Benito M (2011) Tissue specificity on insulin action and resistance: past to recent mechanisms. Acta Physiol 201: 297-312.
37. Cancer Research Institute of Southern Medical University. http://ci.smu.edu.cn/CooLGeN/Home.php.
38. Raghavan PR (2017) Systolic and Diastolic BP Control in Metabolic Syndrome Patients with Metadichol® a Novel Nano Emulsion Lipid. J Cardiol & Cardiovasc Ther 5(2): 555660.
39. Raghavan PR (2017) Metadichol® and Red Cell Distribution Width (RDW) in CKD patients. J Stem Cell Res Ther 7: 392.
40. Salomon H, Belmonte A, Nguyen K, Gu Z, Gelfand M, et al. (1994) Comparison of cord blood and peripheral blood mononuclear cells as targets for viral isolation and drug sensitivity studies involving human immunodeficiency virus type 1. J Clin Microbiol 32: 2000-2002.
41. Hopkins AL (2008) Network pharmacology: the next paradigm in drug discovery. Nat Chem Biol 4: 682-690.
42. Hopkins AL (2009) Drug discovery: Predicting promiscuity. Nature 462: 167-168.
43. Apsel B, Blair JA, Gonzalez B, Nazif TM, Feldman ME, et al. (2008) Targeted polypharmacology: discovery of dual inhibitors of tyrosine and phosphoinositide kinases. Nat Chem Biol 4: 691-699.
44. Carson MB, Liu C, Lu Y, Jia C, Lu H (2017) A disease similarity matrix based on the uniqueness of shared genes. BMC Medical Genomics 10: 26.
45. Choudhary N, Singh V (2018) A census of P. longum’s phytochemicals and their network pharmacological evaluation for identifying novel drug-like molecules against various diseases, with a special focus on neurological disorders. PLoS One 13: e0191006.
46. Vitali F, Mulas F, Marini P, Bellazzi R (2013) Network-based target ranking for polypharmacological therapies. J Biomed Inform 46: 876-881.
47. Reddy AS, Zhang S (2013) Polypharmacology: drug discovery for the future. Expert Rev Clin Pharmacol 6: 41-47.