
Irrigation - Intensification - Illumination · Irrigation - Intensification - Illumination...
39
Irrigation - Intensification - Illumination Exploring Limits and Trade-Offs in Agricultural Intensification Alexander Herzig, John Dymond, Anne-Gaelle Ausseil
Transcript of Irrigation - Intensification - Illumination · Irrigation - Intensification - Illumination...
Irrigation - Intensification - Illumination
Exploring Limits and Trade-Offs in Agricultural Intensification
Alexander Herzig, John Dymond, Anne-Gaelle Ausseil
Outline
Objective
Ecosystem Services & Models
Identifying Trade-offs with LUMASS
Agricultural Intensification in the Ruamahanga
Black CreekWhite Rock
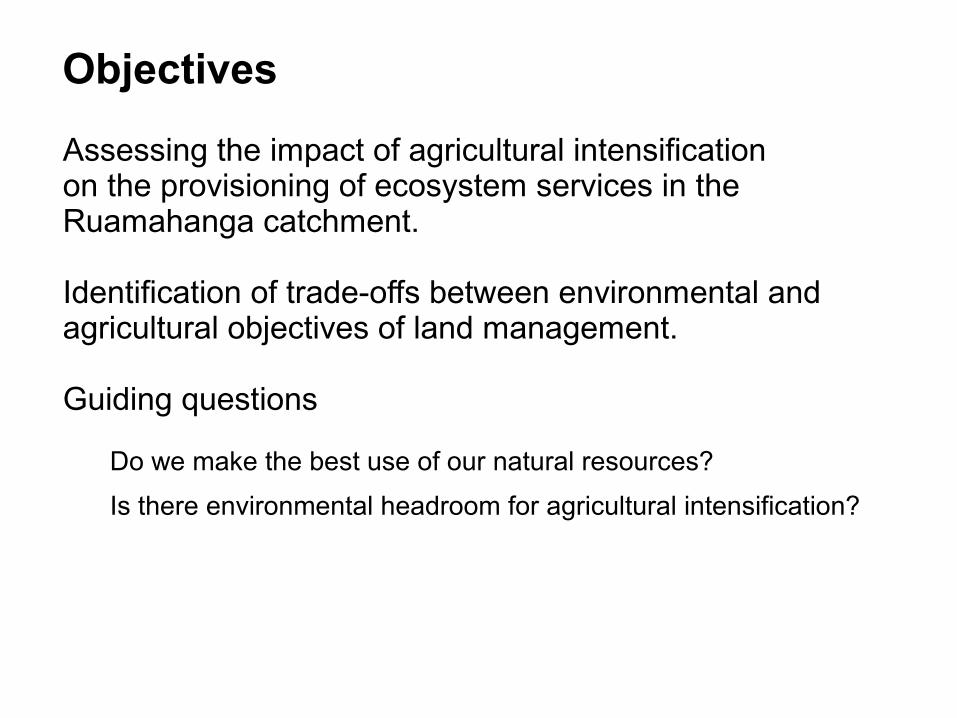
Objectives
Assessing the impact of agricultural intensification on the provisioning of ecosystem services in theRuamahanga catchment.
Identification of trade-offs between environmental andagricultural objectives of land management.
Guiding questions
Do we make the best use of our natural resources?
Is there environmental headroom for agricultural intensification?
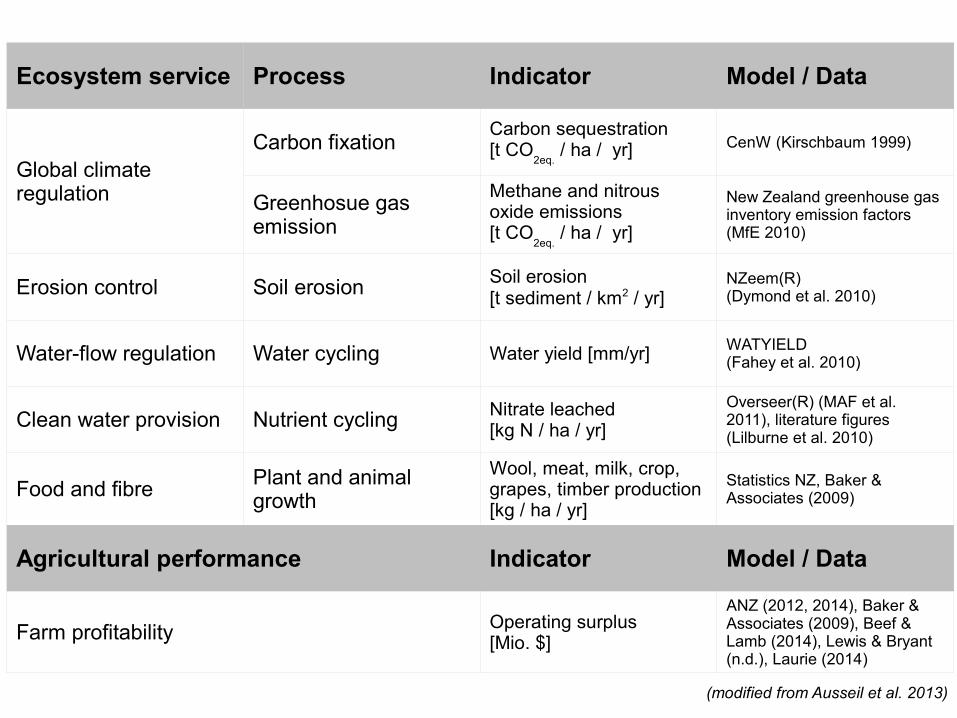
Ecosystem service Process Indicator Model / Data
Global climate regulation
Carbon fixationCarbon sequestration[t CO
2eq. / ha / yr] CenW (Kirschbaum 1999)
Greenhosue gas emission
Methane and nitrous oxide emissions[t CO
2eq. / ha / yr]
New Zealand greenhouse gas inventory emission factors (MfE 2010)
Erosion control Soil erosion Soil erosion[t sediment / km2 / yr]
NZeem(R)(Dymond et al. 2010)
Water-flow regulation Water cycling Water yield [mm/yr] WATYIELD(Fahey et al. 2010)
Clean water provision Nutrient cycling Nitrate leached[kg N / ha / yr]
Overseer(R) (MAF et al. 2011), literature figures (Lilburne et al. 2010)
Food and fibre Plant and animal growth
Wool, meat, milk, crop, grapes, timber production[kg / ha / yr]
Statistics NZ, Baker & Associates (2009)
Agricultural performance Indicator Model / Data
Farm profitability Operating surplus[Mio. $]
ANZ (2012, 2014), Baker & Associates (2009), Beef & Lamb (2014), Lewis & Bryant (n.d.), Laurie (2014)
(modified from Ausseil et al. 2013)
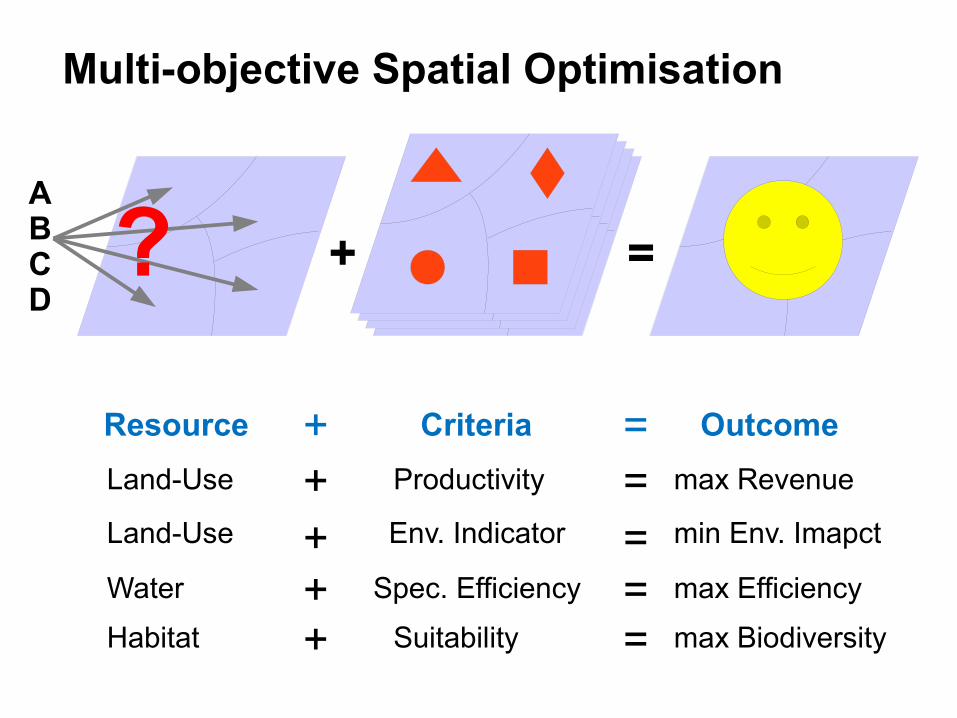
Land-Use Productivity max Revenue+ =Land-Use Env. Indicator min Env. Imapct+ =Water Spec. Efficiency max Efficiency+ =Habitat Suitability max Biodiversity+ =
Resource Criteria Outcome+ =
Multi-objective Spatial Optimisation
+ =ABCD
?
+ =
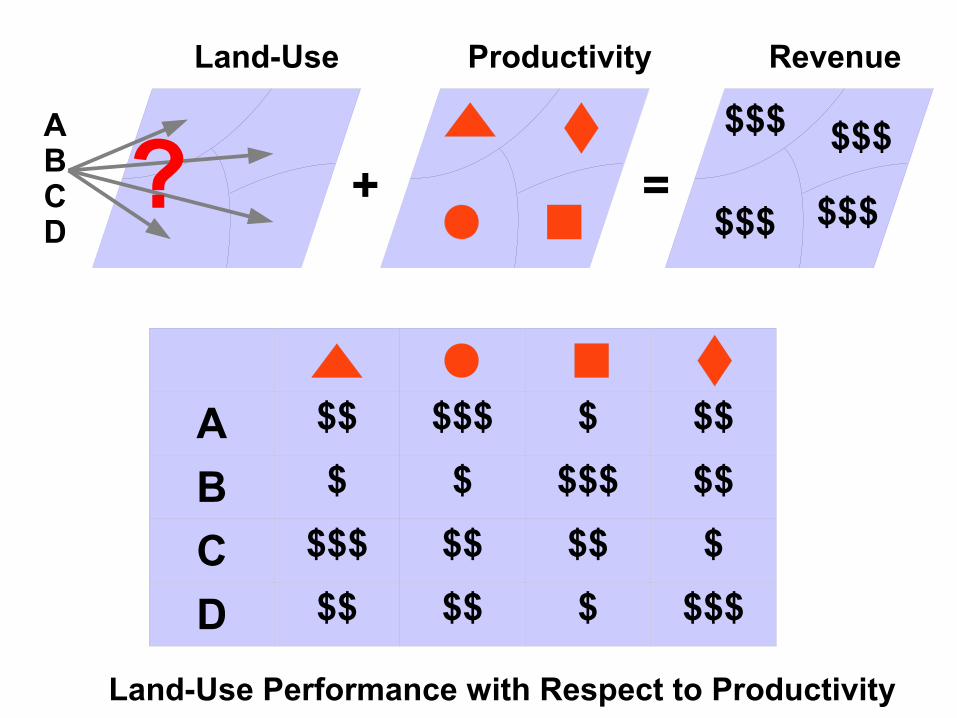
Land-Use Productivity Revenue
ABCD
?$$$
$$$
$$$
$$$
A $$ $$$ $ $$
B $ $ $$$ $$
C $$$ $$ $$ $
D $$ $$ $ $$$
Land-Use Performance with Respect to Productivity
AAAAABBD
AABBBCCCCCDD
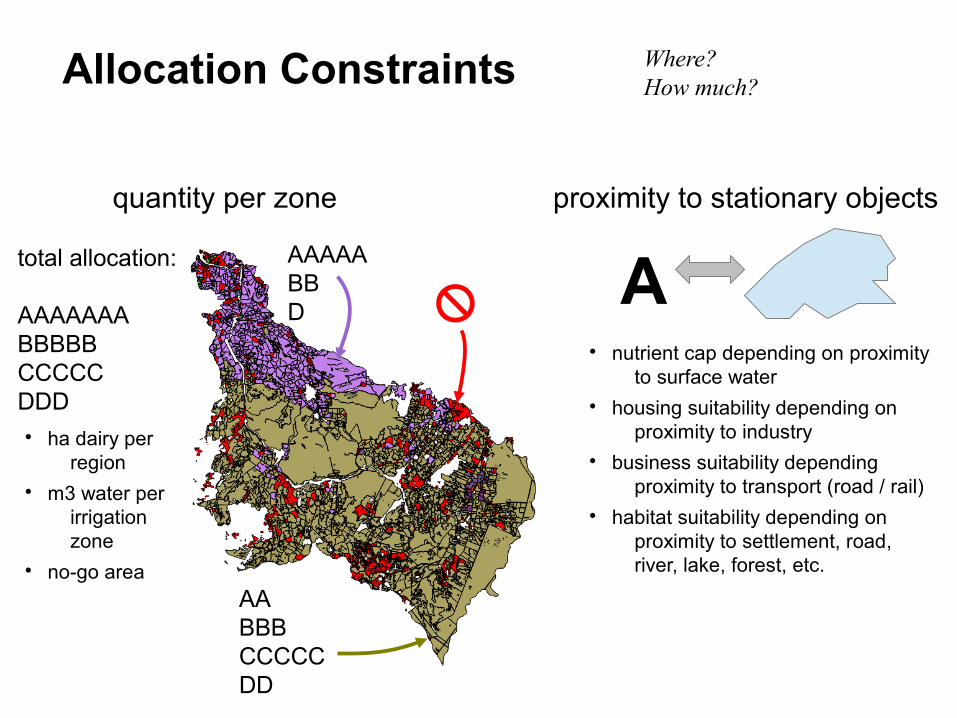
Atotal allocation:
AAAAAAABBBBBCCCCCDDD
proximity to stationary objects
nutrient cap depending on proximity to surface water
housing suitability depending on proximity to industry
business suitability depending proximity to transport (road / rail)
habitat suitability depending on proximity to settlement, road, river, lake, forest, etc.
quantity per zone
ha dairy per region
m3 water per irrigation zone
no-go area
Allocation Constraints Where?How much?
aaaaabbd
aabbbcccccdd
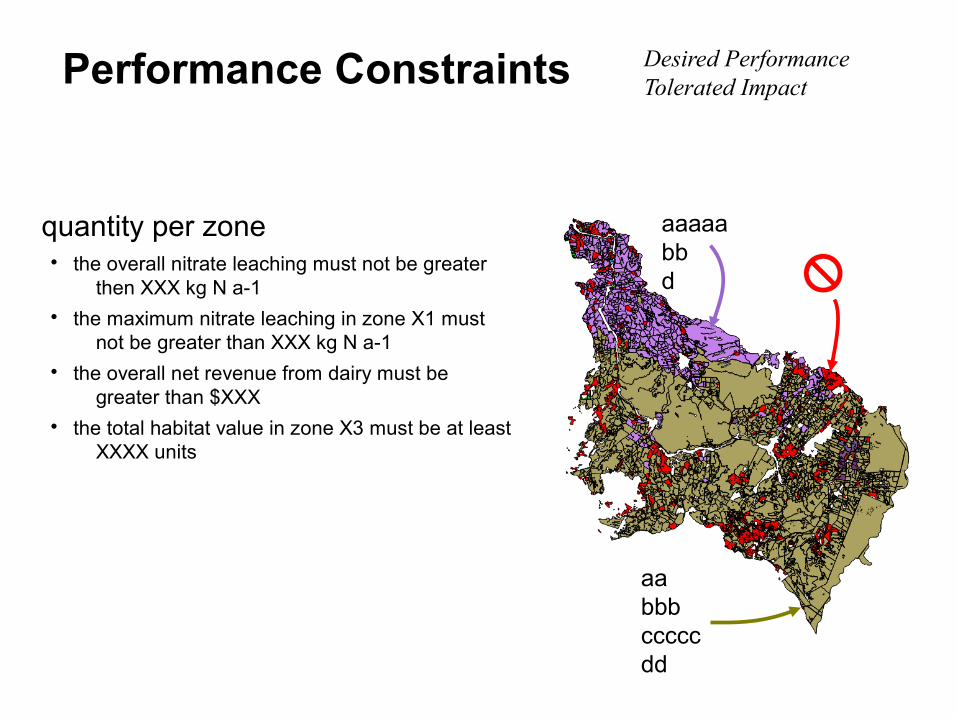
quantity per zone the overall nitrate leaching must not be greater
then XXX kg N a-1 the maximum nitrate leaching in zone X1 must
not be greater than XXX kg N a-1 the overall net revenue from dairy must be
greater than $XXX the total habitat value in zone X3 must be at least
XXXX units
Desired PerformanceTolerated ImpactPerformance Constraints
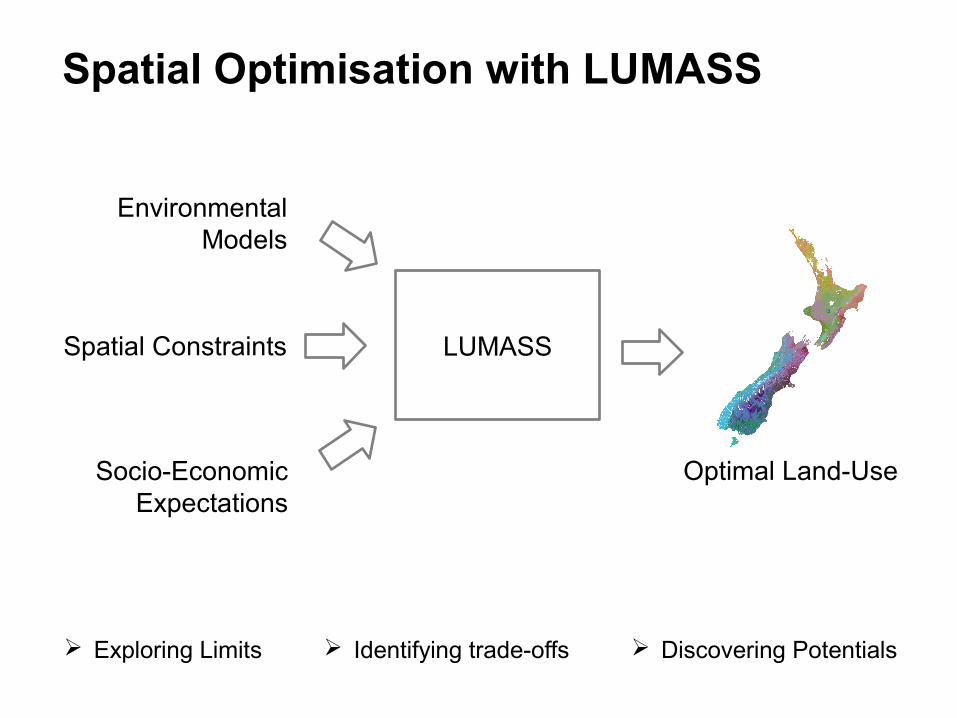
Spatial Optimisation with LUMASS
LUMASS
EnvironmentalModels
Socio-EconomicExpectations
Spatial Constraints
Exploring Limits Identifying trade-offs Discovering Potentials
Optimal Land-Use
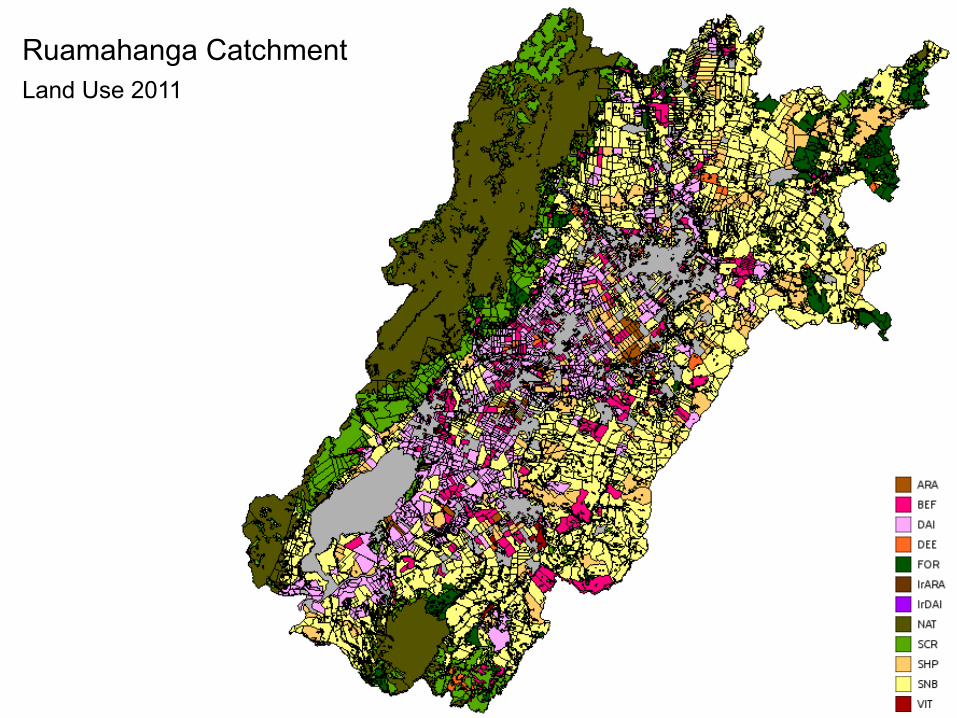
Ruamahanga CatchmentLand Use 2011
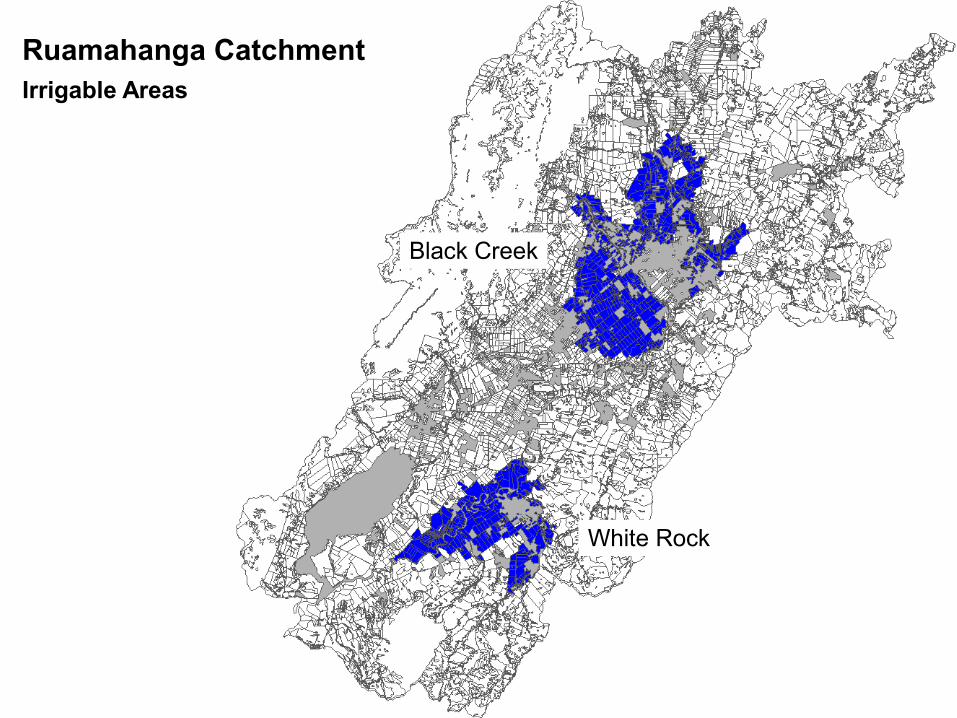
Ruamahanga CatchmentIrrigable Areas
Black Creek
White Rock
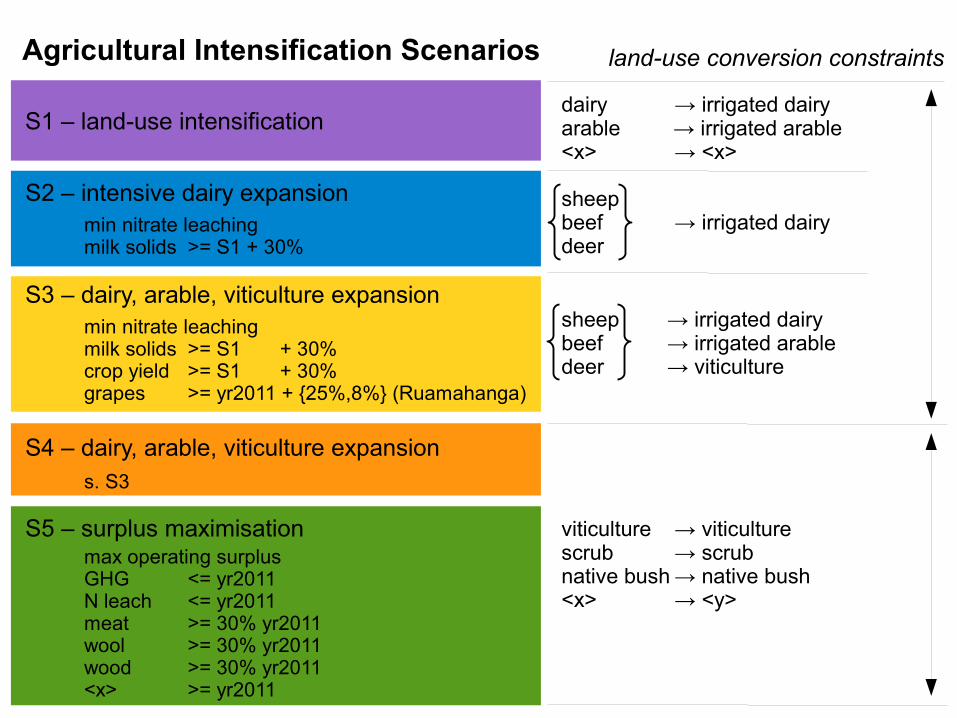
Agricultural Intensification Scenarios
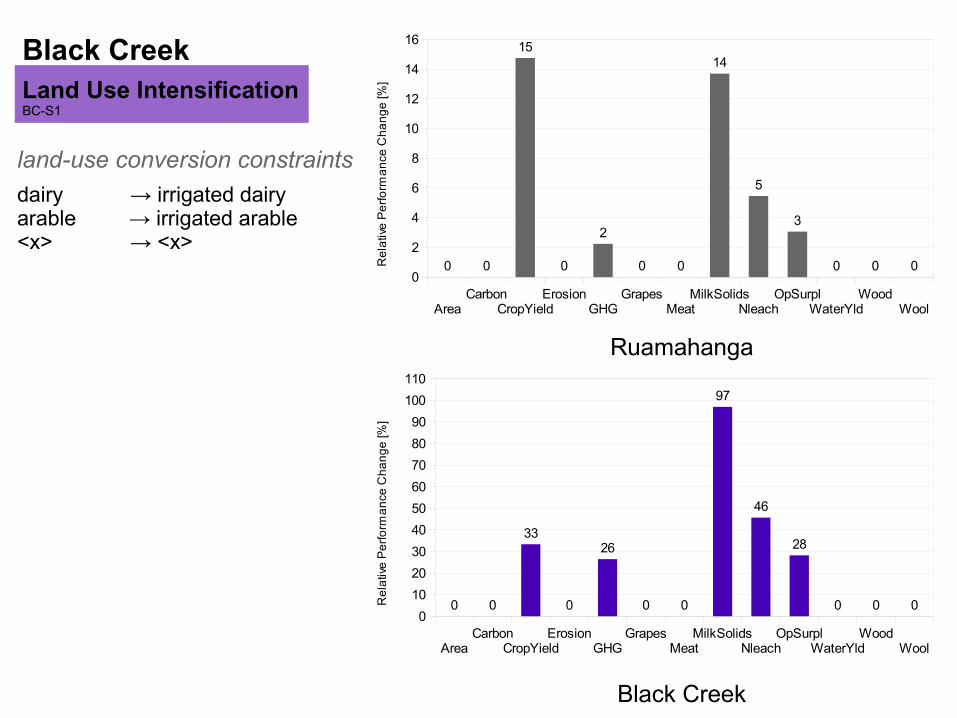
S1 – land-use intensification
S2 – intensive dairy expansion
S3 – dairy, arable, viticulture expansion
S5 – surplus maximisation
dairy → irrigated dairyarable → irrigated arable<x> → <x>
min nitrate leachingmilk solids >= S1 + 30%
min nitrate leachingmilk solids >= S1 + 30%crop yield >= S1 + 30%grapes >= yr2011 + {25%,8%} (Ruamahanga)
viticulture → viticulture scrub → scrubnative bush → native bush<x> → <y>
sheep beef → irrigated dairydeer
max operating surplus GHG <= yr2011N leach <= yr2011meat >= 30% yr2011wool >= 30% yr2011wood >= 30% yr2011<x> >= yr2011
S4 – dairy, arable, viticulture expansions. S3
land-use conversion constraints
→ irrigated dairy→ irrigated arable→ viticulture
sheep beefdeer
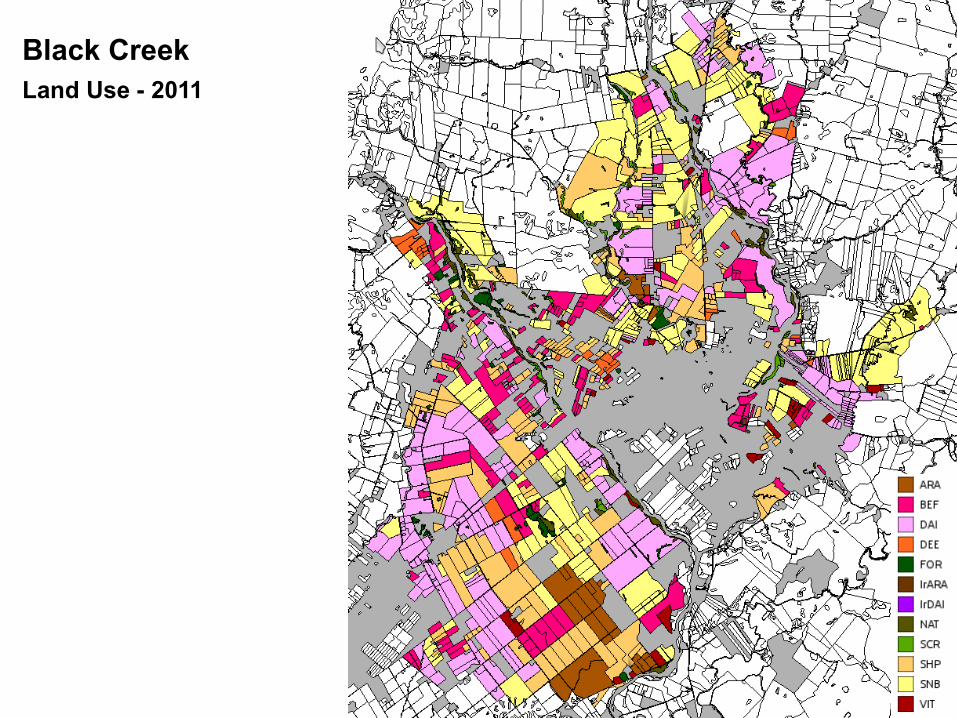
Black CreekLand Use - 2011
AreaCarbon
CropYieldErosion
GHGGrapes
MeatMilkSolids
NleachOpSurpl
WaterYldWood
Wool
0
2
4
6
8
10
12
14
16
0 0
15
0
2
0 0
14
5
3
0 0 0Re
lativ
e P
erf
orm
an
ce C
ha
ng
e [%
]
AreaCarbon
CropYieldErosion
GHGGrapes
MeatMilkSolids
NleachOpSurpl
WaterYldWood
Wool
0
10
20
30
40
50
60
70
80
90
100
110
0 0
33
0
26
0 0
97
46
28
0 0 0Re
lativ
e P
erf
orm
an
ce C
ha
ng
e [%
]
Ruamahanga
Black Creek
Black CreekLand Use IntensificationBC-S1
dairy → irrigated dairyarable → irrigated arable<x> → <x>
land-use conversion constraints
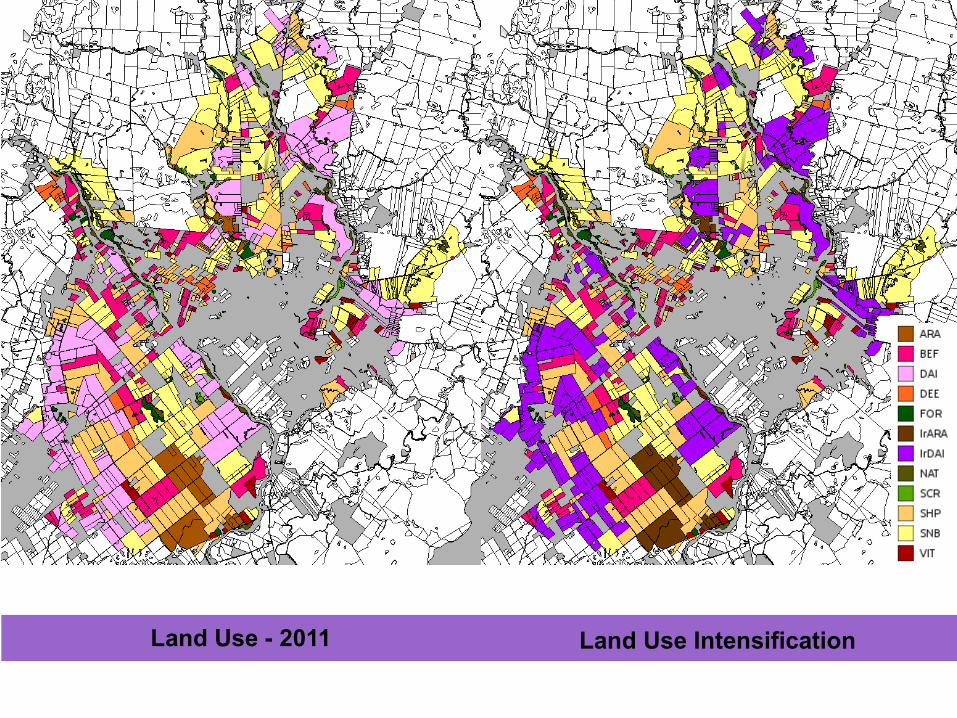
Land Use - 2011 Land Use Intensification
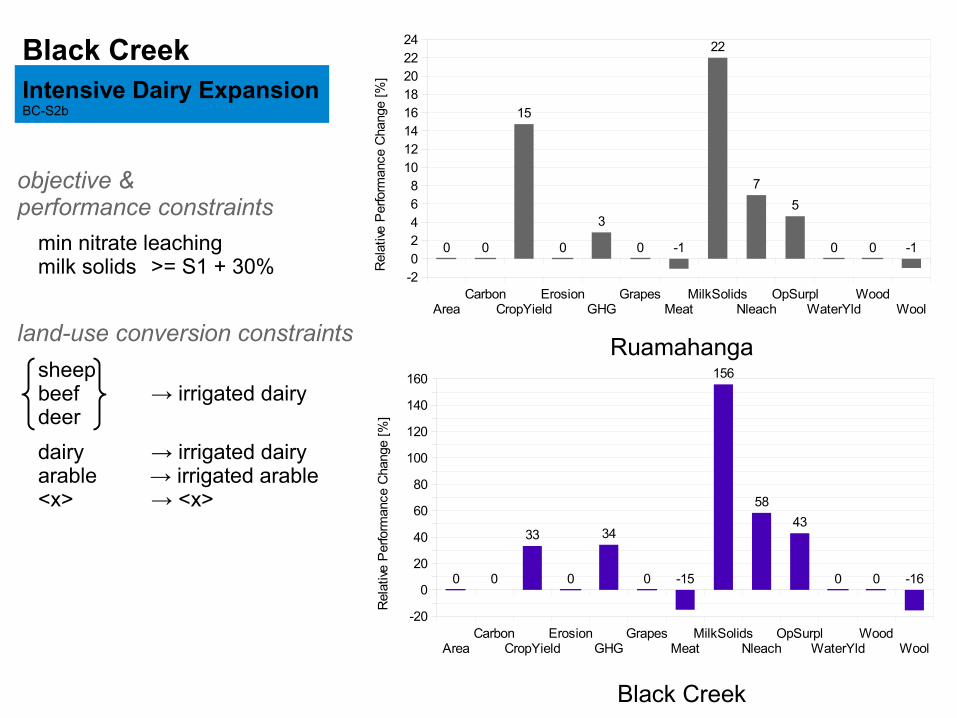
Black CreekIntensive Dairy ExpansionBC-S2b
AreaCarbon
CropYieldErosion
GHGGrapes
MeatMilkSolids
NleachOpSurpl
WaterYldWood
Wool
-20
0
20
40
60
80
100
120
140
160
0 0
33
0
34
0 -15
156
58
43
0 0 -16
Rel
ativ
e P
erfo
rman
ce C
hang
e [%
]
AreaCarbon
CropYieldErosion
GHGGrapes
MeatMilkSolids
NleachOpSurpl
WaterYldWood
Wool
-202468
1012141618202224
0 0
15
0
3
0 -1
22
7
5
0 0 -1
Rel
ativ
e P
erfo
rman
ce C
hang
e [%
]
Ruamahanga
Black Creek
sheepbeef → irrigated dairydeer
dairy → irrigated dairyarable → irrigated arable<x> → <x>
land-use conversion constraints
min nitrate leachingmilk solids >= S1 + 30%
objective & performance constraints
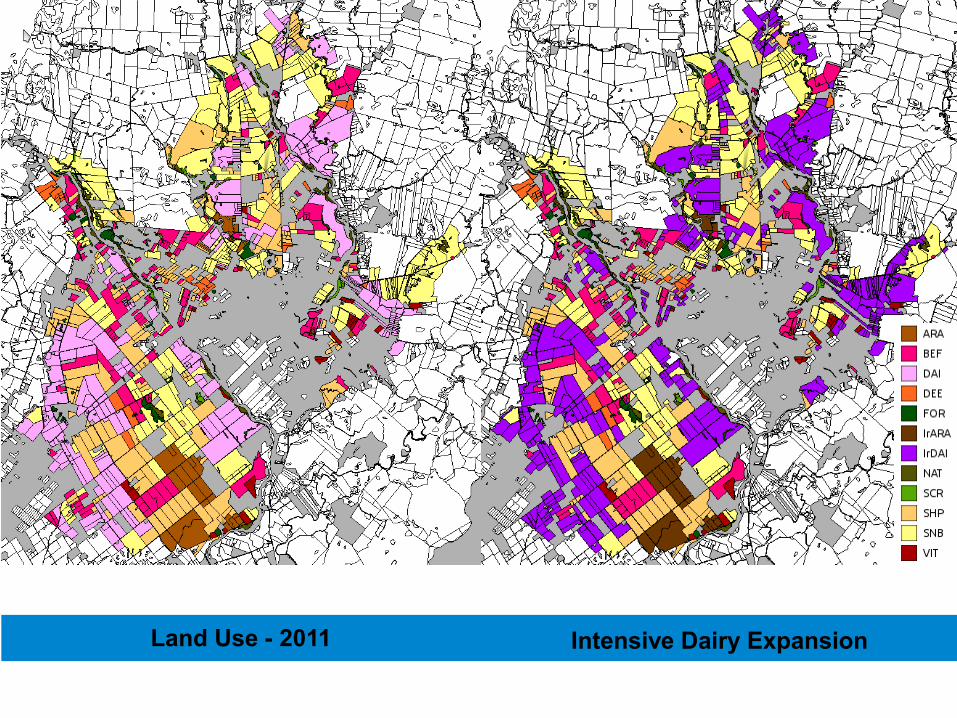
Land Use - 2011 Intensive Dairy Expansion
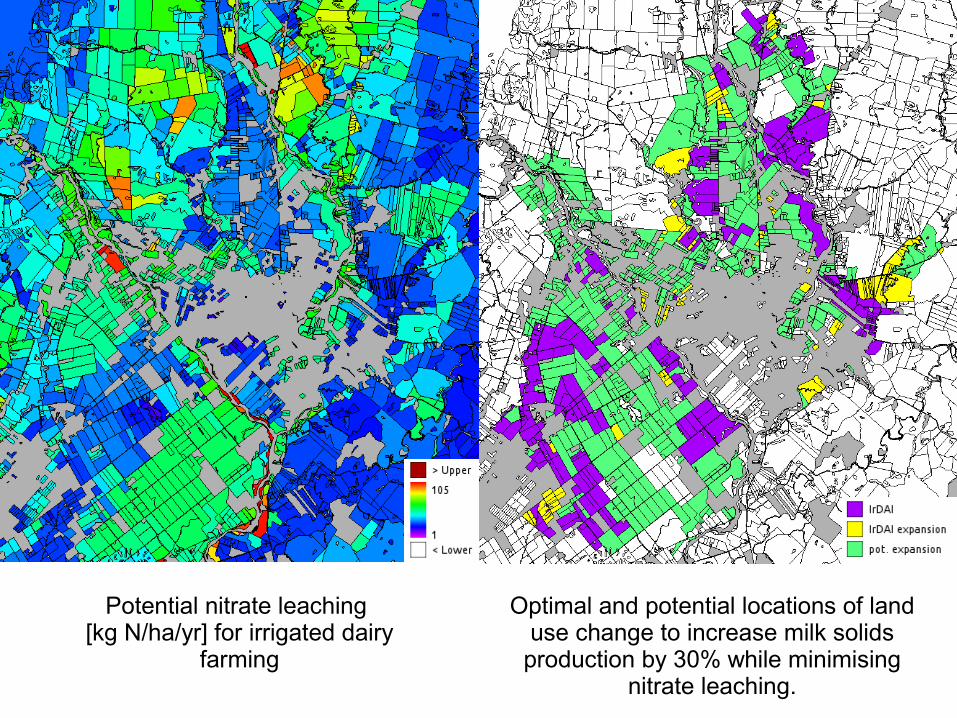
Potential nitrate leaching [kg N/ha/yr] for irrigated dairy
farming
Optimal and potential locations of land use change to increase milk solids
production by 30% while minimising nitrate leaching.
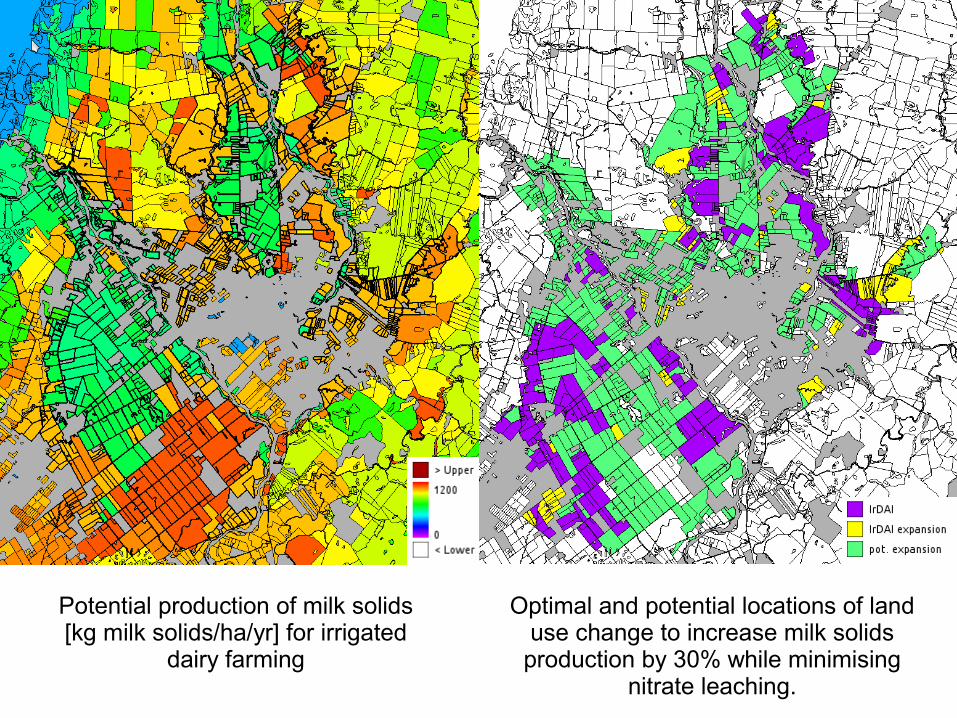
Optimal and potential locations of land use change to increase milk solids
production by 30% while minimising nitrate leaching.
Potential production of milk solids [kg milk solids/ha/yr] for irrigated
dairy farming
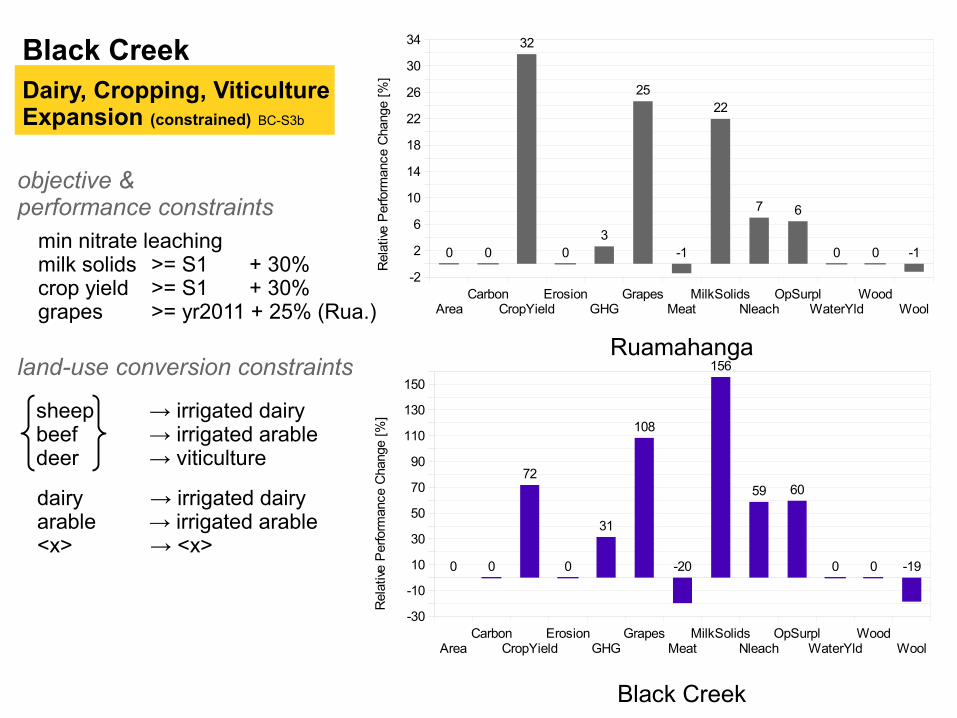
Black CreekDairy, Cropping, ViticultureExpansion (constrained) BC-S3b
AreaCarbon
CropYieldErosion
GHGGrapes
MeatMilkSolids
NleachOpSurpl
WaterYldWood
Wool
-2
2
6
10
14
18
22
26
30
34
0 0
32
03
25
-1
22
7 6
0 0 -1
Rel
ativ
e P
erfo
rman
ce C
hang
e [%
]
AreaCarbon
CropYieldErosion
GHGGrapes
MeatMilkSolids
NleachOpSurpl
WaterYldWood
Wool
-30
-10
10
30
50
70
90
110
130
150
0 0
72
0
31
108
-20
156
59 60
0 0 -19
Rel
ativ
e P
erfo
rman
ce C
hang
e [%
]
Ruamahanga
Black Creek
land-use conversion constraints
objective & performance constraints
min nitrate leachingmilk solids >= S1 + 30%crop yield >= S1 + 30%grapes >= yr2011 + 25% (Rua.)
sheep → irrigated dairybeef → irrigated arabledeer → viticulture
dairy → irrigated dairyarable → irrigated arable<x> → <x>
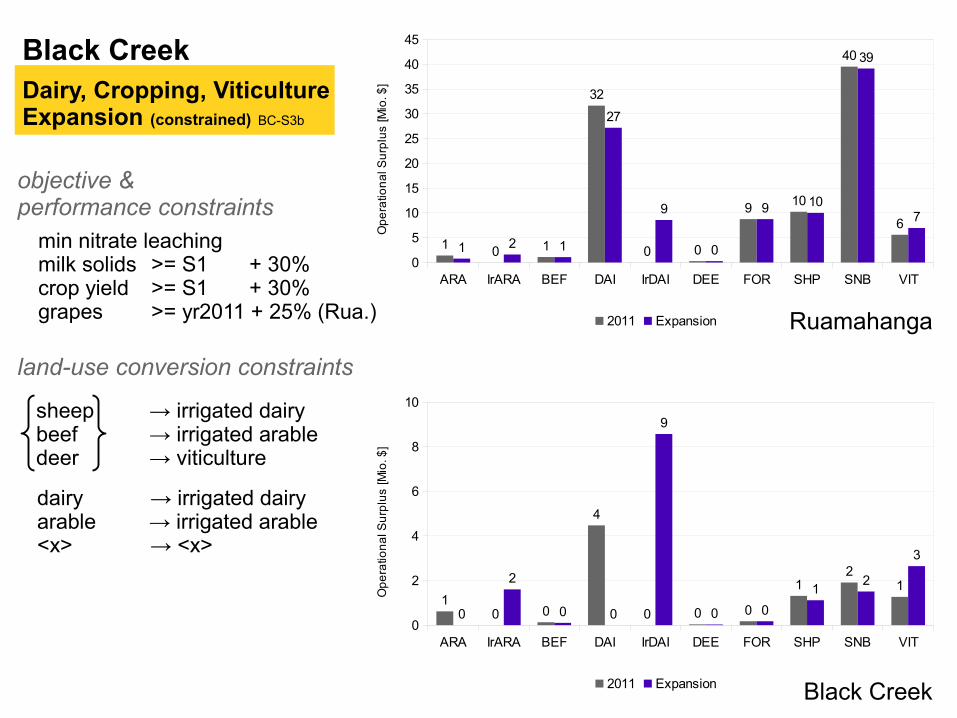
ARA IrARA BEF DAI IrDAI DEE FOR SHP SNB VIT0
5
10
15
20
25
30
35
40
45
1 0 1
32
0 0
9 10
40
6
1 2 1
27
9
0
9 10
39
7
2011 Expansion
Op
era
tion
al S
urp
lus
[Mio
. $]
ARA IrARA BEF DAI IrDAI DEE FOR SHP SNB VIT0
2
4
6
8
10
10 0
4
0 0 0
12
1
0
2
0 0
9
0 0
12
3
2011 Expansion
Op
era
tion
al S
urp
lus
[Mio
. $]
Ruamahanga
Black Creek
Black CreekDairy, Cropping, ViticultureExpansion (constrained) BC-S3b
land-use conversion constraints
objective & performance constraints
min nitrate leachingmilk solids >= S1 + 30%crop yield >= S1 + 30%grapes >= yr2011 + 25% (Rua.)
sheep → irrigated dairybeef → irrigated arabledeer → viticulture
dairy → irrigated dairyarable → irrigated arable<x> → <x>
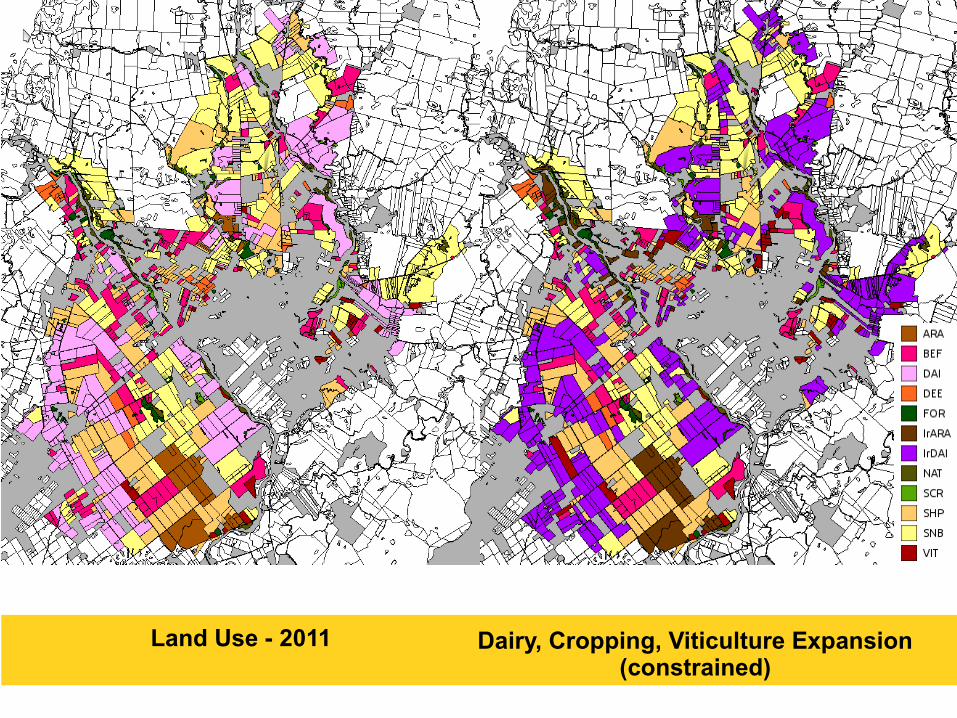
Land Use - 2011 Dairy, Cropping, Viticulture Expansion(constrained)
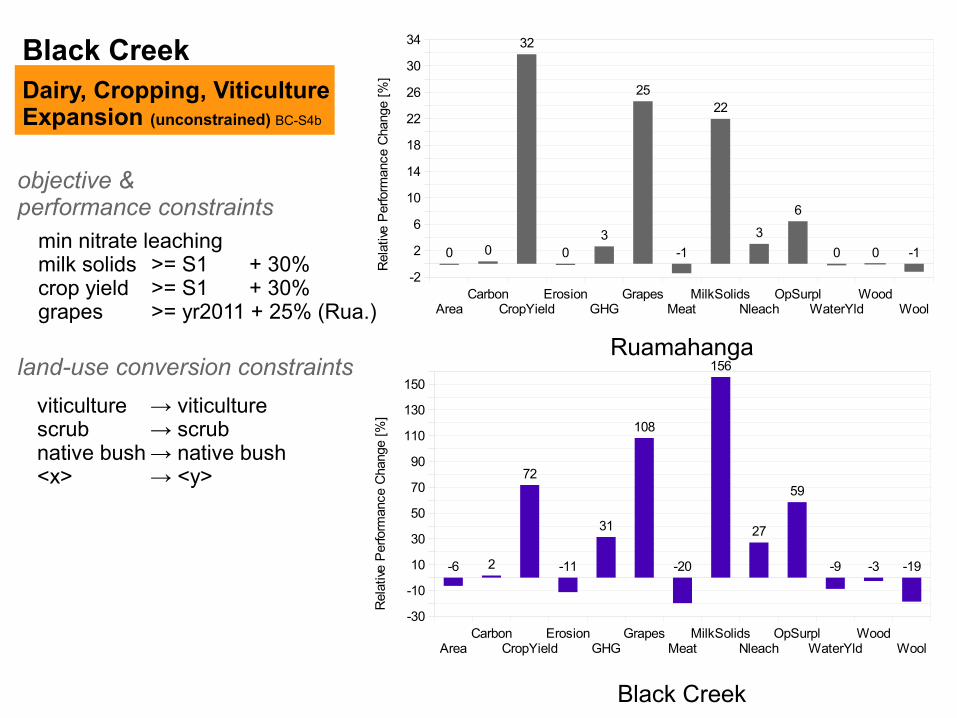
Black CreekDairy, Cropping, ViticultureExpansion (unconstrained) BC-S4b
AreaCarbon
CropYieldErosion
GHGGrapes
MeatMilkSolids
NleachOpSurpl
WaterYldWood
Wool
-30
-10
10
30
50
70
90
110
130
150
-6 2
72
-11
31
108
-20
156
27
59
-9 -3 -19
Rel
ativ
e P
erfo
rman
ce C
hang
e [%
]
AreaCarbon
CropYieldErosion
GHGGrapes
MeatMilkSolids
NleachOpSurpl
WaterYldWood
Wool
-2
2
6
10
14
18
22
26
30
34
0 0
32
03
25
-1
22
3
6
0 0 -1
Rel
ativ
e P
erfo
rman
ce C
hang
e [%
]
Ruamahanga
Black Creek
land-use conversion constraints
objective & performance constraints
min nitrate leachingmilk solids >= S1 + 30%crop yield >= S1 + 30%grapes >= yr2011 + 25% (Rua.)
viticulture → viticulture scrub → scrubnative bush → native bush<x> → <y>
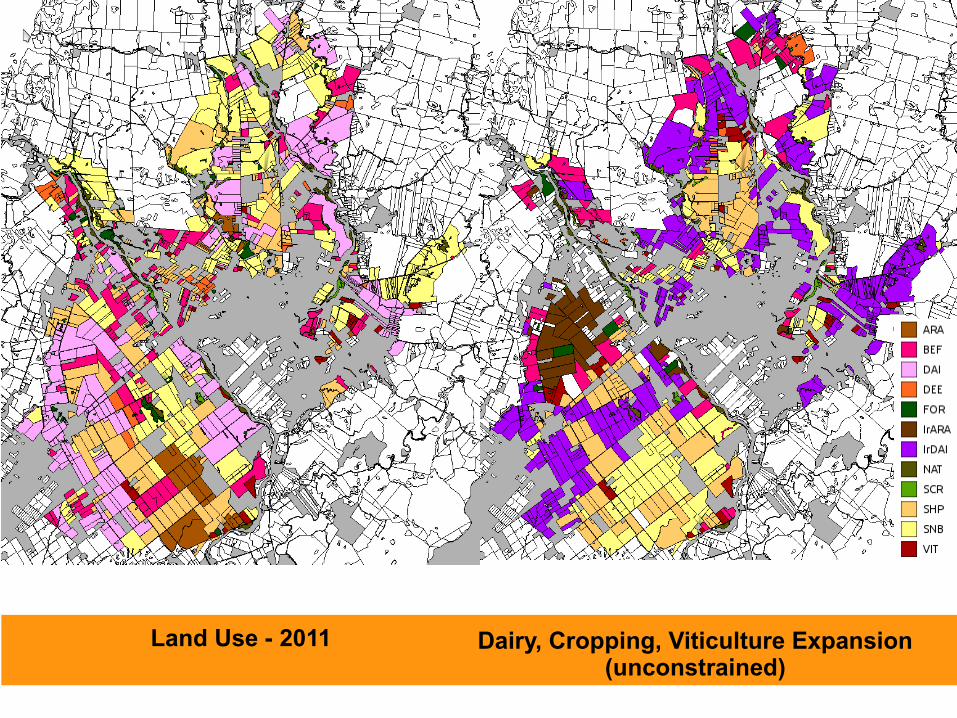
Land Use - 2011 Dairy, Cropping, Viticulture Expansion(unconstrained)
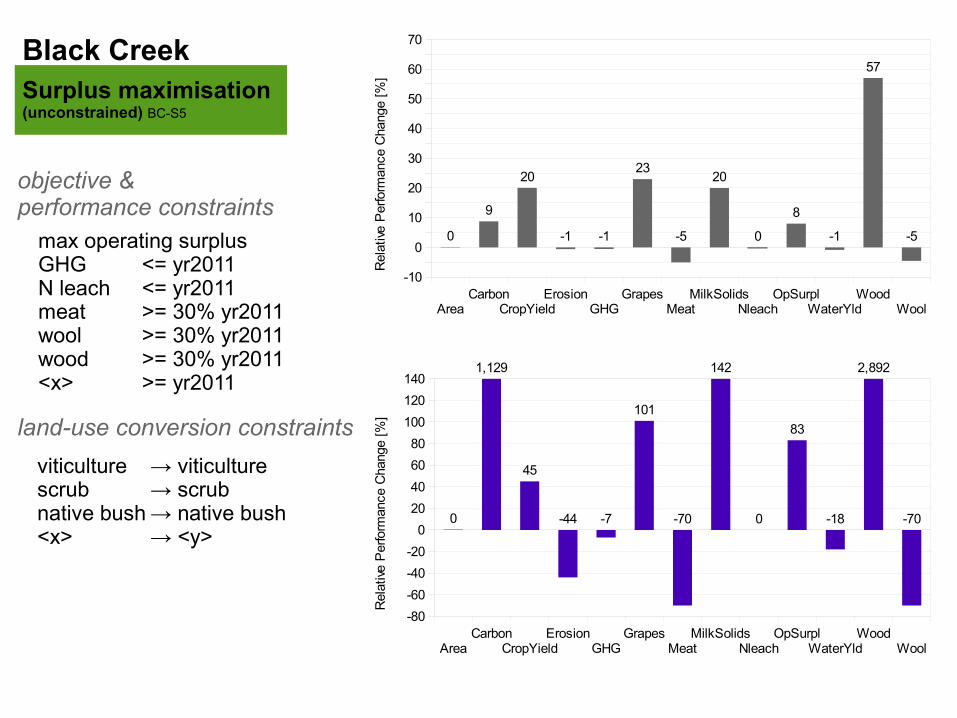
Black CreekSurplus maximisation(unconstrained) BC-S5
AreaCarbon
CropYieldErosion
GHGGrapes
MeatMilkSolids
NleachOpSurpl
WaterYldWood
Wool
-10
0
10
20
30
40
50
60
70
0
9
20
-1 -1
23
-5
20
0
8
-1
57
-5
Rel
ativ
e P
erfo
rman
ce C
hang
e [%
]
AreaCarbon
CropYieldErosion
GHGGrapes
MeatMilkSolids
NleachOpSurpl
WaterYldWood
Wool
-80
-60
-40
-20
0
20
40
60
80
100
120
140
0
1,129
45
-44 -7
101
-70
142
0
83
-18
2,892
-70
Rel
ativ
e P
erfo
rman
ce C
hang
e [%
]
max operating surplusGHG <= yr2011N leach <= yr2011meat >= 30% yr2011wool >= 30% yr2011wood >= 30% yr2011<x> >= yr2011
land-use conversion constraints
objective & performance constraints
viticulture → viticulture scrub → scrubnative bush → native bush<x> → <y>
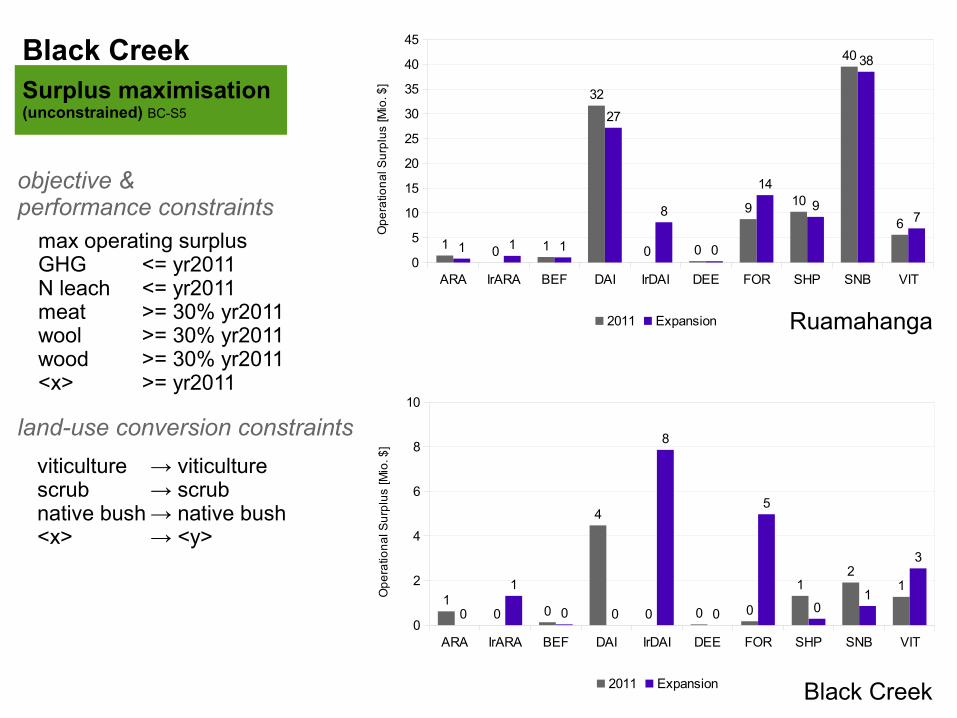
ARA IrARA BEF DAI IrDAI DEE FOR SHP SNB VIT0
5
10
15
20
25
30
35
40
45
1 0 1
32
0 0
9 10
40
6
1 1 1
27
8
0
14
9
38
7
2011 Expansion
Op
era
tion
al S
urp
lus
[Mio
. $]
ARA IrARA BEF DAI IrDAI DEE FOR SHP SNB VIT0
2
4
6
8
10
10 0
4
0 0 0
12
1
0
1
0 0
8
0
5
01
3
2011 Expansion
Op
era
tion
al S
urp
lus
[Mio
. $]
Ruamahanga
Black Creek
Black CreekSurplus maximisation(unconstrained) BC-S5
max operating surplusGHG <= yr2011N leach <= yr2011meat >= 30% yr2011wool >= 30% yr2011wood >= 30% yr2011<x> >= yr2011
land-use conversion constraints
objective & performance constraints
viticulture → viticulture scrub → scrubnative bush → native bush<x> → <y>
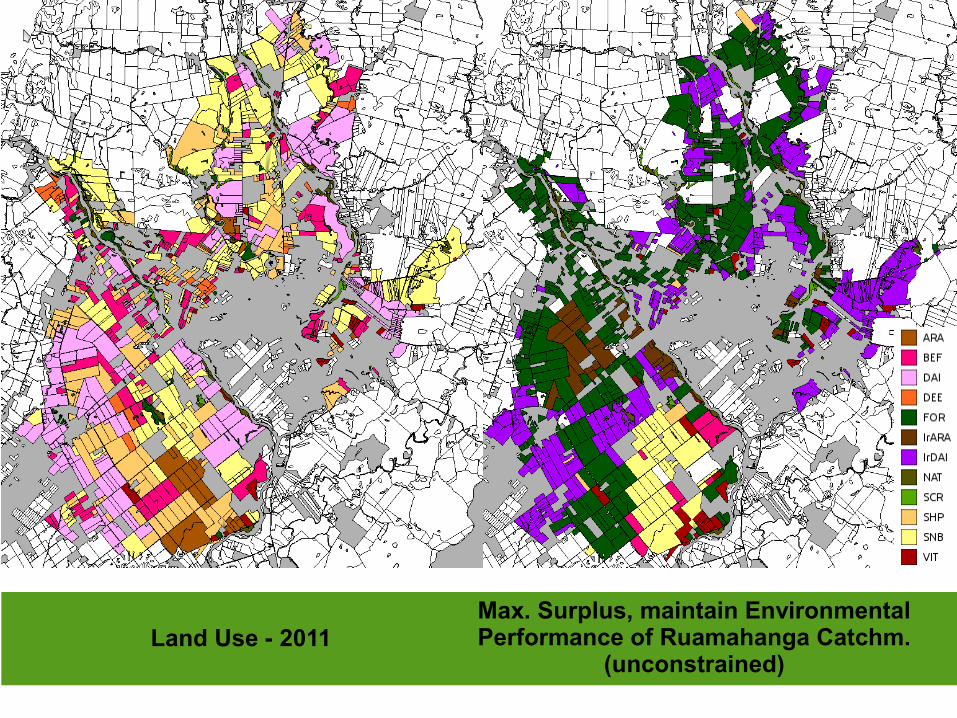
Land Use - 2011Max. Surplus, maintain EnvironmentalPerformance of Ruamahanga Catchm.
(unconstrained)
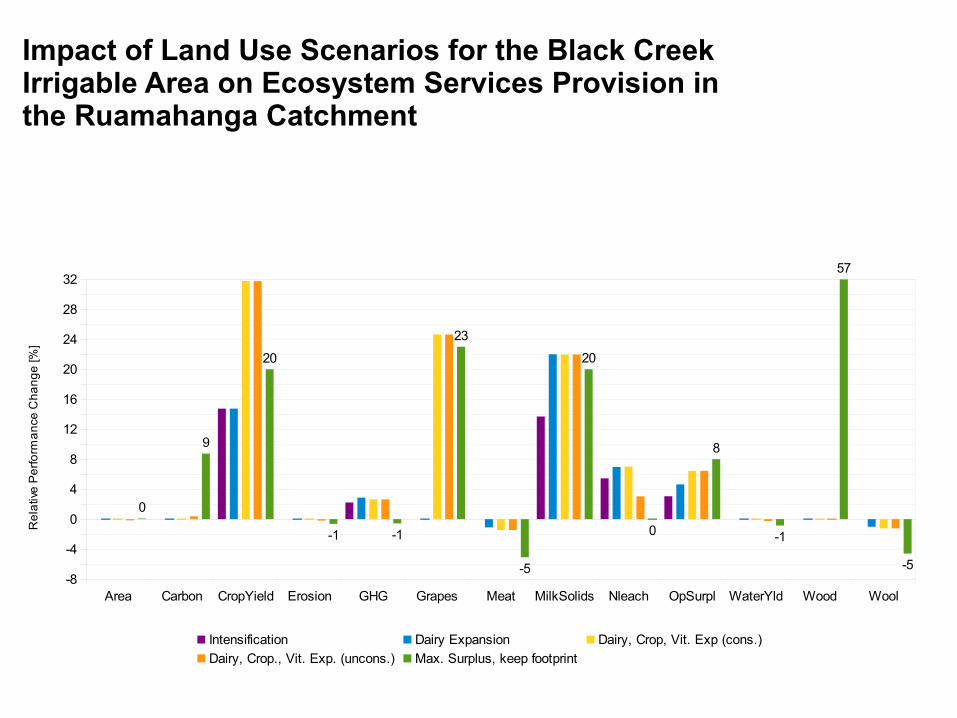
Area Carbon CropYield Erosion GHG Grapes Meat MilkSolids Nleach OpSurpl WaterYld Wood Wool-8
-4
0
4
8
12
16
20
24
28
32
0
9
20
-1 -1
23
-5
20
0
8
-1
57
-5
Intensification Dairy Expansion Dairy, Crop, Vit. Exp (cons.)
Dairy, Crop., Vit. Exp. (uncons.) Max. Surplus, keep footprint
Re
lativ
e P
erf
orm
an
ce C
ha
ng
e [%
]
Impact of Land Use Scenarios for the Black CreekIrrigable Area on Ecosystem Services Provision inthe Ruamahanga Catchment
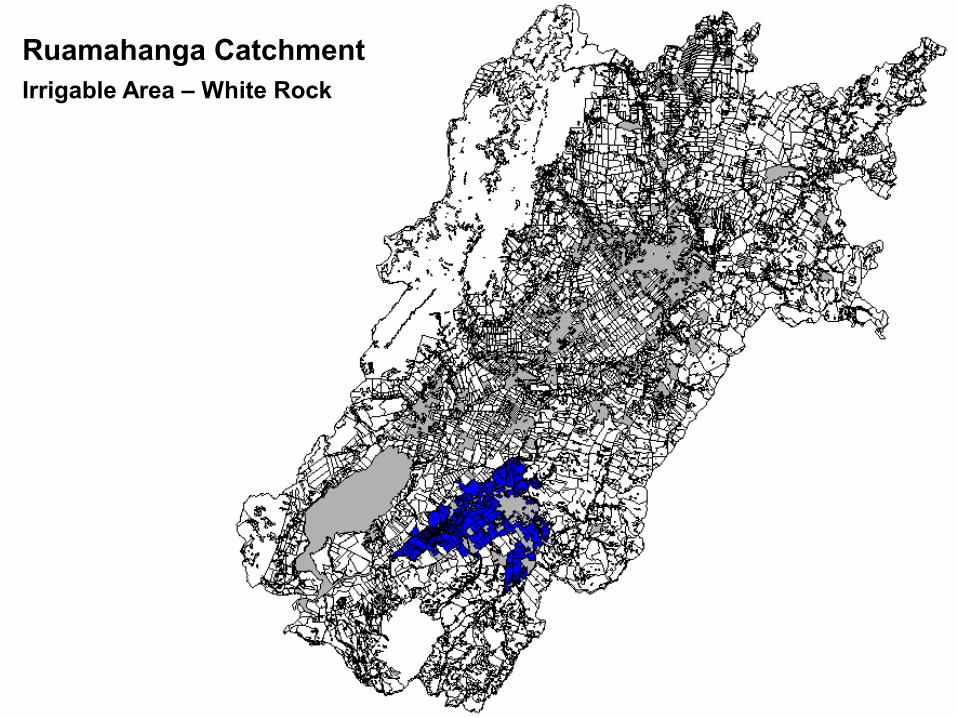
Ruamahanga CatchmentIrrigable Area – White Rock
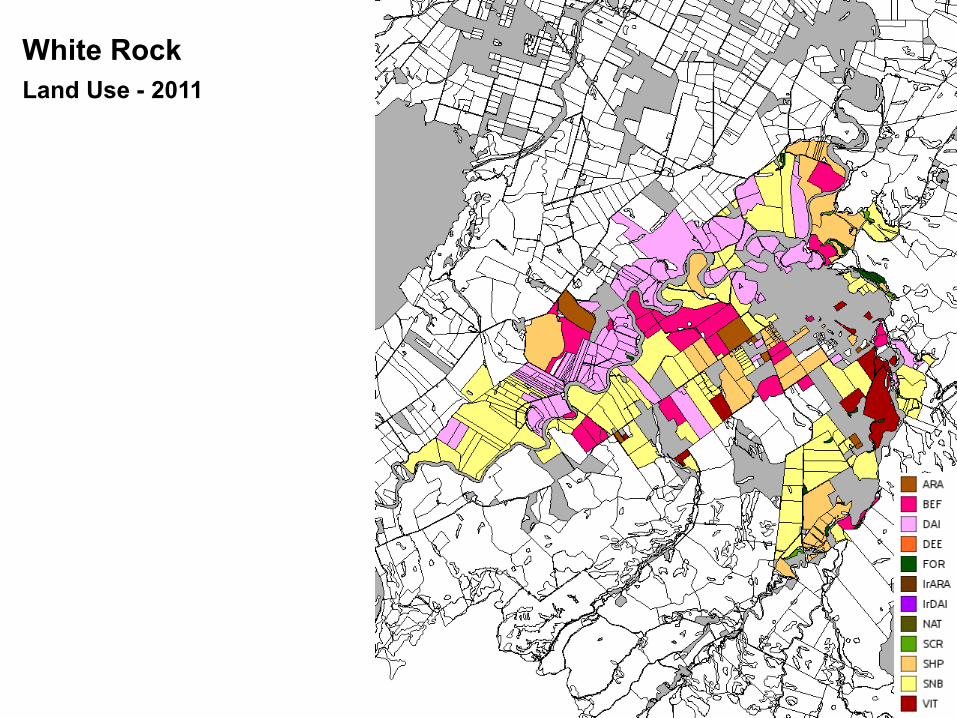
White RockLand Use - 2011
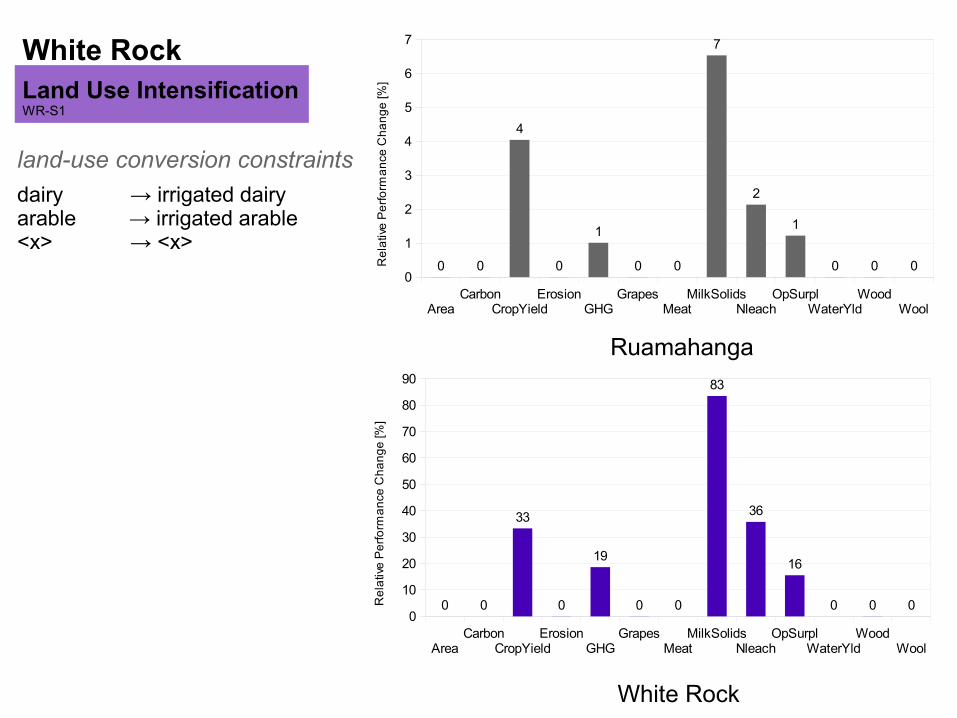
White RockLand Use IntensificationWR-S1
AreaCarbon
CropYieldErosion
GHGGrapes
MeatMilkSolids
NleachOpSurpl
WaterYldWood
Wool
0
1
2
3
4
5
6
7
0 0
4
0
1
0 0
7
2
1
0 0 0Re
lativ
e P
erf
orm
an
ce C
ha
ng
e [%
]
AreaCarbon
CropYieldErosion
GHGGrapes
MeatMilkSolids
NleachOpSurpl
WaterYldWood
Wool
0
10
20
30
40
50
60
70
80
90
0 0
33
0
19
0 0
83
36
16
0 0 0Re
lativ
e P
erf
orm
an
ce C
ha
ng
e [%
]
Ruamahanga
White Rock
dairy → irrigated dairyarable → irrigated arable<x> → <x>
land-use conversion constraints
White Rock
AreaCarbon
CropYieldErosion
GHGGrapes
MeatMilkSolids
NleachOpSurpl
WaterYldWood
Wool
-20
0
20
40
60
80
100
120
140
0 0
62
0
23 22
-13
138
48
32
0 0 -13
Re
lativ
e P
erf
orm
an
ce C
ha
ng
e [%
]
AreaCarbon
CropYieldErosion
GHGGrapes
MeatMilkSolids
NleachOpSurpl
WaterYldWood
Wool
-2
0
2
4
6
8
10
12
0 0
8
0
1
8
-1
11
32
0 0 -1
Re
lativ
e P
erf
orm
an
ce C
ha
ng
e [%
]
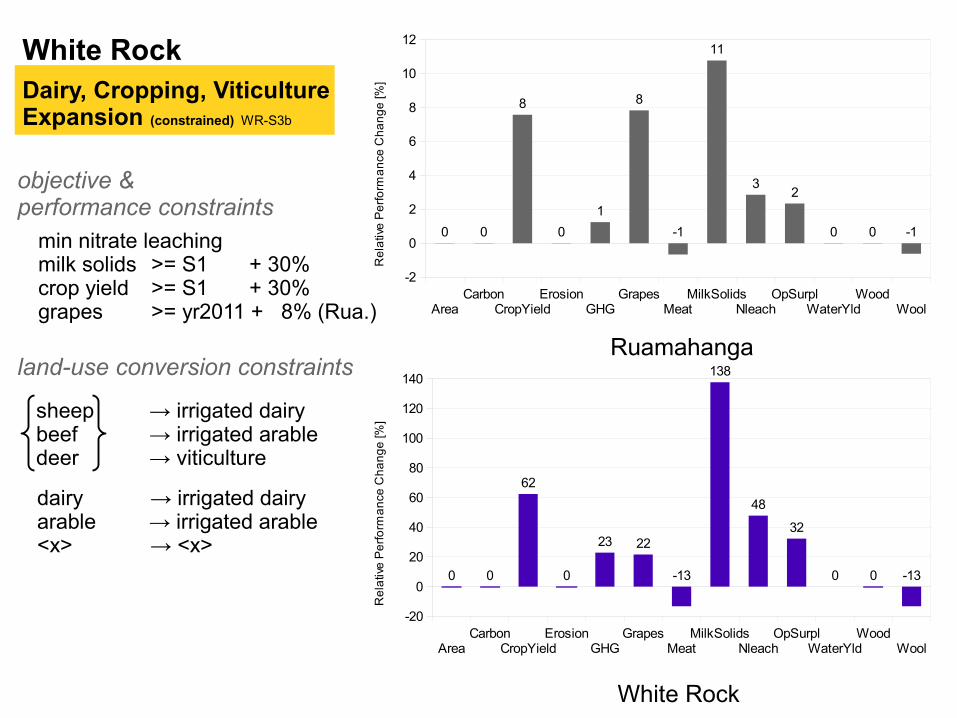
Ruamahanga
White Rock
Dairy, Cropping, ViticultureExpansion (constrained) WR-S3b
land-use conversion constraints
objective & performance constraints
min nitrate leachingmilk solids >= S1 + 30%crop yield >= S1 + 30%grapes >= yr2011 + 8% (Rua.)
sheep → irrigated dairybeef → irrigated arabledeer → viticulture
dairy → irrigated dairyarable → irrigated arable<x> → <x>
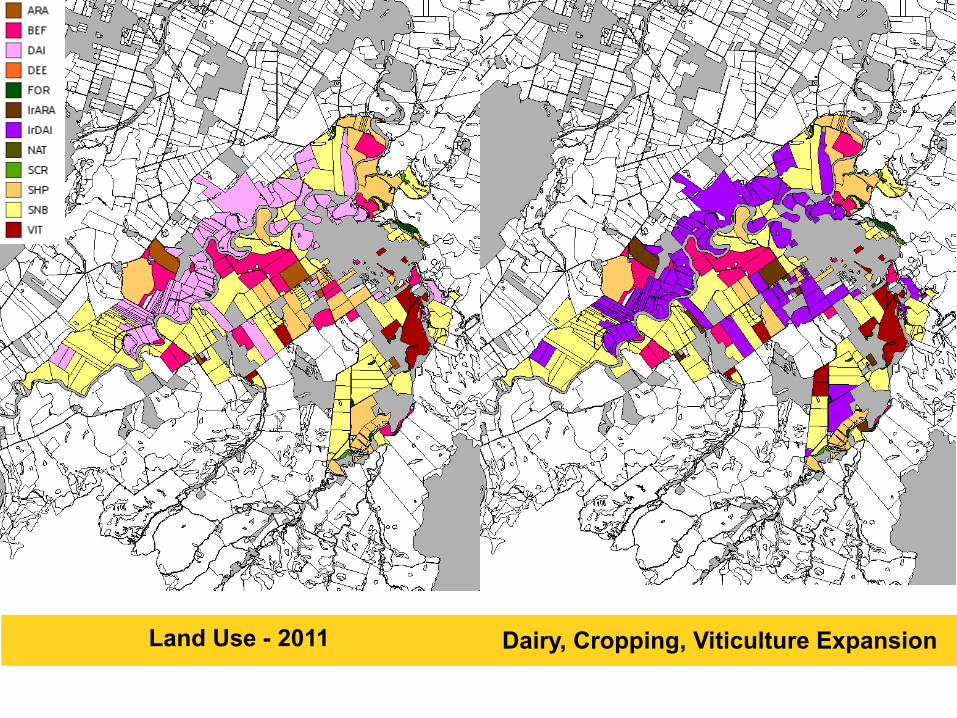
Land Use - 2011 Dairy, Cropping, Viticulture Expansion
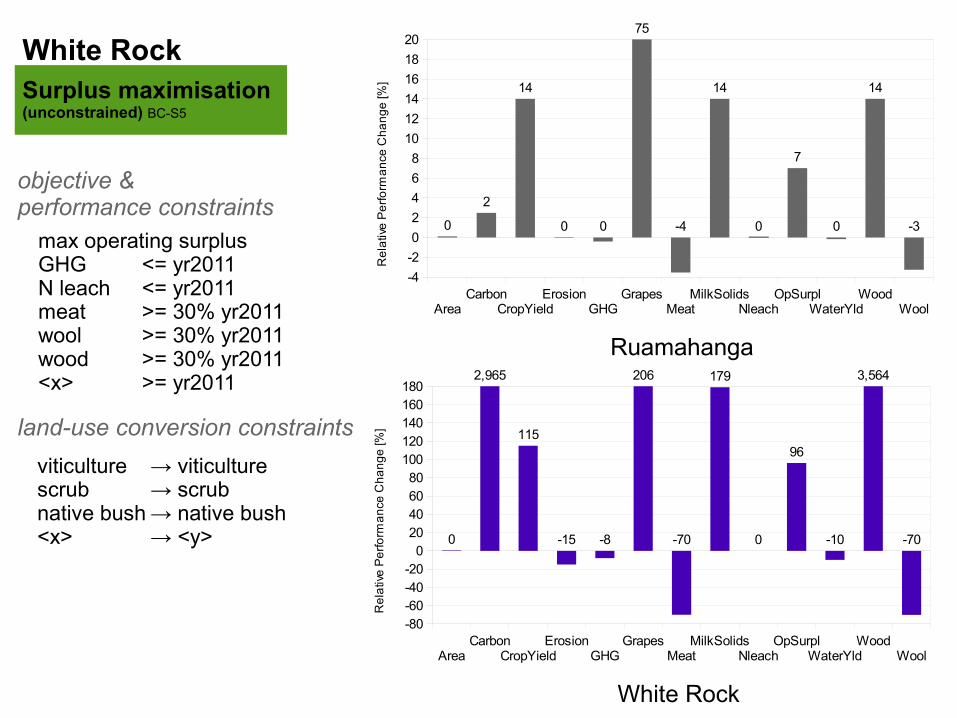
White RockSurplus maximisation(unconstrained) BC-S5
AreaCarbon
CropYieldErosion
GHGGrapes
MeatMilkSolids
NleachOpSurpl
WaterYldWood
Wool
-4
-2
0
2
4
6
8
10
12
14
16
18
20
0
2
14
0 0
75
-4
14
0
7
0
14
-3
Re
lativ
e P
erf
orm
an
ce C
ha
ng
e [%
]
AreaCarbon
CropYieldErosion
GHGGrapes
MeatMilkSolids
NleachOpSurpl
WaterYldWood
Wool
-80-60-40-20
020406080
100120140160180
0
2,965
115
-15 -8
206
-70
179
0
96
-10
3,564
-70
Re
lativ
e P
erf
orm
an
ce C
ha
ng
e [%
]
Ruamahanga
White Rock
max operating surplusGHG <= yr2011N leach <= yr2011meat >= 30% yr2011wool >= 30% yr2011wood >= 30% yr2011<x> >= yr2011
land-use conversion constraints
objective & performance constraints
viticulture → viticulture scrub → scrubnative bush → native bush<x> → <y>
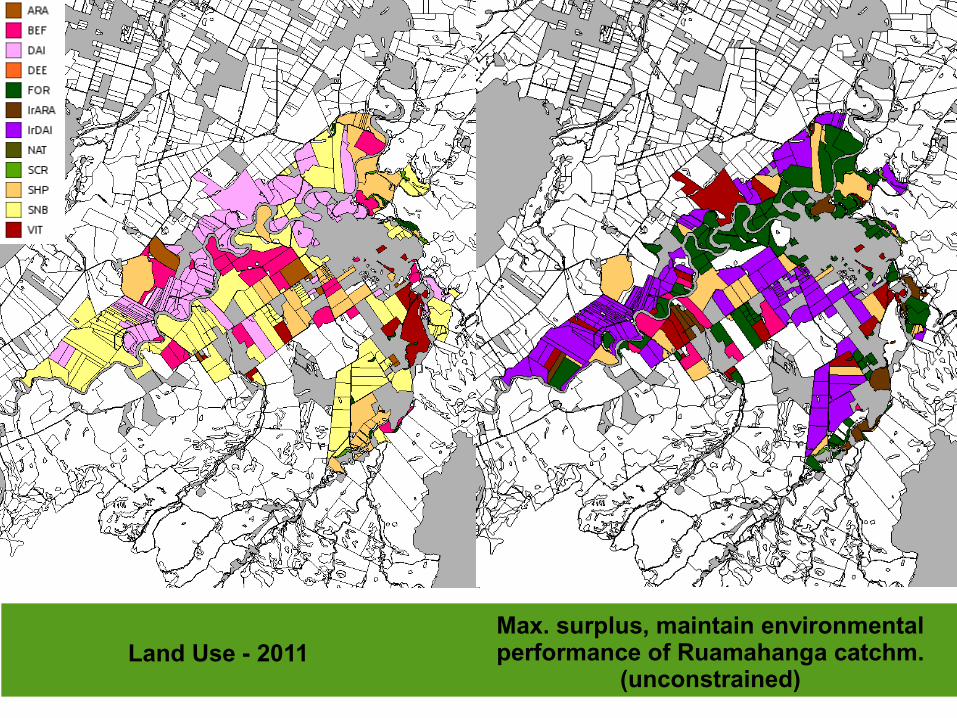
Land Use - 2011Max. surplus, maintain environmentalperformance of Ruamahanga catchm.
(unconstrained)
Area Carbon CropYield Erosion GHG Grapes Meat MilkSolids Nleach OpSurpl WaterYld Wood Wool-6
-4
-2
0
2
4
6
8
10
12
14
16
18
20
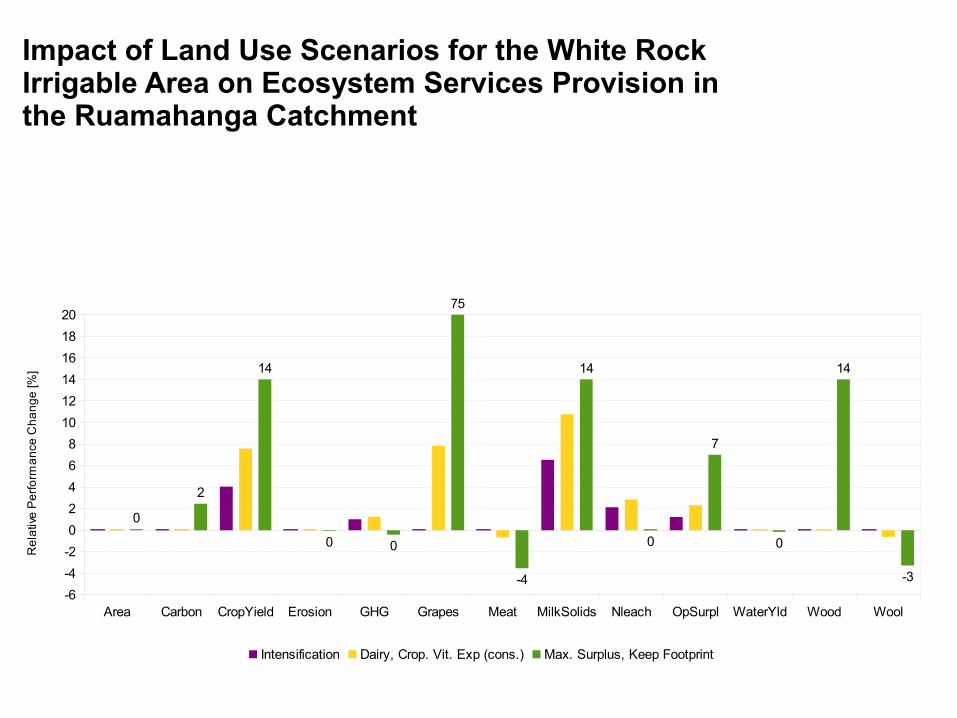
0
2
14
0 0
75
-4
14
0
7
0
14
-3
Intensification Dairy, Crop. Vit. Exp (cons.) Max. Surplus, Keep Footprint
Re
lativ
e P
erf
orm
an
ce C
ha
ng
e [%
]
Impact of Land Use Scenarios for the White RockIrrigable Area on Ecosystem Services Provision inthe Ruamahanga Catchment
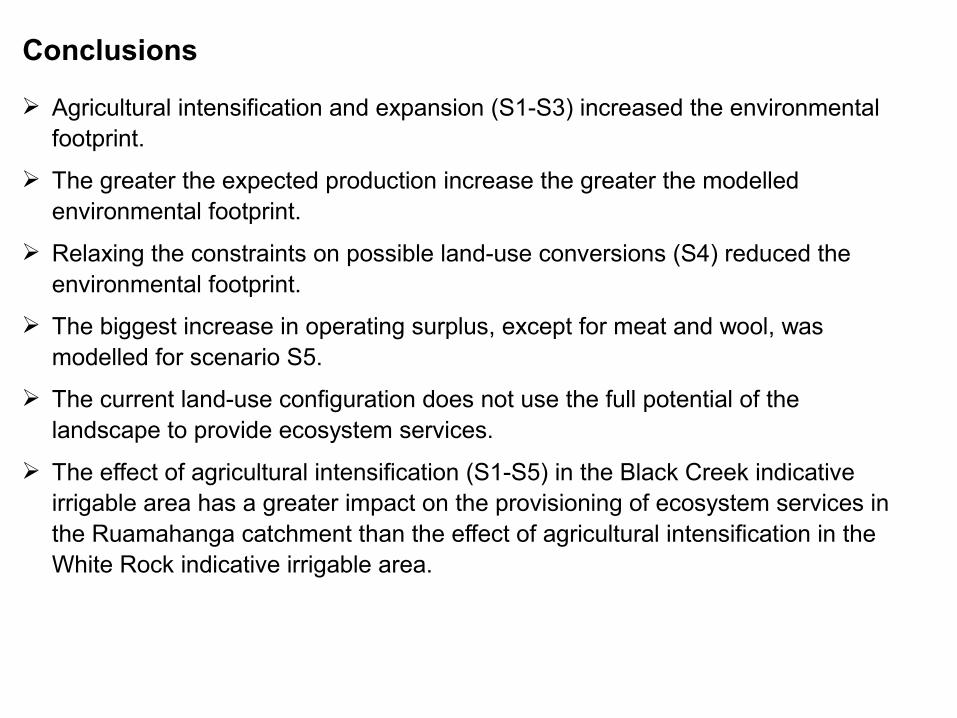
Conclusions
➢ Agricultural intensification and expansion (S1-S3) increased the environmental footprint.
➢ The greater the expected production increase the greater the modelled environmental footprint.
➢ Relaxing the constraints on possible land-use conversions (S4) reduced the environmental footprint.
➢ The biggest increase in operating surplus, except for meat and wool, was modelled for scenario S5.
➢ The current land-use configuration does not use the full potential of the landscape to provide ecosystem services.
➢ The effect of agricultural intensification (S1-S5) in the Black Creek indicative irrigable area has a greater impact on the provisioning of ecosystem services in the Ruamahanga catchment than the effect of agricultural intensification in the White Rock indicative irrigable area.
Conclusions
➢ the integration of performance indicators from different models
➢ the integration of stakeholder objectives and expectations
➢ the exploration of landscape limits and potentials
➢ the identification of trade-offs between conflicting objectives
➢ evidence-based spatial decision-making and policy development
LUMASS supports