Dissolved noble gases and stable isotopes as tracers of preferential ...
Iron isotopes reveal distinct dissolved iron sources andpathways in the intermediate versus deepSouthern OceanCyril Abadiea, Francois Lacana,1, Amandine Radica, Catherine Pradouxa, and Franck Poitrassonb
aLEGOS, University of Toulouse, CNRS, CNES, IRD, UPS, 31400 Toulouse, France; and bGéosciences Environnement Toulouse, UMR 5563 CNRS/UPS/IRD, 14-16avenue Edouard Belin, 31400 Toulouse, France
Edited by Donald E. Canfield, Institute of Biology and Nordic Center for Earth Evolution, University of Southern Denmark, Odense M, Denmark, and approvedDecember 13, 2016 (received for review February 24, 2016)
As an essential micronutrient, iron plays a key role in oceanicbiogeochemistry. It is therefore linked to the global carbon cycleand climate. Here, we report a dissolved iron (DFe) isotope sectionin the South Atlantic and Southern Ocean. Throughout the section,a striking DFe isotope minimum (light iron) is observed at inter-mediate depths (200–1,300 m), contrasting with heavier isotopiccomposition in deep waters. This unambiguously demonstratesdistinct DFe sources and processes dominating the iron cycle inthe intermediate and deep layers, a feature impossible to see withonly iron concentration data largely used thus far in chemicaloceanography. At intermediate depths, the data suggest thatthe dominant DFe sources are linked to organic matter remineral-ization, either in the water column or at continental margins. Indeeper layers, however, abiotic non-reductive release of Fe (de-sorption, dissolution) from particulate iron—notably lithogenic—likely dominates. These results go against the common but over-simplified view that remineralization of organic matter is themajor pathway releasing DFe throughout the water column in theopen ocean. They suggest that the oceanic iron cycle, and there-fore oceanic primary production and climate, could be more sen-sitive than previously thought to continental erosion (providinglithogenic particles to the ocean), particle transport within theocean, dissolved/particle interactions, and deep water upwelling.These processes could also impact the cycles of other elements,including nutrients.
iron isotopes | GEOTRACES | South Atlantic | Southern Ocean |remineralization
Since the discovery that Fe is a limiting factor for phyto-plankton growth (1), numerous studies have attempted to
better constrain its cycle, sources, and sinks, and the processesoccurring within the water column. Although atmospheric dustdissolution has long been thought to be the main source of dis-solved iron (DFe) to the open ocean, the last decade has seennumerous studies suggesting other potential sources of DFe to theocean. These include dissolution and/or desorption from conti-nental margin sediments with or without Fe reduction, riverineinputs, and hydrothermalism (2).Whereas the oceanic iron cycle is partially controlled by bi-
ological processes, it is, unlike major nutrients, widespread in thewater column in the particulate form, notably as lithogenic par-ticulate iron. It is a particle-reactive element, sensitive to scav-enging processes (i.e., adsorption/desorption onto/from sinkingparticles). Recent work suggests continuous exchange between thedissolved and particulate iron phases (3, 4), as previously proposedfor thorium and protactinium (5), rare earth elements (6), andcopper (7). The relative importance of these organic and inorganicprocesses in the control of the iron cycle remains largely unknown,however, thereby restricting the validity of oceanic biogeochemicalmodeling involving this element and thus its use in ocean research.Iron isotopes have emerged as a new powerful tool to constrain
the Fe sources and oceanic cycle (3, 4, 8–17). The isotopic
signatures of the various iron sources to the ocean are summarizedin Fig. 1. It can be inferred from these diverse signatures that ironisotopes will bring new constraints on DFe sources to the ocean. Inaddition, several processes involved in the iron cycling within thewater column (e.g., biological uptake, remineralization, scavenging,adsorption, desorption, dissolution, precipitation, organic com-plexation, and redox processes) may fractionate iron isotopes(14, 18–22). Hence, such isotopic fractionations may also bringadditional constraints on the iron cycle within the water column.Few existing studies report dissolved δ56Fe [δ56DFe, expressed
here as the 56Fe/54Fe ratio relative to the Institute for ReferenceMaterials and Measurements (IRMM)-014 reference material]values in the open ocean. Dissolved δ56Fe ranges from −0.13 to+0.21 ± 0.08‰ in the Southeastern Atlantic (8), from −1.35 ±0.03‰ to +0.80 ± 0.06‰ in the North Atlantic (4, 11), andfrom −0.03 ± 0.07‰ to +0.58 ± 0.08‰ in the Equatorial Pa-cific (3, 10). However, there is a lack of iron isotope data in high-nutrient low-chlorophyll (HNLC) areas, despite the fact that ironplays a critical role in these areas where it limits primary pro-duction. Here, we report a section of DFe isotopic compositionsin the South Atlantic and Southern Ocean. Its dominant featureis a striking DFe isotopic minimum (light DFe, ranging from−0.17 to −0.74‰) found at intermediate depth (200- to 1,300-mdepth), all along the section from the subtropical domain to theWeddell Gyre, contrasting with heavier DFe in the deeper layers.
Significance
Iron is an essential micronutrient for life. However, its scarcitylimits algae growth in about one-half of the ocean. Its cycle istherefore linked to the global carbon cycle and climate. Wepresent an iron isotope section from the Southern Ocean. Incontrast to the common but oversimplified view, according towhich organic matter remineralization is the major pathwayreleasing dissolved iron below the surface layers, these datareveal other dominant processes at depth, likely abiotic de-sorption/dissolution from lithogenic particles. This suggeststhat the iron cycle, and therefore primary production and cli-mate, may be more sensitive than previously thought to con-tinental erosion, dissolved/particle interactions, and deepwater upwelling. These processes likely impact other elementsin the ocean.
Author contributions: F.L. designed research; C.A., F.L., and A.R. performed research; C.A.,F.L., A.R., and C.P. contributed new reagents/analytic tools; C.A., F.L., A.R., and F.P. ana-lyzed data; and C.A., F.L., and F.P. wrote the paper.
The authors declare no conflict of interest.
This article is a PNAS Direct Submission.
Data deposition: The data have been deposited in the GEOTRACES database,www.egeotraces.org/.1To whom correspondence should be addressed. Email: [email protected].
This article contains supporting information online at www.pnas.org/lookup/suppl/doi:10.1073/pnas.1603107114/-/DCSupplemental.
858–863 | PNAS | January 31, 2017 | vol. 114 | no. 5 www.pnas.org/cgi/doi/10.1073/pnas.1603107114
This pattern, invisible to iron concentrations, demonstrates con-trasted DFe origins in these different layers. We suggest that, al-though biological material remineralization processes dominate atintermediate levels, non-reductive release of DFe from particles(notably lithogenic ones) dominates in the deep ocean.Samples for this study were collected on board the French R/V
Marion Dufresne from February 8 to March 24, 2008 in the Atlantic
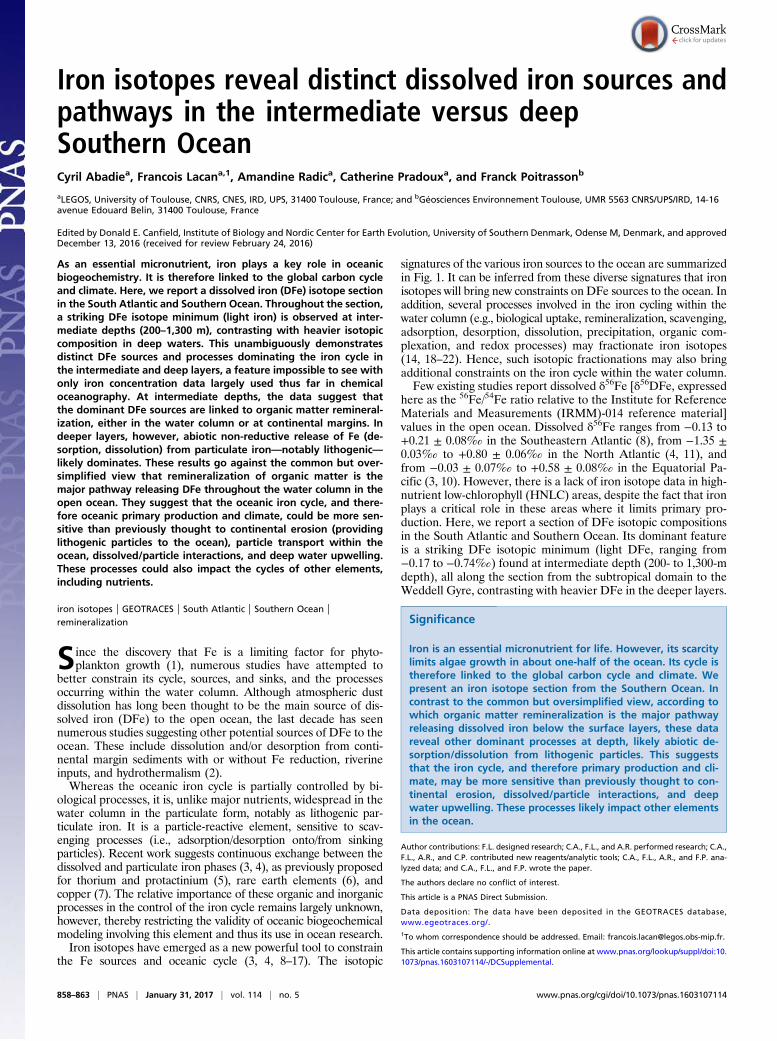
sector of the Southern Ocean, which partly lies within a HNLCarea, during the Bonus/GoodHope (BGH) cruise (GEOTRACEScruise GIPY4). Fig. 2 shows the studied area, with the five stationswhere the samples were collected, together with the main ocean-ographic fronts and currents. The section crosses the AntarcticCircumpolar Current (ACC), which is the world’s largest current. Itis therefore located in a highly dynamic area. A detailed descrip-tion and understanding of the currents and the water masses theycarry is therefore absolutely essential for data interpretation. Ac-cordingly, before comparing the Fe isotopic compositions of thedifferent samples, we first need to ensure that these may be relatedto each other, either because they belong to the same water mass(i.e., the same reservoir), or because the different water masses towhich they belong are related through mixing processes.Apart from the Agulhas Current carrying waters from the In-
dian Ocean westward—the Indian influence being observed downto ∼1,500-m depth (23)—the flows across the section are domi-nated by eastward currents, the ACC and the Northern limb of theWeddell Gyre (24). Superimposed on this intense zonal circula-tion, there is a slow meridional and vertical circulation, schema-tized in Fig. 2. Its effects are clearly visible from meridionalsections of water mass tracers, such as salinity and dissolved oxy-gen concentrations shown in Fig. 3. The hydrographic properties,potential temperatures, salinities, and dissolved O2 concentrationsfrom the five stations, highlighting the main samples and watermasses discussed below, are displayed in Fig. 3 and Fig. S1.
ResultsDFe concentrations and isotopic compositions are shown in Figs.3 and 4 (and Fig. S2 and Dataset S1; these data are also availablefrom the GEOTRACES database; www.egeotraces.org/). Con-centrations range from 0.05 to 0.89 nmol·kg−1. They tend todecrease from north to south with maximum values in S1 close tothe African margin, minimum values in S4 in the ACC, and then
Fig. 1. Isotopic composition of iron sources to the ocean (in per mill relativeto IRMM-014). DFe, PFe, and TFe stand for dissolved, particulate, and totaliron, respectively. References used in the figure are as follows: continentalcrust (49); lithogenic aerosols (50); marine aerosols (3); rivers (ref. 51 andreferences therein); submarine groundwater discharges (52); hydrothermalfluids (53); hydrothermal plumes (11); sediment reductive dissolution (9, 12);non-reductive release of DFe from sediments (3, 10, 17).
Fig. 2. Studied area. (Left) Background colors indicate sea surface temperatures (14-d average centered on March 1, 2008, MODIS data; map produced by theColorado Center for Astrodynamics Research, data viewer using data from the Group for High Resolution Sea Surface Temperature). S1 to S5 are the fivesampled stations. Colored lines indicate front locations, from ref. 54. Arrows schematize the trajectories of the water masses in which the DFe isotope minimawere found. (Right) Schematic representation of the meridional and vertical circulation in the Southern Ocean adapted from Talley et al. (24). Front locations,zones, and water masses are indicated. Neutral density isolines (γ) (in kilograms per cubic meter) from the BGH cruise are shown in red. Sample locations areshown by black dots. Acronyms: AABW, Antarctic Bottom Water; AASW, Antarctic Surface Water; AZ, Antarctic Zone; CSW, Continental Shelf Water; CZ,Continental Zone; I-AAIW and A-AAIW, Antarctic Intermediate Water of Indian and Atlantic origins; I-CW, Indian Central Water; I-UCDW, A-UCDW, and DP-UCDW, Indian, Atlantic, and Drake Passage Upper Circumpolar Deep Water; LCDW, Lower Circumpolar Deep Water; -M, middle branch; -N, northern branch;PF, Polar Front; PFZ, Polar Frontal Zone; -S, southern branch; SACCF, southern ACC front; SAF, Sub-Antarctic Front; SAZ, Sub-Antarctic Zone; SB, southernboundary of the ACC; SE-NADW and SW-NADW, Southeast and Southwest North Atlantic Deep Water (dil, diluted); STF, Subtropical Front; STZ, SubtropicalZone; SZ, Southern Zone; WDW, Warm Deep Water; WSBW, Weddell Sea Bottom Water; WW, Winter Water.
Abadie et al. PNAS | January 31, 2017 | vol. 114 | no. 5 | 859
EART
H,A
TMOSP
HER
IC,
ANDPL
ANET
ARY
SCIENCE
SEN
VIRONMEN
TAL
SCIENCE
S
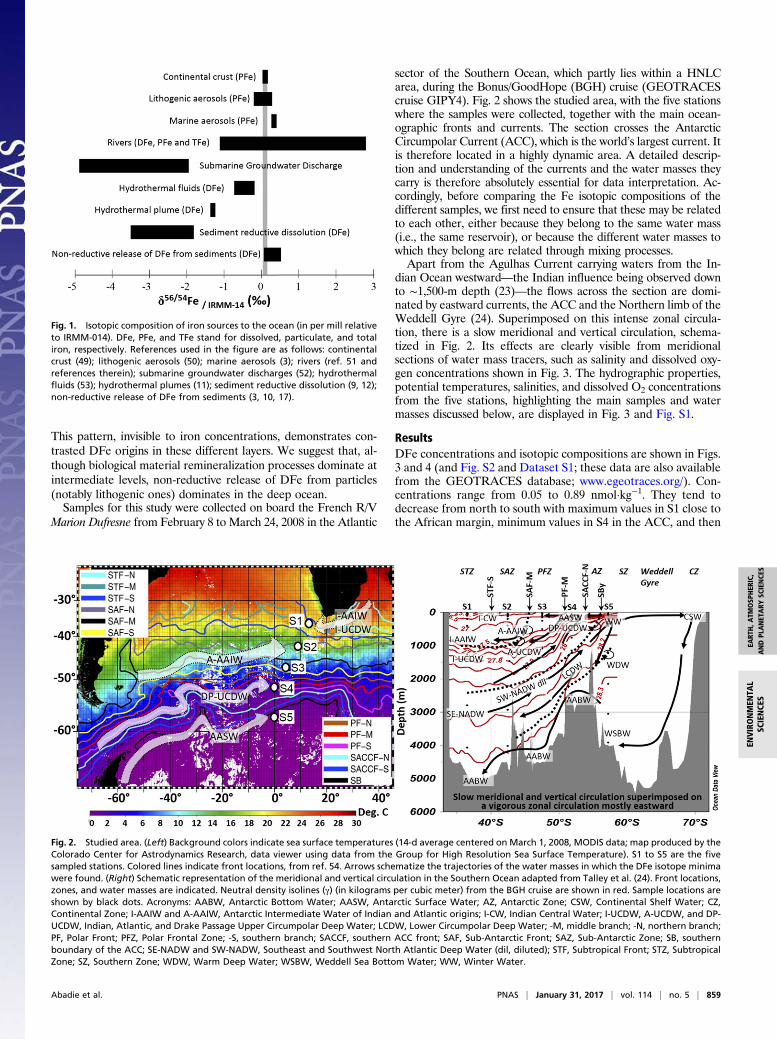
increase again in station S5 in the Weddell Gyre. Profiles of DFedisplay a typical nutrient-like shape, with a surface minimum andan increase with depth. DFe isotopic compositions range from−0.74 to +0.47‰. The δ56DFe values become more negativewhen going from the subtropical domain in S1 to the south inthe ACC domain (S4). These δ56DFe negative values remain inthe Weddell Gyre, in S5. At each station, and in contrast to thequasi-monotonous increase of Fe concentrations with depth, aprominent δ56DFe vertical minimum is found at intermediatedepths (Figs. 3 and 4, and Fig. S2). The samples where thisminimum is found are indicated by red diamonds in the diagramin Fig. S1. This diagram highlights the different water masses car-rying this signal: different varieties of Antarctic Intermediate Water
(AAIW) and Upper Circumpolar Deep Water (UCDW) originat-ing from the Indian Ocean at station S1 and from the west at sta-tions S2–S3–S4, and at station S5 a subsurface variety (205 m) ofAntarctic Surface Water (AASW), called Winter Water.
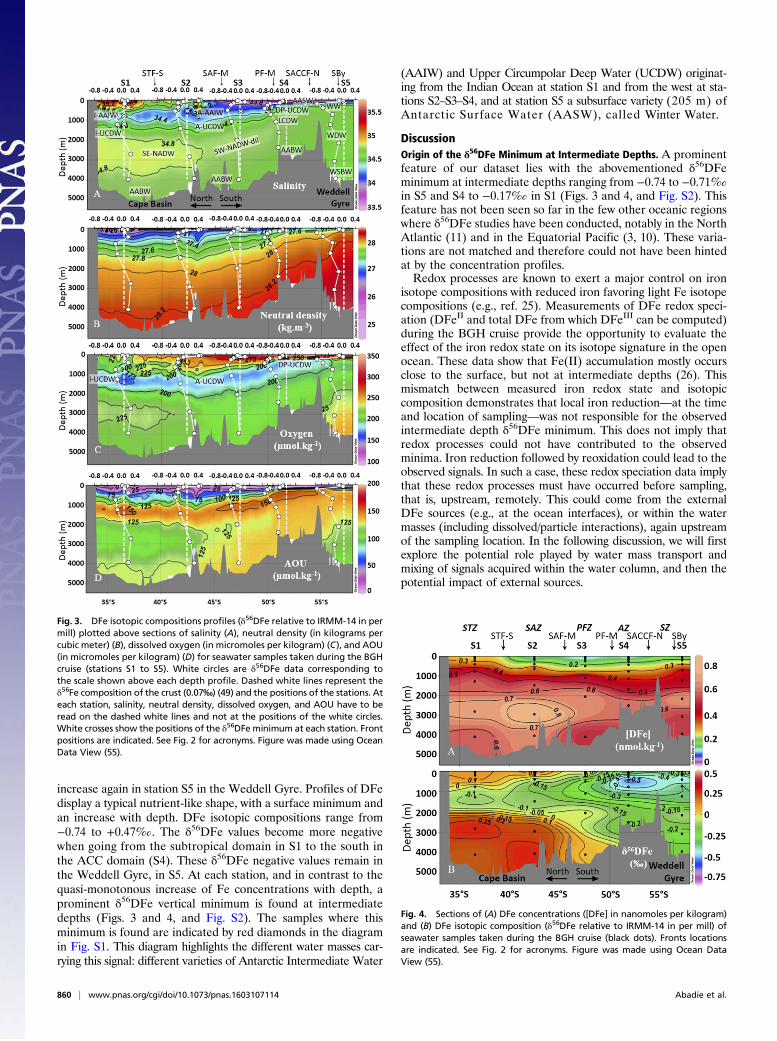
DiscussionOrigin of the δ56DFe Minimum at Intermediate Depths. A prominentfeature of our dataset lies with the abovementioned δ56DFeminimum at intermediate depths ranging from −0.74 to −0.71‰in S5 and S4 to −0.17‰ in S1 (Figs. 3 and 4, and Fig. S2). Thisfeature has not been seen so far in the few other oceanic regionswhere δ56DFe studies have been conducted, notably in the NorthAtlantic (11) and in the Equatorial Pacific (3, 10). These varia-tions are not matched and therefore could not have been hintedat by the concentration profiles.Redox processes are known to exert a major control on iron
isotope compositions with reduced iron favoring light Fe isotopecompositions (e.g., ref. 25). Measurements of DFe redox speci-ation (DFeII and total DFe from which DFeIII can be computed)during the BGH cruise provide the opportunity to evaluate theeffect of the iron redox state on its isotope signature in the openocean. These data show that Fe(II) accumulation mostly occursclose to the surface, but not at intermediate depths (26). Thismismatch between measured iron redox state and isotopiccomposition demonstrates that local iron reduction—at the timeand location of sampling—was not responsible for the observedintermediate depth δ56DFe minimum. This does not imply thatredox processes could not have contributed to the observedminima. Iron reduction followed by reoxidation could lead to theobserved signals. In such a case, these redox speciation data implythat these redox processes must have occurred before sampling,that is, upstream, remotely. This could come from the externalDFe sources (e.g., at the ocean interfaces), or within the watermasses (including dissolved/particle interactions), again upstreamof the sampling location. In the following discussion, we will firstexplore the potential role played by water mass transport andmixing of signals acquired within the water column, and then thepotential impact of external sources.
Fig. 3. DFe isotopic compositions profiles (δ56DFe relative to IRMM-14 in permill) plotted above sections of salinity (A), neutral density (in kilograms percubic meter) (B), dissolved oxygen (in micromoles per kilogram) (C), and AOU(in micromoles per kilogram) (D) for seawater samples taken during the BGHcruise (stations S1 to S5). White circles are δ56DFe data corresponding tothe scale shown above each depth profile. Dashed white lines represent theδ56Fe composition of the crust (0.07‰) (49) and the positions of the stations. Ateach station, salinity, neutral density, dissolved oxygen, and AOU have to beread on the dashed white lines and not at the positions of the white circles.White crosses show the positions of the δ56DFe minimum at each station. Frontpositions are indicated. See Fig. 2 for acronyms. Figure was made using OceanData View (55).
Fig. 4. Sections of (A) DFe concentrations ([DFe] in nanomoles per kilogram)and (B) DFe isotopic composition (δ56DFe relative to IRMM-14 in per mill) ofseawater samples taken during the BGH cruise (black dots). Fronts locationsare indicated. See Fig. 2 for acronyms. Figure was made using Ocean DataView (55).
860 | www.pnas.org/cgi/doi/10.1073/pnas.1603107114 Abadie et al.

Although the circulation across the section is mainly zonal andstructured along circumpolar fronts, meridional water masstransports do occur across these fronts as reflected, for instance,by salinity and oxygen meridional sections (Fig. 3). These me-ridional transports occur mainly along isopycnal surfaces. Neu-tral density isolines from the BGH section are displayed in Fig. 2superimposed on the schematic meridional circulation adaptedfrom Talley et al. (24). The isopycnal distribution is in very goodagreement with the circulation scheme described by Talley et al.,which confirms that this scheme may be used to describe themeridional circulation that impacts the BGH section. In additionto this information, a detailed examination of the sample hy-drographic properties (θ, S, [O2], nutrients) is used in the fol-lowing to relate the different samples to each other.Stations S2, S3, and S4 are all located within the ACC. Their
intermediate and deep waters all originate from the west and theDrake Passage. They form a coherent group of stations, whichwe will discuss first. The AAIW sampled at stations S2 and S3 isformed by subduction of AASW that itself results from the up-welling of UCDW (24, 27, 28). The δ56DFe minimum found inthe AAIW of S2 and S3 may therefore originate from the di-lution of the S4 UCDW δ56DFe minimum through mixing withAASW. A simple two end-member mixing calculation illustratedin Fig. 5 clearly confirms this hypothesis.Furthermore, the Atlantic AAIW sampled at stations S3 and S2
(Fig. 2) flows eastward into the Indian Ocean where it is furthermodified to form Indian AAIW, part of which returns to theAtlantic just south of South Africa, where we sampled it at stationS1 (Fig. 2). Similarly, the Winter Water and Warm Deep Waterwhere the δ56DFe minimum is found at S5 are formed fromAASW that itself results from the upwelling of UCDW (24, 27).Therefore, the circulation and water mass formation in theSouthern Ocean suggest that the S4 UCDW light isotopic signa-ture could also contribute to the δ56DFe minima observed atstations S1 and S5. There are significant hydrographical prop-erty (θ, S, [O2]) differences between the water masses in which theδ56DFe minima were found (Fig. S1) at stations S1 and S5, com-pared with S2–S3–S4. These differences cannot be quantitativelyaddressed in the present case because (i) we lack iron isotope datain the Indian Ocean and Weddell Sea that would be required formixing calculations, (ii) S1 and to a lesser extent S5 are under theclear influence of lithogenic inputs (29), and (iii) S5 is under theinfluence of surface processes, air/sea fluxes, and biology.
The above discussion shows that the light isotopic signature ofthe UCDW variety sampled at station S4—namely, the DrakePassage UCDW—is the source of the intermediate δ56DFeminimum found throughout the ACC (S2–S3–S4) and could alsoimpact S1 and S5. The UCDW is characterized by an oxygenminimum and a maximum in apparent oxygen utilization (AOU)(24). These characteristics result from the accumulation (in-tegration) of organic matter remineralization (that consumesoxygen) occurring within the water mass as it ages. It is higherin this water mass compared with the surrounding waters. Theisotopic fractionations associated with organic matter reminer-alization processes have not yet been extensively constrained.However, remineralization could potentially release light ironthrough kinetic fractionation, or from an initially light signatureof the remineralized matter [two studies suggest a preferentialuptake of light Fe isotopes by phytoplankton (10, 14), althoughadsorption experiments on phytoplankton lead to the oppositeconclusion (30)], or from reduction steps involved in severalremineralization mechanisms [e.g., grazing (31), microbial re-duction in aggregates (32)]. These light signatures could then beredistributed meridionally across the ACC as explained above.Other types of UCDW have been sampled: the Indian UCDW
at station S1 (1,721 m, δ56DFe = −0.12‰) and the AtlanticUCDW at stations S2 and S3 (δ56DFe = −0.12 and −0.22‰, re-spectively). They are also characterized by an oxygen minimum andan AOU maximum (reflecting remineralization within the watercolumn). They all display light δ56DFe values, just slightly heavierthan the overlying AAIW (Fig. 3). This confirms that, in this area,high remineralization coincides with light DFe isotope signature.The UCDW δ56DFe values are plotted versus AOU in Fig. 6.Excluding station S1, under the influence of lithogenic inputs, atrend can be seen: the higher the AOU, the more negative theδ56DFe. This supports the conclusion according to which remineral-ization within the water column is the most likely origin of the lightisotopic signatures found in the UCDW, which are then transferredto AAIW at least in the ACC domain (stations S2–S3–S4).Remineralization of organic matter likely plays an additional
role in the observed intermediate isotope minimum. At someoceanic margins, bacterial organic matter remineralization leadsto anoxic conditions in the sediments due to bacterial respiration.These anoxic conditions lead to the reduction of Fe(III) into solubleFe(II), which is transferred to the water column. There, iron israpidly reoxidized but nevertheless keeps a light isotopic signature(9, 12, 13, 16). Such sources may contribute to the observed δ56DFe
Fig. 5. Mixing diagrams. Properties of the Drake Passage Upper CircumpolarDeep Water (DP-UCDW), Atlantic Antarctic Intermediate Water (A-AAIW),Antarctic Surface Waters (AASW), and Indian Central Water (ICW) are shownfor stations S2, S3, and S4. The dotted lines denote the theoretical conservativemixing curves between DP-UCDW and AASW (black dotted line) and A-AAIWand ICW (red dotted line; see Supporting Information for the mixing equa-tions). The large symbols identify the δ56DFe minimum sample at each station.The diagrams show that the A-AAIW properties can be explained by a mixingbetween DP-UCDW and AASW. The slight deviation of the S2 A-AAIW prop-erties from this mixing (black dotted line) is explained by a small contributionof the warm and salty Indian Central Water (red).
Fig. 6. Dissolved iron isotopic composition of the different varieties of UCDWas a function of AOU. The dotted line shows the linear regression calculatedexcluding the Indian UCDW of station S1 that is significantly impacted bylithogenic inputs from the South African margin. S5 is not shown becausethere is no UCDW at this station.
Abadie et al. PNAS | January 31, 2017 | vol. 114 | no. 5 | 861
EART
H,A
TMOSP
HER
IC,
ANDPL
ANET
ARY
SCIENCE
SEN
VIRONMEN
TAL
SCIENCE
S
minimum especially in S1 and S5 [clearly influenced by margin in-puts (29)], and to a lesser extent also within the ACC.About 5% of the AAIW flowing in the Agulhas Current
originate as Red Sea Water [the equivalent of ∼1 Sv of pure RedSea Water (33)]. This water mass is associated to an extremeoxygen minimum originating in the northern Arabian Sea (33),where elevated Fe(II) concentrations have been reported (34).Therefore, very light Fe isotopic signatures resulting from re-ductive processes in the remote Arabian Sea, could, despitesignificant erosion due to water mass mixing along the way,contribute to the intermediate δ56DFe minimum found at S1 inthe Indian AAIW. The Red Sea Water DFe isotopic composi-tion has not been documented yet. If we assume that it is char-acterized by a δ56DFe value of −3‰ [such as what is observed inthe Californian oxygen minimum zone (9)] and a DFe concen-tration 60% larger than that of the surrounding waters with whichit would mix, and assuming a crustal isotopic composition for thesesurrounding waters (δ56DFe = +0.07‰), then the mixing of 5%Red Sea Water with 95% surrounding waters would lead to theδ56DFe value of −0.17‰ measured in the Indian AAIW sampledat S1. This shows that the above scenario is realistic. Similarly,large organic matter accumulation rates in the Antarctic Peninsulamargin sediments, leading to reducing environments, have beenshown to supply DFe through reductive dissolution (35). Thiscould contribute to the negative DFe isotopic signature found atstation S5. The impact of matter inputs from the margins of SouthAfrica and the Antarctic Peninsula is supported by several othergeochemical studies, based on rare earth element concentrationsand Nd isotopic compositions (29, 36), Pb, Cu, Ag, and Co con-centrations (23, 37), and Fe physical speciation (38).In summary, the above discussion suggests that remineralization
of particulate organic matter within the water column imparts tothe UCDW light DFe isotopic signatures, which are transferred tothe Antarctic Intermediate Water through mixing especially in theACC domain. In addition, remineralization of organic matter atthe continental margins leads to the release of isotopically lightDFe through reductive sediment dissolution, which likely alsocontributes to the intermediate water light isotopic signatures,especially at the northernmost and southernmost stations S1 andS5. The conjunction of both processes likely explains the observedδ56DFe intermediate minimum all along the BGH section.
Processes Releasing DFe in the Deep Southern Ocean. The in-termediate δ56DFe minimum contrasts with more positive valuesfound at the surface and in the deep layers (Figs. 3 and 4, Fig. S2,and Dataset S1). The surface layer is potentially subjected to mul-tiple external sources and processes, notably dust depositions, phy-toplankton uptake, and photoreduction that may affect DFe isotopecomposition and will not be discussed further. Below this surfacelayer, it is commonly thought that competition between one releaseprocess, remineralization of organic matter, and one sink, scaveng-ing, acts as the major control on DFe vertical distributions (2, 39–41).However, the clear contrast between the intermediate and
deep δ56DFe signatures along the BGH section (Figs. 3 and 4)goes against this paradigm. It reveals that distinct in situ pro-cesses and/or external sources dominate the DFe cycle at thesetwo depths. With the assumption that the DFe sink at bothdepths (intermediate and deep) is dominated by the same scav-enging process (2, 39, 40), then our observations suggest that theprocesses dominating the DFe sources in the deep ocean layersare not organic matter remineralization given the heavier DFeisotopic signatures uncovered. At depth, non-reductive release ofDFe from particles (3, 10, 11, 17) could produce the observedisotopically heavier DFe, potentially through the following:(i) desorption as suggested for thorium and protactinium (5),rare earth elements (6) or copper (7), or (ii) ligand (side-rophore)-promoted dissolution (42). This hypothesis is sup-ported by the recent documentation of the isotopic signature of a
labile fraction of suspended particles (from the North Atlantic),for which typical values are found around −0.3‰ (43). Addingto this value an isotopic fractionation associated to non-reductiverelease, typically characterized by Δ56Fe DFe-PFe ∼ +0.3‰ (3, 10),could lead to continental crust-like deep isotopic signatures observedfor DFe along our transect, with values from −0.35 to +0.28‰(Figs. 3 and 4). The particulate phases potentially involved inthese processes could include both organic and inorganic particles,among which are erosion products, notably from atmospheric andriverine inputs. These processes could occur either in the watercolumn (from sinking particles) or at oxygenated margins. Thesesignatures could then be transported within deep water massesfollowing the oceanic currents described above. Particulate 232Thconcentrations (29) combined with particulate Fe concentrations(44) suggest that particulate Fe is dominated by lithogenic Fe alongthe transect, with a trend toward larger lithogenic fractions at depthcompared with the intermediate layers. This supports the likely roleplayed by non-reductive release of DFe from lithogenic particulateFe within the water column in the deep ocean.
ConclusionsThe above discussion leads us to conclude the following:
i) In the intermediate waters, DFe primarily originates fromremineralization of organic matter in the water column andthe redistribution of this regenerated DFe through mixing,and sediment reductive dissolution at continental marginsalso related to organic matter remineralization.
ii) In the deeper waters, DFe sources are dominated by abioticprocess(es): non-reductive release of DFe from particles, nota-bly lithogenic ones, such as desorption, and/or ligand-promoteddissolution. Iron release from lithogenic particles combined toiron adsorption onto particles (DFe scavenging) may beregarded as iron exchange between both phases, as previouslysuggested in the North Atlantic and the West Pacific (3, 4).This process could correspond to the reversible scavengingconcept developed for thorium and protactinium (5).
Overall, our Fe isotope data unambiguously reveal that theDFe cycling in the intermediate and deep layers of the studiedarea is dominated by distinct processes and/or external sources.This conclusion could not have been deduced from concentrationdata only. It goes against the mainstream oversimplified viewaccording to which remineralization of organic matter is the majorpathway releasing DFe in the deep ocean (2, 39, 40). Recognitionof these differences, found in the Southern Ocean, but which mayalso occur in other oceanic regions, will have important impactson models of the oceanic iron cycle and hence on oceanic bio-geochemical cycles, the global carbon cycle, and the climate.More specifically, taking into account the non-reductive release of
DFe from particles, notably lithogenic ones, in the deep ocean couldhave several implications. This would add an additional source to theglobal oceanic DFe budget. Similarly to what has been proposed forsimilar processes at ocean margins (45), (i) this could shorten theDFe mean oceanic residence time, and (ii) these processes couldrelease other elements, including other nutrients and micronutrients.Such iron release processes are likely controlled by different pa-rameters compared with those involved into biologically mediatedorganic matter remineralization. Particulate iron concentrations,notably lithogenic ones, but also physical and chemical parameterssuch as mineralogy, temperature, or pH, could influence the mag-nitude of this DFe source. This suggests that the oceanic DFe budgetcould be more sensitive than previously thought to continental ero-sion, particle transport, and dissolved/particle interactions. Finally, asfor all deep iron sources, recognition of this deep DFe release fromlithogenic particles would reinforce the role played by vertical mixingand deep water upwelling in the control of DFe supply to the surfaceocean and therefore in the control of primary production. One could
862 | www.pnas.org/cgi/doi/10.1073/pnas.1603107114 Abadie et al.
expect that the influence of these processes on primary productionwould be maximum in areas where surface DFe inputs are low(HNLC areas) and where deep water upwelling is large, such as inthe Southern Ocean.
Sampling and MethodsSampling and analytical protocols are given in Supporting Information. Theanalytical protocol has been previously published (46), validated by theGEOTRACES intercalibration exercise (47) and an intercomparison study (48).
ACKNOWLEDGMENTS. We are grateful to M. Boye and S. Speich, co-chiefscientists of the Bonus/GoodHope cruise. We thank the Go-Flo samplingteam, J. Bown, M. Boye, E. Bucciarelli, F. Chever, G. Sarthou, and B. Wake;and the Inductively Coupled Plasma Mass Spectrometry Group of Observ-atoire Midi-Pyrénées, J. Chmeleff, F. Candaudap, and A. Marquet. We thankthe captain and crew of the French R/V Marion Dufresne. We thank twoanonymous reviewers who helped improving the data interpretation andquality of the manuscript, and Bob Anderson for proofreading. The RegionMidi Pyrénées and Pôles de Recherche et d’Enseignement Supérieur fundedthe PhD fellowship of C.A. Université Paul Sabatier, CNRS, and InstitutNational des Sciences de l’Univers funded this work.
1. Martin JH, Fitzwater SE (1988) Iron deficiency limits phytoplankton growth in thenorth-east Pacific subarctic. Nature 331:341–343.
2. Boyd PW, Ellwood MJ (2010) The biogeochemical cycle of iron in the ocean. NatGeosci 3(10):675–682.
3. Labatut M, et al. (2014) Iron sources and dissolved-particulate interactions in the sea-water of the Western Equatorial Pacific, iron isotope perspectives. Global BiogeochemCycles 28:1044–1065.
4. John SG, Adkins J (2012) The vertical distribution of iron stable isotopes in the NorthAtlantic near Bermuda. Global Biogeochem Cycles 26(2):2034.
5. Bacon MP, Anderson RF (1982) Distribution of thorium isotopes between dissolvedand particulate forms in the deep sea. J Geophys Res 87(C3):2045–2056.
6. Nozaki Y, Alibo DS (2003) Importance of vertical geochemical processes in controllingthe oceanic profiles of dissolved rare earth elements in the northeastern IndianOcean. Earth Planet Sci Lett 205(3-4):155–172.
7. Little SH, Vance D, Siddall M, Gasson E (2013) A modeling assessment of the role ofreversible scavenging in controlling oceanic dissolved Cu and Zn distributions. GlobalBiogeochem Cycles 27(3):780–791.
8. Lacan F, et al. (2008) Measurement of the isotopic composition of dissolved iron in theopen ocean. Geophys Res Lett 35(24):L24610.
9. John SG, Mendez J, Moffett J, Adkins J (2012) The flux of iron and iron isotopes fromSan Pedro Basin sediments. Geochim Cosmochim Acta 93:14–29.
10. Radic A, Lacan F, Murray JW (2011) Isotopic composition of dissolved iron in theequatorial Pacific Ocean: New constraints for the oceanic iron cycle. Earth Planet SciLett 306:1–10.
11. Conway TM, John SG (2014) Quantification of dissolved iron sources to the NorthAtlantic Ocean. Nature 511(7508):212–215.
12. Severmann S, McManus J, Berelson WM, Hammond DE (2010) The continental shelfbenthic iron flux and its isotope composition. Geochim Cosmochim Acta 74(14):3984–4004.
13. Homoky WB, Severmann S, Mills RA, Statham PJ, Fones GR (2009) Pore-fluid Fe iso-topes reflect the extent of benthic Fe redox recycling: Evidence from continental shelfand deep-sea sediments. Geology 37(8):751–754.
14. Ellwood MJ, et al. (2015) Iron stable isotopes track pelagic iron cycling during asubtropical phytoplankton bloom. Proc Natl Acad Sci USA 112(1):E15–E20.
15. Rouxel OJ, Auro M (2010) Iron isotope variations in coastal seawater determined bymulticollector ICP-MS. Geostand Geoanal Res 34(2):135–144.
16. Chever F, et al. (2015) Total dissolvable and dissolved iron isotopes in the water col-umn of the Peru upwelling regime. Geochim Cosmochim Acta 162:66–82.
17. Homoky WB, John SG, Conway TM, Mills RA (2013) Distinct iron isotopic signaturesand supply from marine sediment dissolution. Nat Commun 4:2143.
18. Beard BL, et al. (2010) Iron isotope fractionation between aqueous ferrous iron andgoethite. Earth Planet Sci Lett 295(1-2):241–250.
19. Crosby H, Roden E, Johnson C, Beard B (2007) The mechanisms of iron isotope frac-tionation produced during dissimilatory Fe(III) reduction by Shewanella putrefaciensand Geobacter sulfurreducens. Geobiology 5(2):169–189.
20. Johnson CM, Roden EE, Welch SA, Beard BL (2005) Experimental constraints on Feisotope fractionation during magnetite and Fe carbonate formation coupled to dis-similatory hydrous ferric oxide reduction. Geochim Cosmochim Acta 69(4):963–993.
21. Dideriksen K, Baker JA, Stipp SLS (2008) Equilibrium Fe isotope fractionation betweeninorganic aqueous Fe(III) and the siderophore complex, Fe(III)-desferrioxamine B.Earth Planet Sci Lett 269(1-2):280–290.
22. Kiczka M, et al. (2010) Iron isotope fractionation during proton- and ligand-promoteddissolution of primary phyllosilicates. Geochim Cosmochim Acta 74(11):3112–3128.
23. Bown J, et al. (2011) The biogeochemical cycle of dissolved cobalt in the Atlantic andthe Southern Ocean south off the coast of South Africa. Mar Chem 126(1-4):193–206.
24. Talley LD, Pickard GL, Emery WJ, Swift JH (2011) Descriptive Physical Oceanography:An Introduction (Elsevier Academic, Burlington, MA), 6th Ed.
25. Johnson CM, Beard BL, Roden EE (2008) The iron isotope fingerprints of redox andbiogeochemical cycling in the modern and ancient Earth. Annu Rev Earth Planet Sci36:457–493.
26. Sarthou G, et al. (2011) Labile Fe(II) concentrations in the Atlantic sector of theSouthern Ocean along a transect from the subtropical domain to the Weddell SeaGyre. Biogeosciences 8(9):2461–2479.
27. Talley LD (1999) Some aspects of ocean heat transport by the shallow, intermediateand deep overturning circulations. Mechanisms of Global Climate Change at MillennialTime Scales, Geophysical Monograph Series, eds Clark PU, Webb RS, Keigwin LD(American Geophysical Union, Washington, DC), pp 1–22.
28. Carter BR, Talley LD, Dickson AG (2014) Mixing and remineralization in waters de-trained from the surface into Subantarctic Mode Water and Antarctic IntermediateWater in the southeastern Pacific. J Geophys Res Oceans 119(6):4001–4028.
29. Garcia-Solsona E, et al. (2014) Rare earth elements and Nd isotopes tracing watermass mixing and particle-seawater interactions in the SE Atlantic. GeochimCosmochim Acta 125:351–372.
30. Poitrasson F, et al. (2014) Iron isotope composition of the bulk waters and sedimentsfrom the Amazon River Basin. Chem Geol 377:1–11.
31. Sarthou G, et al. (2008) The fate of biogenic iron during a phytoplankton bloom in-duced by natural fertilisation: Impact of copepod grazing. Deep Sea Res Part II TopStud Oceanogr 55(5-7):734–751.
32. Alldredge AL, Cohen Y (1987) Can microscale chemical patches persist in the sea?Microelectrode study of marine snow, fecal pellets. Science 235(4789):689–691.
33. Beal LM, Ffield A, Gordon AL (2000) Spreading of Red Sea overflow waters in theIndian Ocean. J Geophys Res 105(C4):8549–8564.
34. Moffett JW, et al. (2015) Biogeochemistry of iron in the Arabian Sea. LimnolOceanogr 60(5):1671–1688.
35. Measures CI, et al. (2013) The influence of shelf processes in delivering dissolved ironto the HNLC waters of the Drake Passage, Antarctica. Deep Sea Res Part II Top StudOceanogr 90:77–88.
36. Hegner E, Dauelsberg HJ, van der Loeff MMR, Jeandel C, de Baar HJW (2007) Ndisotopic constraints on the origin of suspended particles in the Atlantic sector of theSouthern Ocean. Geochem Geophys Geosyst 8:Q10008.
37. Boye M, et al. (2012) Distributions of dissolved trace metals (Cd, Cu, Mn, Pb, Ag) in thesoutheastern Atlantic and the Southern Ocean. Biogeosciences 9(8):3231–3246.
38. Chever F, et al. (2010) Physical speciation of iron in the Atlantic sector of the SouthernOcean along a transect from the subtropical domain to the Weddell Sea Gyre.J Geophys Res 115(C10):2156–2202.
39. Wu J, Boyle E (2002) Iron in the Sargasso Sea: Implications for the processes controllingdissolved Fe distribution in the ocean. Global Biogeochem Cycles 16(4):33-1–33-8.
40. Bruland KW, Orians KJ, Cowen JP (1994) Reactive trace metals in the stratified centralNorth Pacific. Geochim Cosmochim Acta 58:3171–3182.
41. Boyd PW, Ibisanmi E, Sander SG, Hunter KA, Jackson GA (2010) Remineralization of upperocean particles: Implications for iron biogeochemistry. Limnol Oceanogr 55(3):1271–1288.
42. Brantley SL, et al. (2004) Fe isotopic fractionation during mineral dissolution with andwithout bacteria. Geochim Cosmochim Acta 68(15):3189–3204.
43. Revels BN, Ohnemus DC, Lam PJ, Conway TM, John SG (2014) The isotope signatureand distribution of particulate iron in the north Atlantic ocean. Deep Sea Res Part IITop Stud Oceanogr 116:321–331.
44. Mawji E, et al. (2015) The GEOTRACES Intermediate Data Product 2014. Mar Chem177(Pt 1):1–8.
45. Jeandel C, et al. (2011) Ocean margins: The missing term in oceanic element budgets?Eos (Wash DC) 92(26):217–218.
46. Lacan F, et al. (2010) High-precision determination of the isotopic composition ofdissolved iron in iron depleted seawater by double spike multicollector-ICPMS. AnalChem 82(17):7103–7111.
47. Boyle EA, et al. (2012) GEOTRACES IC1 (BATS) contamination-prone trace elementisotopes Cd, Fe, Pb, Zn, Cu, and Mo intercalibration. Limnol Oceanogr Methods 10:653–665.
48. Conway TM, John SG, Lacan F (2016) Intercomparison of dissolved iron isotope pro-files from reoccupation of three GEOTRACES stations in the Atlantic Ocean. MarChem 183:50–61.
49. Poitrasson F (2006) On the iron isotope homogeneity level of the continental crust.Chem Geol 235(1-2):195–200.
50. Beard BL, Johnson CM, Von Damm KL, Poulson RL (2003) Iron isotope constraints onFe cycling and mass balance in oxygenated Earth oceans. Geology 31(7):629–632.
51. Escoube R, et al. (2015) Iron isotope systematics in Arctic rivers. C R Geosci 347(7-8):377–385.
52. Rouxel O, Sholkovitz E, Charette M, Edwards KJ (2008) Iron isotope fractionation insubterranean estuaries. Geochim Cosmochim Acta 72(14):3413–3430.
53. Rouxel O, Shanks WC, III, Bach W, Edwards KJ (2008) Integrated Fe- and S-isotopestudy of seafloor hydrothermal vents at East Pacific Rise 9–10°N. Chem Geol 252(3-4):214–227.
54. Sokolov S, Rintoul SR (2009) Circumpolar structure and distribution of the AntarcticCircumpolar Current fronts: 2. Variability and relationship to sea surface height.J Geophys Res 114(C11):C11019.
55. Schlitzer R (2009) Ocean Data View. Available at odv.awi.de. Accessed November 3,2013.
Abadie et al. PNAS | January 31, 2017 | vol. 114 | no. 5 | 863
EART
H,A
TMOSP
HER
IC,
ANDPL
ANET
ARY
SCIENCE
SEN
VIRONMEN
TAL
SCIENCE
S