IRON CONTENT OF FOOD COOKED IN IRON ... - TTU DSpace Home
82
IRON CONTENT OF FOOD COOKED IN IRON UTENSILS by CHERYL EILEEN NOSSAMAN, B.S. in H.E. A THESIS IN FOOD AND NUTRITION Submitted to the Graduate Faculty of Texas Tech University in Partial Fulfillment of the Requirements for the Degree of MASTER OF SCIENCE IN HOME ECONOMICS Approved Accepted May, 1984
Transcript of IRON CONTENT OF FOOD COOKED IN IRON ... - TTU DSpace Home

IRON CONTENT OF FOOD COOKED IN IRON UTENSILS
by
CHERYL EILEEN NOSSAMAN, B.S. in H.E.
A THESIS
IN
FOOD AND NUTRITION
Submitted to the Graduate Faculty of Texas Tech University in Partial Fulfillment of the Requirements for
the Degree of
MASTER OF SCIENCE IN
HOME ECONOMICS
Approved
Accepted
May, 1984
c^c / - '
ACKNOWLEDGMENTS
I would like to express appreciation to Dr. Helen C. Brittin
for her generous guidance and direction of this thesis. I would
also like to thank the other members of my committee. Dr. Barbara
J. Stoecker and Dr. Merrilyn N. Cummings, for their helpful criticism.
11

CONTENTS
ACKNOWLEDGMENTS ii
LIST OF TABLES iv
I. INTRODUCTION 1
Purpose and Scope of the Thesis 1
Review of Previous Research 3
II. METHODS AND MATERIALS 9
Use of Iron Utensils Survey 9
Iron in Food Study 11
Statistical Methods 14
III. RESULTS AND DISCUSSION 15
Use of Iron Utensils Survey 15
Iron in Food Study 42
IV. SUMMARY AND CONCLUSIONS 56
REFERENCES 59
APPENDIX 61
111

LIST OF TABLES
1. Test for Independence for Fair and Convention Samples and Discrete Variables in the Use of Iron Utensils Survey . . . . 16
2. Least Squares Means for Continuous Socioeconomic Data for Fair and Convention Samples 27
3. Distribution and Percent of the Convention Sample by State 28
4. Test for Independence for the Use of Iron Cookware and for Discrete Variables 29
5. Test for Independence for Use of Iron Cookware and the Number of Iron Utensils Owned 38
6. Least Squares Means for Continuous Socioeconomic Data and the Use of Iron Cookware 39
7. Least Squares Analysis of Variance for the Effect of Food, Treatment, Replication and Sample on Moisture and Iron Content 43
8. Mean Moisture and Iron Content of Food by Treatment 44
9- Means for Moisture and Iron Content of 20 Foods by Treatment 45
10. Means for pH, Cooking Time and Moisture Content of 20 Foods 49
11. Least Squares Analysis of Variance for the Effect of Food, Treatment, Replication and Sample on the Moisture and Iron Content of Three Foods Cooked in Two Iron Utensils 51
12. Mean Moisture and Iron Content of Three Foods by Treatment 53
13. Mean Iron Content of Three Foods Cooked in Two Iron Utensils 54
IV

CHAPTER I
INTRODUCTION
Purpose and Scope of the Thesis
Iron is a mineral which is essential to higher forms of life
because its central role in the heme molecule permits oxygen and
electron transport (Beutler, 1980). It is highly uncommon for a
nutrient to be found deficient in the peoples of both developed and
developing countries. Iron is such a nutrient (Monsen and Balintfy,
1982). The iron content of typical diets adequate in other respects is
estimated to be 6 mg per 1000 kcal, but the amount of absorbed iron
varies (Robinson and Lawler, 1982). Most iron, upon digestion, enters
either a pool of heme iron or a pool of nonheme iron. JIumans_absorb
heme iron, found as 40% of total iron in meat, fish and poultry, as an
intact iron porphyrin complex at a relatively high rate. Nonheme
iron, inorganic iron salts or all of the iron in grains and vegetables
and approximately three-fifths of the iron in meat, fish and poultry,
is absorbed at a lower rate (Monsen and Balintfy, 1982). Women,
adolescents, infants and children are at risk of developing iron-
deficiency anemia. Women lose iron through menstrual blood loss or
pregnancy. Infants and children need iron for increasing blood volume
for growth. Both groups may not absorb all of the iron that they
need from the typical diet. However, an increase in physiological
needs will increase the rate of iron absorption (Beutler, 1980).
Monsen and Balintfy (1982) summarized methods to improve absorption

of nonheme iron through dietary modifications. The use of iron cooking
utensils is a possible means to increase the amount of dietary iron.
Studies by Bothwell et al. (1964) of the South African Bantus and Lai
et al. (1973) have indicated that iron in foods from iron cooking
utensils can be bioavailable to the organism.
There is little research available on the iron content of foods
cooked in iron utensils. Some conflict in the literature as to the
actual increase of iron in foods cooked in iron utensils is apparent.
Generally, iron content of food has been shown to increase when cooked
in iron utensils. Also, age and condition of the iron utensils may
affect increase in iron of food cooked in iron utensils (White, 1968;
Burroughs and Chan, 1972).
Moore (1965) and Mertz (1980) hypothesized that the decreasing
use of iron cookware would have an adverse effect on dietary iron
intake. White (1968) conducted a survey to obtain information on the
current use and changes in use of iron utensils.
The focus of the current study is on the iron content of food
cooked in iron utensils, as well as the factors affecting the increase
in iron content of the food.
O /L- Objectives of the current study were to determine the extent to
which iron cooking utensils are used currently and to determine the
iron content of a variety of foods cooked in iron cooking utensils and
in non-iron utensils using household cooking methods. The effects
of acidity, cooking time and moisture content of food and of different
iron utensils on the iron content of the food cooked in iron utensils
were examined.

Review of Previous Research
Iron content of food cooked in iron utensils was studied as early
as 1945 by Mackay et al. (1945). A study on the presence of anemia
in wartime day nursery children was conducted. One part of the study
was to cook three foods in three different types of pans (aluminum,
iron and enamel). Mackay et al. (1945) found a fifteen-fold increase
in the apples cooked in a polished iron saucepan in one nursery and a
five-fold increase in the iron content of apples cooked in an old-
fashioned heavy black iron saucepan in another nursery. Two other
foods, stock and potatoes, showed no significant increase in iron
content. The authors attributed the increase in iron of the apples to
the acidity and longer cooking in time.
Under extreme conditions, cooking in iron utensils can lead to
iron overload. This is seen in the high incidence of hemosiderosis,
tissue deposition of iron without tissue damage, in Bantu subjects in
South Africa. Bothwell et al. (1964) found that the majority of the
subjects were taking in between 50 and 100 mg of iron daily, most of
which was present in their homemade beer brewed in iron pots. For
comparison, the highest recommended dietary allowance for iron in the
United States is 18 mg for adult women, aged 23-50 (Food and Nutrition
Board, 1980). Bothwell et al. (1964) have investigated the theory
that the Bantus have increased iron absorption. It was found that the
Bantus actually had lowered absorption compared to white volunteer
subjects, particularly at the 25 mg level of iron present in the home
brewed beer. The Bantus had a lowered absorption of iron due to the
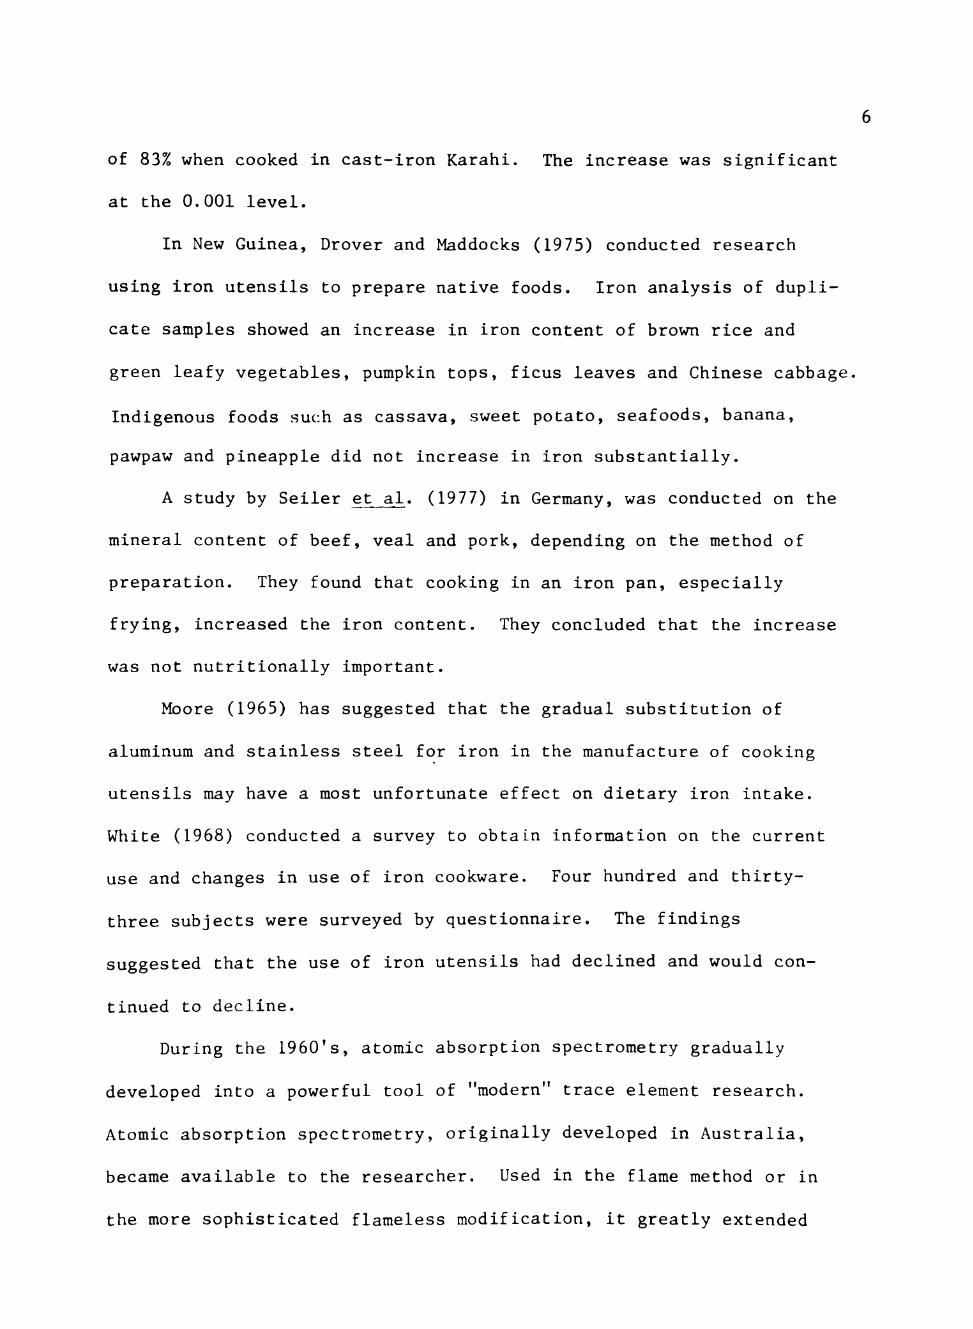
existing overload. Bothwell et al. (1964) also concluded that the
degree of siderosis present in the Bantus could be explained by their
high intake of iron alone.
Moore (1965) reported a large difference in the calculated iron
content compared to the analyzed iron content of food cooked in iron
utensils of foods served to the military of several countries, in
contrast to usually close agreement between these values in the United
States. The estimates of iron intake made from food composition tables
ignore the contribution made from cooking utensils (Moore, 1965).
Moore (1965) then investigated the effect of cooking in iron utensils.
Seven foods were studied. The most acidic foods with the longest
cooking times, spaghetti sauce and apple butter, showed the greatest
increases in iron content. The greatest increase in iron found was
approximately one hundred-fold, with apple butter cooked for 2 hours.
But even the average five-fold increase of the iron in foods such as
gravy, fried potatoes, rice casserole, beef hash, or scrambled eggs
must be considered nutritionally important (Mertz, 1980).
As part of a study of iron status of menstruating women,
Monsen et al. (1967) conducted an experiment to determine the possible
effect of cooking with iron utensils on the iron content of the diet.
Two foods, eggs and hamburger, were cooked in three well tempered
iron pans and one aluminum pan. When iron content of the uncooked
food was compared to the foods cooked in the iron pans, there was
no increase in iron content.
In a study performed by White (1969), 24-hour diets of girls and

young women were analyzed for iron content. The analyzed iron values
were less than the calculated values for forty-one of the forty-eight
composites. Two of the diets that had a higher analyzed iron content
contained foods that were prepared in iron cooking utensils. Spa
ghetti sauce prepared in an iron utensil had 54.4 mg iron by analysis
and 7.4 mg by calculation. Spanish rice in the second diet cooked in
an iron utensil contained 13.8 mg of iron by analysis and 11.4 mg
iron by calculation.
Results of a comparative study of the iron content of 18
Mexican-American foods were reported by Burroughs and Chan (1972).
The iron contents of the foods were calculated from food tables and
compared to the iron contents of these foods analyzed after cooking
in glass or aluminum containers and in iron utensils. The largest
percent differences were shown in chicken with zucchini, 356.3%, and
macaroni-beef stew, 238.7%. Generally, it was found that the foods
cooked in an iron utensil showed higher iron content compared to
the foods cooked in glass or aluminum utensils. Overall, the foods
cooked in iron, glass or aluminum had quite different iron values than
the values calculated from the food tables.
Lai et al. (1973) fed four healthy adults milk boiled in cast-iron
Karahi. They showed an increase of twenty percent in their serum iron
within half an hour and the level was maintained up to 2 hours. The
value at 5 hours was still raised by 10% of fasting initial value.
Lai et al. (1973) found that boiling milk in a cast-iron Karahi resulted
in a 30% increase in iron content and fried potatoes showed an increase
of 83% when cooked in cast-iron Karahi. The increase was significant
at the 0.001 level.
In New Guinea, Drover and Maddocks (1975) conducted research
using iron utensils to prepare native foods. Iron analysis of dupli
cate samples showed an increase in iron content of brown rice and
green leafy vegetables, pumpkin tops, ficus leaves and Chinese cabbage.
Indigenous foods such as cassava, sweet potato, seafoods, banana,
pawpaw and pineapple did not increase in iron substantially.
A study by Seller et al. (1977) in Germany, was conducted on the
mineral content of beef, veal and pork, depending on the method of
preparation. They found that cooking in an iron pan, especially
frying, increased the iron content. They concluded that the increase
was not nutritionally important.
Moore (1965) has suggested that the gradual substitution of
aluminum and stainless steel for iron in the manufacture of cooking
utensils may have a most unfortunate effect on dietary iron intake.
White (1968) conducted a survey to obtain information on the current
use and changes in use of iron cookware. Four hundred and thirty-
three subjects were surveyed by questionnaire. The findings
suggested that the use of iron utensils had declined and would con
tinued to decline.
During the 1960's, atomic absorption spectrometry gradually
developed into a powerful tool of "modern" trace element research.
Atomic absorption spectrometry, originally developed in Australia,
became available to the researcher. Used in the flame method or in
the more sophisticated flameless modification, it greatly extended

the detection limits for many trace elements (Mertz, 1980).
During the 1970's, nutritional research on minerals and trace
elements substantially intensified and accelerated. One of the
main results of this research is that mineral and trace element
interactions are now more completely understood and are recognized
as important determinants of metabolism and nutritional status (Mertz,
1980).
The important interaction among iron, ascorbic acid and meat
have been described and quantified, and recommendations for applica
tion were outlined by Monsen et al. (1978). Monsen and Balintfy (1982)
reviewed the important effects of enhancing factors upon the absorp
tion of non-heme iron, inorganic iron salts, found in foods of low
iron availability. Ascorbic acid, meats, fish and poultry, when con
sumed with low iron availability foods, enhance the amount of non-heme
iron absorbed. Mertz (1980) stated that the interactions of iron
provide a tool to increase iron absorption and to decrease available
iron in patients at risk of iron overload.
The aqueous environment and heat during preparation are con
ducive to the formation of complexes between iron and some food
constituents (Mertz, 1980). Several of the previous investigators
tended to agree that the acidity and the cooking time affect the
increase in iron content of foods when cooked in iron utensils (Mackay
et al., 1945; Moore, 1965; White, 1969; Burroughs and Chan, 1972).
Previous studies do not provide clear explanations of methodology
and do not have more than one replication of their experiment (Macka V

8
et al., 1945; Moore, 1965; Monsen et al., 1967). Burroughs and Chan
(1972) performed the only extensive comparison study of the increased
iron content of food prepared in iron utensils and in non-iron uten
sils; however, the baseline iron content of the food was calculated
and not analyzed. In many of the other studies, research on iron
content of food cooked in iron utensils was performed only as a smaller
portion of a larger study (Mackay et al., 1945; Bothwell et al., 1964;
Moore, 1965; Monsen et al., 1967; White, 1969; Lai et al., 1973).
There is no current information on the use of iron cookware. There
fore, information on the current use of iron cookware and the amount
of iron in a variety of foods cooked in iron utensils needs to be
obtained.

CHAPTER II
METHODS AND MATERIALS
Use of Iron Utensils Survey
Information concerning the current use of iron cooking utensils
was obtained by surveys conducted at the 1982 Panhandle South Plains
Fair in Lubbock, Texas, and the 1982 American Dietetic Association
Convention in San Antonio, Texas. Both surveys were conducted in
October, 1982.
A questionnaire (Appendix A) was developed from the previous
study on the use of iron cookware by \ hite (1968). White surveyed a
total of 433 persons from two women's church organizations in a
Chicago suburb, the Chicago Nutrition Association, and the 1967
meetings of the American Home Economics Association and the American
Dietetic Association. Because the survey questions and groups were
similar, data obtained from this research can serve as a follow-up
to the study done by White in 1968.
The questionnaire was pilot-tested before the actual survey.
The questionnaire was given to a group of persons numbering over 10%
of the size of the study sample and who were similar in characteristics
to the study sample, dietitians and students who live in the Lubbock,
Texas area.
There were 182 questionnaires completed at the 1982 Panhandle
South Plains Fair (Appendix A). A booth in the Commercial Exhibit
Building at the Fair was obtained for the four surveyors, three

10
undergraduate university students and one graduate student, to survey
the subjects as they viewed the exhibits. A sign with "Texas Tech
University, Department of Food and Nutrition" was used at the booth.
The four surveyors included one Hispanic student, one Black student,
and two Caucasian students. The three undergraduate students were
trained by the graduate student researcher. F,ach student surveyor
had the opportunity to ask another surveyor the questions from the
questionnaire. Guidelines for questioning and reporting responses
were agreed upon. The surveyors asked the subjects at the Fair if
they would answer some questions on iron cookware. The subjects were
questioned and their responses were recorded on the questionnaires by
the surveyors. An unbiased attempt was made by the surveyors to ques
tion approximately every third person who passed the booth.
The questionnaire was revised following the Fair survey, mainly
to arrange socioeconomic questions together. The revised questionnaire
(Appendix B) was distributed by the researcher in the rest area at the
1982 American Dietetic Association Convent:ion Exhibits. The researcher
attempted to distribute the questionnaire in an unbiased manner. The
subjects completed the questionnaires and returned them to the re
searcher. There were 184 questionnaires completed at the Convention.
It was believed that all three ethnic groups, Caucasian, Hispanic and
Black, in the Lubbock area (Brittin, 1974) would be represented at the
Panhandle South Plains Fair and that a nationwide sample could be
obtained at the American Dietetic Association Convention.

11
Iron in Food Study
Twenty foods were cooked in iron and in non-iron utensils to
compare the iron content of the foods due to cooking in iron utensils.
The cast-iron skillet was used because it was the most commonly used
iron utensil by persons who use iron cookware, according to the present
survey and to that by White (1968). Two new, seasoned, 9-inch iron
skillets were used. The skillet used throughout the study had been
used several times a day for about two weeks prior to this study. The
second skillet, which had been used fewer times prior to the study,
was used to cook three foods (spaghetti sauce, applesauce and scrambled
eggs) to test the variability of iron content in foods when cooked in
different iron skillets. Moore (1965) found these three foods to have
great increases in iron when cooked in iron utensils. The non-iron
utensil used was a 9-inch Corningware dish.
The three treatments of each food analyzed for iron content
included raw, cooked in iron utensil, and cooked in non-iron utensil.
Three replications were prepared of the three treatments for each food.
The twenty foods selected included foods frequently cooked in
iron utensils by most people, as determined from the present survey.
The foods also included foods from each food group and foods previously
studied for iron content when cooked in iron utensils (Moore, 1965;
Monsen et al., 1967; Burroughs and Chan, 1972).
All foods were purchased at the same time and prepared within
a period of ten days. Common cooking methods and recipes were used
(Appendix C). Weights before cooking and cooking times were controlled

12
throughout all of the replications for each food. Cooked weights were
recorded to determine yield. Each food sample was blended in a glass
blender, the pH was determined, and the sample was stored in a plastic
freezer bag and frozen. Before freezing, pH was determined for each
treatment. Cooking data (weight and time) and pH were recorded on
the food cooking record (Appendix D). Careful preparation of the
foods and careful utensil cleaning procedures minimized iron contami
nation from water or utensils. All utensils were thoroughly washed
after each replication in a sink of fresh hot water and detergent,
rinsed two times with running cold tap water in the adjacent sink,
rinsed in two pans of deionized water, and placed on a rack to air
dry. The deionized water used in cooking and cleaning contained
negligible amounts of iron.
For analysis, the frozen samples were thawed in a refrigerator and
each sample was blended again to make it homogeneous in consistency.
Duplicate samples were dried, ashed, and analyzed for moisture and
iron content using AOAC (1980) methods. Two 5 g samples were taken
from the center of each of the blended food samples and placed in
acid-rinsed, air-dried procelain crucibles with lids. Moisture content
was determined by drying the six 5 g samples of each food plus an
empty crucible with lid in a drying oven at 100-102°C until constant
weight was achieved in approximately 17-20 hours. Final constant
weights were adjusted for moisture loss from the empty crucible. Dry
ashing was used. Three drops of pure olive oil were added to each
crucible and heated on a hot plate set for medium temperature, until

13
swelling stopped, for 15 minutes. The six samples plus the blank were
then ashed in the muffle furnance at 425°C until white ash was obtained
(overnight). The ashing temperature of 425^0 was used rather than 525°C
stated in the AOAC method because in dry ashing some iron loss may
occur because iron volatilizes as ferric chloride at 450°C (Pomeranz
and Meloan, 1978). Ash was then moistened with 1 ml of deionized water
and dried on a 250°C steam bath for 15 minutes, dried on .> hot plate on
medium temperature for 15 minutes, and then re-ashed in the muffle fur-
nance at 425°C to constant weight (2 hours). The ashes were dissolved
in 15 ml of 20% nitric acid and filtered through No. 42 (ashless)
Whatman filter paper into volumetric flasks. T'he residue and paper v;ere
rinsed three times with 3 ml deionized water each time. Either 50 or
100 ml volumetric flasks were used, depending on the calculated concen
tration of iron in the food (USDA, 1963; USDA, 1976-1982). The filtered
samples were analyzed for iron content by flame atomic absorption spec
trophotometry on a Perkin Elmer Model 5000 atomic absorption spectro
photometer, at a wavelength of 248.3 nm and slit setting of 0.2 nm
(Perkin-Elmer, 1980). Iron content of the samples was measured against
the iron standard, 1000 ppm atomic absorption standard, ferric chloride,
which was diluted to 5 ppm iron with .180 absorbanc-e.
All glassware was cleaned carefully to prevent iron contamination.
Glassware was washed in hot sudsy water, rinsed with tap water and
then with deionized water, soaked in distilled water with diluted
hydrochloric acid, rinsed twice with deionized water and air dried.
Acid reagents used (nitric acid and hydrochloric acid) contained

14
minimal iron. Deionized water was distilled water which was run through
a deionizing column; it contained minimal iron.
A recovery study was performed with the blended raw pancake batter
because of its homogeneity. Six 5 g samples of the pancake batter were
weighed out. Ferric chloride standard (1 ml) was added to each of the
three samples and deionized water (1 ml) was added to each of the other
three samples. The samples were dried, ashed and analyzed for iron
content according to the stated procedure. Recovery of the added
ferric chloride standard was 98.5 percent.
Statistical Methods
Chi-square procedures (Nie et al., 1975) were used to analyze
the discrete variables from the questionnaires. Analysis of variance
was used to analyze the continuous data obtained from the question
naires in the use of iron utensils survey.
The design of the iron in food study was factorial: 20 foods x
3 treatments x 3 replications x 2 samples. The design included 4
treatments and 3 foods in the part of the study in which two different
iron skillets were used. The method of least squares analysis of
variance (Harvey, 1960) was used to determine the effects of the main
factors (food, treatment, replication and sample) and of the two-factor
interactions on the continuous dependent variables. Duncan's Multiple
Range Test used to test the difference between appropriate means when
the analysis of variance showed a significant effect in a main factor.
Relationships between pH of raw food, moisture, and iron content were
determined by simple correlation coefficients.

CHAPTER III
RESULTS AND DISCUSSION
Use of Iron Utensils Survey
Questionnaires obtained from the survey numbered 182 from the
Fair and 184 from the Convention. Results of the survey for the two
samples are shown in Table 1. The main results regarding cooking
variables are the following. Most of the subjects (80%) indicated
that they prepare most of their own meals. Most of the subjects
(79%) owned iron cookware. Most of the subjects (61%) said that the
utensil used most often was the skillet while 30% said it was the
saucepan. More subjects indicated that the utensil used most often
was made of stainless steel (36%) than any other material; iron was
the second most popular material with 22% of the subjects stating
that the utensil used most often was made of iron. Most of the sub
jects (72%) use iron cookware. More of the subjects (41%) said that
they owned one kind of iron utensil, 21% owned none, and 21% owned
two kinds. The kind of iron utensil owned by the most people (75%)
was the skillet. Nineteen percent of the subjects owned an iron
griddle, 19% owned an iron cornstick mold, 20% owned an iron Dutch
oven, 8% owned an iron muffin pan, and 7% owned other iron utensils.
Although 25% of the subjects said they never use the iron skillet,
25% said they use it several times per week and 23% said they use it
daily. Iron utensils other than the skillet were used by few people;
most of the subjects (56%) never used them and 25% seldom used them.
15

16
TABLE 1: Test for Independence for Fair and Convention Samples and
Discrete Variables in the Use of Iron Utensils Survey
Variable
Prepare most of own meals
No Yes
Own iron cookware
No Yes
Utensil used most often
Skillet
Saucepan
Dutch oven
Roaster
Other
Utensil used most often is
made of Aluminum Stainless steel
Glass
Corning
Iron
Enamel
Other
Use iron cookware
No Yes
Fair
Sample
Convention
Number of subji
28 154
37 145
142 29 1 0 10
29 48 2 14 42 3
44
49 133
45 139
40 144
81 81 4 6 12
36 83 1 8 39 3 14
54 130
Total
sets
73 293
77 289
223 110 5 6 22
65 131 3 22 81 6 58
103 263
df
1
1
4
6
1
Chi-
square
value
4.16-'
0.04
49-24"*
27.69**
0.16
Number of kinds of
iron utensils owned
0
1
6 or more
37 67 39 18 10 8 3
40 83 36 13 7 4 1
77 150 75 31 17 12 4
6 5.60

TABLE 1 - Continued
17
Variable
Iron utensils owned None No Yes
Skillet No Yes
Griddle No Yes
Cornstick mold No Yes
Dutch oven No Yes
Muffin pan No Yes
Other No Yes
Use iron skillet Never Seldom 2-3 times/month 2-3 times/week Daily
Use iron utensils other than skillet
Never Seldom Every week 2 or 3 times/week Daily
Fair
Numt
145 37
41 141
144 38
148 34
141 41
164 18
164 18
51 22 15 34 60
110 39 8 15 10
Sample
Convention
)er of subjf
144 40
52 132
154 30
149 35
152 32
173 11
176 8
41 34 28 56 25
94 51 15 16 8
Total
2CtS
289 77
93 273
298 68
297 69
293 73
337 29
340 26
92 56 43 90 85
204 90 23 31 18
Chi-square
df value
1 0.04
1 1.30
1 0.98
1 0.00
1 1.21
1 1.42
1 3.46
4 27.37**
4 5.23

TABLE 1 - Continued
18
• •
Variable
Number of foods cooked in iron utensils
None 1 2 3 4 5 6 All except 1 All
Foods cooked in iron utensils None No Yes
Fried foods No Yes
Cornbread No Yes
Eggs No Yes
Bacon No Yes
Meat No Yes
Other No Yes
All No Yes
Fair
Numb
43 45 26 20 12 3 1 1
31
140 42
136 46
161 21
158 24
166 16
147 35
128 54
150 32
Sample
Convention
,
Total
>er of subjects
46 44 44 29 9 4 2 2 4
138 46
168 16
168 16
140 44
176 8
91 93
115 69
178 6
89 89 70 49 21 7 3 3 35
278 88
304 62
329 37
298 68
342 24
238 128
243 123
328 38
Chi-square
df value
8 28.45**
1 0.09
1 16.72**
1 0.53
1 6.27*
1 2.27
1 38.08**
1 2.18
1 18.66**
19
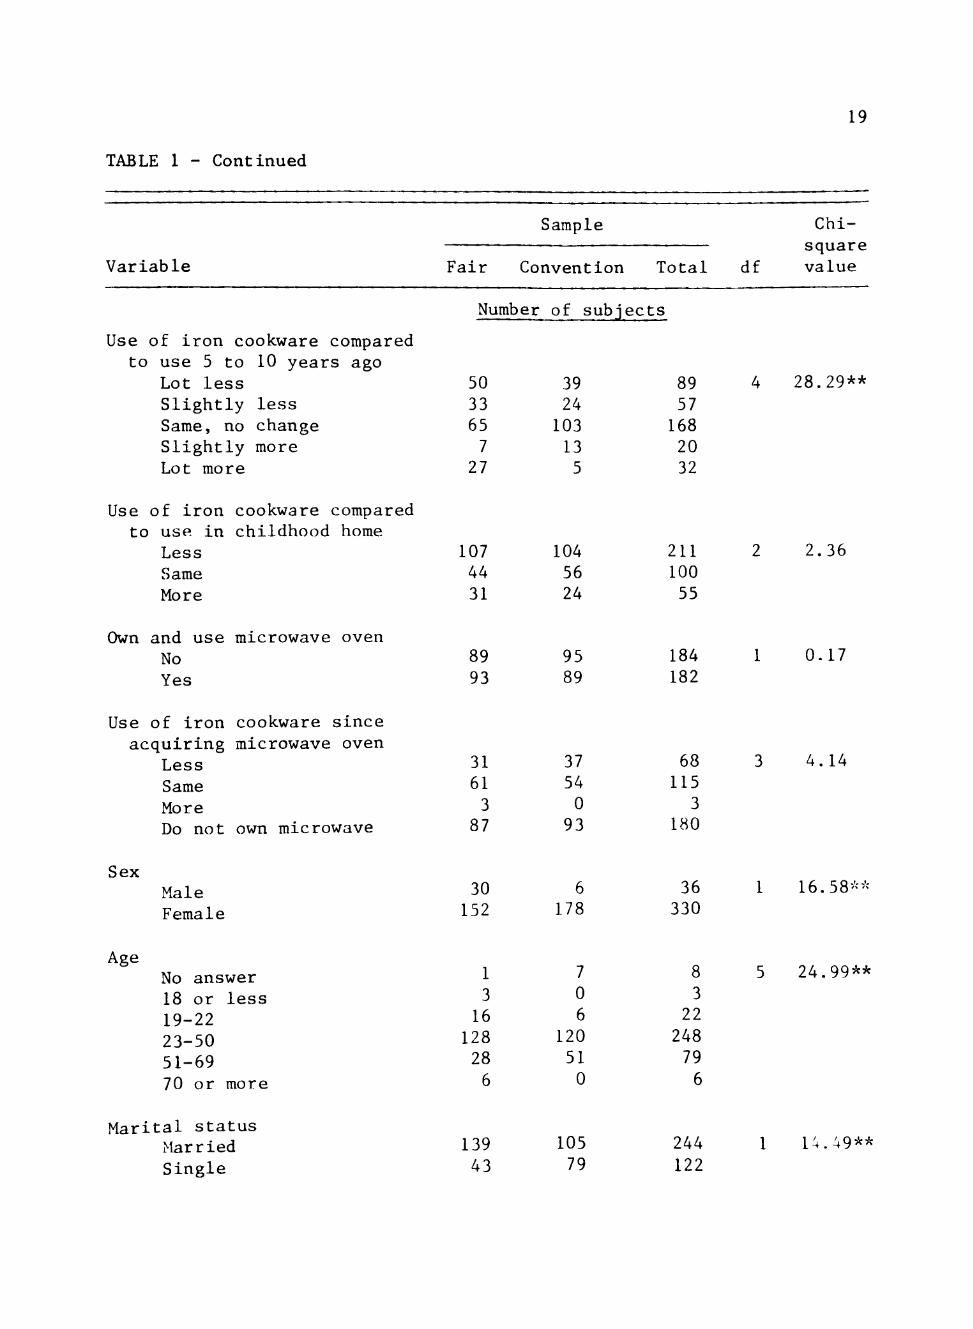
TABLE 1 - Continued
Variable
Use of iron cookware compared to use 5 to 10 years ago
Lot less Slightly less Same, no change Slightly more Lot more
Fair
Numt
50 33 65 7
27
Sample
Convention Total
>er of subjects
39 24 103 13 5
89 57 168 20 32
df
4
Chi-
aquarc value
28.29**
Use of iron cookware compared to use in childhood home
Less Same More
Own and use microwave oven No Yes
107 44 31
89 93
104 56 24
95 89
211 100 55
184 182
2
1
2.36
0.17
Use of iron cookware since acquiring microwave oven
Sex
Age
Less Same More Do not own microwave
Male Female
No answer 18 or less 19-22 23-50 51-69 70 or more
Marital status Married Single
31 61 3 87
30 152
1 3 16 128 28 6
139 43
37 54 0 93
6 178
7
0 6
120 51 0
105 79
68 115 3
180
36 330
8
3 22 248 79 6
244 122
3
1
5
1
4.14
16.58**
24.99**
14.49**

TABLE 1 - C o n t i n u e d
20
Variable
Ethnic group Caucasian Hispanic Black Other
Number in family that cook for
1 2 3 4 5 or more
Occupation Dietitian Housewife
you
Professor, teacher Student Other
Education Less than high school High school Some college Finished college Graduate study
Education of spouse Less than high school High school Some college Finished college Graduate study No spouse
Fair
Numh
151 24 6 1
28 49 42 35 28
0 45 14 10 113
26 55 58 28 15
26 41 37 24 11 43
Sample
Convention
>er of subj(
165 0 8 11
65 53 26 24 16
124 8 12 18 22
0 2 7 99 76
0 10 10 40 45 79
Total
2CtS
316 24 14 12
93 102 68 59 44
124 53 26 28 135
26 57 65 127 91
26 51 47 64 56 122
df
3
4
4
4
5
Chi-square value
33.23**
24.32**
213.61**
195.87**
95.61**
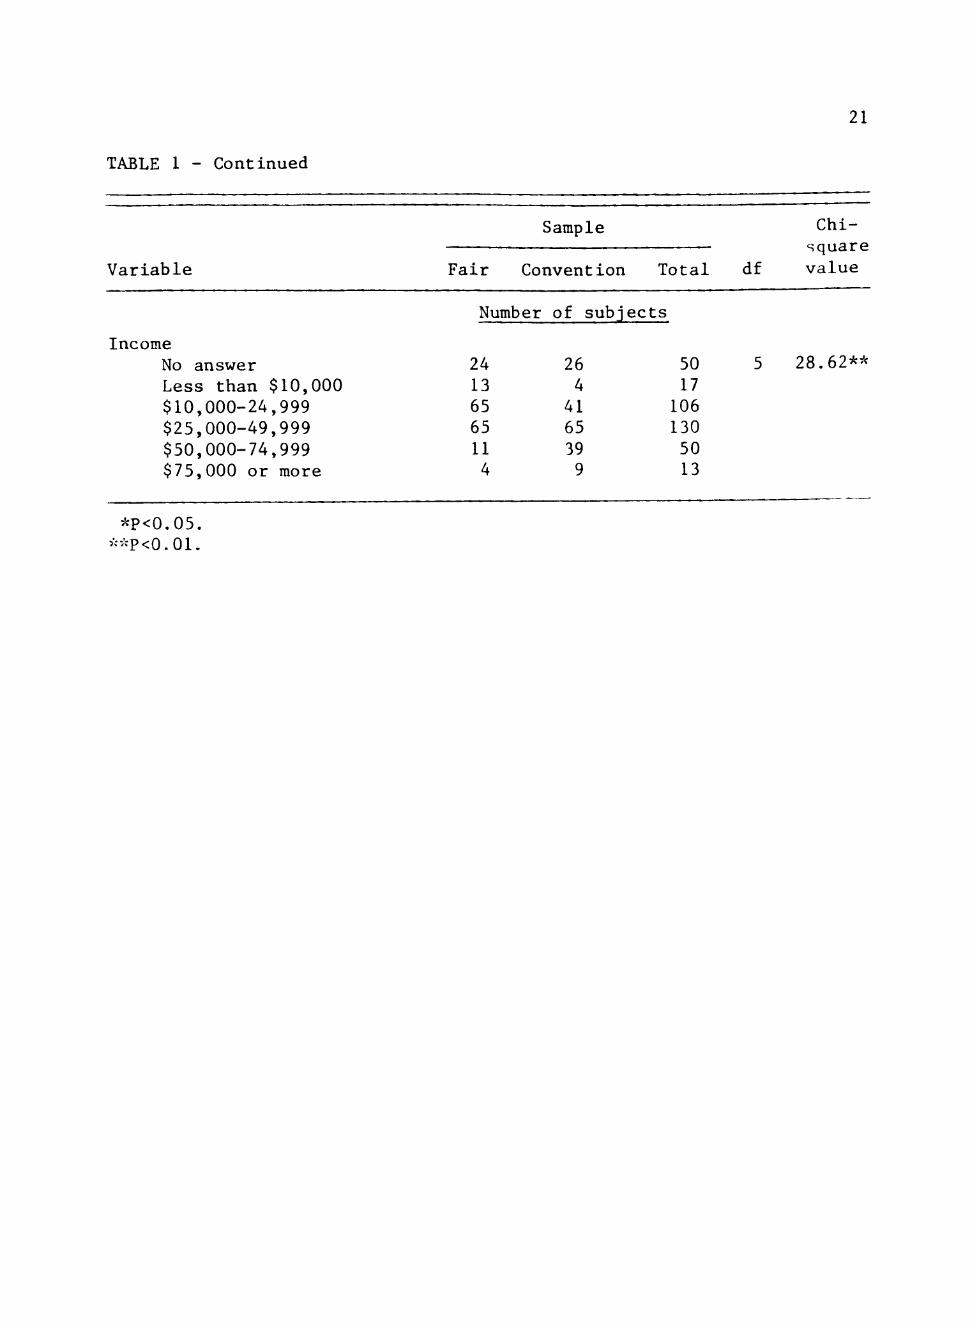
TABLE 1 - Continued
21
Variable
Income No answer Less than $10,000 $10,000-24,999 $25,000-49,999 $50,000-74,999 $75,000 or more
Fair
Numh
24 13 65 65 11 4
Sample
Convention
)er of subj(
26 4 41 65 39 9
Total
sets
50 17 106 130 50 13
df
5
Chi-square value
28.62**
*P<0.05. **P<0.01.

22
Although 24% of the subjects said they cook no foods in iron utensils,
76% of the subjects said they cook foods in iron utensils; 24% cook
one food in iron utensils, 19% cook two, 13% cook three, and 10% cook
all foods in iron utensils. The foods cooked in iron utensils named by
the subjects were: none (by 24% of the subjects), meat (by 35%), eggs
(19%), fried foods (17%), cornbread (10%), all (10%), bacon (7%); other
foods were named by 34%. Regarding change in use of iron cookware
during the past 5 to 10 years, more subjects (46%) indicated no change
than any other response, although 24% said they now use iron cook
ware a lot less and 9% said they use it a lot more. Regarding use
of iron cookware compared to use in childhood home, most of the
subjects (58%) said current use is less, although 27% said it LS the
same and 15% said it is more. One-half of the subjects own and use a
microwave oven. Because iron utensils cannot be used in microwave
cooking, it was hypothesized that the use of the microwave oven might
have resulted in decreased use of iron cookware; however, of the 50%
of the subjects who own a microwave oven, 62% said their use of iron
cookware is the same since the acquisition of a microwave oven and 37%
said their use of iron cookware is less.
The main results regarding socioeconomic variables are the follow
ing. Most of the subjects (90%) were females. Most of the subjects
(68%) were 23 to 50 years in age; 22% were 51 to 69 years in age. Two-
thirds of the subjects were married. Most of the subjects (86%) were
Caucasian. Most subjects said that the number of persons in the family
cooked for was one (25%) or two (28%), although 12% said they cooked for

23
5 or more persons. The occupation listed by most subjects was dieti
tian (34%), followed by housewife (15%), student (8%), and professor or
teacher (7%); other occupations were listed by 37%. About one-third
(35%) of the subjects stated that the highest education completed was
college, while 25% indicated graduate study. Although one-third of the
subjects had no spouse, the education of spouse of the remaining sub
jects was fairly similar to that of the subjects (26% completed college
and 23% had graduate study). More subjects had an annual family income
of $25,000-49,999 than any other category; 35% of the subjects for each
sample (Fair and Convention) and for the total were in this income
category.
Chi-square analysis was used to test the null hypothesis that there
were no significant differences in the responses to the questions by the
two samples. The comparison of the responses is shown in Table 1.
Chi-square analysis indicated that the following 17 variables were not
independent (P<0.01) of sample: utensil used most often, what the
utensil used most often is made of, frequency of use of iron skillet,
number of foods cooked in iron utensils, fried foods cooked in iron
utensils, meat cooked in iron utensils, all foods cooked in iron uten
sils, change in the use of iron cookware in the past 5 to 10 years, sex,
age, marital status, ethnic group, number in family that are cooked for,
occupation, education, education of spouse, and income. Also, the
following two variables were not independent (P<0.05) of sample: pre
pare most of own meals and eggs cooked in iron utensils.
The main differences in the variables which were significantly

24
different for the two samples are summarized as follows. More of the
Fair subjects prepared their own meals than the Convention subjects.
The skillet and saucepan were equally selected (44% each) as the utensil
used most often by the Convention sample, while the skillet was the
utensil used most often by the Fair sample (78%). The largest number
of Convention and Fair subjects stated that the most used utensil was
made of stainless steel with more Convention (45%) than Fair subjects
(26%) stating that the utensil used most often was made of stainless
steel. Thirty-three percent of the Fair sample used the iron skillet
daily while only 14% of the Convention sample used the iron skillet
daily. Seventeen percent of the Fair sample and only 2% of the Conven
tion sample cooked all foods in iron utensils. A smaller percentage
of the Convention subjects cooked fried foods and all foods in iron
utensils than the Fair subjects, while a larger percentage of Conven
tion than Fair subjects cooked eggs and meat in iron utensils.
The number of subjects in the Fair sample tended to collect more
at the extremes for the change in the use of iron utensils in the past
5 to 10 years, compared to the Convention subjects. Fifty-six percent
of the convention subjects indicated no chant e in the use of iron
utensils during the past 5 to 10 years, while only 36% of the Fair
subjects indicated no change.
More of the Fair subjects (17%) than of the Convention subjects
(3%) were male. Although most subjects in both samples were in the
23-50 age group (65% of the Convention sample and 70% of the Fair
sample), more of the Convention subjects were in the older age groups

25
and fewer were in the younger age groups than the Fair subjects. Fewer
Convention subjects were married than Fair subjects. The main differ
ences in ethnic group of the two samples were that more Hispanics were
surveyed at the Fair (24) than at the Convention (0), while more
subjects (11) at the Convention than at the Fair (1) were in other
groups not listed. More Convention subjects had families of one which
they cooked for, while more Fair subjects had larger families, of 3 or
more. Main differences in occupation of the two samples were that the
Convention sample contained mostly dietitians (67%), while the Fair
sample contained none, the Convention sample contained more students
(18) than the Fair sample (10) and the Fair sample contained more sub
jects with occupations of housewife or other occupations not listed
(62%). The Convention sample and their spouses had more education
than the Fair sample and their spouses. The Convention sample had
generally higher incomes than the Fair sample.
Chi-square analysis showed that the Fair versus the Convention
sample was independent of the variables: own iron cookware, use of
iron cookware, number of kinds of iron utensils owned, which iron
utensils were owned, the use of iron utensils other than the skillet,
foods cooked in iron (none, cornbread, bacon, and other foods), current
use of iron utensils compared to childhood home, own microwave oven,
and change in the use of iron utensils since the acquisition of the
microwave oven. Thus, most variables related to cooking (10 of 18)
did not differ significantly for the two samples while all (9) of the
socioeconomic variables differed significantly for the two samples.

26
Because chi-square analysis showed that the Fair versus the Convention
sample responses to most of the questions on current use of iron
utensils were independent, the null hypothesis was accepted for most
of the independent variables of the Fair versus the Convention sample.
Least squares means for the two samples and the continuous
socioeconomic variables of age, number in family, education, education
of spouse, and annual family income are shown in Table 2. Analysis of
variance showed that the means for each variable for the Fair versus
Convention sample differed significantly (P<0.01). The Fair sample was
younger (37.7 versus 42.1 years) and had more people in the family
(3.1 versus 2.4), less education (13.2 versus 16.9 years) and less
income ($27,158 versus $39,354) than the Convention sample. Also,
education of spouse was less for the Fair sample (13.1 versus 16.8).
The distribution and percent of the Convention subjects by state
are shown in Table 3. Because the American Dietetic Association Con
vention was a national meeting, a national sample was hoped to be
obtained. Thirty-one states, the District of Columbia, and the country
of Mexico were represented. The largest number of subjects was from
Texas, as was expected because the Convention was held in Texas.
The 366 questionnaires from the survey were analyzed by chi-
square analysis to test the null hypothesis that there is no signifi
cant difference in the responses to the questions between subjects
who use iron cookware and subjects who do not use iron cookware. The
comparison of the responses of the subjects who use iron utensils
and those who do not for discrete variables is shown in Table 4.

27
TABLE 2: Least Squares Means for Continuous Socioeconomic Data for Fair and Convention Samples
Sample Age
(years)
Number in
family Education (years)
Education of spouse (years)
Annual family income ($)
Fair 37.7'
Convention 42.1
3.1
2.4
13.2
16.9
13.1
16.8
27,158
39,354
a Means in each column differ significantly (P<0.01).

28
TABLE 3: Distribution and Percent of the Convention Sample by State'
Alabama
Alaska
Arizona
Arkansas
California
Colorado
Connecticut
Delaware
Florida
Georgia
Hawaii
Idaho
Illinois
Indiana
Iowa
Kansas
Kentucky
Louisiana
Maine
Maryland
Massachusetts
Michigan
Minnesota
Mississippi
Missouri
Numb er
3
0
0
0
12
1
2
0
3
2
0
0
10
4
1
8
2
0
3
6
3
7
3
0
3
1 1.6
6.5
0.5
1.1
1.6
1.1
5.4
2.2
0.5
4.3
1.1
1.6
3.3
1.6
3.8
1.6
1.6
Montana
Nebraska
Nevada
New Hampshire
New Jersey
New Mexico
New York
North Carolina
North Dakota
Ohio
Oklahoma
Oregon
Pennsylvania
Rhode Island
South Carolina
South Dakota
Tennessee
Texas
Utah
Vermont
Virginia
Washington
West Virginia
Wisconsin
Wyoming
Total
Number
0
3
0
0
7
0
5
0
0
3
3
3
0
1
3
2
8
64
0
0
4
1
0
1
0
184
%
1.6
3.8
2.7
1.6
1.6
1.6
0.5
1.6
1.1
4.3
35.0
2.2
0.5
0.5
99.6
^Plus District of Columbia, 2 (1.1%) and Mexico, 1 (0.5%).

29
TABLE 4: Test for Discrete
Variable
Sample Fair Convention
Prepare most of No Yes
Independence f Variables
own meals
Own iron cookware No Yes
Utensil used most often Skillet Saucepan Dutch oven Roaster Other
Utensil used most often is made of
Aluminum Stainless : Glass Corning Iron Enamel Other
Number of kinds iron utensils
0 1 2 3 4 5 6 or irore
steel
of owned
No
or
Use
Numb
49 54
19 84
76 27
59 33 3 3 5
25 45 0 5 0 2 26
77 18 4 2 1 1 0
the Use of
iron
Yes
er of
133 130
54 209
1 262
164 77 2 3 17
40 86 3 17 81 4 32
0 132 71 29 16 11 4
Iron Cookwa
cookware
sub j(
Total
acts
182 184
73 293
77 289
223 110 5 6 22
65 131 3 22 81 6 58
77 150 75 31 17 12 4
re and for
Chi-square
df value
1 0.16
1 0.09
1 235.68*'
4 4.75
6 47.20*^
6 250.51*
30
TABLE 4 - Continued
Variable
Iron utensils own None No Yes
Skillet No Yes
Griddle No Yes
Cornstick mo No Yes
Dutch oven No Yes
Muffin pan No Yes
Other No
Yes
Use iron skillet Never Seldom
ed
Id
2-3 times/month 2-3 times/we Daily
ek
No
26 77
80 23
101 2
97 6
99 4
100 3
99 4
87 15 0 1 0
Use iron
Yes
Number of
263 0
13 250
197 66
200 63
194 69
237 26
241 22
5 41 43 89 85
cookware
subj
Total
ects
289 77
93 273
298 68
297 69
293 73
337 29
340 26
92 56 43 90 85
Chi-cy r% w ^ ^^ ^
square df value
1 244.52**
1 202.73**
1 Ih.ll*-:-^
1 14.74**
1 21.78**
1 4.02*
1 1.62
4 283.42**
Use of other iron utensils other than skillet
Never Seldom Every week 2-3 times/week Daily
95 7 0 0 1
109 83 23 31 17
204 90 23 31 18
4 78.40**

TABLE 4 - Continued
31
Variable No
Use iron cookware
Yes Total df
Chi-square value
Number of subjects
Number of foods cooked in iron utensils
None 1 2 3 4 5 6 All except 1 All
83 15 4 1 0 0 0 0 0
6 74 66 48 21 7 3 3 35
89 89 70 49 21 7 3 3 35
8 253.16**
Foods cooked in iron utensils None No Yes
Fried foods No Yes
Cornbread No Yes
Eggs No Yes
Bacon No Yes
Meat No Yes
Other No Yes
All No Yes
21 82
96 7
100 3
100 3
101 2
96 7
100 3
103 0
257 6
208 5
229 34
198 65
241 22
142 121
143 120
225 38
278 88
304 62
329 37
298 68
342 24
238 128
243 123
328 38
1 238.14**
1 9.50**
1 7.10**
1 21.84**
1 3.99*
1 48.33**
1 58.62**
1 15.09**
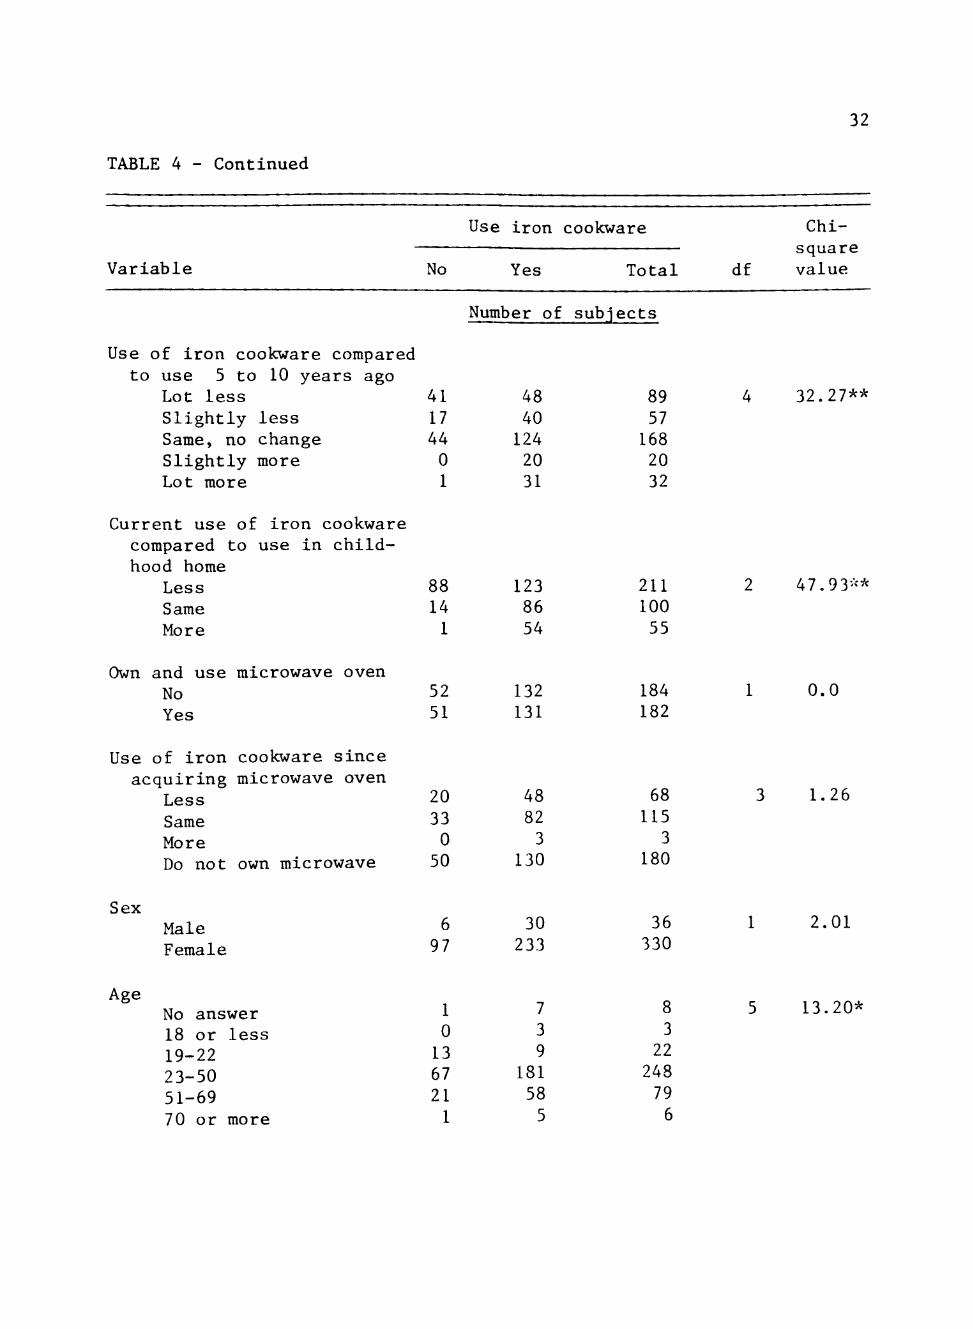
TABLE 4 - Continued
32
Use iron cookware
Variable No Yes Total
Use of iron cookware compared to use 5 to 10 years ago
Lot less Slightly less Same, no change Slightly more Lot more
Number of subjects
41 17 44 0 1
48 40 124 20 31
89 57 168 20 32
df
Chi-square value
32.27**
Current use of iron cookware compared to use in childhood home
Less Same More
Own and use microwave oven No Yes
88 14 1
52 51
123 86 54
132 131
211 100 55
184 182
2 47.93**
0.0
Use of iron cookware since acquiring microwave oven
Less Same More Do not own microwave
Sex
Age
Male Female
No answer 18 or less 19-22 23-50 51-69 70 or more
20 33 0 50
6 97
1 0 13 67 21 1
48 82 3
130
30 233
7 3 9
181 58 5
68 115 3
180
36 330
8 3 22 248 79 6
3 1.26
2.01
5 13.20*

TABLE 4 - Continued
33
Variable No
Use iron cookware
Yes Total df
Chi-square value
Number of subjects
Marital status Married Single
Ethnic group Caucasian Hispanic Black Other
Number in family you cook for
1 2 3 4 5 or more
Occupation Dietitian Housewife Professor, i Student Other
Education Less than h High school
that
teacher
igh school
Some college Finished co liege Graduate study
Education of spoi Less than h High school Some collegi Finished co. Graduate sti No spouse
use igh school
e liege Lidy
57 46
88 6 3 6
35 27 19 14 8
32 12 7 15 37
5 14 20 43 21
4 8 10 23 13 45
187 76
228 18 11 6
58 75 49 45 36
92 41 19 13 98
21 43 45 84 70
22 43 37 41 43 77
244 122
316 24 14 12
93 102 68 59 44
124 53 26 28 135
26 57 65 127 91
26 51 47 64 56 122
7.58**
3.28
7.01
10.14^
4.81
14.31*

TABLE 4 - Continued
34
Variable
Income No answer Less than $10,000 $10,000-24,999 $25,000-49,999 $50,000-74,999 $75,000 or more
No
16 10 21 35 15 6
Use iron
Yes
Number of
34 7
85 95 35 7
cookware
Total
subjects
50 17 106 130 50 13
df
5
Chi-
square value
14.19*
*P<0.05 . **P<0 .01 .
35
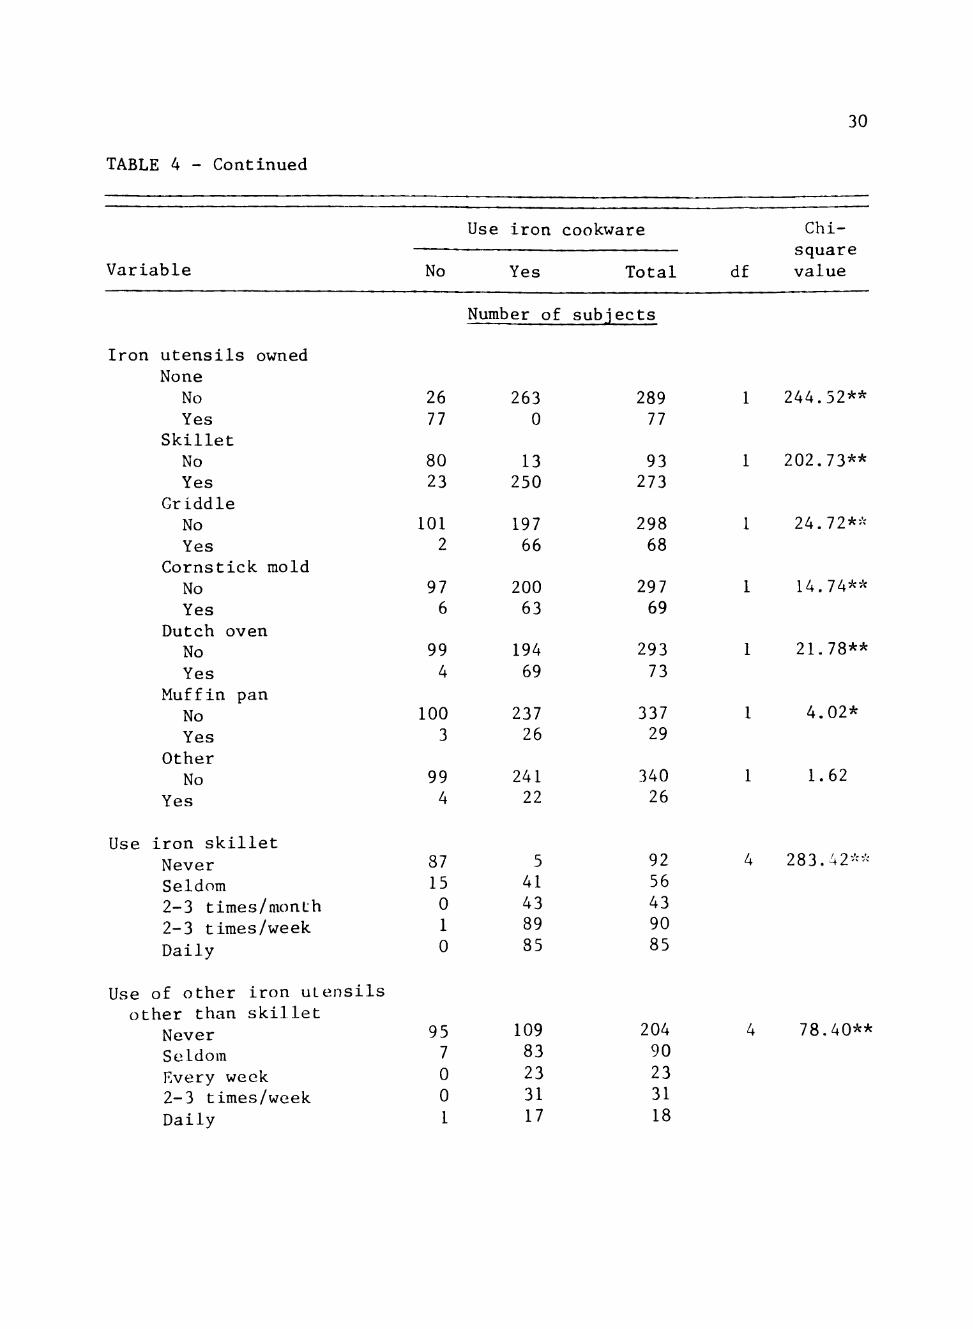
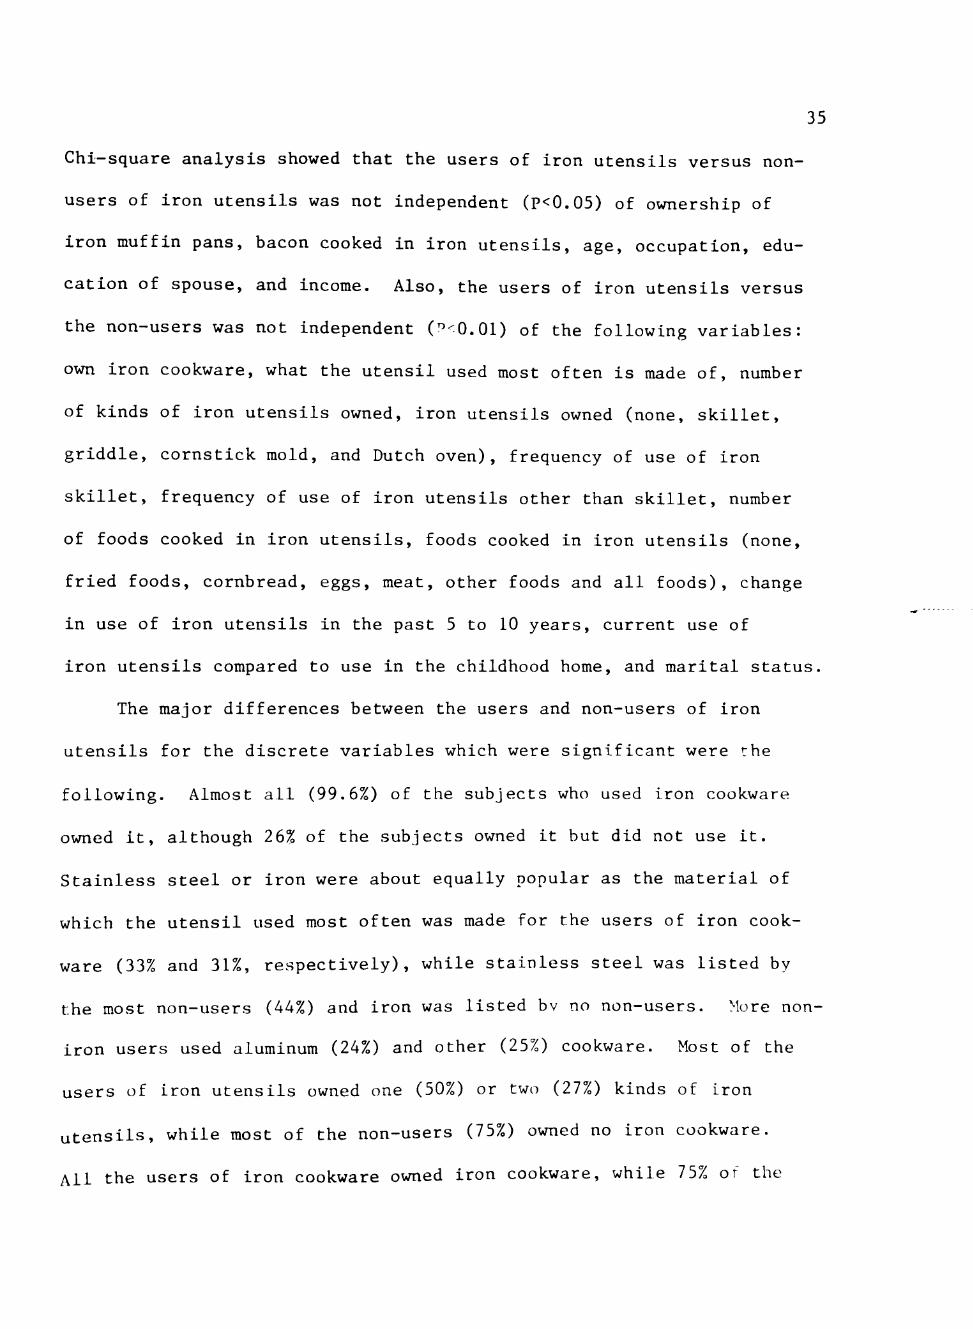
Chi-square analysis showed that the users of iron utensils versus non-
users of iron utensils was not independent (P<0.05) of ownership of
iron muffin pans, bacon cooked in iron utensils, age, occupation, edu
cation of spouse, and income. Also, the users of iron utensils versus
the non-users was not independent ( <0.01) of the following variables:
own iron cookware, what the utensil used most often is made of, number
of kinds of iron utensils owned, iron utensils owned (none, skillet,
griddle, cornstick mold, and Dutch oven), frequency of use of iron
skillet, frequency of use of iron utensils other than skillet, number
of foods cooked in iron utensils, foods cooked in iron utensils (none,
fried foods, cornbread, eggs, meat, other foods and all foods), change
in use of iron utensils in the past 5 to 10 years, current use of
iron utensils compared to use in the childhood home, and marital status.
The major differences between the users and non-users of iron
utensils for the discrete variables which were significant were the
following. Almost all (99.6%) of the subjects who used iron cookware
owned it, although 26% of the subjects owned it but did not use it.
Stainless steel or iron were about equally popular as the material of
which the utensil used most often was made for the users of iron cook
ware (33% and 31%, respectively), while stainless steel was listed by
the most non-users (44%) and iron was listed bv no non-users. More non-
iron users used aluminum (24%) and other (25%) cookware. Most of the
users of iron utensils owned one (50%) or two (27%) kinds of iron
utensils, while most of the non-users (75%) owned no iron cookware.
All the users of iron cookware owned iron cookware, while 75% of the

36
non-users owned no iron cookware. Most (95%) of the users of iron
cookware but only 22% of the non-users owned the iron skillet; 25%
of the users of iron cookware but only 2% of the non-users owned the
iron griddle; 24% of the users of iron cookware but only 6% of the
non-users owned the iron cornstick mold; 26% of the users but only
4% of the non-users owned the iron Dutch oven; and 10% of the users
but only 3% of the non-users owned the iron muffin pan. Most of the
non-users of iron cookware (85%) never used an iron skillet and the
other 15% seldom used it, while most of the iron cookware users used an
iron skillet several times a week (34%) or daily (32%). Most of the
non-users of iron cookware (92%) never used iron utensils other than the
skillet, while only 41% of the iron cookware users never used iron
utensils other than the skillet, 32% seldom used them, 9% used them
every week, 12% used them several times weekly, and 7% used them daily.
Most of the non-users of iron cookware (81%) cooked no foods in iron
utensils while most users of iron cookware cooked one (28%), two (25%),
three (18%), or all foods (13%) in iron utensils, l fhile 80% of the
non-users of iron cookware and 2% of the users cooked no food in iron
utensils, the following foods were listed as foods cooked in the iron
utensils by more users than non-users of iron cookware: fried foods,
cornbread, eggs, bacon, meat, other foods, and all foods. Although a
large percentage of both the users (47%) and non-users (43%) of iron
cookware indicated no change in the use of iron cookware in the past
5 to 10 years, more non-users (40%) said their use was a lot less, while
more users said their use was slightly more (8%) or a lot more (12%).

37
Current use of iron cookware compared to use in childhood home was less
for 85% of the non-users of iron cookware and for only 47% of the users,
while 33% of the users said their use was the same and 21% said it was
more. More non-users of iron cookware (13%) than users (3%) were in
the age category of 19 to 22 years. More of the users of iron cook
ware (71%) than the non-users (55%) were married. More of the non-
users of iron cookware (15%) than the users (5%) were students. Educa
tion of spouse was greater for a larger percentage of the non-users
than of the users of iron cookware. A greater percentage of non-users
of iron cookware than of users had incomes in the lowest category of
less than $10,000 and in the highest category of $75,000 or more,
although a greater percentage of users than non-users had an income
of $10,000-24,999.
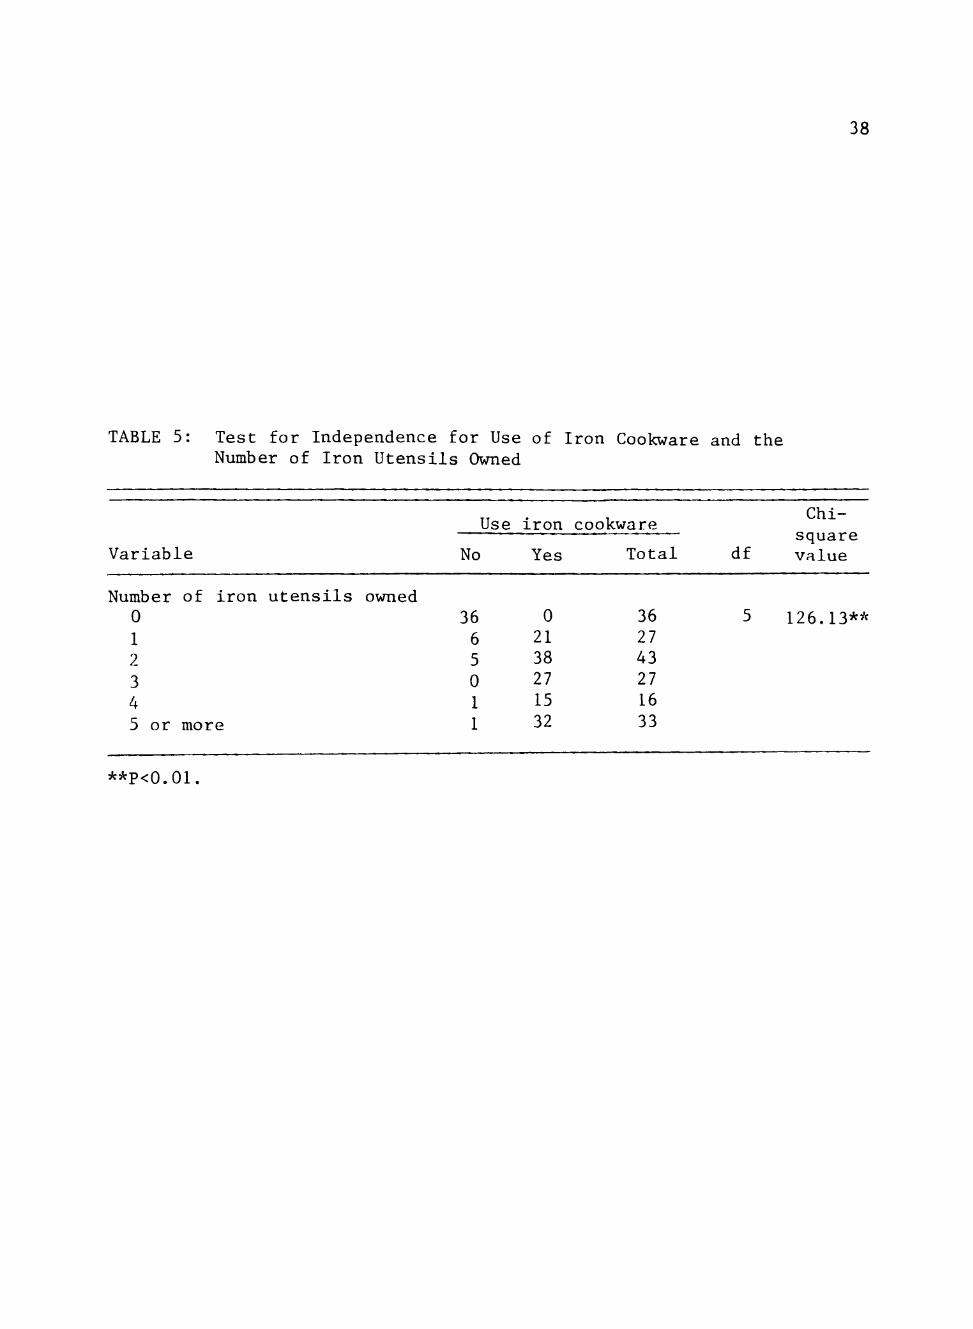
The number of iron utensils owned was obtained from the Fair
sample only. Chi-square analysis. Table 5, indicated that the users
of iron utensils versus the non-users of iron utensils was not indepen
dent (P<0.01) of number of utensils owned. Most of the non-users of
iron cookware (74%) owned no iron cookware, while the respondents who
used iron cookware owned two (29%), three (20%) or five or more (24%)
pieces of iron cookware. Analysis of variance showed a significant
difference (P<0.01) between the mean number of iron utensils owned by
the non-users (0.6) and users (3.7) of iron cookware.
Least squares means for the continuous socioeconomic variables and
the use of iron cookware are shown in Table 6. Age, education, educa
tion of spouse, and income did not differ (P<0.05). Only number in
38
TABLE 5: Test for Independence for Use of Iron Cookware and the Number of Iron Utensils Owned
Use iron cookware Chi-square
Variable No Yes Total df value
Number of iron utensils owned 0 36 0 36 5 126.13** 1 6 21 27 2 5 38 43 3 0 27 27 4 1 15 16 5 or more 1 32 33
**P<0.01.

d) u
o o
CJ
c o S-i
a; en
<L) X
CO •u CO
Q
o •H
e o c O
u
o • H a o
en en 3 O 3
•H i J 3 O
CJ
o
en 3 CO
S
en 0 1 v-i CO 3 cr
C/3
en CO OJ
NO
•H
a CO OJ
^ 6 CO 3 C 3 <
C <•> o ^^ c
• H
3 O
•H 4-1
en -N 3 en o ^
CO O . CO ej en QJ
>N 3
W
3 O / ^
•H en •u 5-1 03 CO a QJ 3 >v
t3 v^
>-i -H
X CO
3 Z C
• H
en eu VH 00 CO
< d) > v
I I
di u ci
J o o a d o u
•H
en
en
en
i n
i n
0!
* CN
r v
d) u CO
c o a
3 O }-i
X 3
o 3 O
Q
CO O
CN CO
i n
o
X 00
• CM
NO
o
OJ 5-1
CO
o o o
o
CO
39
I :
o V
3 CO a
•H tw •H 3 to
•H en
5-1 OJ
iw tw •H
en
O >-i en tu U tH OJ tM
3 TD en
• u •u o C 3 CU S-i o OJ T3
t M M-i en • H 4-1 " 3 a
a en
OJ 3
e 3
3 en
O -u CJ 3
O a X
4J 3 -H
en en 3 3 CO CO V V
CO

^0
family differed (P<0.01); non-users of iron cookware had a mean of 2.4
family members that they cook for, while users of iron cookware had
2.8 in the family.
The null hypothesis, there is no significant difference in the
responses to the questions between subjects who use iron utensils and
those who do not, was rejected for the variables that were not inde
pendent (P<0.05).
A comparison of the results of this research with the other pub
lished study on the use of iron cookware (White, 1968) shows many
similarities. The present study reports results from 366 question
naires; White reported results from 433 questionnaires. In the present
study, 80% of the subjects indicated that they prepared most of their
own meals, compared to 81% reported by White. In the present study, 75%
of the subjects owned iron skillets, 20% owned a Dutch oven, 19% owned
an iron griddle, 19% owned a cornstick mold, 8% owned an iron muffin pan
and 7% owned other iron utensils; White reported that 71% owned iron
skillets, 27% owned Dutch ovens, 18% owned iron griddles, 11% owned iron
muffin pans and 14% owned other iron cookware, the most frequently men
tioned was cornstick mold. In the present study, 15% of the subjects
owned only one piece of iron cookware (usually a skillet), 24% owned two
pieces, 15% owned three pieces, 9% owned four pieces, and 18% owned five
or more; White's results were 36%, 26%, 10%, 4" , and 1%, respectively.
White (1968) stated that 56% of all subjects who owned iron skil
lets used them frequently (2 or 3 times per week or every day); how
ever, since only 71% of the subjects were owners, this meant that

41
approximately 40% of all subjects might have an increase in dietary
iron through frequent use of iron skillets in food preparation. Re
sults are comparable in the present study: 48% of all subjects stated
that they used iron skillets 2 or 3 times per week or every day.
In the present study, current use of iron cookware compared with
use in childhood home is less for most of the subjects (58%), the same
for 27%, and more for 15%. Comparable figures reported by White (1968)
are 62%, 16%, and 6%, respectively (8% had no opinion and 8% did not
answer the question).
In the present study, foods cooked in iron utensils were: none
by 24% of the subjects, meat by 35%, eggs by 19%, fried foods by 17%,
cornbread by 10%, all by 10%, bacon by 7%, and other foods by 34%.
Comparable figures reported by White were: no answer by 35% of the
subjects, meat by about 33%, eggs by 25%, and other foods by 5 to 10%.
In the present study, the type of cookware used most frequently
was the skillet for 61% of the subjects and the saucepan for 30%.
More subjects indicated the most used utensil was made of stainless
steel (36%) than any other material; iron was the second most popular
material with 22% of subjects stating that the most used utensil was
made of iron. In the study by White (1968), aluminum, cast-iron and
nonstick skillets were indicated with almost equal frequency and
stainless steel skillets to a lesser degree as the utensil used most
often and material it is made of. Iron utensils other than skillets
were seldom or never used by 81% of the subjects in the present study;
White reported that iron cookware other than skillets was seldom used

42
by that sample. In both the present study and the study by White, 67%
of the subjects were married.
Iron in Food Study
The design of the iron in food study was factorial: 20 foods x
3 treatments (raw, cooked in the iron utensil, and cooked in the non-
iron utensil) x 2 replications x 2 samples. The effect of food, treat
ment, replication and sample on moisture and iron content is shown in
Table 7. Moisture and iron content were significantly (P<0.01) affected
by food and treatment. It was expected that food would have a signi
ficant effect on moisture and iron content because some foods contain
more moisture and iron than other foods. Moisture and iron content were
not affected (P<0.05) by replication or sample, due to careful prepara
tion and analysis procedures.
Means for moisture and iron content of food by treatment are
shown in Table 8. Moisture did not differ between food cooked in the
iron utensil and food cooked in the non-iron utensil (P<0.05). There
fore, the difference in iron content of food cooked by the two methods
is not related to difference in moisture content of food cooked by the
two methods. Moisture was significantly (P<0.01) higher for raw food
than for food cooked by either method because moisture in food evapo
rates during cooking. Iron content of food cooked in the iron utensil
was more than twice the amount of food cooked in the non-iron utensil
(mean 2.99 mg/100 g versus 1.18 mg/100 g) (P<0.01).
The means for moisture and iron content of the 20 foods bv treat
ment are shown in Table 9- Most foods (12 out of 20) did not differ

43
TABLE 7: Least Squares Analysis of Variance for the Effect of Food, Treatment, Replication and Sample on Moisture and Iron Content
Source of Variation df Moisture
323.58**
120.90**
1.13
0.00
F value
Iron
11.73**
146.84**
0.58
0.00
Food 19
Treatment 2
Replication 2
Sample 1
Remainder 335
Total 359
**p<o.oi; other values are not significantly different at 0.05 level.

44
TABLE 8: Mean Moisture and Iron Content of Food by Treatment
Moisture Iron Treatment (%) (mi,/100g)
Raw 70.29^ 0.99^
Cooked in iron utensil 62.50 2.99
Cooked in non-iron utensil 62.49 1.18
^' Means in a column with different superscripts differ (P<0.01); ones with same superscript do not differ (P<0.05).

45
TABLE 9: Means for Moisture and Iron Content of 20 Foods by Treatment
Food
Stew
Chili with meat
Spaghetti sauce with meat
Spaghetti sauce
Hamburger
Liver with onions
Scrambled eggs
Fried chicken
Cornbread
Pancakes
Rice
Spanish rice
Medium white sauce
Fried egg
Poached egg
Bacon
Fried Potatoes
Green beans
Tortillas
Applesauce
Raw
87.06
78.31
82.63
90.57
58.89
75.37
76.63
66.83
42.37
54.32
60.42
67.56
71.00
75.11
75.95
34.92
80.87
89.44
47.93
89.67
Moisture (%)
Cooked in iron utensil
82.80
71.55
78.94
88.37
56.75
63.16
69.48
52.18
29.57
46.89
59.62
68.62
70.21
71.25
77.46
20.98
58.45
83.77
14.35
85.70
Cooked in
non-iron utensil
81.31*
72.27
78.78
87.45**
59.22*
63.15
69.54
52.10
33.91**
46.40*
60.46
68.52
70.35
69.66**
77.60
18.78
59.07
83.30
13.09**
84.73**
Raw
0.66
0.98
0.71
0.61
1.49
3.10
1.49
0.88
0.67
0.63
0.67
0.87
0.22
1.92
1.87
0.77
0.42
0.64
0.86
0.35
Iron (mg/lOOg)
Cooked in iron utensil
3.40
6.27
3.58
5.77
2.29
3.87
4.76
1.89
0.86
1.31
1.97
2.25
3.30
3.48
2.32
1.92
0.80
1.18
1.23
7.38
Cooked in
non-iron utensil
0.81**
1.23**
0.94**
0.69**
2.00**
3.82
1.79**
1.37**
0.83
0.81**
0.86**
0.83**
0.18**
1.84**
1.71**
1.29**
0.59**
0.69**
1.14*
0.28**
*Means for cooked in iron and cooked in non-iron utensils differ (P<0.05).
**Means for cooked in iron and cooked in non-iron utensils differ (P<0.01).

46
significantly (P<0.05) in moisture content when cooked in the two kinds
of utensils. Most (18 out of 20) foods contained significantly (P<0.05)
more iron when cooked in the iron utensil than when cooked in the non-
iron utensil. The 18 foods which contained significantly (?<0.05) more
iron when cooked in iron than in non-iron utensils were: stew, chili
with meat, spaghetti sauce with meat, spaghetti sauce, hamburger,
scrambled eggs, fried chicken, pancakes, rice, Spanish rice, medium
white sauce, fried egg, poached egg, bacon, fried potatoes, green beans,
tortillas and applesauce. Ranked in descending order, according to the
percent increase in iron content due to cooking in the iron utensil, the
foods are: applesauce (2535%), medium white sauce (1733%), spaghetti
sauce (477%), chili with meat (390%), stew (320%), spaghetti sauce with
meat (281%), Spanish rice (171%), scrambled eggs (166%), rice (129%),
fried egg (89%), green beans (71%), pancakes (62%), bacon (49%), fried
chicken (38%), poached egg (36%), fried potatoes (36%), hamburger (15%),
and tortillas (8%).
Liver with onions and cornbread did not significantly (P<0.05)
increase in iron content when cooked in the iron utensil. Burroughs
and Chan (1972) reported a 17.6% increase in iron content of liver with
onions when cooked in an iron skillet. Liver with onions had a signi
ficantly (P<0.01) different iron content for replication. Variation
of iron content within the liver with onions sample for each of the
three replications probably was due to getting different amounts of
liver and of onion in each sample and may be an explanation of why the
liver with onions did not show a significant increase in iron when
47
cooked in iron utensils. Moisture content of cornbread differed signi
ficantly (P<0.01) for cornbread cooked in the iron utensil and in the
non-iron utensil; however, cornbread cooked in the non-iron utensil
had lower iron content and higher moisture content. A possible expla
nation of why the cornbread cooked in the iron utensil did not contain
more iron was that when the cornbread batter was poured into the hot
skillet, a tough, dry crust immediately formed which was relatively
impervious to taking up iron from the skillet. Most of the foods cooked
in the non-iron utensil contain higher iron concentration than raw food
due to moisture loss during cooking.
Iron content of most of the foods was slightly lower than the iron
content listed in the Handbook No. 8 (USDA, 1963). White (1969) also
reported lower analyzed iron values of foods than when calculated from
food composition tables. The values for chicken corresponded closely
with the values reported by Meiners et al. (1982). Overall, most iron
content values of foods were lower for the foods that were also analyzed
by previous researchers Moore (1965) and Burroughs and Chan (1972). The
iron content value of the Spanish rice was higher than the iron content
value for Spanish rice listed in Handbook No. 8 (USDA, 1963) or re
ported by Burroughs and Chan (1972). Iron content value for scrambled
eggs was also higher than the value listed in Handbook No. 8 (USDA,
1963) and the iron content value reported by Moore (1965). Nutrient
values in food composition tables are averages, indicating nutrients
contributed by a food on a year-round, country-wide basis. Therefore,
analyzed values of foods consumed at a specific time and location would

48
not necessarily be expected to agree with food tables (White, 1969).
Means for pH of the raw food, cooking time and moisture content
are shown in Table 10. Several researchers have suggested that foods
which contain more moisture, are more acidic (Mackay et al., 1945;
Moore, 1965; Monsen et al., 1967; Burroughs and Chan, 1972) and are
cooked longer times (Moore, 1965; Burroughs and Chan, 1972), take
up more iron when cooked in iron utensils. In the present study, the
food which increased in iron content most when cooked in iron utensil
was applesauce. Applesauce was the food with the lowest pH and next
to the highest moisture content; however, its cooking time was inter
mediate (20 minutes). Medium white sauce was the food which increased
next most in iron content when cooked in iron utensil; medium white
sauce did not have a low pH, high moisture content or long cooking
time. Stew had the longest cooking time and relatively low pH and
high moisture content; it increased 320% in iron content during cook
ing in iron utensil.
To determine whether iron content of food was associated with
pH of raw food, cooking time, or moisture content of food correlation
coefficients were determined for iron content, pH of the raw food,
cooking time, and moisture of foods cooked in iron and in non-iron
utensils. The correlation coefficient of iron content with pH of the
raw food was low (-0.22), although highly significant (P<0.01). The
correlation coefficient of iron content with cooking time was low
(0.14), although significant (P<0.05). The correlation coefficient of
iron content with moisture content was low (0.29), although highly

TABLE 10: Means for pH, Cooking Time and Moisture Content of 20 Foods
Food
Stew
Chili with meat
Spaghetti sauce with meat
Spaghetti sauce
Hamburger
Liver with onions
Scrambled eggs
Fried chicken
Cornbread
Pancakes
Rice
Spanish rice
Medium white sauce
Fried egg
Poached egg
Bacon
Fried potatoes
Green beans
Tortillas
Applesauce
pH
5.44
5.27
5.03
4.50
5.77
6.10
7.20
6.15
6.81
6.71
6.22
4.61
6.48
7.33
7.58
6.37
5.94
6.09
9.34
3.90
Cooking time (min)
77.0
36.0
34.0
23.0
9.0
11.0
4.0
17.5
15.0
3.3
20.0
27.0
12.0
6.0
5.0
5.0
3.0
5.0
1.0
20.0
Moisture (%)
83.72
74.04
80.11
88.80
58.27
67.25
71.88
57.04
35.29
49-21
60.16
68.23
70.52
72.00
77.00
24.89
66.13
85.51
25.12
86.70

50
significant (P<0.01). Therefore, higher iron content was significantly
associated with lower pH (more acidic), longer cooking time, and more
moisture, indicating that more acidic, more moist, and longer cooked
foods may take up more iron during cooking in iron utensils.
In another correlation analysis, correlation coefficients were
determined for the increase in iron content with pH of the raw food,
cooking time, and moisture content of the raw food. Increase in iron
content was the difference between iron content of food cooked in iron
utensil and in non-iron utensil. The correlation coefficients were
-0.58, 0.39, and 0.55, respectively, and were highly significant
2 (P<0.01). The amount of variation (r ) in increase in iron content of
food cooked in iron utensil over that of food cooked in the non-iron
utensil accounted for by each factor was 0.34, 0.15, and 0.30,
respectively, making a total of 0.79, or 79%, of the variation accounted
for by all three factors. Thus, this analysis showed that the increase
in iron content by cooking in the iron utensil was signficiantly
associated with acidity and moisture content of raw food and with
cooking time, indicating that more acidic, moister, and longer cooked
foods take up more iron during cooking in iron utensils.
The effect of food, treatment, replication and sample on the
moisture and iron content of three foods cooked in two different iron
skillets is shown in Table 11. Food and treatment (cooked in iron
skillet A or cooked in iron skillet B) affected (P<0.01) iron content
while only food affected (P<0.01) moisture content. Replication
affected (P<0.01) moisture, indicating variability among replications.

51
TABLE 11: Least Squares Analysis of Variance for the Effect of Food, Treatment, Replication and Sample on the Moisture and Iron Content of Three Foods Cooked in Two Iron Utensils
Source of variation df
F values
Moisture Iron content
Food
Treatment
Replication
Sample
2
1
2
1
683.57**
1.20
6.01**
0.04
23.42**
13.13**
1.86
0.00
**P<0.C1; other values non-significant at 0.05 level.

52
Replication did not significantly affect iron content. Sample did not
affect moisture or iron content, indicating careful control in analysis
procedures.
Table 12 shows the means for moisture and iron content of the
three foods by treatment. Moisture content was not different
(P<0.05) between food cooked in iron utensil A and food cooked in iron
utensil B. Iron content of food cooked in iron utensil B was approx
imately 154% of iron content of food cooked in iron utensil A (mean
9.20 versus 5.97 mg/100 g), a difference which was highly significant
(P<0.01). Iron utensil B was like iron utensil A except iron utensil
A had been used more. Both had been obtained new for this research.
Skillet A had been used daily for a week before this research began,
while skillet B had been used only two or three times prior to the
study. Also, during the study, skillet A was used for all 20 foods and
skillet B was used for only three foods. The three foods were cooked
in this order in the total 20 foods: 4, 7, and 20; for spaghetti
sauce, scrambled eggs and applesauce, respectively.
The mean iron content of the three foods cooked in two iron
utensils is shown in Table 13. Of the three foods cooked in two
different iron skillets, only one had a signficantly different iron
content. Applesauce contained significantly (P<0.01) more iron (more
than twice as much) when cooked in iron skillet B than iron skillet
A. Thus, some variation in iron content of food occurred due to
using different iron skillets. Iron content of spaghetti sauce cooked
in iron utensil A did not differ significantly from iron content of

53
TABLE 12: Mean Moisture and Iron Content of Three Foods by Treatment
Moisture Iron
Treatment (%) (mg/lOOg)
Cooked in iron utensil A 81.18 5.97**
Cooked in iron utensil B 80.69 9.20
**Means in column differ (P<0.01); means in other column do not differ (P<0.05).

54
TABLE 13: Mean Iron Content of Three Foods Cooked in Two Iron Utensils
Iron (mg/lOOa)
Cooked in Cooked in Food iron utensil A iron utensil B
Spaghetti sauce 5.77 5.84
Scrambled eggs 4.76 5.38
Applesauce 7.38 16.36**
**P<0.01; other differences are non-significant at 0.05 level,

55
spaghetti sauce cooked in iron utensil B; the same was true for
scrambled eggs.

CHAPTER IV
SUMMARY AND CONCLUSIONS
A survey on the current use and change in use of iron cooking
utensils was obtained from 366 respondents at a fair and a national
convention. Seventy-nine percent of the subjects owned iron utensils.
Seventy-two percent of the subjects used iron cookware. The kind of
iron utensil owned by the most people (75%) was the skillet. Almost
one-half (48%) of the subjects said they used the iron skillet daily
or several times per week. Foods cooked in iron utensils included
meat, eggs, fried foods, cornbread and bacon.
Regarding change in use of iron cookware during the past five
to ten years, more subjects (46%) indicated no change than any other
response, although 24% said they presently used iron cookware a lot
less and 9% said they used iron cookware at lot more. Of the 50%
of the subjects who own a microwave oven, 62% said their use of iron
cookware is the same since acquiring the microwave oven and 37% said
their use of iron cookware is less. Fifty-five percent of the respon
dents reported that their use of iron utensils is less than in their
childhood home.
In the analysis of the Fair sample versus the Convention sample,
most variables related to cooking did not differ significantly for
the two samples. However, all of the socioeconomic variables differed
significantly for the two samples. The results of the present survey
on the use of iron cookware are very similar to those reported by
56

57
White over fifteen years ago.
Twenty foods were cooked in iron and non-iron utensils to deter
mine iron content of food due to cooking in iron utensils. Eighteen
out of the 20 foods contained significantly (P<0.01) more iron when
cooked in the iron utensil than when cooked in the non-iron utensil.
Food cooked in the iron utensil contained an average of two and one-
half times as much iron as food cooked in the non-iron utensil. The
greatest increase in iron was in applesauce. Moisture content and pH
of raw food and cooking time were significantly (P<0.01) correlated to
increased iron content of food cooked in the iron utensil, iudicatina
that foods with more moisture, more acidity and longer cooking time
take up more iron from iron cookware.
There was some variation in iron content of the three foods
cooked in the two different iron skillets. Of the three foods cooked
in two different iron skillets, only one had a significantly different
iron content.
In conclusion, iron utensils can be used to significantly increase
the amount of dietary iron. Nutrition education regarding the increase
in dietary iron possible from cooking in iron utensils is needed,
especially for persons at risk of iron deficiency. Also, care should
be taken when calculating iron content of diets to include iron from
cooking utensils when food is cooked in iron cookware. The added iron
in food from cooking in iron utensils is of greater significance now
because recent research has shown that enhancing factors of ascorbic
acid and meat, fish and poultry increase absorption of non-heme iron.

58
More research is needed on the bioavailability of the added iron and
the effect of the added iron on nutritional status.

REFERENCES
AOAC, 1980. "Official Methods of Analysis." 13th ed. Association of Official Analytical Chemists, Washington, D.C.
Beutler, E. 1980. Iron. In Goodhart, R. S. and Shils, M. E. , eds. "Modern Nutrition in Health and Disease." 6th ed. Lea and Febiger, Philadelphia.
Bothwell, T. H., Seftel, H. , Jacobs, P., Torrance, J. D., and Baumslag, N. 1964. Iron overload in Bantu subjects: studies in the availability of iron in Bantu beer. Am. J. Clin. Nutr. 14:47.
Brittin, H. C. and Zinn, D. W. 1977. Meat-buying practices of Caucasians, Mexican-Americans and Negroes. J. Amer. Dietet. Assoc. 71:623.
Burroughs, A. L. and Chan, J. 1972. Iron content of some Mexican-American foods. J. Amer. Dietet. Assoc. 60:123.
Drover, D. P. and Maddocks, I. 1975. Iron content of native foods. Papua New Guinea Medical Journal. 18:15.
Food and Nutrition Board, 1980. Recommended Dietary Allowance. 9th rev. ed. Washington, D.C: Nat'l Acad. Sci.
Harvey, W. R. 1960. Least squares analysis of data with unequal subclass number. USDA ARS Bull. 20-8, Government Printing Office, Washington, D.C.
Lai, H., Agarwal, K. M. , Gupta, M. and Agarwal, D. K. 1973. Protein and iron supplementations by altering cooking practices in a community. Indian Journal of Medical Research. 61:918.
Mackay, H. M. , Dobbs, R. H. and Bingham, K. 1945. The effect of national bread, of iron medicated bread, and of iron cooking utensils on the hemoglobin level of children in wartime day nurseries. Arch. Dis. Childh. 20:56.
Meiners, C , Crews, M. G. and Ritchy, S. J. 1982. Yield of chicken parts: proximate composition of mineral content. J. Amer. Dietet Assoc. 77:258.
Mertz, W. 1980. Mineral elements: new perspectives. J. Amer. Dietet. Assoc. 77:258.
59

60
Monsen, E. R., Kuhn, I. N. and Finch, C. A. 1967. Iron status of menstruating women. Amer. J. Clin. Nutr. 20:342.
Monsen, E. R., Hallberg, L., Layrisse, M., Hegsted, D. M., Cook, J. D., Mertz, W., and Finch, C. A. 1978. Estimation of Available Dietary Iron. Amer. J. Clin. Nutr. 31:134.
Monsen, E. R and Balintfy, J. L. 1982. Calculating dietary iron bioavailability: refinement and computerization. J. Amer. Dietet. Assoc. 80:307.
Moore C. V. 1965. Iron nutrition and requirements. Series Haema-tology. 6:1.
Nie, N. H., Hull, C. H. , Jenkins, J. G., Steinbrenner, K. and Bent, D. H. 1975. Statistical Package for the Social Sciences. McGraw-Hill Book Company, New York.
Perkin-Elmer. 1980. "Analytical Methods for 5000 Atomic Absorption Spectrophotometry." Perkin-Elmer Co., Norwalk, Connecticut.
Pomeranz, Y. and Meloan, C. E. 1978. "Food Analysis: Theory and Practice." AVI Publishing Company, Inc., Westport, Connecticut. '
Robinson, C. H. and Lawler, M. R. 1982. Mineral Elements. "In Normal and Therapeutic Nutrition." 16th ed. MacMillan Publishing Co., Inc., New York.
Seller, H., Schlettwein-Gsell, D., Brubacher, G., and Ritzel, G. 1977. The mineral content of meat depending on the method of preparation. Mitteilungen aus dem Gebiete der Lebensmitteluntersuchung und Hygiene. 68:523.
United States Department of Agriculture. 1963. Handbook No. 8. Composition of Foods. Washington, D.C.
United States Department of Agriculture. 1976-1982. Handbook No. 8-1 - 8-9. Composition of Foods. Washington, D.C.
White, H. S. 1968. Current use and changes in use of cast-iron cookware. Journal of Home Economics. 60:724.
White, H. S. 1969. Inorganic elements in weighed diets of girls and young women. J. Amer. Dietet. Assoc. 55:38.

APPENDIX
A. QUESTIONNAIRE ON USE OF IRON COOKWARE, FAIR
B. QUESTIONNAIRE ON USE OF IRON COOKWARE, CONVENTION
C. RECIPES
D. FOOD COOKING RECORD
61
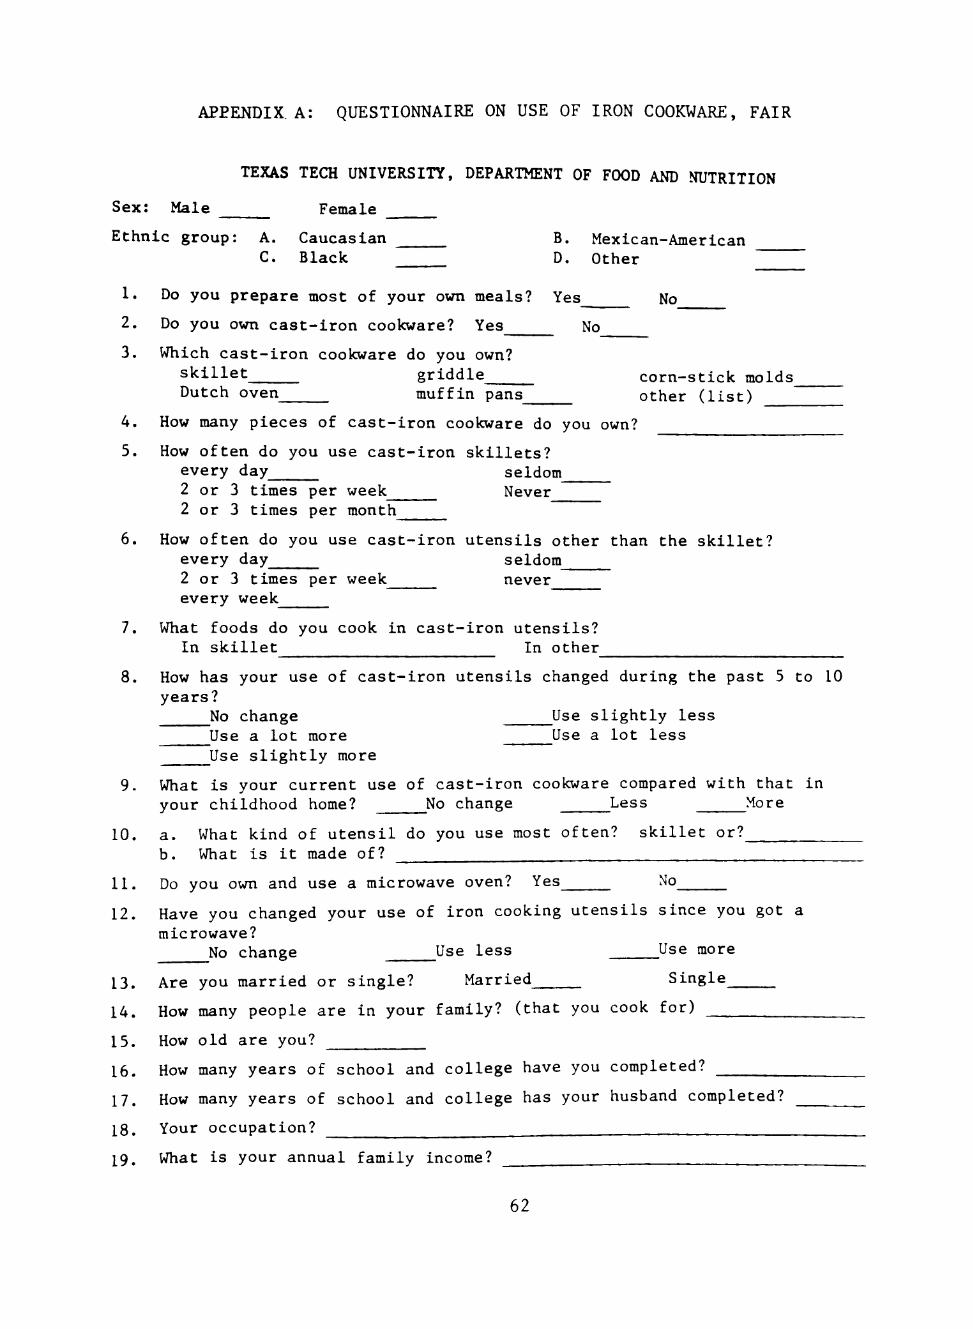
APPENDIX. A: QUESTIONNAIRE ON USE OF IRON COOKWARE, FAIR
TEXAS TECH UNIVERSITY, DEPARTMENT OF FOOD AND NUTRITION
Sex: Male Female
Ethnic group: A. Caucasian B. Mexican-American C. Black D. other
1. Do you prepare most of your own meals? Yes No
2. Do you own cast-iron cookware? Yes No
3. Which cast-iron cookware do you own? skillet griddle corn-stick molds
Dutch oven muffin pans other (list)
4. How many pieces of cast-iron cookware do you own?
5. How often do you use cast-iron skillets? every day seldom 2 or 3 times per week Never 2 or 3 times per month
6. How often do you use cast-iron utensils other than the skillet? every day seldom 2 or 3 times per week never every week
7. What foods do you cook in cast-iron utensils? In skillet In other
8. How has your use of cast-iron utensils changed during the past 5 to 10 years?
No change Use slightly less Use a lot more Use a lot less Use slightly more
9. What is your current use of cast-iron cookware compared with that in your childhood home? No change Less More
10. a. What kind of utensil do you use most often? skillet or? b. What is it made of?
11. Do you own and use a microwave oven? Yes No
12. Have you changed your use of iron cooking utensils since you got a microwave?
No change Use less Use more
13. Are you married or single? Married Single
14. How many people are in your family? (that you cook for)
15. How old are you?
16. How many years of school and college have you completed?
17. How many years of school and college has your husband completed?
18. Your occupation?
19. What is your annual family income?
62

APPENDIX B: QUESTIONNAIRE ON USE OF IRON COOKWARE, CONVENTION
TEXAS TECH UNIVERSITY, DEPARTMENT OF FOOD AND NUTRITION
Please check the appropriate answer or fill in the blank.
1. What proportion of your meals do you prepare? ^None Less than half Half More than half
2. A. Which utensil do you use most often? Skillet Saucepan Dutchoven Roaster
Other (list) B. IThat i s i t made of? ^Aluminum S t a i n l e s s s t e l l Glass
^Cast-iron Corningware Enamel Other ( i d e n t i f y )
3 . Do you use c a s t - i r o n cookware? Yes No
4 . Which c a s t - i r o n cookware do you own? S k i l l e t Gr iddle Dutchoven Corns t i ck molds ^Muffin pans
Other ( l i s t )
5. How often do you use cast-iron skillets? Every day 2 or 3 times per week 2 or 3 times per month Seldom Never
How often do you use cast-iron utensils other than skillets? Every day 2 or 3 times per week 2 or 3 times per month Seldom Never
7. Which foods do you cook in cast-iron utensils?
8. How has your use of cast-iron utensils changed during the past 5 to 10 years? Same Lot more Slightly more Slightly less Lot less
9. What is your current use of cast-iron cookware compared with that in your childhood home? Same Less More
10. Do you own and use a microwave oven? Yes No
11. How has your use of iron cooking utensils changed since you got a microwave? Same Use less Use more
1. Sex: Male Female 2. Age: 3. Marital Status: Married _Single
4. Ethnic group: Caucasian Mexican-American Black Other (Identify) _ ^ _ ^ ^
5. Number of people in your family that you cook for:
6. Occupation: 7. State of residence:
8. Highest education completed: High school Years of college 1 2 3 4 Masters degree Doctoral d gre e ~
9. Education completed by spouse:
10. Annual family income before taxes: $_
Comments about iron cookware: ___^_
63

APPENDIX C: RECIPES
1. Scrambled Eggs
( 4 X 1 serving)
209.4 g 4 large eggs ^-0 g 1/2 teaspoon salt
58.6 g 1/4 cup milk 12.5 g 1 tablespoon oil
Weigh and record weight of all ingredients. Mix eggs, milk, and salt with a fork. Divide into fourths, weighing and recording each portion and placing one fourth in one of four custard cups labeled raw, iron. Corning, and iron B.
Record time. Pour one fourth into hot greased (1 teaspoon 4. 1 g oil) iron skillet, one fourth into hot greased (1 teaspoon 4.1 g oil) Corning dish, and one fourth into hot greased (1 teaspoon 4.1 g oil) iron skillet B.
Cook over low heat, stirring occasionally with egg turner while cooking. Record time and total cooking time. Weigh and record weight of each cooked fourth. Blend each of the four fourths. Take pH and record. Place each fourth in a plastic bag, label, and freeze.
2. Pan-broiled Hamburger Patties
( 3 X 1 serving)
340.5 g 3/4 pound ground beef 5.1 g 3/4 teaspoon salt
Weigh and record weight of each ingredient. Mix beef and salt. Shape into three patties about 1/2 inch thick and of equal weight, weighing and recording weight of each. Record time. Cook one in iron skillet and one in Corning dish on medium-high then medium heat about 5 minutes on one side, pour off drippings (and save), turn and cook on other side about 4 minutes until medium done (brown on outside and pink in inside) Save drippings and label each for later use with gravy. Weigh and record weight of each of the two cooked patties. Blend each of the three patties; take pH of each and record; place each in a plastic bag, label, and freeze.
64

O o r. 65
3. Spaghetti Sauce
( 4 x 4 servings)
174.0 g 4 1.5 oz, 42 g packages Schilling spaghetti sauce mix 893.6 g 4 8 oz cans tomato sauce 1422.0 ml 4 i^ cans deionized water
Weight each ingredient and record weight. Divide each ingredient into fourths, weighing and recording weight of each fourth.
Put one fourth into iron skillet; put one fourth into Corning dish; and put one fourth into iron skillet B. Record time. Heat each fourth over medium high heat and simmer on low heat for 20 minutes. Record end of cooking time and total cooking time.
Weigh and record weight of each of the three cooked fourths. Blend each of the four fourths. Take pH of each fourth and record. Place each fourth in a plastic bag, label, and freeze.
4. Spaghetti Sauce with Meat
130.5 g 3 1.5 oz, 42 g packages 1066.5 ml 3 1^ cans deioniz-Schilling spaghetti sauce mix ed ••/ater
670.3 g 3 8 oz cans tomato sauce 681.0 g 1^ lb ground beef
Weigh each ingredient and record weight. Divide each ingredient into thirds, weighing and recording weight of each third of each ingredient and placing one third of each ingredient on one of three waxed paper-lined trays labeled raw, iron and Corning.
Combine the one third of each ingredient on raw tray, weigh and save for raw sample.
Record time. Brown the one third of the ground beef on the iron tray in iron skillet and the one third of the ground beef on the Corning tray in Corning dish on medium heat. Stir one third of the spaghetti sauce mix, tomato sauce and one third of the water on the iron tray into the browned beef in the iron skillet; stir the one third of the spaghetti sauce mix, tomato sauce and one third of the water on the Corning tray into the browned beef in the Corning dish. Heat each of the two thirds over medium high meat and simmer 20 minutes. Record time and total cooking time. Weigh and record weight of each cooked third.
Blend each of the three thirds; take pH of each and record; and place each third in a plastic bag, label and freeze.

66 5. Chili (Beans and Meat)
( 3 X 4 servings)
454.0 g 1 pound dried pinto beans 346.8 g 3 medium onions 908.0 ml 4 cups deionized water 19.2 g 1 tablespoon salt 1362.0 g 3 pounds ground beef 7.8 g 1 tablespoon chili
5.7 g 3 cloves garlic powder 1362.0 g 3 1 lb cans tomatoes
Pick out dirt balls and defective beans and discard. Weigh and record weight of beans and ml of deionized water. Wash beans with cold water. Divide beans into thirds, weighing and recording weight of each. Place one third in plastic bag, one third in iron skillet, and one third in Corning dish. Divide water into thirds, measuring and recording ml. of each. Add equal amounts of water to each third of beans. Bring water in iron skillet and in Corning dish to boiling, turn off heat, cover, and let beans soak overnight. Next day: divide each third of beans and soaking water (weigh and record) into three thirds, one for each replication and put on the rep trays. Record time. In the utensils they were soaked in, bring the beans with soaking water to boiling over high heat, add 100 ml deionized water to each skillet (to cover beans), reduce heat to low, cover and simmer 20 minutes until beans are tender. Peel and mince garlic. Peel and chop onion. Weigh and record weight of beef, garlic, onion, salt, chili powder, and tomatoes. Divide each ingredient into thirds, weighing and recording each third of each ingredient, and placing one third of each ingredient on a tray labeled raw, iron, or Corning. Add one third of the ingredients (those on the raw tray) to the raw beans and water in the plastic bag. Weigh and record weight. When the beans have simmered in the iron skillet and Corning dish until they are tender, pour them up and set them aside. Brown one third of the beef in the iron skillet; brown one third of the beef in the Corning dish over medium heat. Put one third of garlic and onion in iron skillet; put one third of garlic and iron in Corning dish. Cook the mixture in iron skillet and cook mixture in Corning dish over medium high heat until garlic and onion are transparent. Add one third of the salt, chili powder, and tomatoes to the mixture in the iron skillet; add one third of the salt, chili powder and tomatoes to the mixture in the Corning dish. Stir the one third of the beans with liquid which were cooked in the iron skillet into the mixture in the iron skillet; stir the one third of the beans with liquid which were cooked in the Corning dish into the mixture in the Corning dish. Bring mixture in iron skillet and mixture in Corning dish to boiling over high heat, cover and simmer 15 minutes. Record time and total cooking time.
Weigh and record the weight of the mixture cooked in the iron skillet; weigh and record the weight of the mixture cooked in the Corning dish. Blend each of the three thirds; take pH of each and record; place each third in a plastic bag, label and freeze.
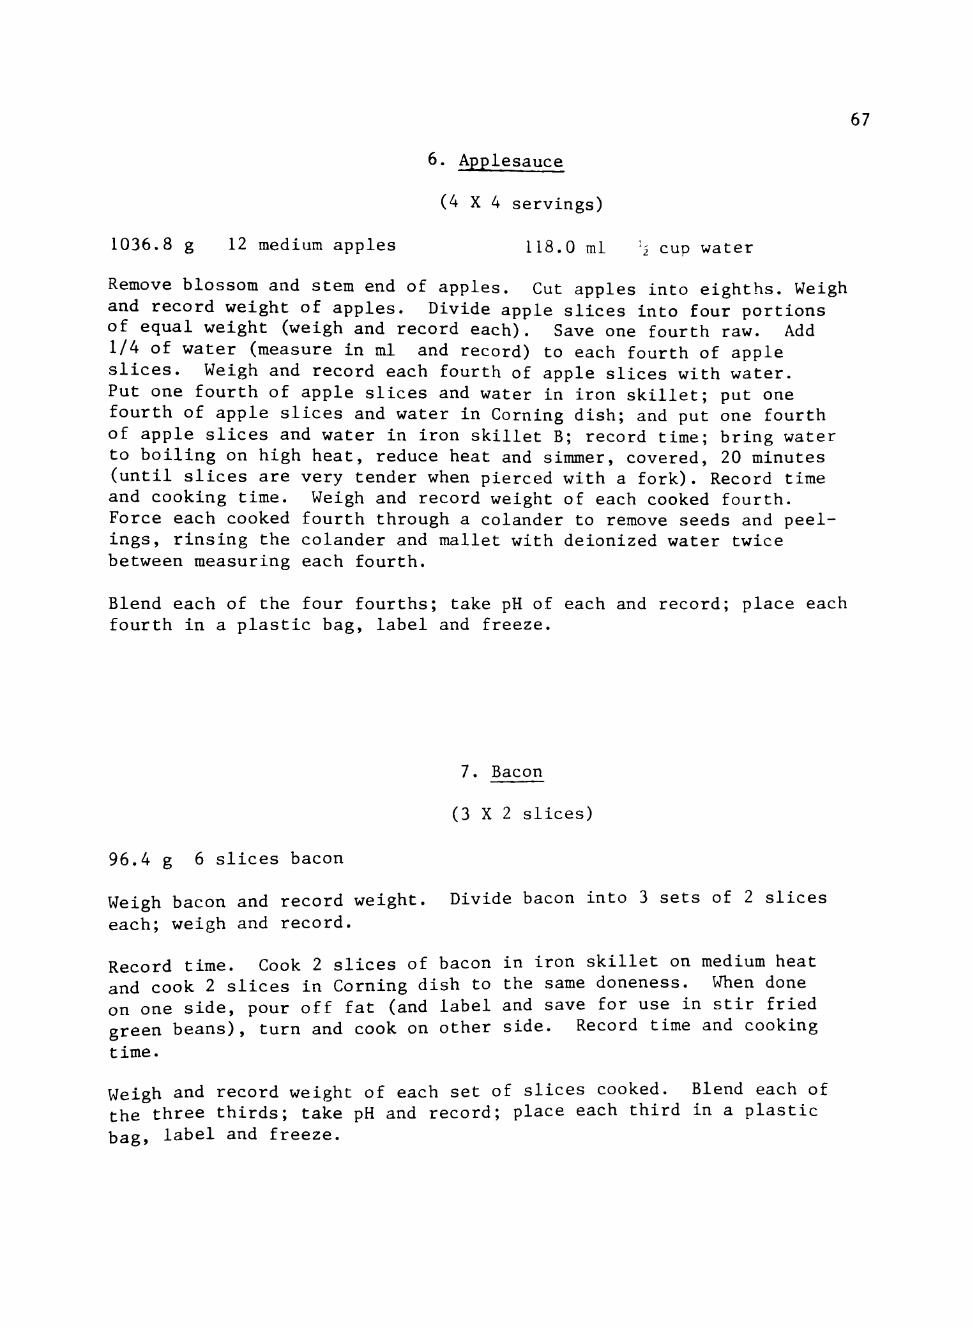
67
6. Applesauce
( 4 X 4 servings)
1036.8 g 12 medium apples 118.0 ml '2 cup water
Remove blossom and stem end of apples. Cut apples into eighths. Weigh and record weight of apples. Divide apple slices into four portions of equal weight (weigh and record each). Save one fourth raw. Add 1/4 of water (measure in ml and record) to each fourth of apple slices. Weigh and record each fourth of apple slices with water. Put one fourth of apple slices and water in iron skillet; put one fourth of apple slices and water in Corning dish; and put one fourth of apple slices and water in iron skillet B; record time; bring water to boiling on high heat, reduce heat and simmer, covered, 20 minutes (until slices are very tender when pierced with a fork). Record time and cooking time. Weigh and record weight of each cooked fourth. Force each cooked fourth through a colander to remove seeds and peelings, rinsing the colander and mallet with deionized water twice between measuring each fourth.
Blend each of the four fourths; take pH of each and record; place each fourth in a plastic bag, label and freeze.
7. Bacon
( 3 X 2 slices)
96.4 g 6 slices bacon
Weigh bacon and record weight. Divide bacon into 3 sets of 2 slices each; weigh and record.
Record time. Cook 2 slices of bacon in iron skillet on medium heat and cook 2 slices in Corning dish to the same doneness. When done on one side, pour off fat (and label and save for use in stir fried green beans), turn and cook on other side. Record time and cooking
time.
Weigh and record weight of each set of slices cooked. Blend each of the three thirds; take pH and record; place each third in a plastic bag, label and freeze.

68
8. Cornbread
(3 X 1 layer)
225.0 g lii cup cornmeal 37.5 g 3 tablespoon sugar
172.5 g Ih cup flour 76.0 g 6 tablespoon oil 19.5 g 1 tablespoon + li tea- 351.2 g V^_ cup milk
spoon baking powder 75.0 g V-i egg 9.9 g V^ teaspoon salt
Oil (with 4.2 g 1 tsp oil; and heat ILOU skillet; oil (witii 4.2 g 1 tsp oil) and heat Corning dish in oven. Weigh and record weight of each ingredient. Sift dry ingredients together in bowl. Combine liquid ingredients and stir with a fork to mix. Add liquid to dry ingredients. Stir just enough to dampen dry ingredients (about 15 strokes).
Divide batter into thirds, weighing and recording weight of each. Save one third raw. Fill greased and heated iron skillet with one third; fill oiled and heated Corning dish with one third. Bake at 425°F 15 minutes. Record time and cooking time. Weigh each of the two cooked layers and record weight.
Blend each of the three thirds; take pH and record; place each third in a plastic bag, label and freeze.
9. French Fried Potatoes
( 3 X 1 potato)
312.0 g 3 medium potatoes, peeled 200 g 1 cup oil
Peel and slice potatoes. Weigh and record weight of potatoes. Divide into thirds, weighing and recording weight of each third. Weigh and record weight of oil. Divide oil in halves, weigh and record weight of each half, and put half of oil into iron skillet and half into Corning dish. Heat oil to hot (350°F) on high. Record time. Cook one third of the potatoes in iron skillet and one third in Corning dish for the same time to the same doneness, stirring occasionally so potatoes brown evenly. Record time and cooking time. Drain each third of potatoes on paper towel. Weigh and record weight of each cooked third.
Blend each of the three thirds; take pH of each and record; place each third in a plastic bag, label and freeze.

69
10. Spanish Rice
( 3 X 1 cup rice - 4 servings)
585.0 g 3 cup rice 681.0 g 3 cup canned tomatoes 75.0 g 6 tablespoons oil 711.0 ml 3 cup deionized water
274.5 g 3 medium onions, peeled 9-9 g V-i teaspoons salt 18.6 g 3 green onions 2.7 g 1 teaspoon chili powder
Weigh and record weight of each ingredient. Divide each ingredient into thirds, weighing and recording weight of each third of each ingredient. Combine one third of each of the ingredients; weigh and record weight; and save for raw. Chop onions.
With one third of the ingredients: record time; saute rice in oil over medium high until lightly browned; add remaining ingredients, stir, cover and simmer on low heat in iron skillet until rice is tender (20 minutes); record time and cooking time. With other third of the ingredients: Cook same as above except in a Corning dish. Weigh each of the two cooked thirds and record weight.
Blend each of the three thirds; take pH of each and record; and place each third in a plastic bag, label and freeze.
11. Stlr-Fried Green Beans
( 3 X 4 servings)
762.0 g 3 9 oz packages frozen French-style green beans 41.2 g h cup bacon drippings (from cooking bacon) 5.1 g 3/4 teaspoon salt
Weigh and record weight of each ingredient. Divide all ingredients except drippings into three equal amounts, weighing and recording each,
Combine one third of each of the ingredients; weigh and record; and save for raw.
Record time. Heat over medium high one-half of the bacon drippings (weigh and record weight) in iron skillet; heat the other half of the drippings in Corning dish. Add one third of beans to iron skillet; add one third of beans to Corning dish. Toss beans around with egg turner to coat beans with drippings. Add one third of salt to iron skillet; add one third of salt to Corning dish. Cover tightly and simmer over low heat until beans are tender, 5 minutes. Record time and cooking time. Weigh each of the two cooked thirds and record weight of each.
Blend each of the three thirds; take pH of each third and record; place each third in a plastic bag, label and freeze.

70
12. Tortillas
(3 X 1 tortilla)
58.9 g 3 frozen corn tortillas 50.0 g ^ cup oil
Weigh and record weight of each ingredient. Weigh and record weight of each tortilla. Save one for raw.
Weigh, record weight and pour 2 tablespoons oil in iron skillet; weigh; record weight and pour 2 tablespoons oil in Corning dish. Record time. Heat oil over high heat until hot (350°F.). Fry one tortilla in hot oil in iron skillet and one tortilla in hot oil in Corning dish until done (lightly browned on one side) , turn and fry until done on the other side. Record time. Remove tortillas from cooking containers, drain tortillas momentarily on paper towel, and weigh and record weight of each tortilla.
Blend each of the three tortillas; take pH of each and record; and place each in a plastic bag, label and freeze. If necessary to blend and take pH, add a small amount of deionized water (measure and record amount) to each tortilla.
13. Medium White Sauce
(3 X 1 cup)
85.2 g 6 tablespoons margarine 703.5 g 3 cups milk 43.2 g 6 tablespoons flour 9.9 g Ih teaspoons salt
Weigh each ingredient and record weight. Divide each ingredient into thirds, weighing and recording weight of each third. Combine one third of each ingredient, weigh and record weight, and save for raw.
Record time. Melt one third of margarine in iron skillet over medium heat; melt one third of margarine in Corning dish over medium heat. Stir'one third of flour into melted margarine in iron skillet; stir one third of flour into melted margarine in Corning dish. Stir one third of milk and one third of salt into mixture in iron skillet; stir one third of milk and one third of salt into mixture in Corning dish. Cook over medium heat, sitrring occasionally, until each mixture thickens. Record time and cooking time. Weigh each of the two sauces and record weight.
Blend each of the three thirds; take pH of each third and record; place each third in a plastic bag, label and freeze.

71
14. Fried Egg
(3 X 1 egg)
25.0 g 2 tablespoons oil 166.0 g 3 large eggs
Weigh and record weight of each egg. Save one egg for raw sample.
Weigh and record weight of oil. Weigh and record weight of one-half of the oil and use it to oil iron skillet; use the other half of oil to oil a Corning dish. Heat skillet and dish. Record time. Slip one egg gently into iron skillet; slip the other egg gently into Corning dish. Cook each of the two eggs over low heat 6 minutes, turning once to cook on each side. Record time and cooking time. Weigh each cooked egg and record weight.
Blend each of the three eggs; take pH of each egg and record; and place each in a plastic bag, label and freeze.
15. Poached Egg
(3 X 1 egg)
8.4 g 2 teaspoons oil 474.0 ml 2 cups deionized water 153.3 g 3 large eggs
Weigh and record weight of each egg. Save one egg for raw sample.
Weigh oil and record weight. Weigh and record weight of each half of the oil. Use one half of the oil to oil the iron skillet; use the other half to oil the Corning dish. Heat on medium heat. Measure and add enough water to make about 1/2" deep in iron skillet, recording the amount of water; add the same amount of water to the Corning dish and record. Bring water to boiling on high heat, reduce heat to simmer. Record time. From a saucer gently slip one egg into water in iron skillet; from a saucer gently slip one egg into water in Corning dish. Spoon water over each of the two eggs, cover and cook 5 minutes until thin film of white coagulates over yolk. Record time and cooking time. Weigh each of the two cooked eggs and record weight.
Blend each of the three eggs; take pH of each egg and record; place each egg in a plastic bag, label and freeze.

72
16. Pancakes
( 3 X 1 large pancake)
115-0 g 1 cup flour 176.0 g 3/4 cup milk
3.3 g h teaspoon salt 55.8 g 1 egg 8.3 g 2 teaspoon sugar 25.0 g 2 tablespoons oil 4.3 g 1 teaspoon baking powder 8.4 g 2 teaspoons oil
Weigh and record weight of each ingredient. Sift dry ingredients together. Combine milk, egg and oil and stir with a fork until well mixed. Stir liquid ingredients into dry only to moisten dry. Divide into three equal portions, weighing and recording weight of each. Save one for raw sample.
Weigh and record weight of 1 teaspoon oil, pour in iron skillet, and heat over medium heat; weigh and record weight of 1 teaspoon oil, pour in Corning dish and heat over medium high heat. Record time. Pour one mixture onto the greased hot iron skillet; pour one mixture onto the greased hot Corning dish. Cook over medium heat until golden brown on one side, 2 minutes, turn and cook other side, 2 minutes. Record time and cooking time. Weigh each pancake and record weight.
Blend each of the three pancakes; take pH of each and record; and place each pancake sample in a plastic bag, label and freeze.
17. Rice
(3 X 1 cup rice)
585.0 g 3 cups rice 9.9 g Vi teaspoons salt 1066.5 g kh cups deionized water
Weigh and record weight of each ingredient. Divide each ingredient into third, weighing and recording weight of each third of ingredient. Combine one third of each of the ingredients; weigh and record weight; and save for raw sample.
With one third of the ingredients: record time, stir rice into boiling salted water in iron skillet, cover and simmer until water is absorbed and rice grains are tender, dry and fluffy, about 20 minutes. With the other third of the ingredients: record time and cook as above except cook in Corning dish. Weigh each of the two cooked thirds and record weight.
Blend each of the three thirds; take pH of each and record; and place each third in a plastic bag, label and freeze.

73
18. Beef Vegetable Stew
( 3 X 2 servings)
551.1 9.9 1.8
43.2 25.0
g g g g g
li lb stew beef 1" cubes
711.0 ml
l^ teaspoons salt h teaspoon black pepper 6 tablespoons flour 2 tablespoons oil 3 cups deionized water
323.3 g 3 medium potatoes, peeled 185.8 g 3 medium carrots, peeled 325.0 g 3 medium onions, peeled 232.6 g 3 ribs celery 340.5 g V-2 cups canned tomatoes
with liquid
Weigh each ingredient and record weight. Divide each ingredient (except oil) into thirds, weighing and recording weight of each, placing one third of each ingredient on one of three waxed paper-lined trays labeled raw, iron and Corning.
Salt, pepper and flour each third of meat. Weigh one third of the seasoned, floured meat and record weight; save for raw sample.
Heat one half of the oil in iron skillet; heat one-half of the oil in Corning dish. Record time. Brown on medium high one third of meat on all sides in oil in iron skillet; brown one third of meat on all sides in oil in Corning dish. Add 118.5 ml water to iron skillet; add 118.5 ml water to Corning dish; add 118.5 ml water to raw sample. Cover skillet and dish and simmer over low heat, 45 minutes, until almost tender; record time and cooking time.
Quarter vegetables. Add one third of vegetables and 118.5 ml water to raw sample; add one third of vegetables and 118.5 ml water to iron skillet; and add one third of vegetables and 118.5 ml water to Corning dish. Record time; simmer vegetables, etc., in skillet and simmer vegetables, etc., in dish 20 minutes until tender; record time and cooking time.
Weigh and record cooked weight of each of the two stews. Weigh and record weight of the one third raw ingredients in the raw sample.
Blend each of the three thirds; take pH of each and record; and place each in a plastic bag, lable and freeze.

74
19. Fried Chicken
( 3 X 3 halves)
2002.6 g li 3-lb fryers 28.8 g. h cup flour 6.6 g 1 teaspoon salt 400.0 g. 2 cups oil 1-4 g ^, teaspoon black pepper
Weigh all ingredients and record weight. Split fryers into halves and divide all ingredients except oil into thirds by weight, weigh and record. Place one third of each ingredient (except no oil) on waxed paper lined tray for raw; place one third of each ingredient on waxed paper lined tray for iron; and place one third of each ingredient on waxed paper lined tray for Corning. (Put the left half of one fryer on iron tray and right half of the same fryer on the Corning tray; use the other half for the raw).
Cut each fryer half into four pieces (wing, drumstick, breast and thigh). Salt, pepper and flour the chicken. Weigh the seasoned and floured chicken pieces to be left raw, record weight, and place these chicken pieces in blender and cover to prevent drying out.
Heat 200.0 g 1 cup oil in iron skillet over high heat to 350"'F, hot but not smoking; heat 200.0 g. 1 cup oil in Corning dish over high heat to 350°F, hot but not smoking; record the temperature. Record the time. Cook the four pieces of cut fryer half in the hot oil, maintaining the 350'*F temperature, over medium high heat until golden brown on one side; record time and cooking time; turn; and cook on other side until golden brown and chicken liquid is clear when drumstick and breast are cut with paring knife; record time and cooking time. Place each of the two chicken halves 1 minute on paper towel, turn pieces and let rest on paper towel on other side one minute. Weigh each cooked chicken half.
Cut meat from bones of the three chicken halves as completely as possible. Blend the seasoned meat for the raw recipe; blend the chicken which has been cooked in iron; blend the chicken which has been cooked in Corning. Take pH of each of the three chickens and record. Place each of the three chickens in plastic bag, label and freeze.

75
20. Liver with Onions
( 3 X 2 servings)
657.0 g Vi lb beef liver, sliced 21.0 g 3 tablespoons flour 9.9 g Ih teaspoons salt 264.3 g 3 small onions, peeled 0.9 g h teaspoon black pepper 100.0 g ^ cup oil
Weigh and record weight of each ingredient except liver. Remove membrane from slices of liver and snip out veins with shears. Weigh and record weight of liver. Peel and thinly slice the onions. Divide ingredients (except oil) into thirds; weigh and record each; and place one third of each ingredient on one of three waxed paper-lined trays. Divide oil into halves.
Salt, pepper, and flour each third of liver. Weigh and record the weight of one third of the seasoned, floured liver and one third of the sliced onions; place them in a blender and cover to prevent drying out. Heat oil in iron skillet over high heat; heat oil in Corning dish over high heat; record time. Brown one third liver quickly in hot oil in iron skillet, turn and brown other side; brown one third of liver quickly in hot oil in Corning dish, turn, and brown on other side; record time. Add onions, reduce heat, cover and cook over low heat 7 minutes until done; do not overcook. Record time and total cooking time.
Weigh each of the two cooked thirds of liver and onions and record. Blend the raw third of ingredients. Blend each cooked third. Take pH of each of the three thirds and record. Place each of the three thirds in plastic bags, label and freeze.

76
Q
O eL) w
Z o M fa >^ o o CJ Q o o
X! M Q Z w
0)
CO
CN
1—1
Replication
Iron B
Glass
Iron
Raw
Total
Iron B
Glass
Iron
Raw
Total
Iron B
Glass
Iron
Raw
Total
Treatment
WEIGHT OF EACH INGREDIENT, grams
WEIGHT BEFORE COOKING, grams
WEIGHT AFTER COOKING, grams
1
TIME, minutes and seconds
Begin cooking
I
End cooking
Cooking time
^