
IRJFE_68_05
14
International Research Journal of Finance and Economics ISSN 1450-2887 Issue 68 (2011) © EuroJournals Publishing, Inc. 2011 http://www.eurojournals.com/finance.htm Financial Performance Evaluation of Some Selected Jordanian Commercial Banks Ahmed Arif Almazari Department of Administrative Sciences- Finance Section, King Saud University E-mail: [email protected]; [email protected] Abstract This study attempted basically to measure the financial performance of some selected Jordanian commercial banks for the period 2005-2009. It is evaluatory in nature, drawing sources of information from secondary data. The financial performance of banks is studied on the basis of financial variables and ratios. In this paper an attempt was made to analyze the financial performance of seven selected Jordanian commercial banks using simple regression in order to estimate the impact of independent variable represented by; the bank size, asset management, and operational efficiency on dependent variable- financial performance represented by; return on assets and interest income size. It was found that banks with higher total deposits, credits, assets, and shareholders’ equity does not always mean that has better profitability performance. It was also found that there exists a positive correlation between financial performance and asset size, asset utilization and operational efficiency, which was also confirmed with regression analysis that financial performance is greatly influenced by these independent factors. This study can be a source of help to bank managers to improve their financial performance and formulate policies that will promote effective financial system. The study also recommend measures that could be adopted by banks to ensure soundness in their operations. Keywords: Financial performance, financial ratios, deposits, credits, assets, shareholders. JEL Classification Codes: G200,G210 I. Introduction Banks are the backbone of the global economy, providing capital for innovation, infrastructure, job creation and overall prosperity. Banks also play an integral role in society, affecting not only spending by individual consumers, but also the growth of entire industries. Financial performance help us to measure the results of a firm's policies and operations in monetary terms. These results are reflected in the firm's return on investment, return on assets, value added. It also helps us to evaluate how well a bank is using its resources to make a profit. Common examples of financial performance include operating income, earnings before interest and taxes, and net asset value. It is important to note that no one measure of financial performance should be taken on its own. Rather, a thorough assessment of a company's performance should take into account many different measures. Financial performance is a subjective measure of how well a bank can use assets from its primary mode of business and generate revenues. This term is also used as a general measure of a firm's overall financial health over a given period of time, and can be used to compare similar firms across the same industry or to compare industries or sectors in aggregation.
-
Upload
romman-islam -
Category
Documents
-
view
27 -
download
2
Transcript of IRJFE_68_05
International Research Journal of Finance and Economics
ISSN 1450-2887 Issue 68 (2011)
© EuroJournals Publishing, Inc. 2011
http://www.eurojournals.com/finance.htm
Financial Performance Evaluation of Some Selected Jordanian
Commercial Banks
Ahmed Arif Almazari
Department of Administrative Sciences- Finance Section, King Saud University
E-mail: [email protected]; [email protected]
Abstract
This study attempted basically to measure the financial performance of some
selected Jordanian commercial banks for the period 2005-2009. It is evaluatory in nature,
drawing sources of information from secondary data. The financial performance of banks is
studied on the basis of financial variables and ratios. In this paper an attempt was made to
analyze the financial performance of seven selected Jordanian commercial banks using
simple regression in order to estimate the impact of independent variable represented by;
the bank size, asset management, and operational efficiency on dependent variable-
financial performance represented by; return on assets and interest income size. It was
found that banks with higher total deposits, credits, assets, and shareholders’ equity does
not always mean that has better profitability performance. It was also found that there
exists a positive correlation between financial performance and asset size, asset utilization
and operational efficiency, which was also confirmed with regression analysis that financial
performance is greatly influenced by these independent factors. This study can be a source
of help to bank managers to improve their financial performance and formulate policies
that will promote effective financial system. The study also recommend measures that
could be adopted by banks to ensure soundness in their operations.
Keywords: Financial performance, financial ratios, deposits, credits, assets, shareholders.
JEL Classification Codes: G200,G210
I. Introduction Banks are the backbone of the global economy, providing capital for innovation, infrastructure, job
creation and overall prosperity. Banks also play an integral role in society, affecting not only spending
by individual consumers, but also the growth of entire industries. Financial performance help us to
measure the results of a firm's policies and operations in monetary terms. These results are reflected in
the firm's return on investment, return on assets, value added. It also helps us to evaluate how well a
bank is using its resources to make a profit. Common examples of financial performance include
operating income, earnings before interest and taxes, and net asset value. It is important to note that no
one measure of financial performance should be taken on its own. Rather, a thorough assessment of a
company's performance should take into account many different measures. Financial performance is a
subjective measure of how well a bank can use assets from its primary mode of business and generate
revenues. This term is also used as a general measure of a firm's overall financial health over a given
period of time, and can be used to compare similar firms across the same industry or to compare
industries or sectors in aggregation.

International Research Journal of Finance and Economics - Issue 68 (2011) 51
The examination of financial performance in banking has important public policy implications
in the Jordanian context due to the following facts: Firstly, the principle aim is to achieve a more
competitive and efficient financial system. The banking industry is a vital part of the financial system
in any country. Thus, its successes or failure strongly affect the health of the economy. Secondary, it is
interesting to study the determinants of financial performance, as it is extremely useful for managers in
improving organizational performance and it also help the policy-making bodies create, if needed, an
appropriate regulatory environment. Lastly, despite the importance of financial performance studies,
the literature on performance in Jordanian banking is not existing. So a great work is needed on
measuring and comparing the financial performance of Jordanian banks. In view of the above, a study
of financial performance in Jordanian banks is useful to various interest groups such as the
Government, Central Bank of Jordan, and the community. Hence, the present project proposes to
address this important issue on some selected Jordanian commercial banks.
The rest of paper is organized to study the linkage between financial performance measured by
return on assets (ROA), interest income and bank size (Bank Assets), asset management (Utility),
operational efficiency .The main purpose of this study is to assess the financial data of some selected
Jordanian commercial banks for the financial periods (2005-2009). Furthermore, this study will
examine the effect of bank size (Bank Assets), asset management (Utility), operational efficiency on
banks performance. The selected Jordanian Commercial banks will be analyzed quantitatively to find
the differences among these banks and they will be ranked based on their financial performance.
This study attempts basically to measure the financial performance of some selected Jordanian
commercial banks. Banks are classified according to their financial characteristics and financial
indicators will be presented from the banks financial statements. The other objectives will attempt to
examine the linkages among operational efficiency, size of the banks, asset utilization and the financial
performance, study the impact of operational efficiency, size of the banks, asset utilization on
profitability measured by ROA and interest income and to measure the performance of the Selected
Jordanian Commercial Banks based on certain financial indicators.
It is hypothesized in this study that, there is a positive correlation relationships between the
financial performance measured by (ROA, and interest income size), and the (operational efficiency,
asset management, bank size). Moreover, there exist an impact of operational efficiency, asset
management, and bank size on financial performance of the selected Jordanian commercial bank. This
study organized as follows: Section II discusses the relevant literature review. Section III gives a brief
overview on the Jordanian banking system. Section IV introduces the methodology. The Section V
reports the results and analysis. The paper’s conclusions are summarized in section VI.
II. Literature Review Usman et al (2009) conducted a study on banking efficiency dynamics with financial sector reforms
effect. They took a data set of 20 domestic commercial banks of Pakistan and measure their efficiency
using Data Envelopment Analysis Malmquist Productivity Index of Total Factor Productivity (TFP)
from 1990-2005. Caves et al (1982) initially proposed the idea of Malmquist index in the parametric
frontier framework. The index measures the total factor productivity change between two data points
over time. The idea was further extended by Berg et al (1991) to non parametric frontier.
For estimation purpose, they took deposits, labor and capital as inputs and loan advances and
investment as outputs. They divided their sample period into three periods, pre reform period (1991-
1997), first reform period (1998-2001) and second reform period (2002-2005). The data was collected
from State Bank of Pakistan annual issues.
Results showed that in the first phase of reforms technological change decreased by 14.3%
along with total factor productivity by 12.2% but technical efficiency change increased to 2.1%. In 2nd
phase of reforms, total factor productivity, technological change and technical efficiency change was

52 International Research Journal of Finance and Economics - Issue 68 (2011)
increased by 17.4%, 14.6% and 2.4% respectively. The results supported the hypothesis that the
financial reforms improved the banking efficiency of Pakistan banking sectors.
Al-Obaidan (2008) suggest that large banks are more efficient than small banks in the Gulf
region. Tarawneh (2006) found that the bank with higher total capital, deposits, credits, or total assets
does not always mean that has better profitability performance. Financial performance of the banks was
strongly and positively influenced by the operational efficiency and asset management, in addition to
the bank size.
Jahangir, Shill and Haque (2007) stated that the traditional measure of profitability through
stockholder’s equity is quite different in banking industry from any other sector of business, where
loan-to-deposit ratio works as a very good indicator of banks' profitability as it depicts the status of
asset-liability management of banks. But banks' risk is not only associated with this asset liability
management but also related to growth opportunity. Smooth growth ensures higher future returns to
holders and there lies the profitability which means not only current profits but future returns as well.
So, market size and market concentration index along with return to equity and loan-to-deposit ratio
grab the attention of analyzing the banks’ profitability.
X. Chen et all (2005) applies frontier analysis (X-efficiency) using DEA to examine the cost,
technical and a locative efficiency of 43 Chinese banks over the period 1993 to 2000. In this paper the
input used are interest expenses, non-interest expenses (which includes the price of labor), price of
deposits (interest paid on deposits divided by deposits), and the price of capital (non-interest expenses
are divided by fixed assets); Outputs used are loans, deposits and non-interest income. Results show
that the large state-owned banks and smaller banks are more efficient than medium sized Chinese
banks. In addition, technical efficiency consistently dominates the a locative efficiency of Chinese
banks.
Fadxlan Sufian (2006) applied DEA window analysis approach to examine the long-term trend
in the efficiency of 29 Singapore banking groups during the period of 1993-2003. In this paper, the
input vector includes (x1) Total Deposits, which includes deposits from customers and other banks and
(x2) Fixed Assets while (y1) total loans, which includes loans to customers and other banks and (y2)
Other Income, which consists of fee and commission incomes and other non-interest operating income
are the output vectors. The results suggest that the Singapore banking groups have exhibited mean
overall or technical efficiency of 88.4 per cent. It was found that the Singapore banking groups’ overall
efficiency was on a declining trend during the earlier part of the studies, before increasing dramatically
during the later period.
(Maghyereh, 2003) Jordan undertook major financial sector liberalization starting in the early
of 1990s. The effect of this reform on the efficiency of the banking sector is evaluated. A non
parametric method of Data Envelopment Analysis (DEA) has been used to arrive at the efficiency
scores for a panel data sample covering eight Jordanian commercial banks over the period 1984 to
2001. The findings suggest that liberalization program was followed by an observable increase in
efficiency. Another finding of the study is that large banks demonstrated the faster productivity growth
during the liberalization. The study has important implications such as guiding the government policy
regarding deregulation and liberalization.
Chowdhury (2002) observed that the banking industry of Bangladesh is a mixed one
comprising nationalized, private and foreign commercial banks. Many efforts have been made to
explain the performance of these banks. Understanding the performance of banks requires knowledge
about the profitability and the relationships between variables like market size, bank's risk and bank's
market size with profitability. Indeed, the performance evaluation of commercial banks is especially
important today because of the fierce competition. The banking industry is experiencing major
transition for the last two decades. It is becoming imperative for banks to endure the pressure arising
from both internal and external factors and prove to be profitable.
International Research Journal of Finance and Economics - Issue 68 (2011) 53
Siddique and Islam (2001) pointed out that the Commercial Banks, as a whole, are performing
well and contributing to the economic development of the country. The average profitability of all
Bangladeshi banks collectively was 0.09% during 1980 to 1995 which means that a profit of TK 0.09
was earned by utilizing assets of TK 100. In every aspect of profit, banking sector contributes the
national economy as well as to the individual organization. Despite overall growth of the banking
sector being positive, the performances of different categories of banks were not equally attractive.
Bashir (2000) examines the determinants of Islamic bank’s performance across eight Middle
Eastern countries for 1993-1998 period. A number of internal and external factor were used to predict
profitability and efficiencies. Controlling for macroeconomic environment, financial market situation
and taxation, the results show that higher leverage and large loans to asset ratios, lead to higher
profitability. The paper also reports that foreign-owned banks are more profitable that the domestic
one. There is also evidence that taxation impacts negatively bank profitability. Finally, macroeconomic
setting and stock market development have a positive impact on profitability.
Bassett and Brady’s (2002) study found that small banks grew more rapidly than large banks
from 1985-2001 with profitability remained at a high level. While interest costs increased, this was
more than offset by higher returns on earning assets.
III. Overview on the Jordanian Banking System The Jordanian banking sector is concentrated. The share of assets held by the three largest banks is
close to 70 percent when we take into account the global assets of Jordanian banks. Though
concentration levels have come down recently, they still exceed that of many countries in the region.
However, concentration is not equivalent to competition (see Jackson, 1992 and Cetorelli, 1999), since
contestable sectors where barriers to entry and exit are low can remain competitive. As a result an
analysis of bank competition in Jordan requires a more comprehensive framework.
As far as the banking policy, the CBJ adopted further measures and procedures in 2009 to
enhance the soundness of the banking institutions, raise the degree of competition between its units and
strengthen their capacity in the area of risk management based on the best international practices,
particularly the Accords of Basel II Committee. The CBJ has also adopted several precautionary
measures which contributed to empowering licensed banks to avoid the risks which hit international
banking institutions. Further, the Government has fully guaranteed deposits in local and foreign
currencies as well as interbank lending until the end of 2010 which contributed to enhancing the
confidence in the banking system.
As for the developments in the operations of licensed banks in 2009, the outstanding balance of
extended credit facilities grew by 2.1 percent, or JD 272.9 million. The facilities extended to the
private sector (resident) accounted for 63.0 percent of the aforementioned increase. Similarly, total
deposits were up by JD 2,195.8 million, or 12.1 percent. The deposits of the private sector (resident)
took up the lion's share of this increase in total deposits; accounting for 89.5 percent. The
developments in the interest rates at the banking sector indicated that the interest rates on time deposits
were down at a higher pace than the decline in the interest rates on credit facilities. Consequently, the
interest rate margin, measured by the difference between the rate on “loans and advances” and the rate
on time deposits, went up to stand at 484 basis points at the end of 2009 compared with 382 basis
points at the end of the preceding year.(CBJ,2009)
On the front of Amman Stock Exchange (ASE), most indicators displayed negative
performance in comparison with their levels in the previous year due to the repercussions of the
international financial crisis; the stock price index weighted by market capitalization went down by
11.6 percent. In effect, market capitalization melted by 11.3 percent. In addition, trading volume
tumbled by 52.4 percent in 2009. (CBJ, 2009).
By the end of 2009, there were 23 banks operating in Jordan, of which there are two Islamic
banks and eight foreign banks branches. These banks carry out their operations through a network of
54 International Research Journal of Finance and Economics - Issue 68 (2011)
619 branches and 66 representative offices all over the Kingdom. Accordingly, the index of population
to the total number of operating banks was about 9.9 thousand citizens per branch at the end of 2009
(CBJ, 2009). On the other hand, the number of branches of the Jordanian banks operating abroad stood
at 135 branches and 26 representative offices at the end of 2009. Commercial banks are the dominate
institution in the Jordanian banking system. The commercial banks in Jordan are completely private
ownership. Because of less developed capital markets, the banks are the main source of funding for the
industrial and commercial business. Presently, there are 13 commercial banks in Jordan, only 7 banks
are considered as a sample in this study these are: Arab Bank (AB), The Housing Bank for Trade and
Finance (HBTF), Jordan National Bank (JNB), Jordan Kuwait Bank (JKB), Bank of Jordan (BJ), Cairo
Amman Bank (CAB), and Union Bank (UB).
Although the newly developing capital markets are able to compete with the banking sector,
banks are still dominate in the financial system, as in other developing countries financial system.
Development banks, on other hand, obtain funds from the government or other international
institutions like the World Bank. The acquired funds have traditionally been used to make medium and
long term loans to selected economics sectors.
The Jordanian banking system was heavily regulated with respect to market entry and interest
rates before 1990s. To increase efficiency and create competition in financial system, the Jordanian
government announced and undertook a series of steps to liberalize the financial system in 1993. The
main objective of this program was to establish a Western-type free market economy and competition.
Key among the steps were: removal restrictions on interest rates, reduction of government direct
lending, expanded product deregulation, and reduction of restrictions on foreign exchange transactions,
among others. Additional reforms were implemented in 1997 to further liberalize the finance system:
interest rates were further deregulated, greater autonomy was given to bank managements, increased
capital adequate requirements, promoted bank mergers and acquisitions induced the inter-bank market,
and further liberalization of foreign exchange transactions and foreign investment was undertaken.
There have been also several important technological developments in the industry in recent
years. Banks have started computerizing all their operations and have introduced Automatic Teller
Machines (ATMs), on-line system of communication and PC banking. They have also changed their
product mix and introduced new products to the markets. Therefore, the period between 1984 and 2001
seems to be most suitable for studying the effect of the liberalization program on the performance of
Jordanian banking system in term of efficiency, since the fundamental institutional changes was
established approximately in the mid of this period.
IV. Methodology To achieve the main objectives of this study, the data for this study was gathered from secondary
sources-the bank's financial statements as published in the Jordanian Shareholders Guide (2005-2009).
These data were used to compute key financial ratios of the selected Jordanian commercial banks for
the mentioned period, as well as to assess the performance of these banks. In addition, data was
gathered from Books, papers, articles, Specialized International Journals, the World Wide Web
(Internet), and relevant previous studies. This study uses a descriptive financial analysis to describe,
measure, compare, and classify the financial situations of the selected Jordanian commercial banks.
Dominant commercial banks of Jordan were selected as a sample of study, which it accounts
for 53.85% of the study population ( number of commercial banks working in Jordan was 13 banks in
2009), and 30.43% out the total banks operating in Jordan. The number of the selected banks should
not be considered as a shortcoming of the study since its title focused on just Jordanian commercial
banks. However, the dependent variable of this study will be financial performance which will be
measured by return on assets ( ROA ) and the interest income size. The independent variables of this
study are the following:
• The Bank Size measured by the total assets of the bank.
International Research Journal of Finance and Economics - Issue 68 (2011) 55
• Asset Management measured by asset utilization ratio ( operational income divided by total
assets )
• Operational Efficiency measured by the operating efficiency ratio ( total operating expenses
divided by net interest income )
For the purpose of analysis, this study uses the major banking activities and is comprised of
total deposits, total credits, total assets, total shareholder equity, return on equity, and return on
deposits. Also, this study tries to explore any kind of variance according to its different variables.
Therefore, correlations, ratio analysis, and simple regression were applied to examine and compare the
impact of independent variables on the dependent variable. Analysis of variance (ANOVA) was used
in testing the hypotheses and to measure the differences and similarities between the sample banks
according to their different characteristics. Pearson correlation coefficient also used to investigate the
correlation between the paper variables at 5% level of confidence according to the SPSS software
package.
V. Results and Analysis Comparisons of the bank’s deposits, credits, assets, owners equity, ROE, ROD, and ROA
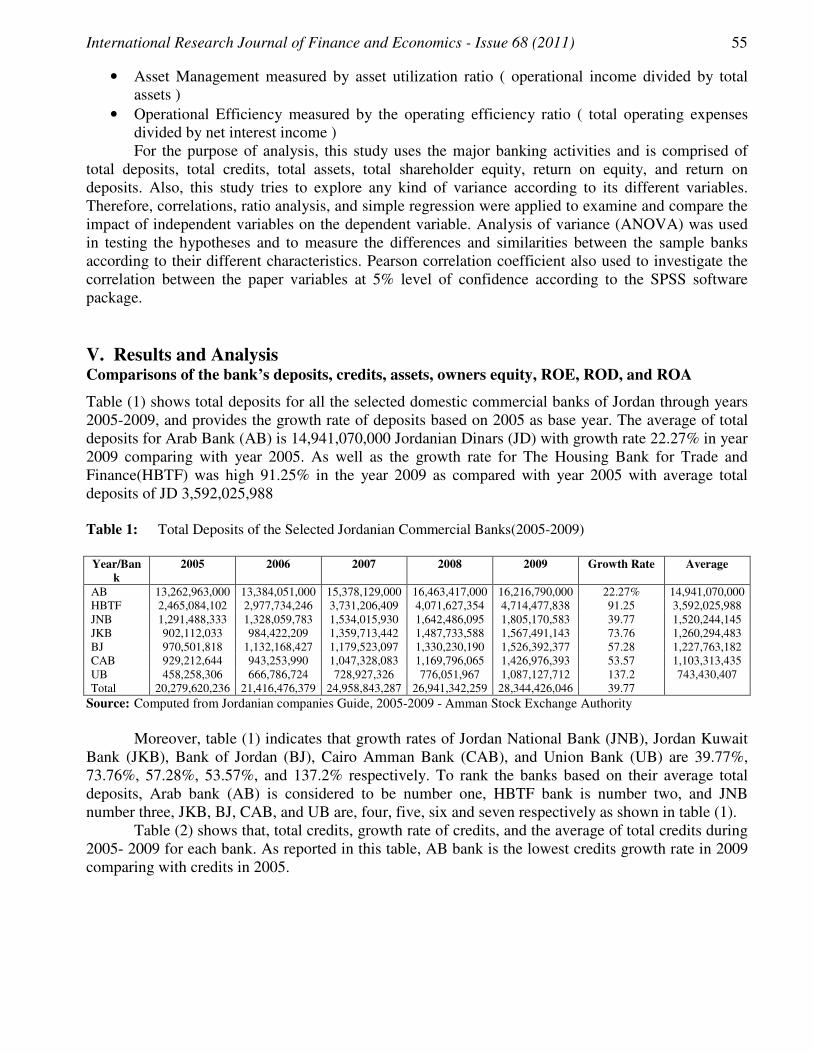
Table (1) shows total deposits for all the selected domestic commercial banks of Jordan through years
2005-2009, and provides the growth rate of deposits based on 2005 as base year. The average of total
deposits for Arab Bank (AB) is 14,941,070,000 Jordanian Dinars (JD) with growth rate 22.27% in year
2009 comparing with year 2005. As well as the growth rate for The Housing Bank for Trade and
Finance(HBTF) was high 91.25% in the year 2009 as compared with year 2005 with average total
deposits of JD 3,592,025,988
Table 1: Total Deposits of the Selected Jordanian Commercial Banks(2005-2009)
Year/Ban
k
2005 2006 2007 2008 2009 Growth Rate Average
AB 13,262,963,000 13,384,051,000 15,378,129,000 16,463,417,000 16,216,790,000 22.27% 14,941,070,000
HBTF 2,465,084,102 2,977,734,246 3,731,206,409 4,071,627,354 4,714,477,838 91.25 3,592,025,988
JNB 1,291,488,333 1,328,059,783 1,534,015,930 1,642,486,095 1,805,170,583 39.77 1,520,244,145
JKB 902,112,033 984,422,209 1,359,713,442 1,487,733,588 1,567,491,143 73.76 1,260,294,483
BJ 970,501,818 1,132,168,427 1,179,523,097 1,330,230,190 1,526,392,377 57.28 1,227,763,182
CAB 929,212,644 943,253,990 1,047,328,083 1,169,796,065 1,426,976,393 53.57 1,103,313,435
UB 458,258,306 666,786,724 728,927,326 776,051,967 1,087,127,712 137.2 743,430,407
Total 20,279,620,236 21,416,476,379 24,958,843,287 26,941,342,259 28,344,426,046 39.77
Source: Computed from Jordanian companies Guide, 2005-2009 - Amman Stock Exchange Authority
Moreover, table (1) indicates that growth rates of Jordan National Bank (JNB), Jordan Kuwait
Bank (JKB), Bank of Jordan (BJ), Cairo Amman Bank (CAB), and Union Bank (UB) are 39.77%,
73.76%, 57.28%, 53.57%, and 137.2% respectively. To rank the banks based on their average total
deposits, Arab bank (AB) is considered to be number one, HBTF bank is number two, and JNB
number three, JKB, BJ, CAB, and UB are, four, five, six and seven respectively as shown in table (1).
Table (2) shows that, total credits, growth rate of credits, and the average of total credits during
2005- 2009 for each bank. As reported in this table, AB bank is the lowest credits growth rate in 2009
comparing with credits in 2005.

56 International Research Journal of Finance and Economics - Issue 68 (2011)
Table 2: Total Credits of the Selected Jordanian Commercial Banks(2005-2009)
Year/Bank 2005 2006 2007 2008 2009 Growth Rate Average
AB 14,956,174,000 15,346,190,000 17,672,037,000 19,171,048,000 19,298,285,000 29.03% 17,288,747,000
HBTF 3,261,250,340 3,261,251,574 4,129,777,729 4,519,566,069 5,123,864,965 54.05 4,059,142,134
JNB 1,494,565,848 1,528,093,160 1,778,753,337 1,903,176,494 2,039,897,708 36.49 1,748,897,309
JKB 1,306,594,953 1,453,910,759 1,790,964,139 1,812,634,554 1,846,114,124 41.29 1,642,043,706
BJ 1,064,156,220 1,235,851,970 1,294,852,518 1,494,852,518 1,693,868,784 59.17 1,356,716,402
CAB 1,063,989,148 1,040,613,519 1,174,201,558 1,310,743,542 1,569,863,393 47.55 1,231,882,232
UB 546,484,579 789,594,521 853,091,269 915,951,627 1,227,304,199 124.58 866,485,239
Total 23,693,220,088 24,655,505,503 28,693,677,550 31,127,972,804 32,799,198,173 38.43
Source: Computed from Jordanian companies Guide, 2005-2009 - Amman Stock Exchange Authority
It is clear from table (2) that AB bank is the highest average of total credits, and UB bank is the
lowest one. However, the bank with highest growth rate of total credits during the period does not
always mean having high average of total credits. Based on the average total credits of the listed banks
in table (2), rank of the banks will be as: AB is the first, HBTF is the second, and JNB, JKB, BJ, CAB,
and UB get positions of the third, the fourth, the fifth, the sixth, and the seventh respectively.
From table (1) and (2), total credits growth in 2009 for all the selected commercial banks of
Jordan has lagged behind the expansion of total deposits in the loan portfolio. The combined credits of
these banks increased by 38.43% in 2009, while total deposits rose by 39.77%.
Table (3) illustrates for the listed banks, the total assets for each bank in the period 2005-2009,
and shows also the growth rate in assets and the average of total assets. Its clear from table (3) that
JNB bank got the lowest growth rate in its total assets ( 34.91% ). On the other hand, UB bank gained
the highest growth rate in its assets ( 123.3% ), which means that its total assets was ( JD 652,410,491 )
in 2005 and then, increased by 123.3% in year 2009 to become equal to JD 1,456,573,683.
Table 3: Total Assets of the Selected Jordanian Commercial Banks(2005-2009)
Year/Bank 2005 2006 2007 2008 2009 Growth Rate Average
AB 16,815,804,000 18,440,138,000 21,220,031,000 22,751,002,000 23,099,491,000 37.37% 20,465,293,200
HBTF 3,196,252,968 4,096,450,307 5,020,071,766 5,430,579,044 6,090,337,737 90.55 4,766,738,364
JNB 1,672,262,160 1,740,841,639 1,976,151,767 2,106,172,872 2,256,082,381 34.91 1,950,302,164
JKB 1,409,470,590 1,649,761,717 2,016,727,606 2,062,791,204 2,138,860,149 51.75 1,855,522,253
BJ 1,182,082,026 1,376,230,654 1,455,719,079 1,686,018,203 1,907,991,848 61.41 1,521,608,362
CAB 1,227,330,587 1,178,849,516 1,319,245,230 1,462,244,466 1,746,913,972 42.33 1,386,916,754
UB 652,410,491 891,725,489 1,068,090,450 1,134,469,444 1,456,573,683 123.3 1,040,653,911
Total 26,155,612,822 29,373,997,322 34,076,036,898 36,633,277,233 38,696,250,770 47.95
Source: Computed from Jordanian companies Guide, 2005-2009 - Amman Stock Exchange Authority.
Ranking of the banks based on their average total assets is showed that AB bank to be number
one and UB bank is the last one in the total assets ranking. It’s clear also from table (3) that JNB bank
is ranked in the last position as regards growth rate in its assets.
Table 4: Total Shareholders’ Equity of the Selected Jordanian Commercial Banks(2005-2009)
Year/Bank 2005 2006 2007 2008 2009 Growth Rate Average
AB 1,859,630,000 3,093,948,000 3,547,994,000 3,579,954,000 3,801,206,000 104.4% 15,882,732,000
HBTF 373,762,994 808,437,465 850,478,735 868,663,134 891,068,492 138.4 758,482,164
JNB 177,696,312 211,448,131 195,834,145 201,458,941 214,609,806 20.77 200,209,467
JKB 102,875,637 187,665,623 216,946,670 239,397,722 286,572,398 178.6 206,691,610
BJ 117,925,806 140,378,684 161,205,938 179,604,487 192,668,311 63.33 158,356,645
CAB 163,341,439 138,235,997 145,043,672 151,500,924 177,050,579 8.39 155,034,522
UB 105,925,912 102,130,968 214,999,181 218,517,817 229,269,484 116.4 174,168,672
Total 2,901,158,100 4,682,244,868 5,332,502,341 5,439,097,025 5,792,445,070 99.66
Source: Computed from Jordanian companies Guide, 2005-2009 - Amman Stock Exchange Authority

International Research Journal of Finance and Economics - Issue 68 (2011) 57
According to table (4), JKB bank gained the highest growth rate in its total shareholders’ equity
(178.6%) in year 2009 comparing with its owners equity in year 2005. A low growth rate ( 8.39 % ) for
CAB bank indicates that its shareholders equity was low from year 2005 to 2009. Further, HBTF bank
is ranked in the second position among the listed banks in table ( 4 ) based on their average of total
shareholders’ equity. As mentioned in table (4) CAB bank is ranked to be last one in average of total
shareholders’ equity and it has low growth rate in its equity comparing with other banks.
The return on equity (ROE) is considered to be one of the profitability performance ratios. It
shows a higher value for JKB bank when compared with other listed banks in table (5).
Table 5: Return On Equity Ratio for the Selected Jordanian Commercial Banks(2005-2009)
Year/Bank 2005 2006 2007 2008 2009 Average
AB 10.76% 8.51% 9.43% 10.06% 6.58% 9.07%
HBTF 19.22 11.42 12.67 11.05 6.72 12.22
JNB 14.61 9.56 5.50 8.61 8.69 9.39
JKB 24.90 20.85 20.46 19.40 15.30 20.18
BJ 19.69 18.22 15.04 18.29 13.88 17.02
CAB 19.32 13.92 14.42 13.40 14.43 15.10
UB 23.32 12.16 6.41 7.14 7.12 11.23
Source: Calculated from financial statements of the banks (2005-2009)
The average ROE ratio is 17.02% for BJ bank while AB bank got the lowest average ROE
(9.07%) during the period (2005-2009). The ROE is net profit after taxes divided by total owners
equity. It reflects the bank management's ability to generate net profits from using the owners equity as
one of the financial sources.
Table (6) shows that the majority of return on deposits (ROD) ratios of the listed banks are
positive. It is clearly shown that overall (ROD) ratios were fluctuated through the period for all banks.
To most financial analysts, (ROD) is one of the best measures of bank profitability performance. It is
calculated through dividing net profits by total deposits. This ratio reflects the bank management
ability to utilize the customers’ deposits in order to generate profits. The average of (ROD) for bank
JKB is 3.36% during the period 2005-2009 as shown in table (6). Comparing it with other banks, JKB
bank will be the first, and JNB bank is the last one with average of 1.26 %.
Table 6: Return on Deposits Ratio for the Selected Jordanian Commercial Banks(2005-2009)
Year/Bank 2005 2006 2007 2008 2009 Average
AB 1.51% 1.97% 2.18% 2.19% 1.54% 1.88%
HBTF 2.91 3.18 2.99 2.49 1.41 2.60
JNB 2.00 1.52 0.70 1.06 1.04 1.26
JKB 2.84 4.08 3.34 3.69 2.86 3.36
BJ 2.39 2.26 2.06 2.47 1.66 2.17
CAB 3.40 2.04 2.00 1.73 1.80 2.13
UB 5.40 1.86 1.89 2.01 1.50 1.27
Source: Calculated from financial statements of the banks (2005-2009)
The return on assets (ROA) is financial ratio used to measure the relationship of profits or
earnings and total assets. (ROA) measure assesses the profitability performance of total assets, and
could be treated as measure of financial performance in this study. As it is known, this measure
contains two elements, efficiency (total assets turnover), and effectiveness (profit margin). As
mentioned earlier, ROA reflects the bank management ability to generate profits by using the available
financial and real assets.

58 International Research Journal of Finance and Economics - Issue 68 (2011)
Table 7: Return On Assets for the Selected Jordanian Commercial Banks(2005-2009)
Year/Bank 2005 2006 2007 2008 2009 Average
AB 1.19% 1.43% 1.58% 1.58% 1.08% 1.73%
HBTF 2.25 2.31 2.22 1.87 1.09 1.95
JNB 1.55 1.16 0.55 0.83 0.83 0.98
JKB 1.82 2.43 2.25 2.38 2.10 2.20
BJ 1.96 1.86 1.67 1.95 1.33 1.75
CAB 2.57 1.63 1.58 1.39 1.46 1.74
UB 3.79 1.39 1.29 1.38 1.12 1.79
Source: Calculated from financial statements of the banks (2005-2009).
As shown in table (7), the summary of (ROA) ratios during the period of 2005-2009 for each
Selected Jordanian Commercial Bank is presented. In order to rank the banks based on this ratio, JKB
bank is the first one, it has an average of ROA 2.20%. The second position is for HBTF bank with
ROA equals to 1.95%, and the last position is belonged to JNB bank.
In order to summarize the classification of the banks based on their rank of activities and
Profitability ratios, table (8) contains ranks of the positions for these banks. As it is shown in this table,
rank of Arab Bank (AB) is the first position in total deposits, total credits, total assets, and total
shareholders’ equity. Further, it is in the sixth position among other banks in its profitability
performance (ROA). Contrary to AB bank, Union Bank (UB) got the last position in total deposits,
total credits, and total assets. Also, this bank is ranked to be in the third position in the profitability
performance (ROA). The profitability position of JNB bank is the last rank based on its (ROE), (ROD),
and (ROA) despite of its third rank in deposits, credits, and assets as shown in table (8).
Table 8: Ranks of the Selected Jordanian Commercial Banks Based on Financial Indicators
Banks/Indicators AB HBTF JNB JKB BJ CAB UB
Deposits 1 2 3 4 5 6 7
Credits 1 2 3 4 5 6 7
Assets 1 2 3 4 5 6 7
Shareholders’ Equity 1 2 4 3 6 7 5
Return On Equity (ROE) 7 4 6 1 2 3 5
Return On Deposits (ROD) 5 2 7 1 3 4 6
Return On Assets (ROA) 6 2 7 1 4 5 3
Hypotheses Testing This study proposes two hypotheses: the first one stated that there is a positive correlation relationships
among the financial performance measured by ROA, and interest income size, and the independent
variables (operational efficiency, asset management, bank size ). The second hypothesis was stated as “
there exist an impact of operational efficiency, asset management, and bank size on financial
performance of the selected Jordanian commercial banks . Correlations and analysis of variance were
used to test the hypotheses of the study.
Based on the above analysis, the average data for all variables of the study during the period
2005-2009 as shown in table (9), correlations and analysis of variance were calculated to examine the
impact of independent variables on the dependent variable.

International Research Journal of Finance and Economics - Issue 68 (2011) 59
Table 9: Key Average Data (2005-2009) for the Selected Jordanian Commercial Banks
Banks /
Variables
AB HBTF JNB JKB BJ CAB UB
Variable 1 *
ROA 1.73% 1.95 0.98 2.20 1.75 1.74 1.79
Variable 2 * Interest Income 976,845,200 492,858,726 104,646,812 114,521,917 87,775,163 90,534,558 54,730,480
Variable 3 **
Operational
Efficiency 73.45% 59.62% 108.9% 55.12% 72.55% 89.51% 63.93%
Variable 4 **
Asset
Utilization 1.73% 2.70% 1.25% 3.17% 2.47% 2.32% 2.12%
Variable 5 **
Asset Size 20,465,293,200 4,766,738,364 1,950,302,164 1,855,522,253 1,521,608,362 1,386,916,754 1,040,653,911
*Dependent Variable
**Independent Variable
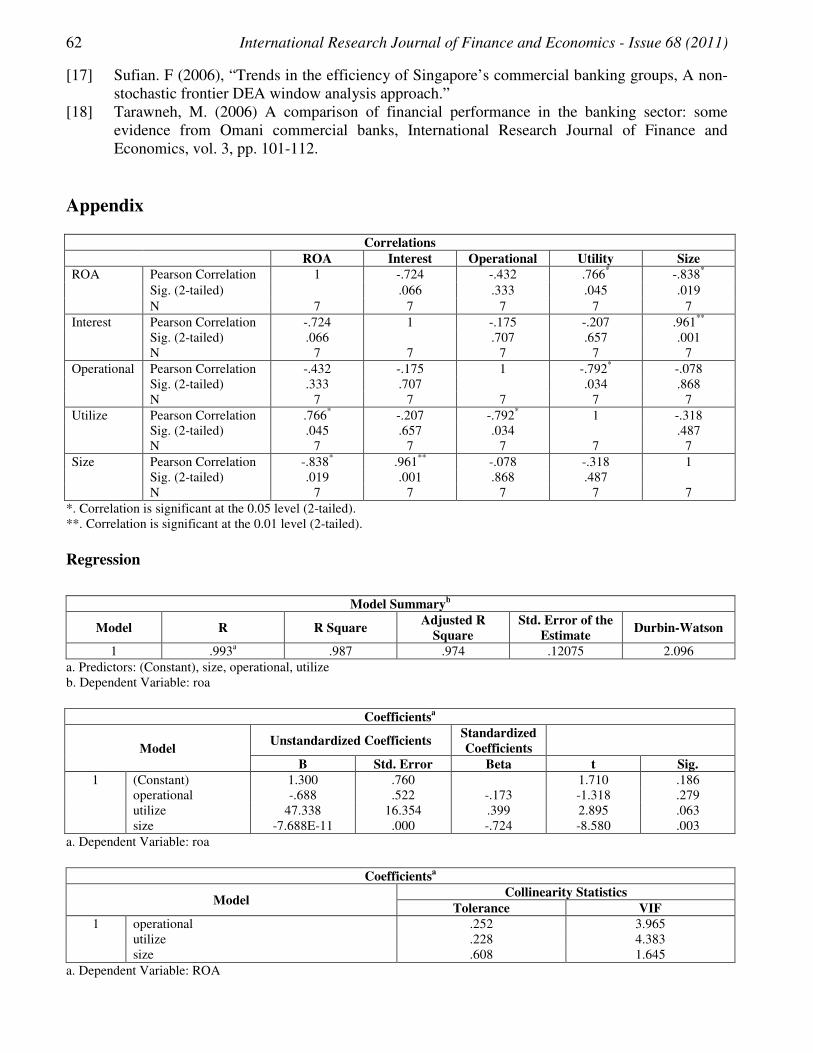
It was found that, there is a positive correlation relationships among the financial performance
measured by ROA, and interest income size as dependent variable, and the independent variables
(operational efficiency, asset management- utility, bank size ).
The results of correlations indicate that there is a high negative correlation relationship between
ROA and bank size ( asset size), Pearson Correlation is equal to -0.838 at significant level 0.019 which
indicate that there is an impact of asset size as independent variable on ROA as dependent variable (see
appendix). It is also clear from Pearson Correlation test that there is a positive correlation relationship
between utility (asset management) as independent variable and ROA as dependent variable. Pearson
correlation is equal to 0.766 at significant level 0.045 which is less than 0.05 which indicate that there
is effect of utility ( asset management) on ROA. As well as there exist a negative correlation
relationship between operational efficiency as independent variable and ROA as dependent variable.
Pearson correlation is equal to -0.432 at significant level 0.333 which is greater than 0.05, therefore,
there is a negative relationship between operational efficiency and ROA.
It is also clear from the above table that, there is no effect of operational efficiency and utility
(asset management) as independent variable on interest income size as dependent variable. Pearson
correlation equal to -0.175 and -0.207 at significant level 0.707 and 0.657 respectively which is greater
than 0.05. In addition to that, there exist a strong positive correlation relationship between bank size
(asset size) as independent variable and interest income as dependent variable. Pearson correlation is
equal to 0.961 at significant level 0.001 which is less than 0.05 which indicate that there is a strong
correlation between bank size ( asset size) and interest income.
It was also found in the second hypothesis by using the statistical analysis of variance
(ANOVA) that “ there exist an impact of operational efficiency, asset management, and bank size on
financial performance of the selected commercial banks in Jordan. The testing rule is to accept the
hypothesis if the calculated F.Sig less than 0.05. It is clear from tables (10) and (11) that values of
F.Sig are 0.003 and 0.028 which are less than 0.05 level. Therefore, the second hypothesis was
accepted.
Table 10: (ANOVA) The Impact of Independent Variables on Financial Performance Measured by ROA
Model Sum of Squares df Mean Square F Sig.
1 Regression 3.321 3 1.107 75.926 .003a
Residual .044 3 .015
Total 3.365 6
a. Predictors: (Constant), size, operational, utility
b. Dependent Variable: ROA
60 International Research Journal of Finance and Economics - Issue 68 (2011)
Multiple Regression was used to test above Hypothesis and it was found that calculated F value
= 75.926 is significant at 0.01 level with high correlation and r2.
Also D.W. test was used to test the Autocorrelation and it was found that the value is around 2
which mean that there is no autocorrelation. Whereas VIF test was used to test the Multicolleniarity
and it was found that the values is less than 5, which means that there is no Multicolleniarity.
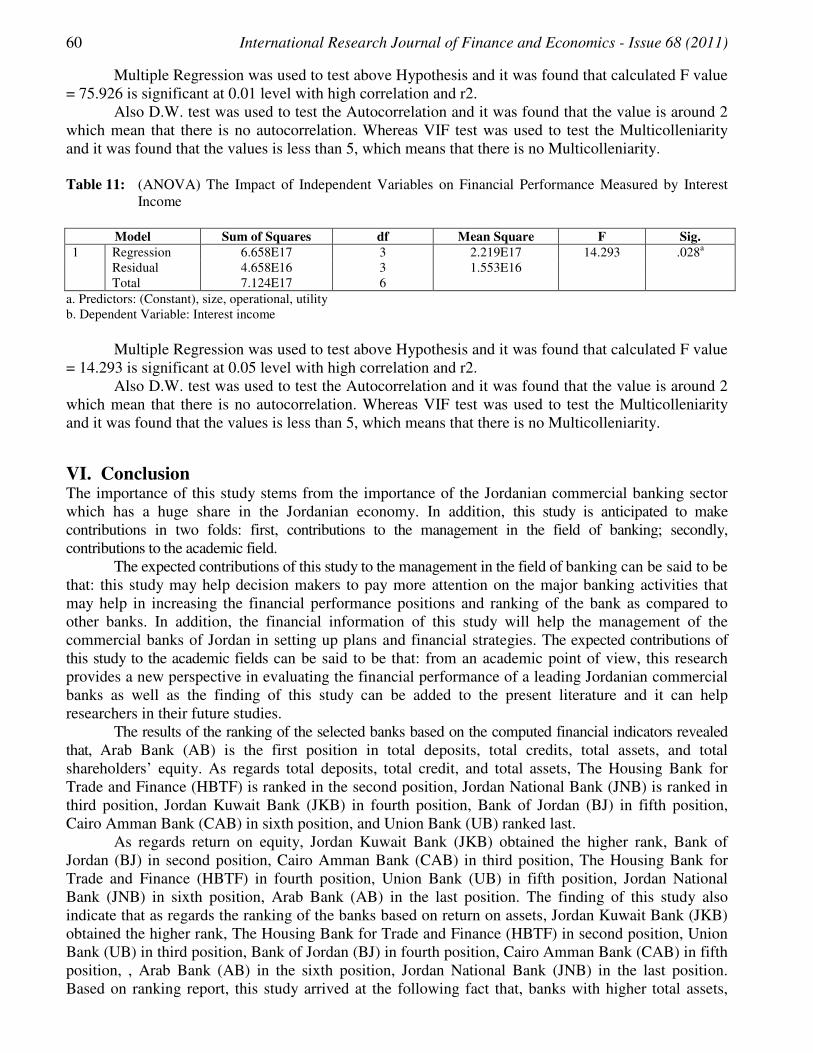
Table 11: (ANOVA) The Impact of Independent Variables on Financial Performance Measured by Interest
Income
Model Sum of Squares df Mean Square F Sig.
1 Regression 6.658E17 3 2.219E17 14.293 .028a
Residual 4.658E16 3 1.553E16
Total 7.124E17 6
a. Predictors: (Constant), size, operational, utility
b. Dependent Variable: Interest income
Multiple Regression was used to test above Hypothesis and it was found that calculated F value
= 14.293 is significant at 0.05 level with high correlation and r2.
Also D.W. test was used to test the Autocorrelation and it was found that the value is around 2
which mean that there is no autocorrelation. Whereas VIF test was used to test the Multicolleniarity
and it was found that the values is less than 5, which means that there is no Multicolleniarity.
VI. Conclusion The importance of this study stems from the importance of the Jordanian commercial banking sector
which has a huge share in the Jordanian economy. In addition, this study is anticipated to make
contributions in two folds: first, contributions to the management in the field of banking; secondly,
contributions to the academic field.
The expected contributions of this study to the management in the field of banking can be said to be
that: this study may help decision makers to pay more attention on the major banking activities that
may help in increasing the financial performance positions and ranking of the bank as compared to
other banks. In addition, the financial information of this study will help the management of the
commercial banks of Jordan in setting up plans and financial strategies. The expected contributions of
this study to the academic fields can be said to be that: from an academic point of view, this research
provides a new perspective in evaluating the financial performance of a leading Jordanian commercial
banks as well as the finding of this study can be added to the present literature and it can help
researchers in their future studies.
The results of the ranking of the selected banks based on the computed financial indicators revealed
that, Arab Bank (AB) is the first position in total deposits, total credits, total assets, and total
shareholders’ equity. As regards total deposits, total credit, and total assets, The Housing Bank for
Trade and Finance (HBTF) is ranked in the second position, Jordan National Bank (JNB) is ranked in
third position, Jordan Kuwait Bank (JKB) in fourth position, Bank of Jordan (BJ) in fifth position,
Cairo Amman Bank (CAB) in sixth position, and Union Bank (UB) ranked last.
As regards return on equity, Jordan Kuwait Bank (JKB) obtained the higher rank, Bank of
Jordan (BJ) in second position, Cairo Amman Bank (CAB) in third position, The Housing Bank for
Trade and Finance (HBTF) in fourth position, Union Bank (UB) in fifth position, Jordan National
Bank (JNB) in sixth position, Arab Bank (AB) in the last position. The finding of this study also
indicate that as regards the ranking of the banks based on return on assets, Jordan Kuwait Bank (JKB)
obtained the higher rank, The Housing Bank for Trade and Finance (HBTF) in second position, Union
Bank (UB) in third position, Bank of Jordan (BJ) in fourth position, Cairo Amman Bank (CAB) in fifth
position, , Arab Bank (AB) in the sixth position, Jordan National Bank (JNB) in the last position.
Based on ranking report, this study arrived at the following fact that, banks with higher total assets,
International Research Journal of Finance and Economics - Issue 68 (2011) 61
credits, deposits, or shareholders equity does not always mean that it gain better profitable
performance.
The present study examined predictors to find out it is impact on the financial performance of
selected Jordanian commercial banks. The regression analysis results indicate that there exist a
significant impact of operational efficiency, asset management, and bank size on financial
performance. This result is confirmed with the correlation analysis between variables of the study
which indicated that there is a positive correlation relationships among the variables.
This study can be a source of help to bank managers to improve their financial performance and
formulate policies that will promote effective financial system. The study also recommend measures
that could be adopted by banks to ensure soundness in their operations. Jordanian banks should pursue
sound monetary and fiscal policies that will stimulate economic growth and development as banks
perform well in a sound and stable economic environment.
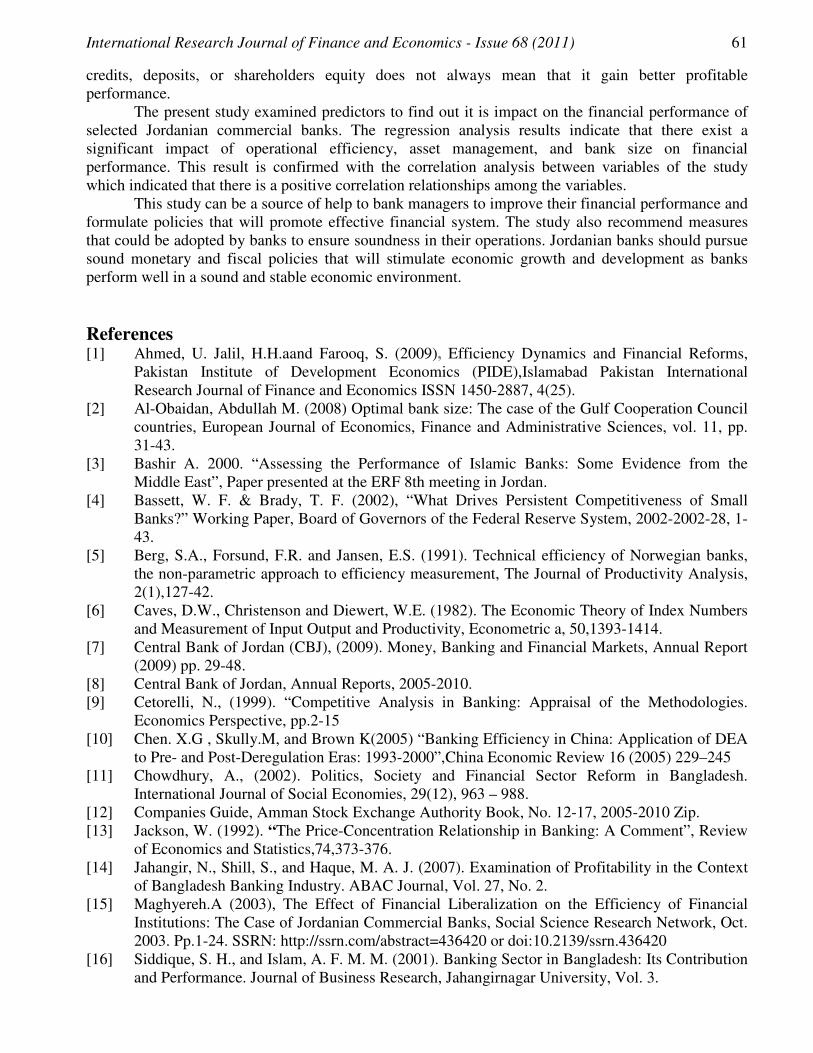
References [1] Ahmed, U. Jalil, H.H.aand Farooq, S. (2009), Efficiency Dynamics and Financial Reforms,
Pakistan Institute of Development Economics (PIDE),Islamabad Pakistan International
Research Journal of Finance and Economics ISSN 1450-2887, 4(25).
[2] Al-Obaidan, Abdullah M. (2008) Optimal bank size: The case of the Gulf Cooperation Council
countries, European Journal of Economics, Finance and Administrative Sciences, vol. 11, pp.
31-43.
[3] Bashir A. 2000. “Assessing the Performance of Islamic Banks: Some Evidence from the
Middle East”, Paper presented at the ERF 8th meeting in Jordan.
[4] Bassett, W. F. & Brady, T. F. (2002), “What Drives Persistent Competitiveness of Small
Banks?” Working Paper, Board of Governors of the Federal Reserve System, 2002-2002-28, 1-
43.
[5] Berg, S.A., Forsund, F.R. and Jansen, E.S. (1991). Technical efficiency of Norwegian banks,
the non-parametric approach to efficiency measurement, The Journal of Productivity Analysis,
2(1),127-42.
[6] Caves, D.W., Christenson and Diewert, W.E. (1982). The Economic Theory of Index Numbers
and Measurement of Input Output and Productivity, Econometric a, 50,1393-1414.
[7] Central Bank of Jordan (CBJ), (2009). Money, Banking and Financial Markets, Annual Report
(2009) pp. 29-48.
[8] Central Bank of Jordan, Annual Reports, 2005-2010.
[9] Cetorelli, N., (1999). “Competitive Analysis in Banking: Appraisal of the Methodologies.
Economics Perspective, pp.2-15
[10] Chen. X.G , Skully.M, and Brown K(2005) “Banking Efficiency in China: Application of DEA
to Pre- and Post-Deregulation Eras: 1993-2000”,China Economic Review 16 (2005) 229–245
[11] Chowdhury, A., (2002). Politics, Society and Financial Sector Reform in Bangladesh.
International Journal of Social Economies, 29(12), 963 – 988.
[12] Companies Guide, Amman Stock Exchange Authority Book, No. 12-17, 2005-2010 Zip.
[13] Jackson, W. (1992). “The Price-Concentration Relationship in Banking: A Comment”, Review
of Economics and Statistics,74,373-376.
[14] Jahangir, N., Shill, S., and Haque, M. A. J. (2007). Examination of Profitability in the Context
of Bangladesh Banking Industry. ABAC Journal, Vol. 27, No. 2.
[15] Maghyereh.A (2003), The Effect of Financial Liberalization on the Efficiency of Financial
Institutions: The Case of Jordanian Commercial Banks, Social Science Research Network, Oct.
2003. Pp.1-24. SSRN: http://ssrn.com/abstract=436420 or doi:10.2139/ssrn.436420
[16] Siddique, S. H., and Islam, A. F. M. M. (2001). Banking Sector in Bangladesh: Its Contribution
and Performance. Journal of Business Research, Jahangirnagar University, Vol. 3.
62 International Research Journal of Finance and Economics - Issue 68 (2011)
[17] Sufian. F (2006), “Trends in the efficiency of Singapore’s commercial banking groups, A non-
stochastic frontier DEA window analysis approach.”
[18] Tarawneh, M. (2006) A comparison of financial performance in the banking sector: some
evidence from Omani commercial banks, International Research Journal of Finance and
Economics, vol. 3, pp. 101-112.
Appendix
Correlations
ROA Interest Operational Utility Size
ROA Pearson Correlation 1 -.724 -.432 .766* -.838
*
Sig. (2-tailed) .066 .333 .045 .019
N 7 7 7 7 7
Interest Pearson Correlation -.724 1 -.175 -.207 .961**
Sig. (2-tailed) .066 .707 .657 .001
N 7 7 7 7 7
Operational Pearson Correlation -.432 -.175 1 -.792* -.078
Sig. (2-tailed) .333 .707 .034 .868
N 7 7 7 7 7
Utilize Pearson Correlation .766* -.207 -.792
* 1 -.318
Sig. (2-tailed) .045 .657 .034 .487
N 7 7 7 7 7
Size Pearson Correlation -.838* .961
** -.078 -.318 1
Sig. (2-tailed) .019 .001 .868 .487
N 7 7 7 7 7
*. Correlation is significant at the 0.05 level (2-tailed).
**. Correlation is significant at the 0.01 level (2-tailed).
Regression
Model Summary
b
Model R R Square Adjusted R
Square
Std. Error of the
Estimate Durbin-Watson
1 .993a .987 .974 .12075 2.096
a. Predictors: (Constant), size, operational, utilize
b. Dependent Variable: roa
Coefficients
a
Model Unstandardized Coefficients
Standardized
Coefficients
B Std. Error Beta t Sig.
1 (Constant) 1.300 .760 1.710 .186
operational -.688 .522 -.173 -1.318 .279
utilize 47.338 16.354 .399 2.895 .063
size -7.688E-11 .000 -.724 -8.580 .003
a. Dependent Variable: roa
Coefficients
a
Model Collinearity Statistics
Tolerance VIF
1 operational .252 3.965
utilize .228 4.383
size .608 1.645
a. Dependent Variable: ROA

International Research Journal of Finance and Economics - Issue 68 (2011) 63
Model Summaryb
Model R R Square Adjusted R Square Std. Error of the Estimate Durbin-Watson
1 .967a .935 .869 1.24611E8 1.852
a. Predictors: (Constant), size, operational, utilize
b. Dependent Variable: Interest
Coefficients
a
Model Unstandardized Coefficients
Standardized
Coefficients
B Std. Error Beta t Sig.
1 (Constant) 1.866E7 7.844E8 .024 .983
operational -7.719E7 5.386E8 -.042 -.143 .895
utilize 3.906E9 1.688E10 .072 .231 .832
size .048 .009 .980 5.178 .014
a. Dependent Variable: interest
Coefficients
a
Model Collinearity Statistics
Tolerance VIF
1 operational .252 3.965
utilize .228 4.383
size .608 1.645
a. Dependent Variable: interest


