
Irish Green Building Council- A Greenest City Strategy
86
Greenest City 24.05.2016
-
Upload
irish-green-building-council -
Category
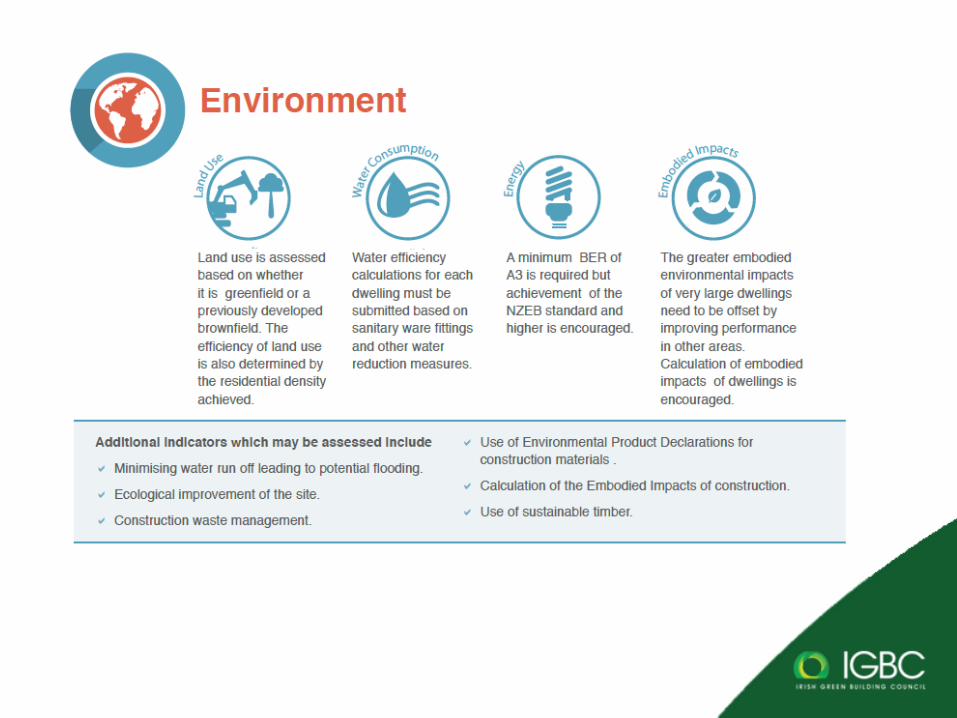
Environment
-
view
169 -
download
1
Transcript of Irish Green Building Council- A Greenest City Strategy
Greenest City
24.05.2016
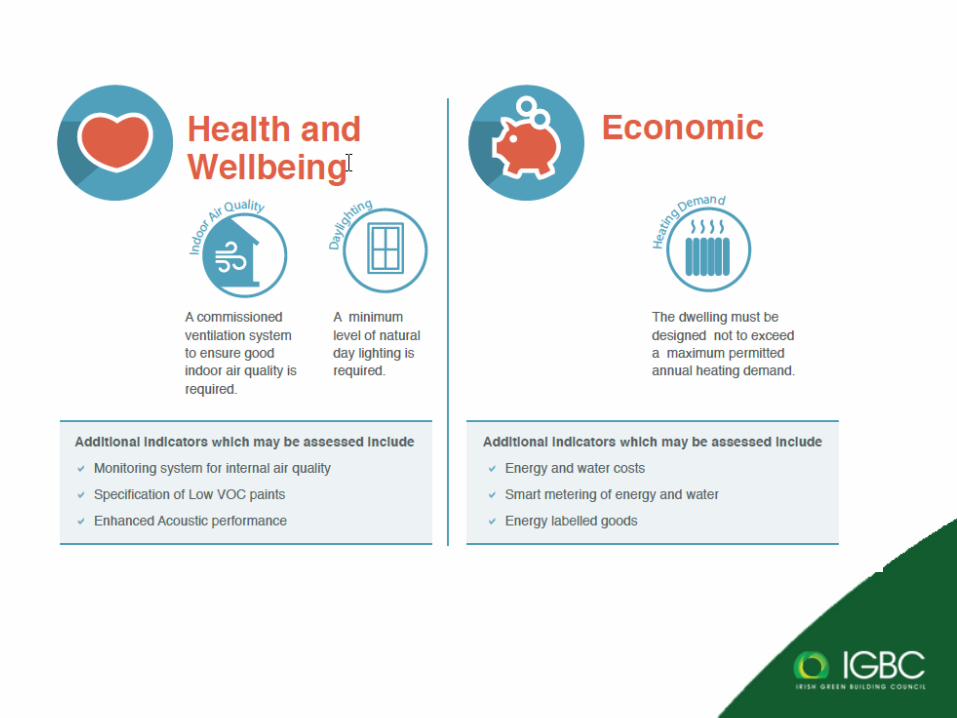
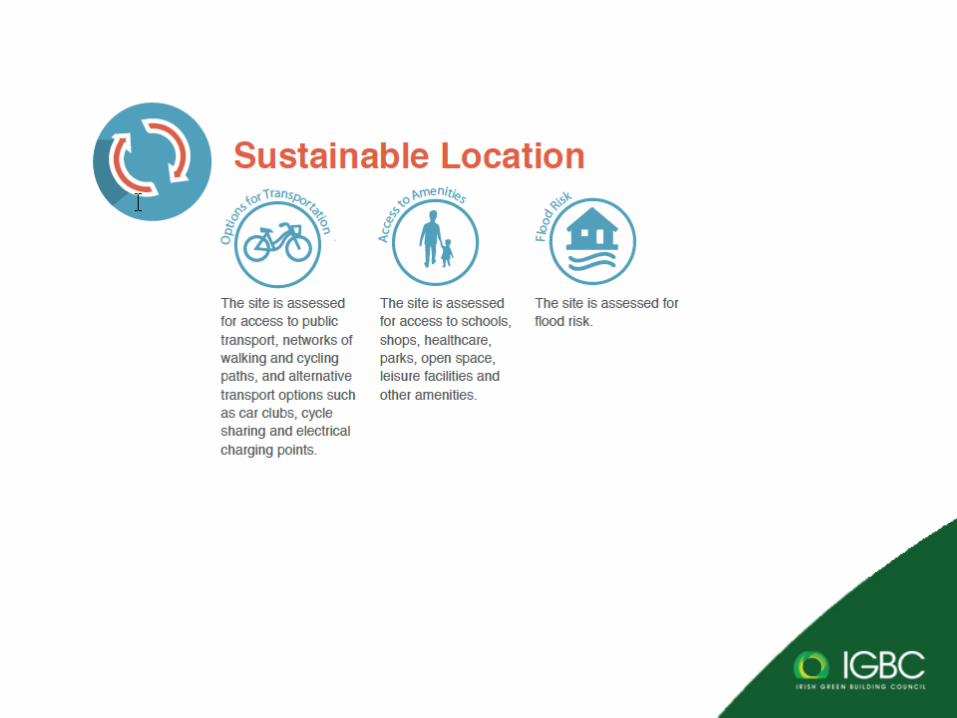
National scheme operator
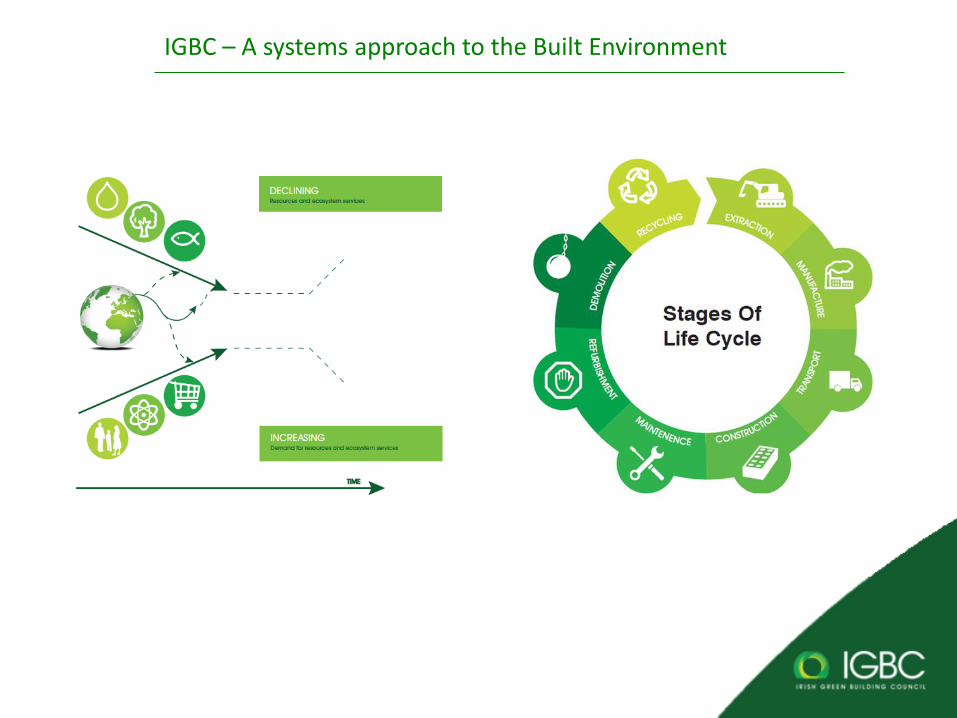
IGBC – A systems approach to the Built Environment
National scheme operator
IGBC – A systems approach to the Built Environment
National scheme operator
National scheme operator
National scheme operator

National scheme operator
National scheme operator

National scheme operator
National scheme operator
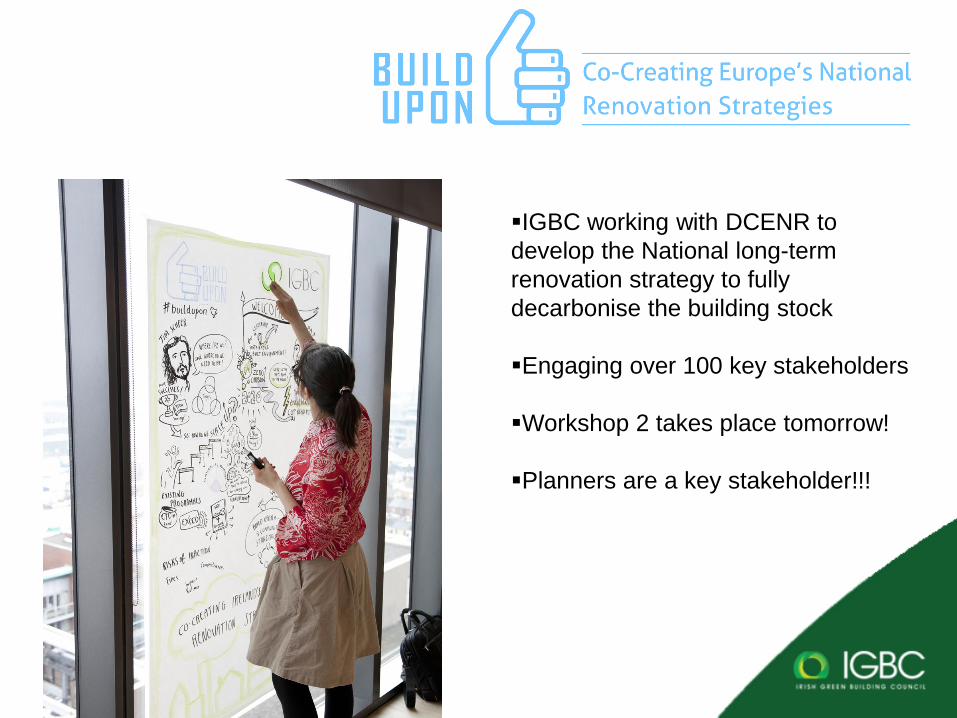
IGBC working with DCENR to
develop the National long-term
renovation strategy to fully
decarbonise the building stock
Engaging over 100 key stakeholders
Workshop 2 takes place tomorrow!
Planners are a key stakeholder!!!

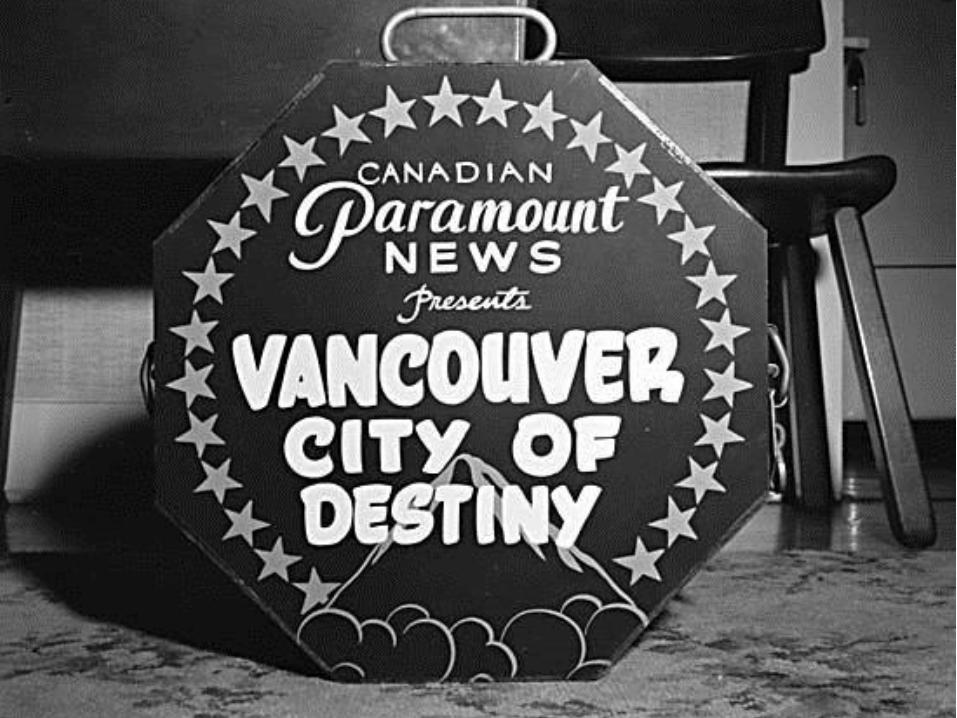
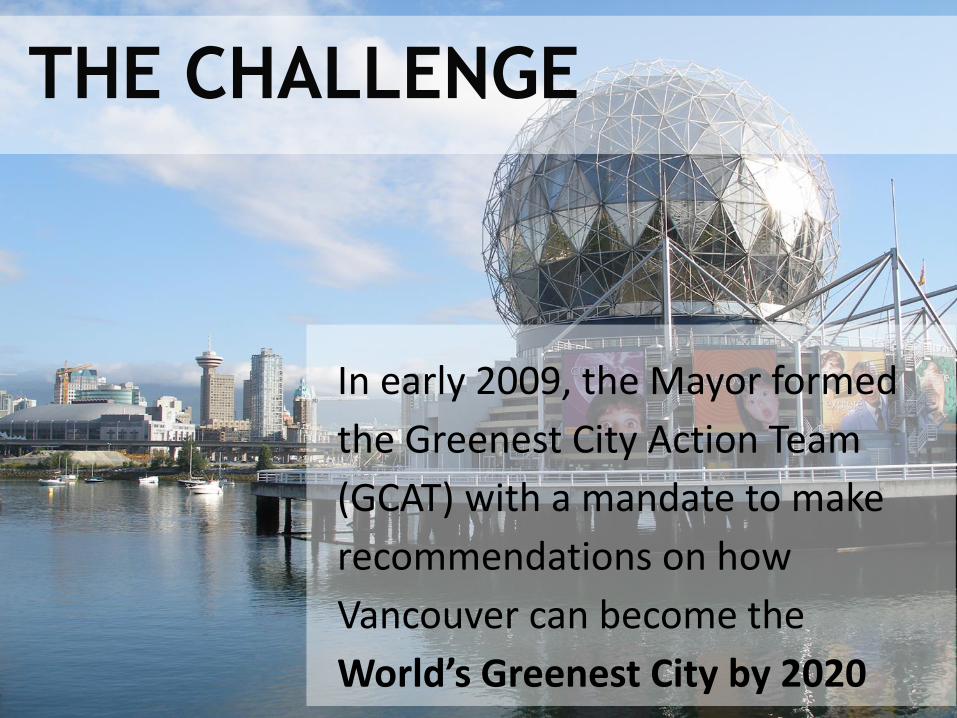
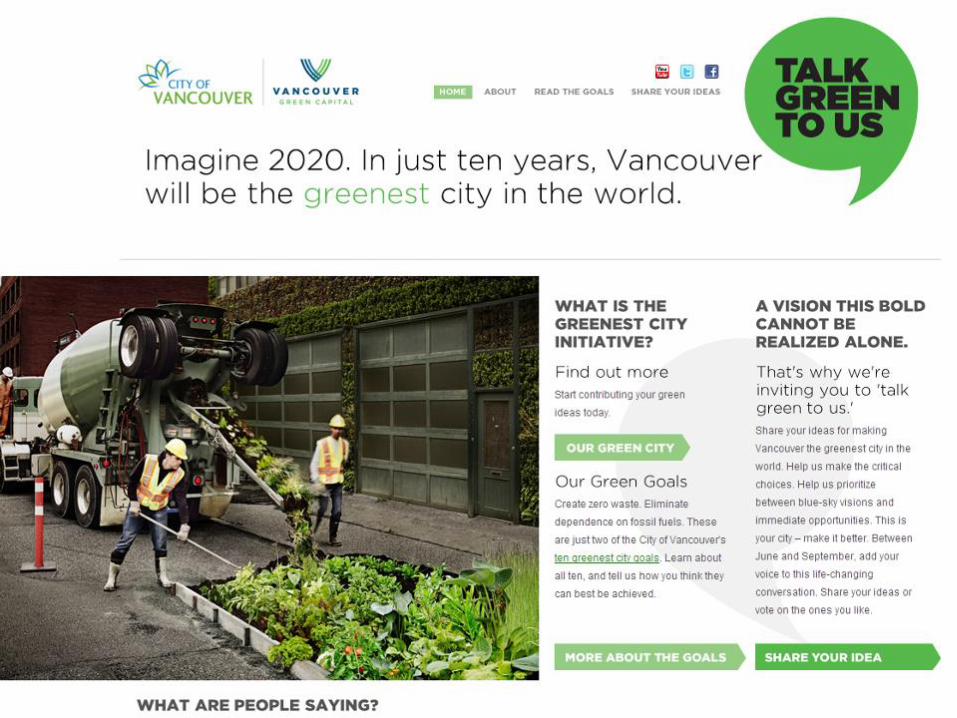
In early 2009, the Mayor formed
the Greenest City Action Team
(GCAT) with a mandate to make
recommendations on how
Vancouver can become the
World’s Greenest City by 2020
THE CHALLENGE
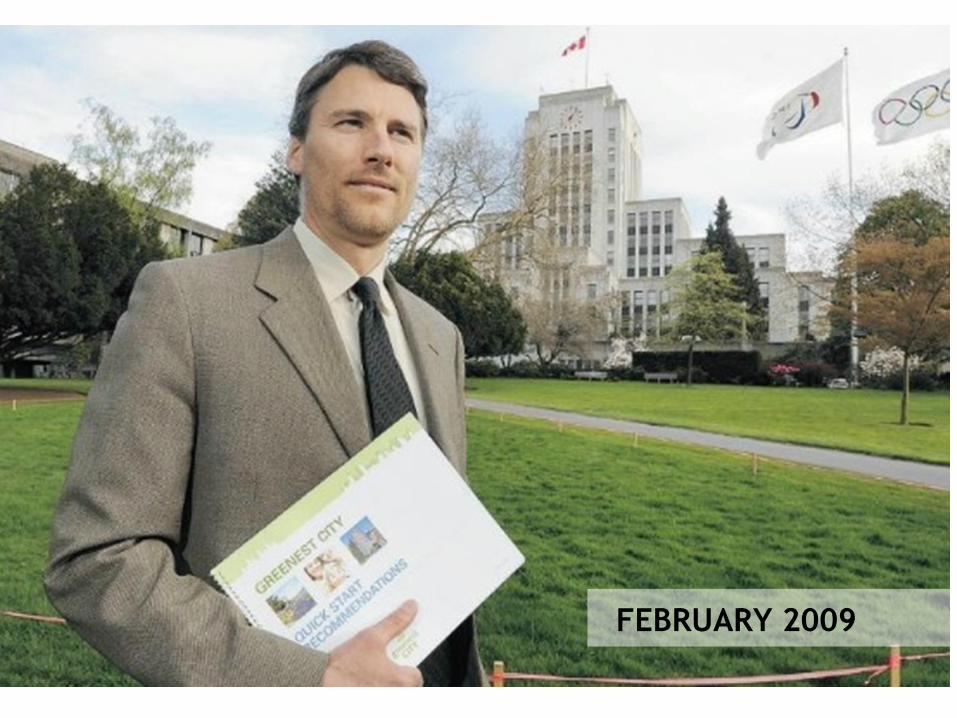
FEBRUARY 2009
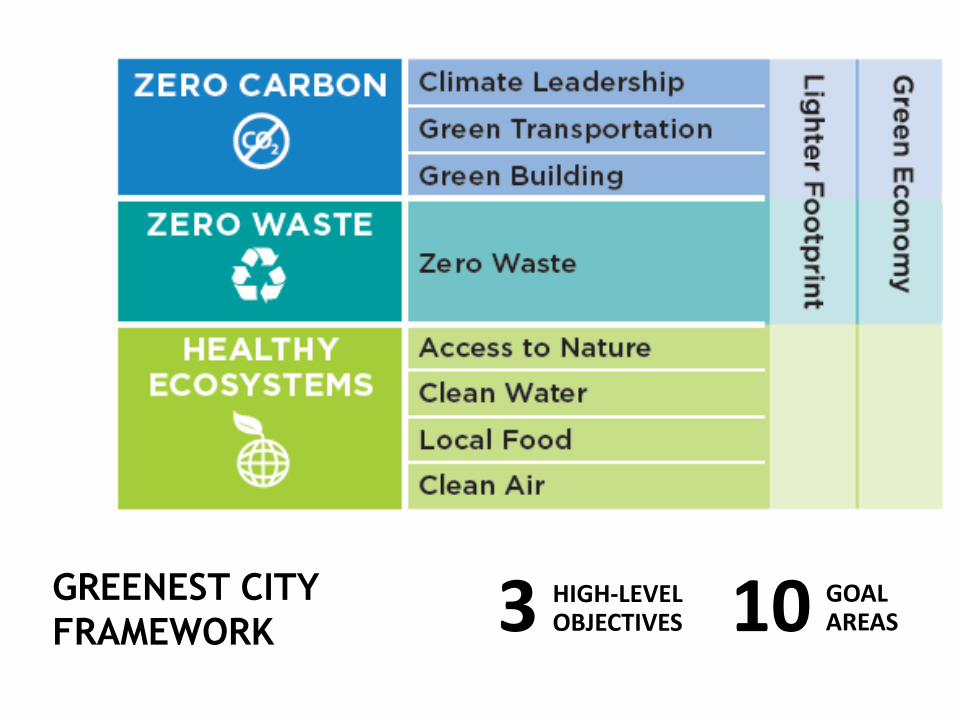
3 HIGH-LEVEL OBJECTIVES
GOAL AREAS10GREENEST CITY
FRAMEWORK
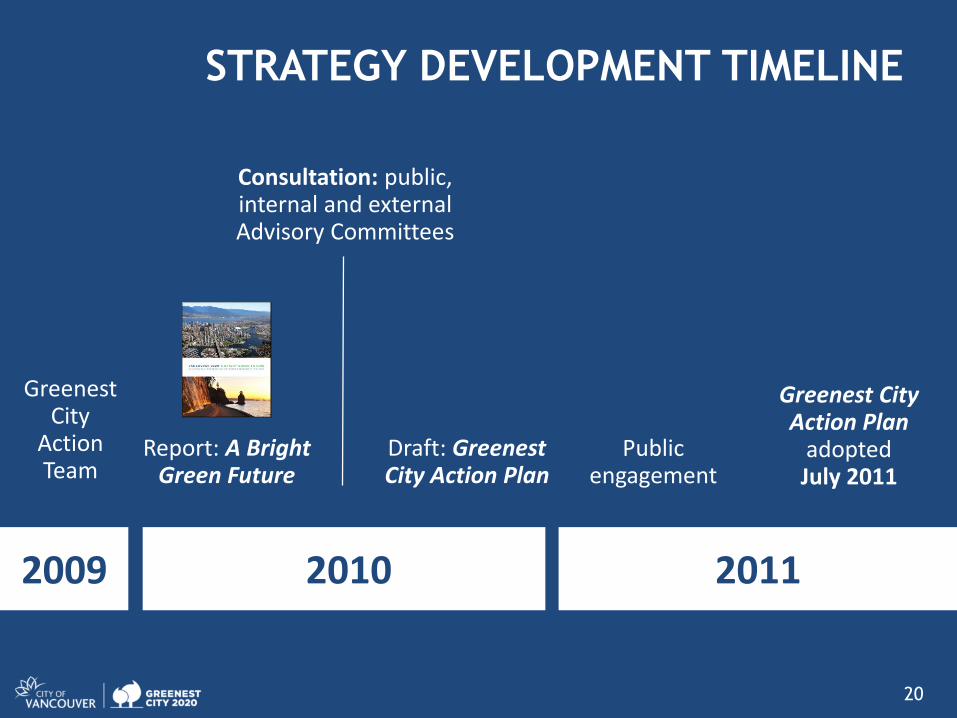
STRATEGY DEVELOPMENT TIMELINE
Report: A Bright Green Future
Greenest City
Action Team
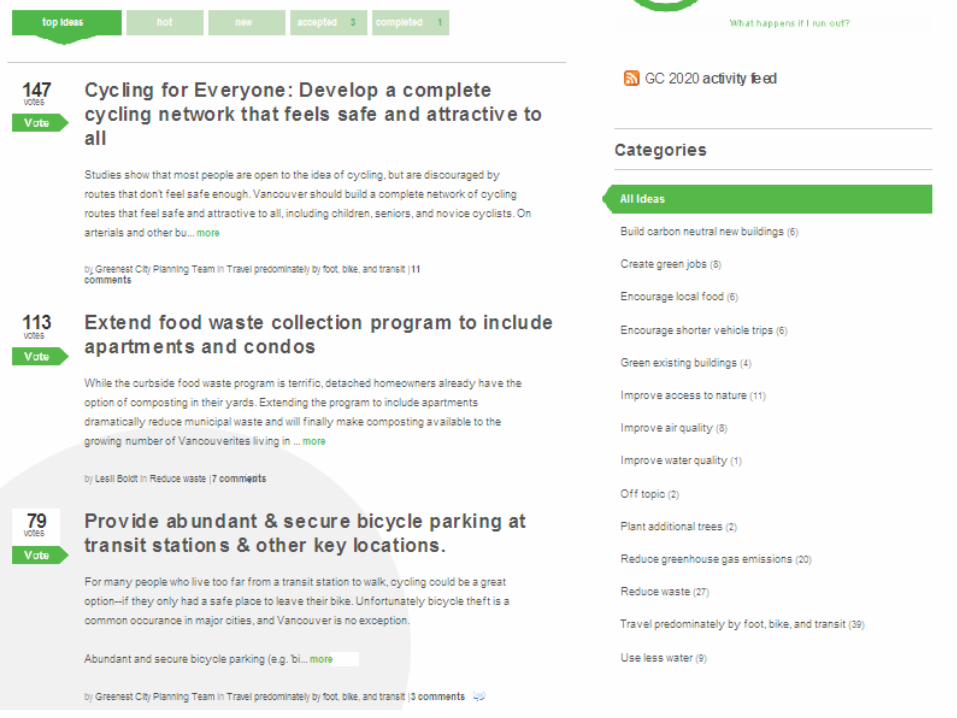
Public engagement
Greenest City Action Plan
adopted July 2011
Consultation: public, internal and external Advisory Committees
Draft: Greenest City Action Plan
2009 2010 2011
20
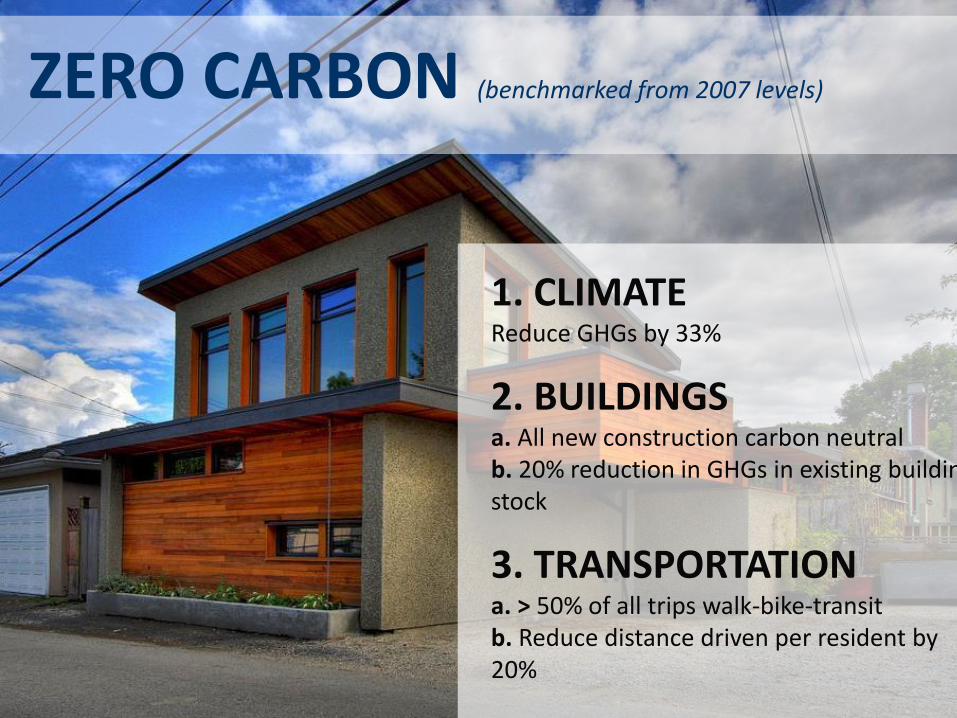
1. CLIMATEReduce GHGs by 33%
2. BUILDINGSa. All new construction carbon neutralb. 20% reduction in GHGs in existing building stock
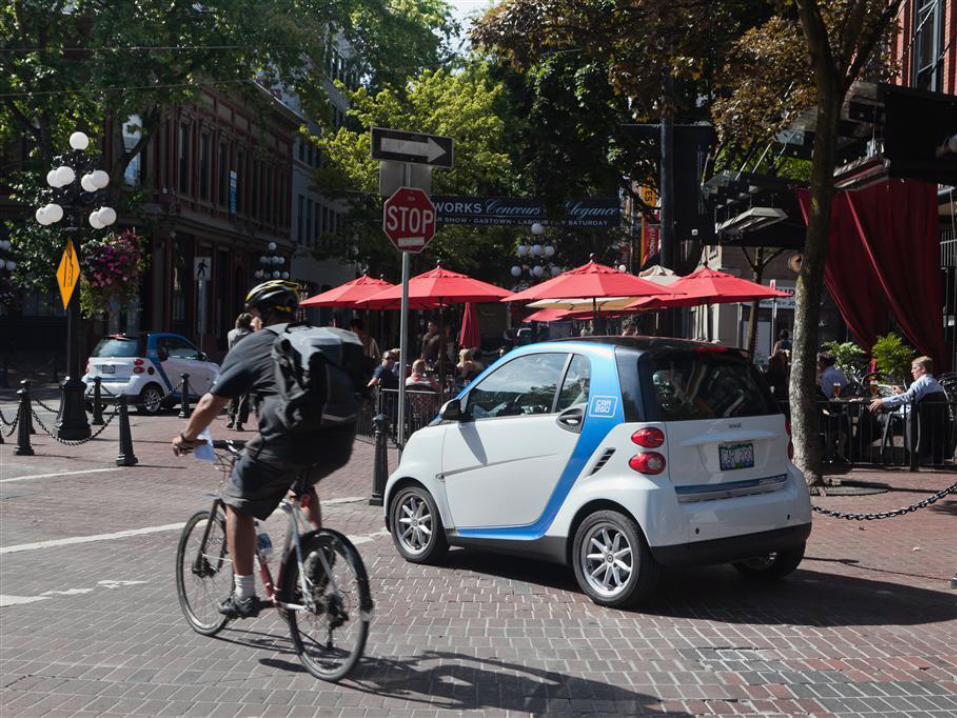
3. TRANSPORTATIONa. > 50% of all trips walk-bike-transitb. Reduce distance driven per resident by 20%
ZERO CARBON (benchmarked from 2007 levels)
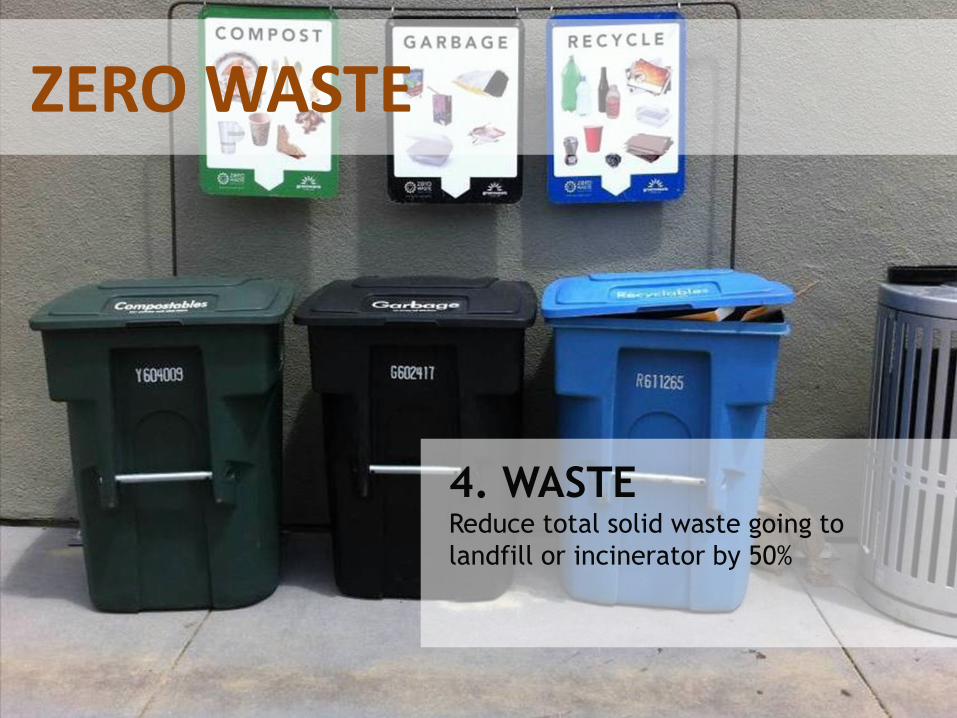
4. WASTEReduce total solid waste going to
landfill or incinerator by 50%
ZERO WASTE

5. ACCESS TO NATUREa. Every resident lives within a 5 minute
walk of a green or blue space
b. Plant 150,000 additional trees
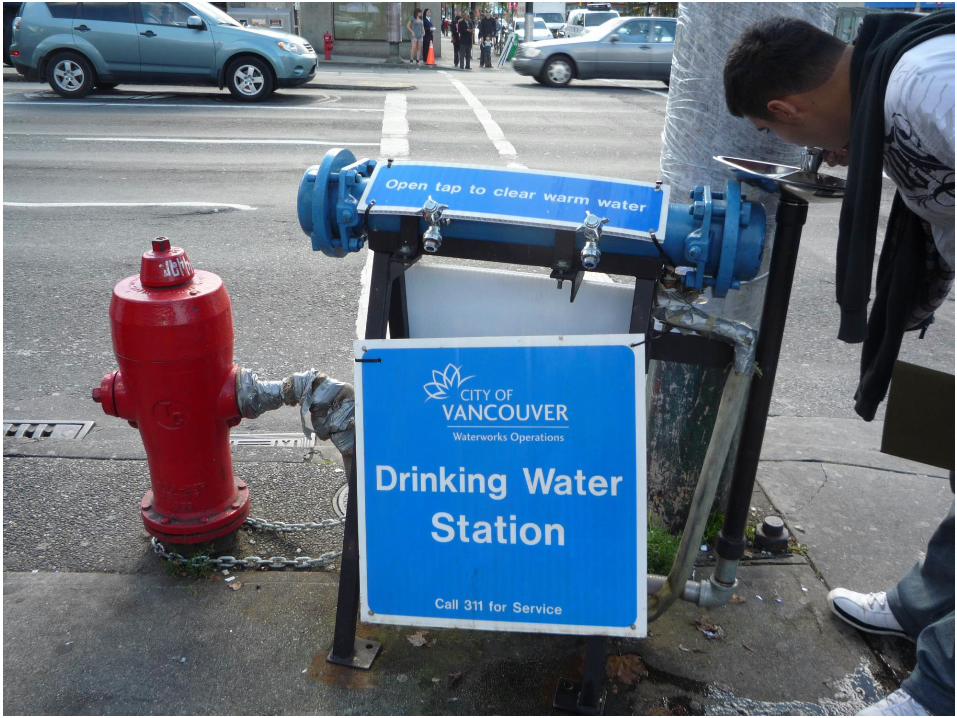
6. WATERReduce water consumption by 33% per capita
7. AIRMeet or beat the most stringent
international air quality standards
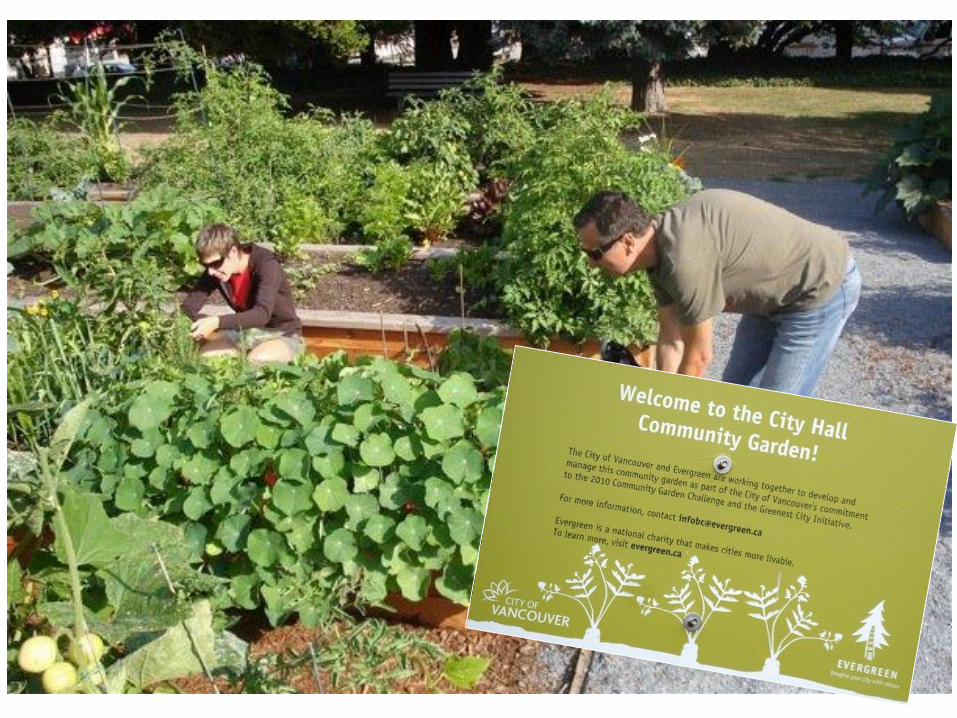
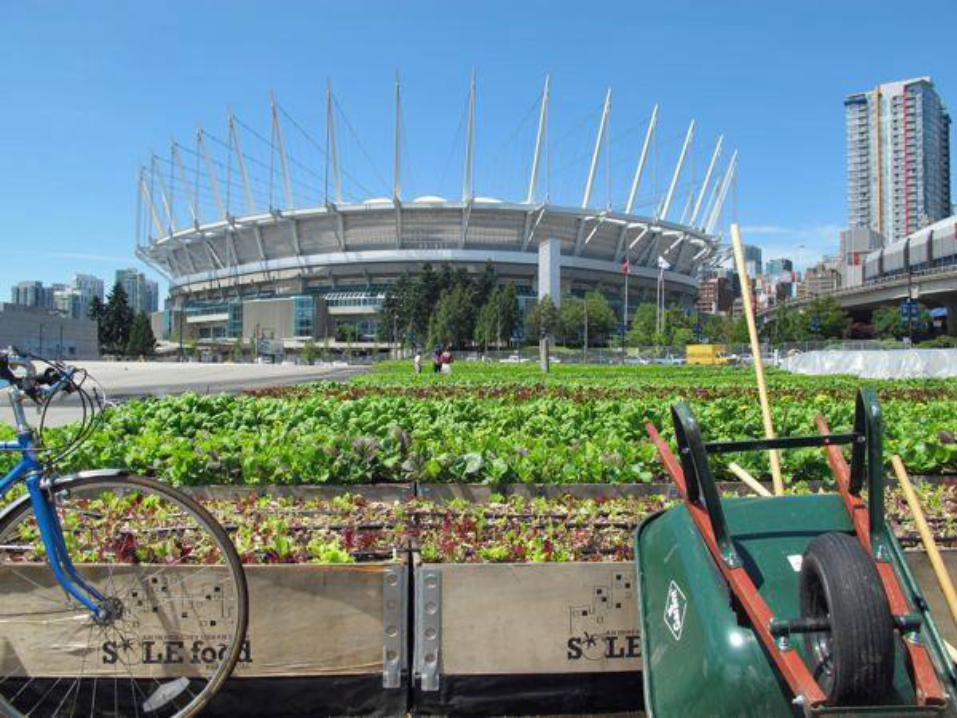
8. FOODIncrease neighbourhood food assets by a
minimum of 50% over 2010 levels.
HEALTHY ECOSYSTEMS
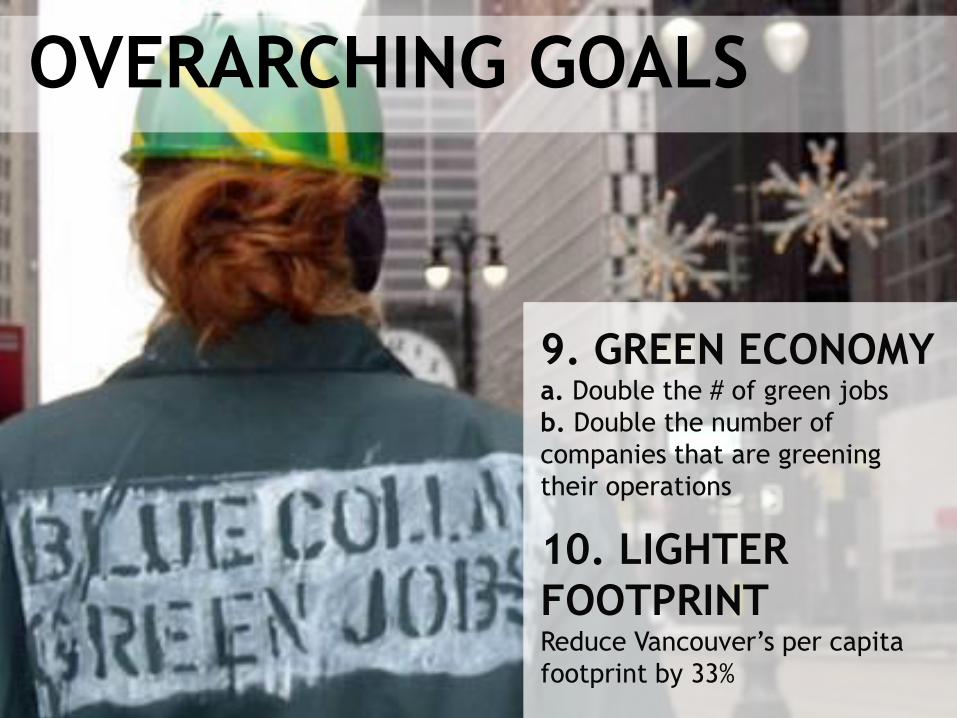
9. GREEN ECONOMYa. Double the # of green jobs
b. Double the number of
companies that are greening
their operations
10. LIGHTER
FOOTPRINTReduce Vancouver’s per capita
footprint by 33%
OVERARCHING GOALS
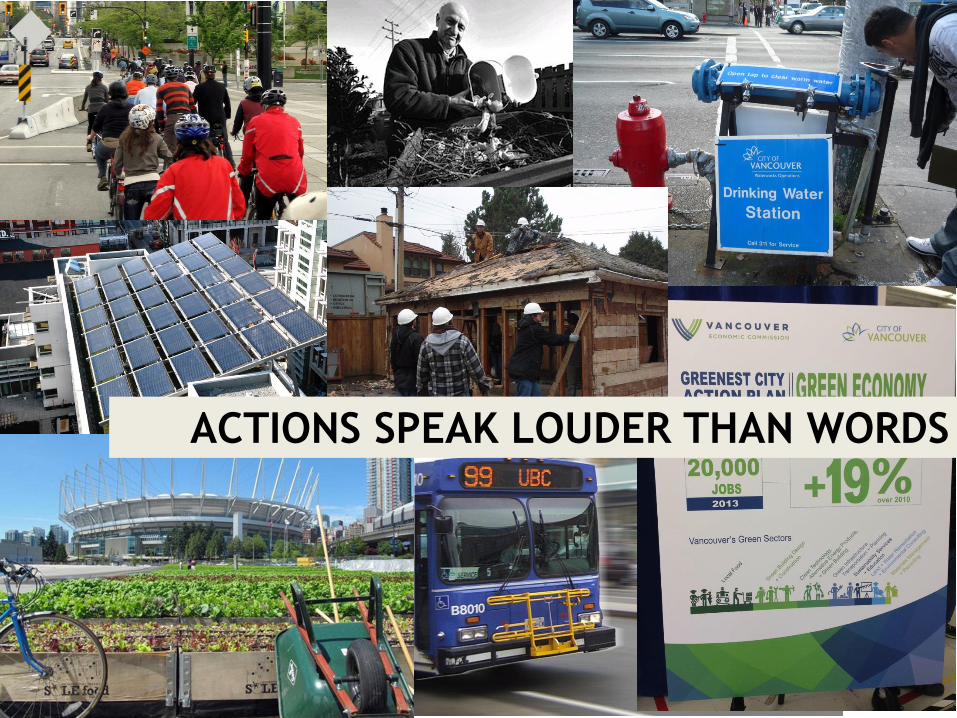
ACTIONS SPEAK LOUDER THAN WORDS

STRATEGY DEVELOPMENT TIMELINE
Report: A Bright Green Future
Greenest City
Action Team
Public engagement
Greenest City Action Plan
adopted July 2011
Consultation: public, internal and external Advisory Committees
Draft: Greenest City Action Plan
2009 2010 2011
26
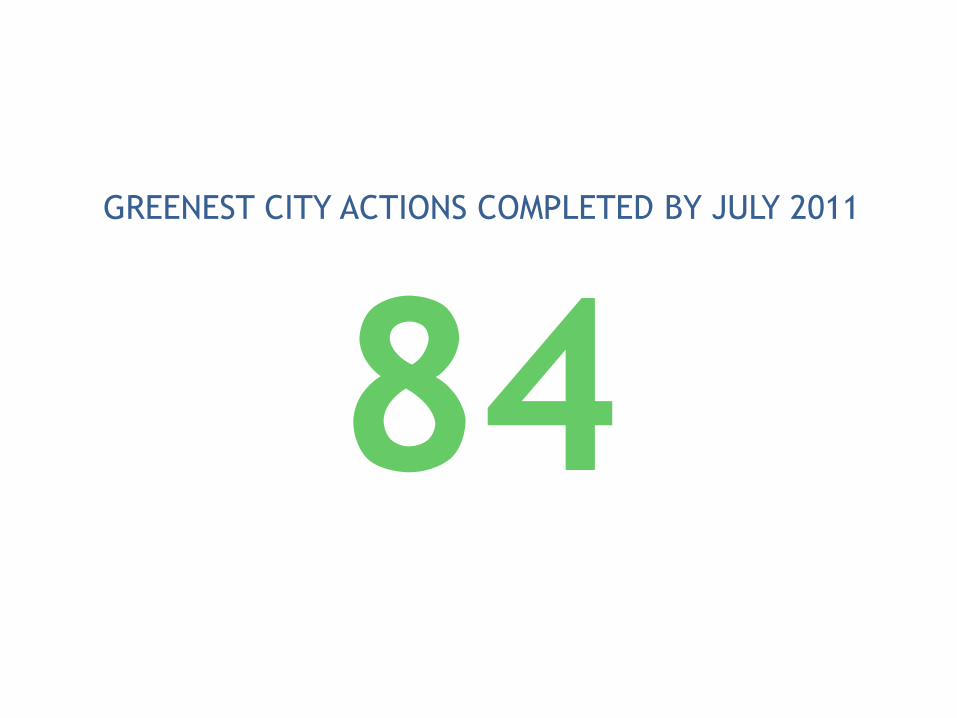
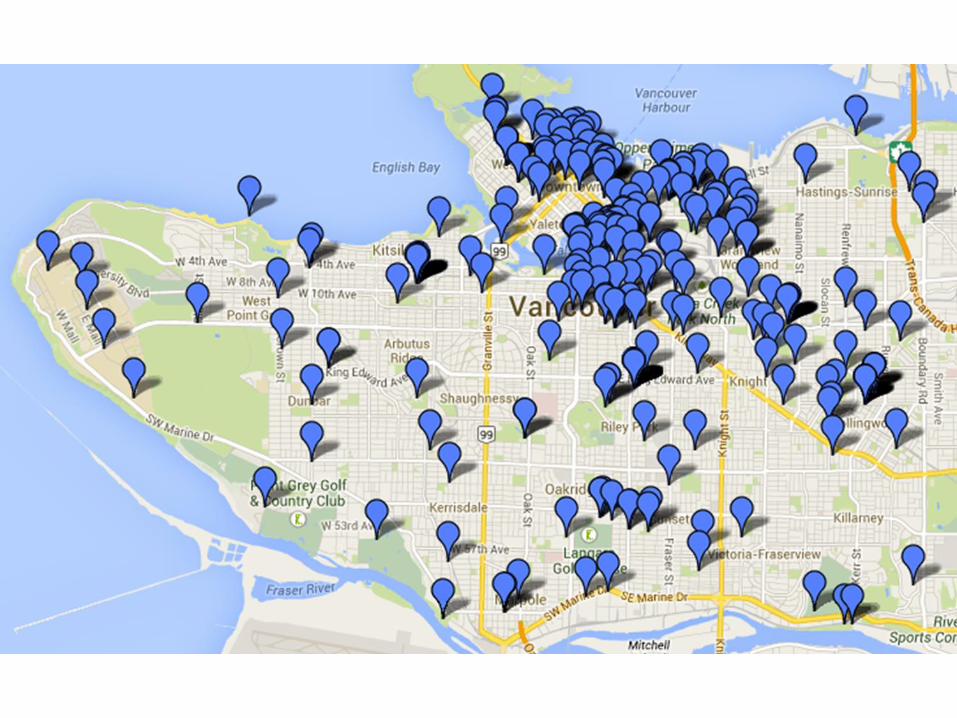
GREENEST CITY ACTIONS COMPLETED BY JULY 2011
84

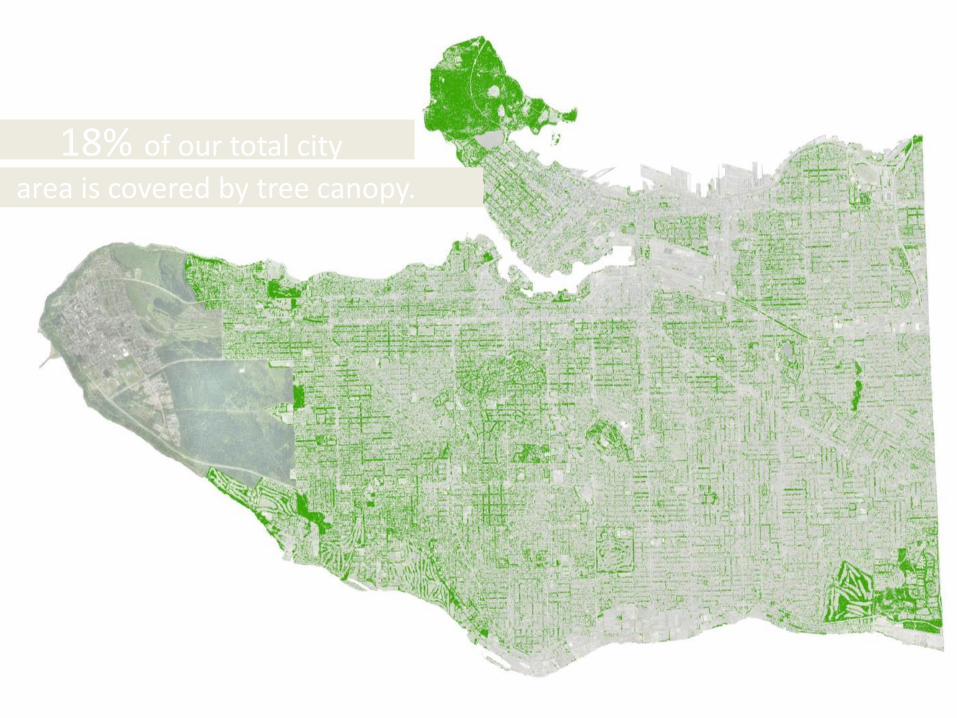
18% of our total city
area is covered by tree canopy.

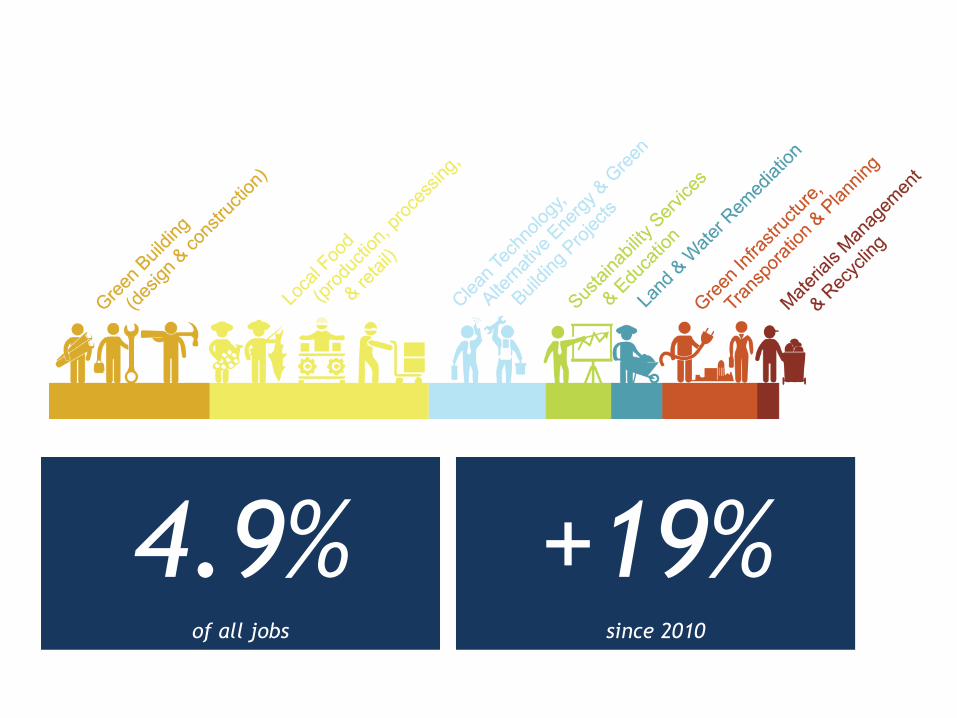
20,000 GREEN & LOCAL FOOD JOBS
4,480 5,987 3,187 1,701 1,378 2,603 593
4.9%of all jobs
+19%since 2010
43
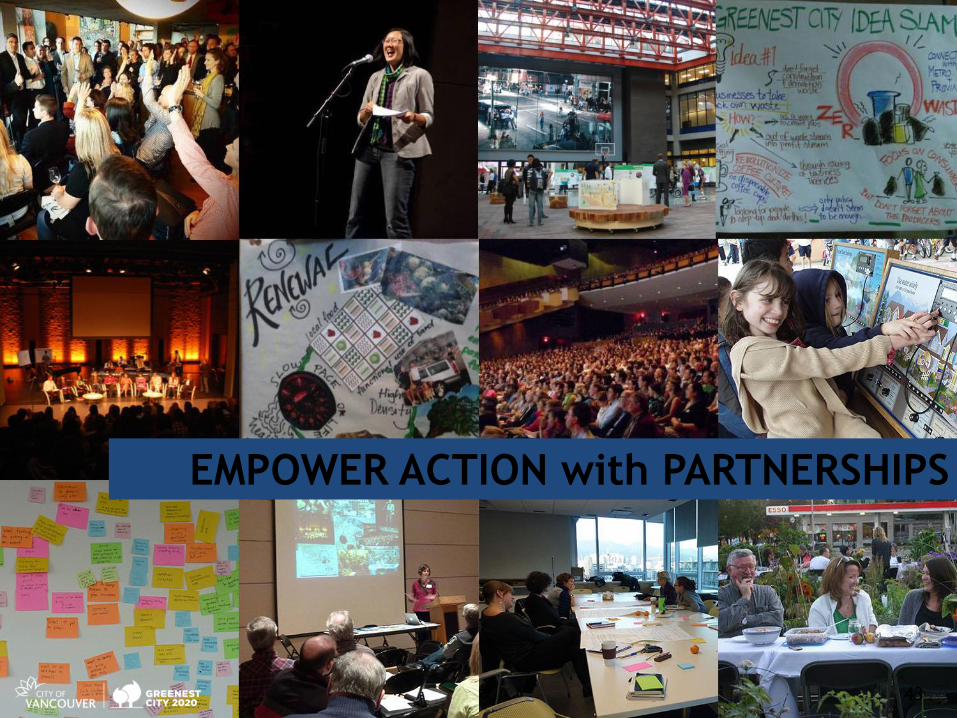
EMPOWER ACTION with PARTNERSHIPS
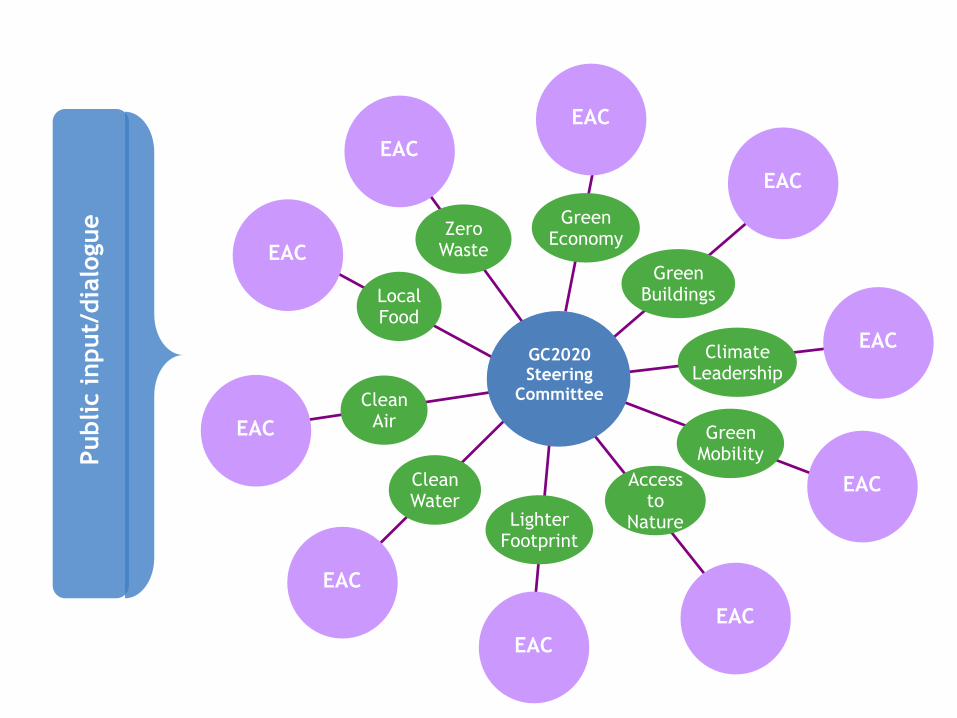
Zero Waste
Green Economy
Green Buildings
Climate Leadership
Green Mobility
Access to
NatureLighter Footprint
Clean Water
Clean Air
Local Food
Public i
nput/
dia
logue
EAC
EAC
EAC
EAC
EAC
EAC
EAC
EAC
EAC
EAC
GC2020 Steering
Committee
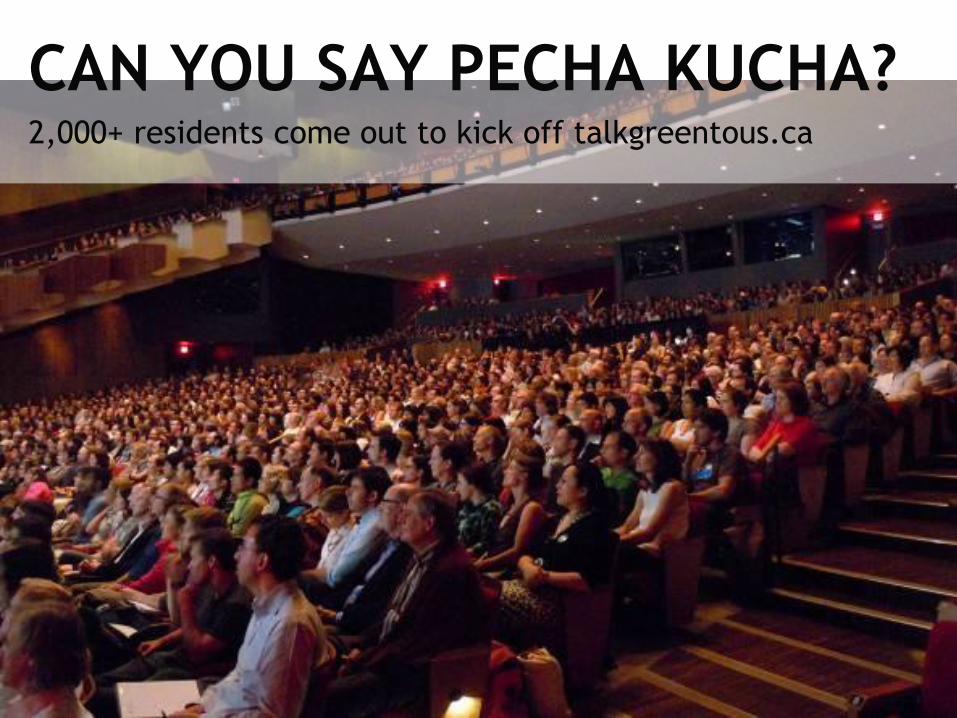
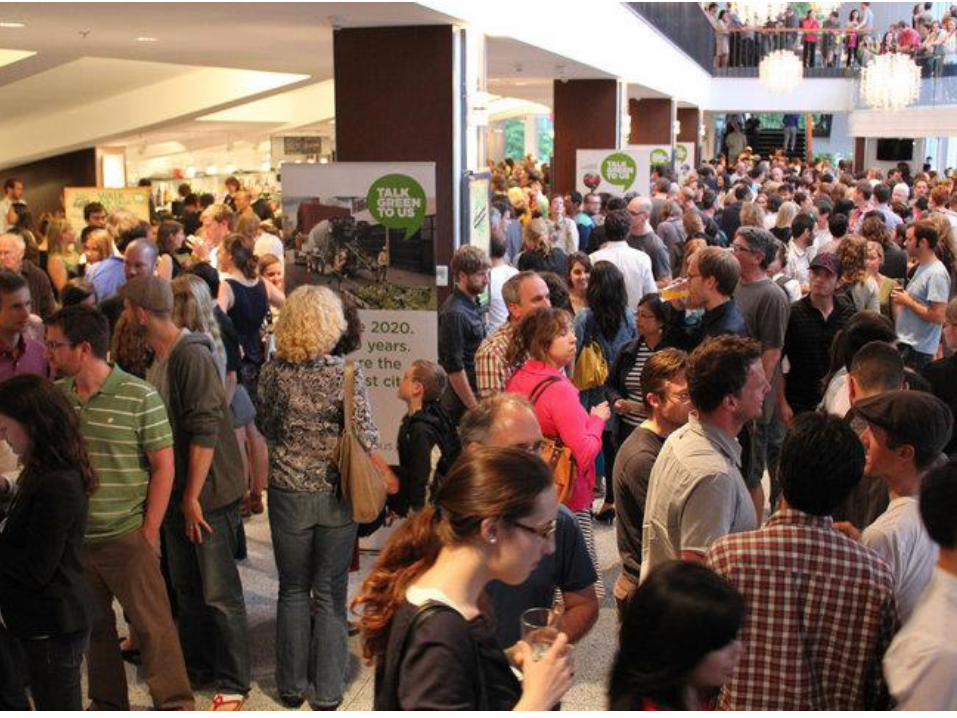
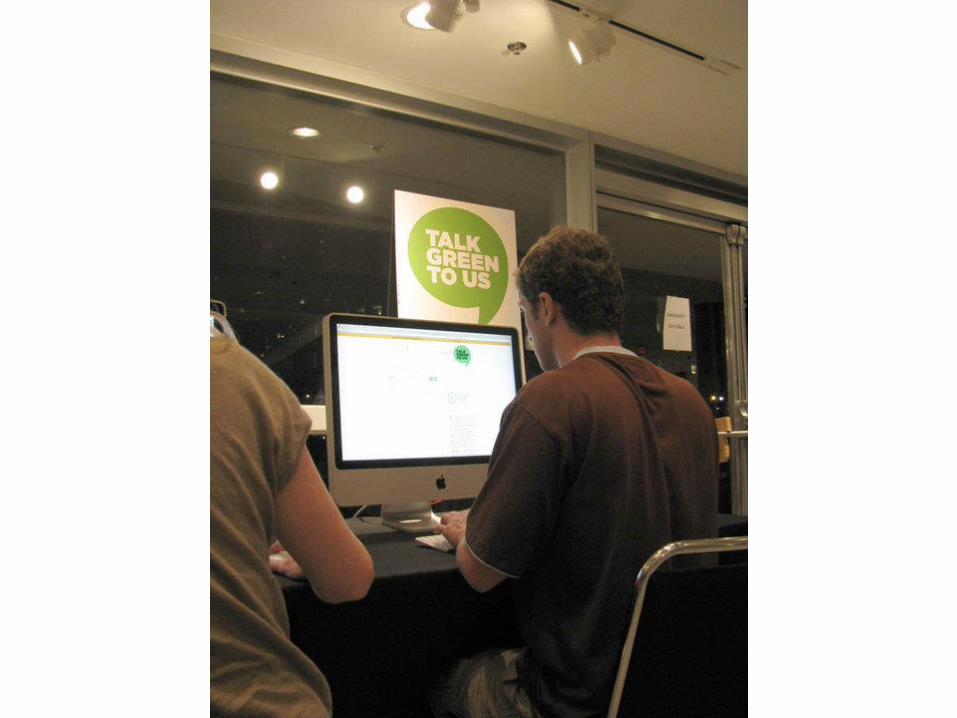
CAN YOU SAY PECHA KUCHA?2,000+ residents come out to kick off talkgreentous.ca
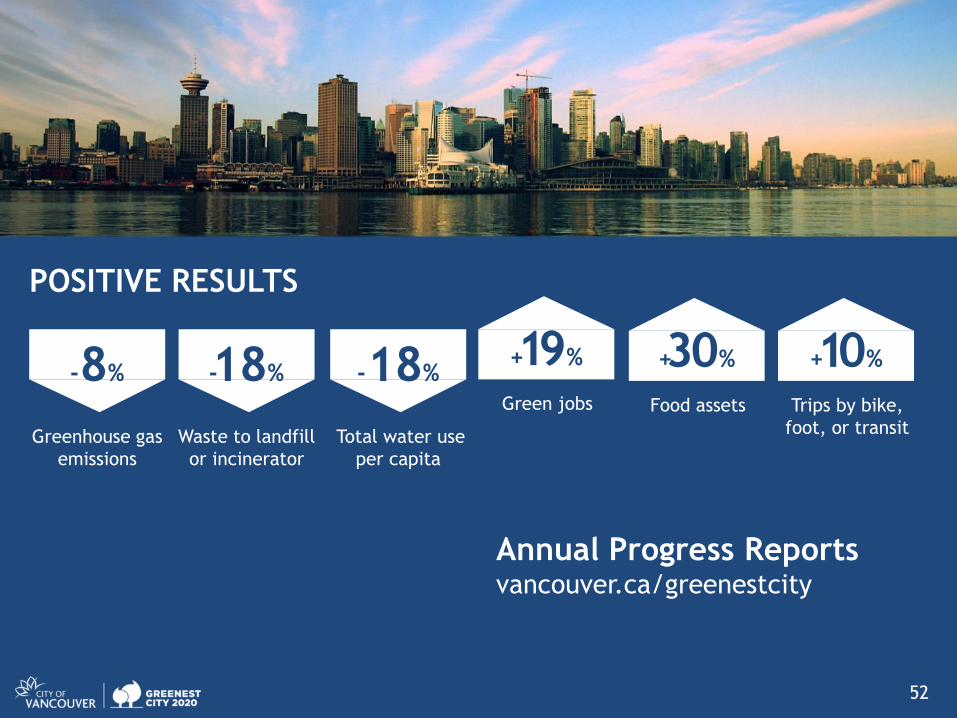
POSITIVE RESULTS
-18%
Waste to landfill
or incinerator
-8%
Greenhouse gas
emissions
-18%
Total water use
per capita
+19%
Green jobs
+30%
Food assets
+10%
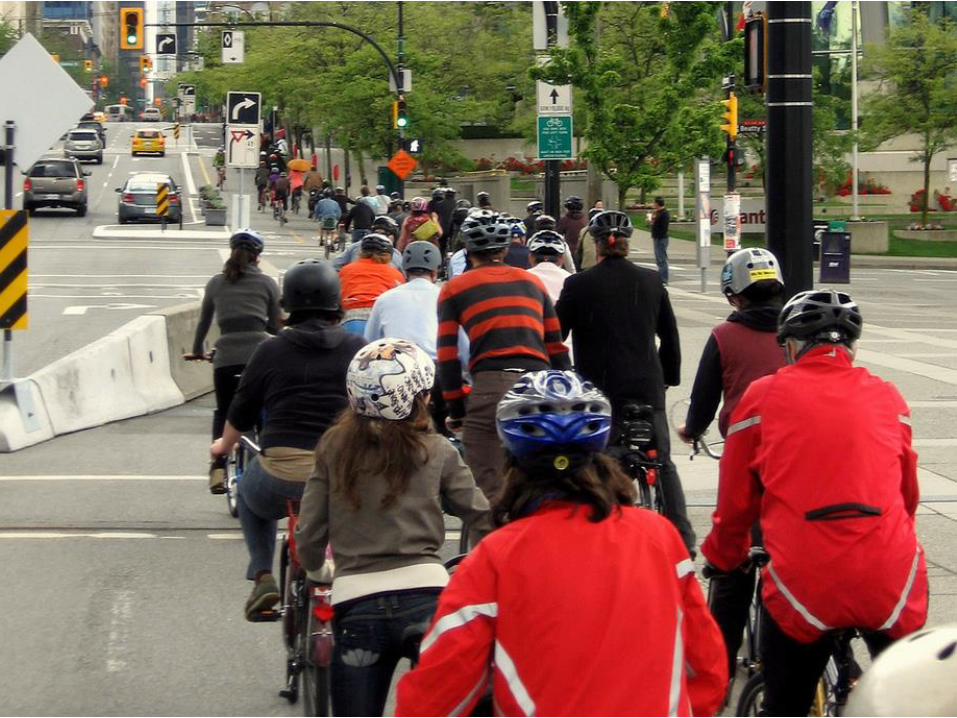
Trips by bike,
foot, or transit
Annual Progress Reports vancouver.ca/greenestcity
52
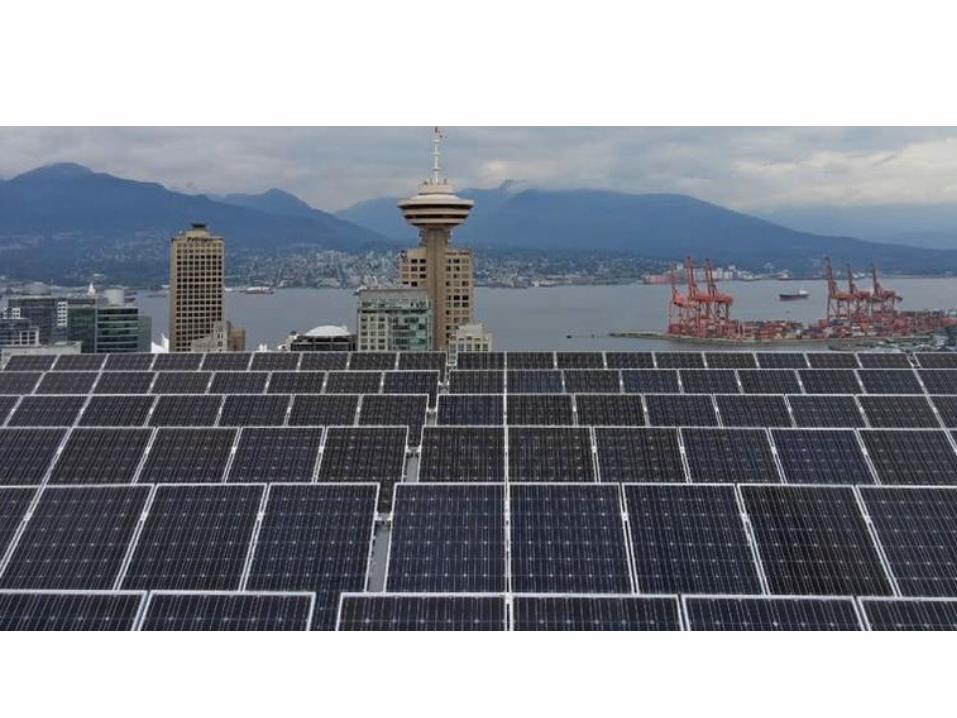
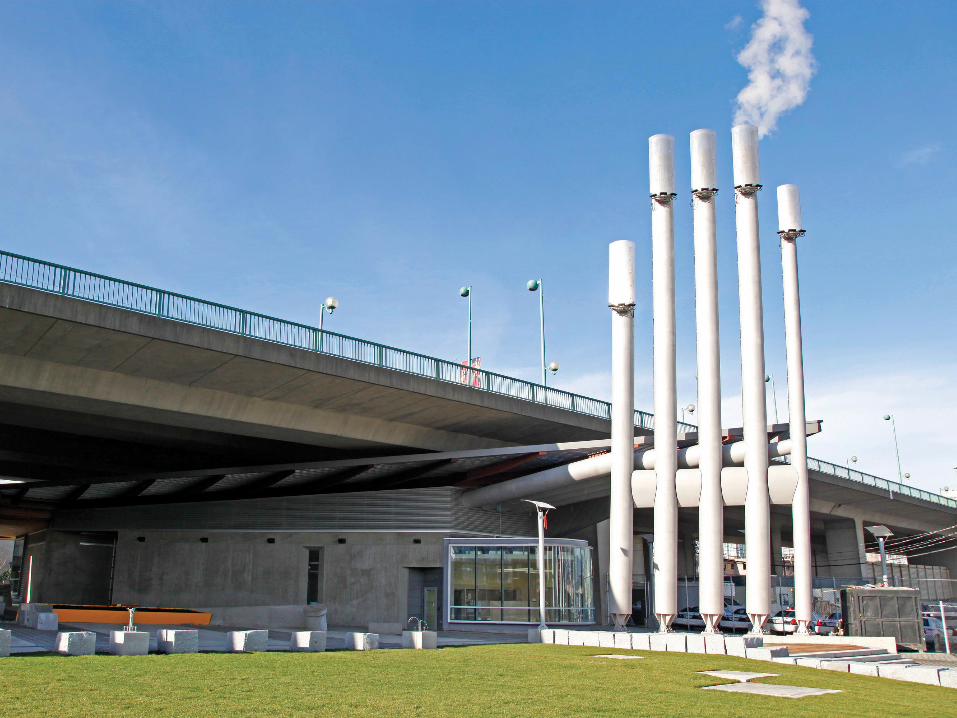
We can do this.
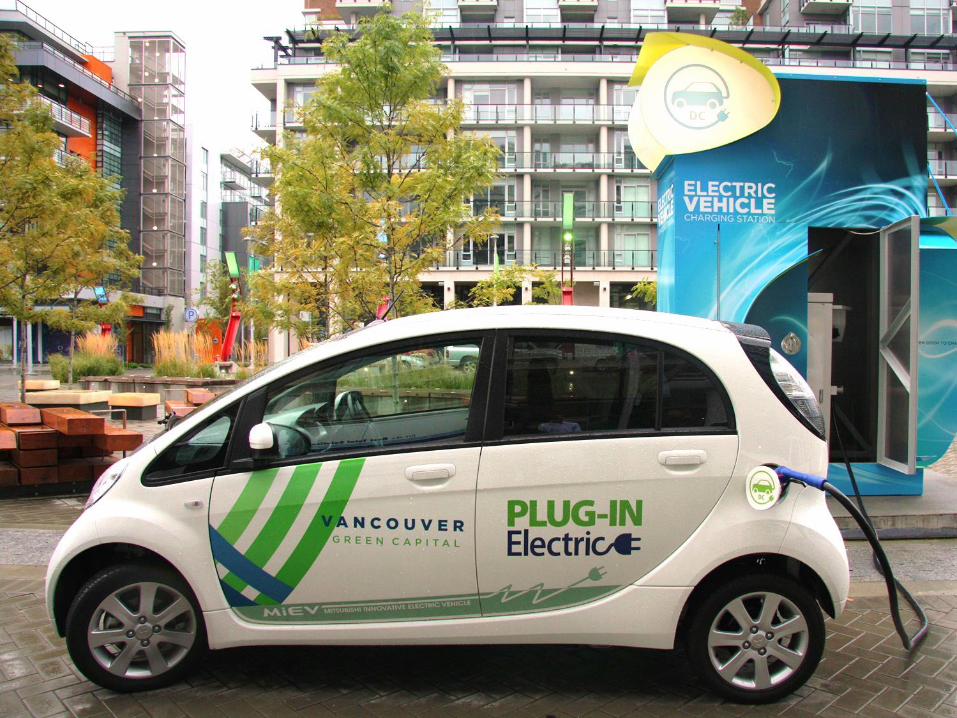
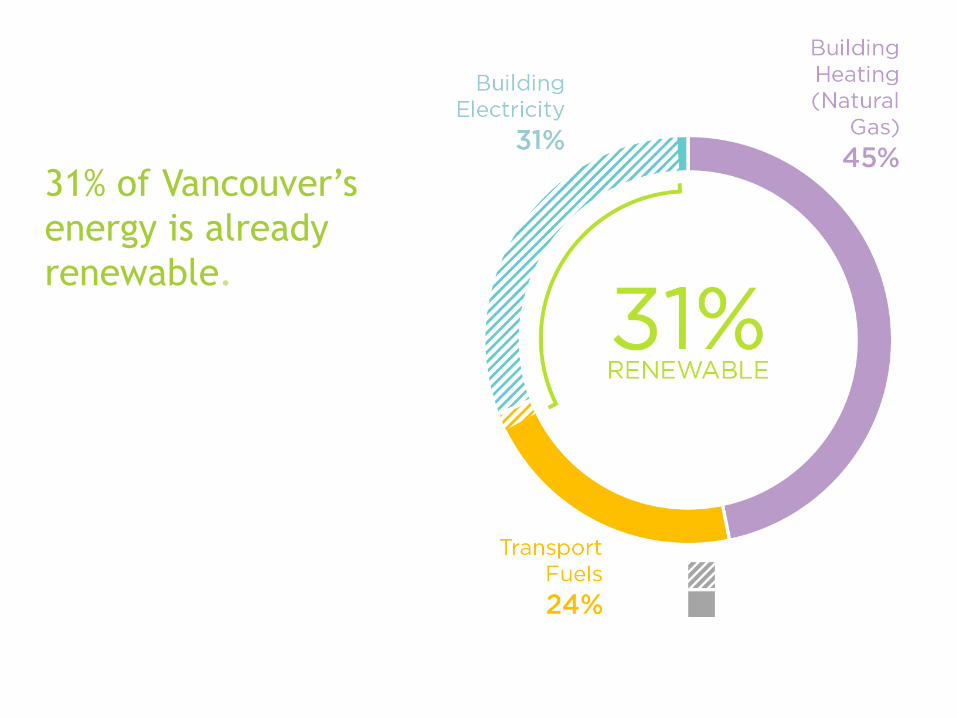
31% of Vancouver’s
energy is already
renewable.
ENERGY USED IN
VANCOUVER IN 2014
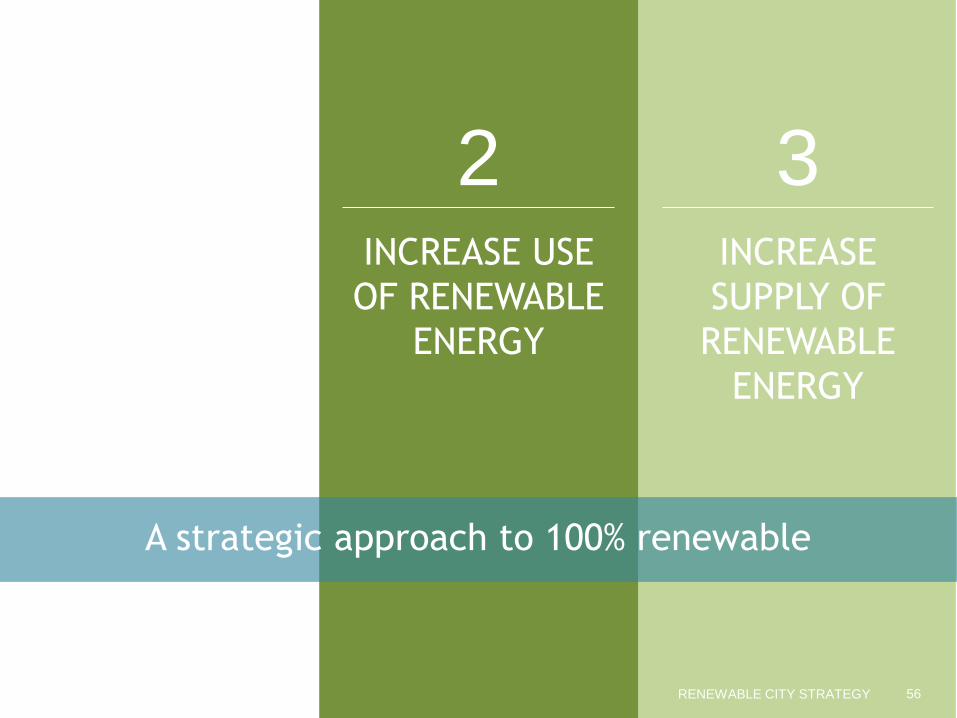
56
REDUCE
ENERGY USE
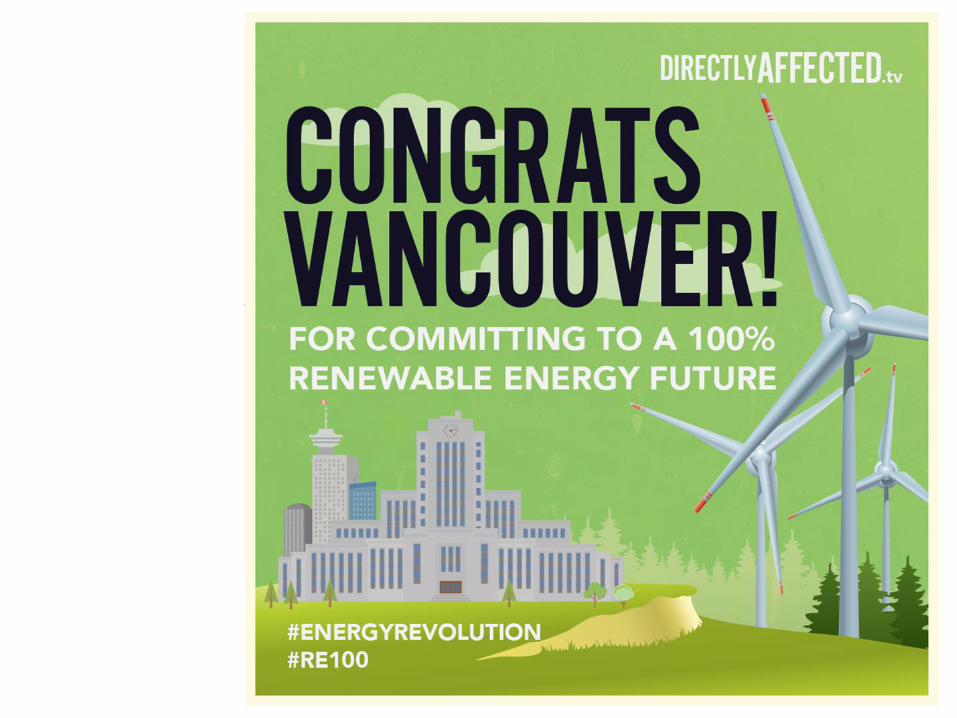
RENEWABLE CITY STRATEGY
1INCREASE USE
OF RENEWABLE
ENERGY
2INCREASE
SUPPLY OF
RENEWABLE
ENERGY
3
A strategic approach to 100% renewable
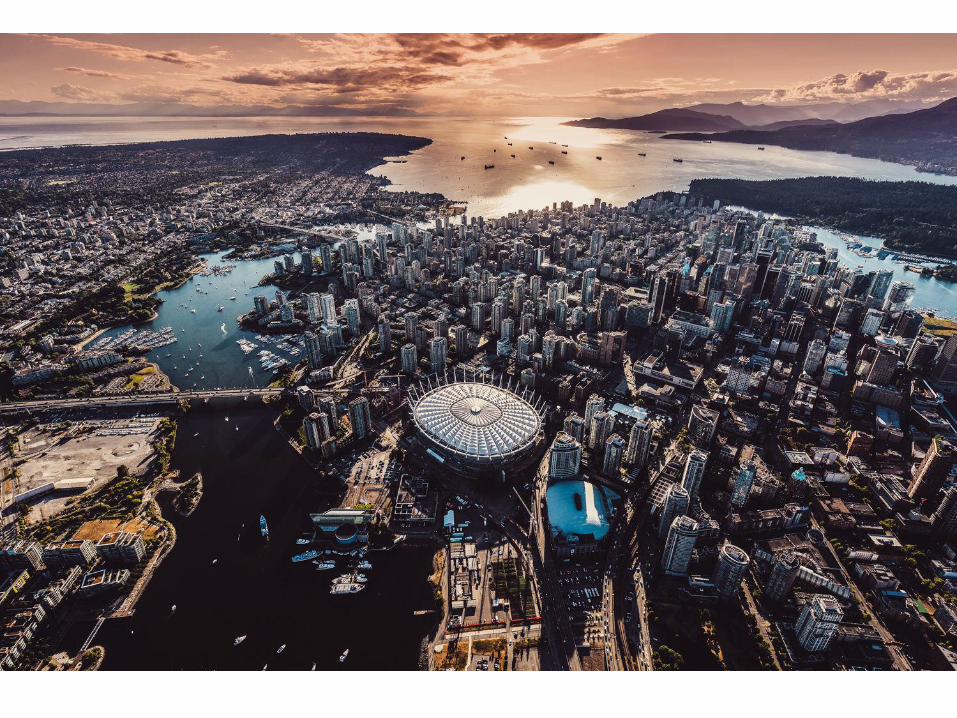

Photo by Thomas Quine
61RENEWABLE CITY STRATEGY
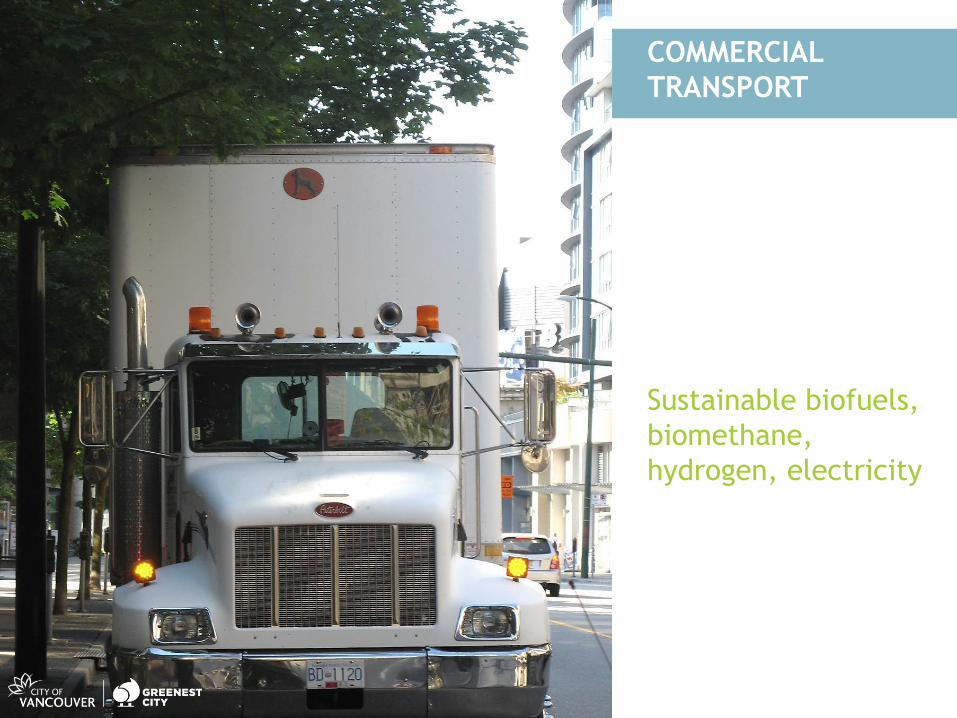
Small in number but
energy intensive
Projected future
technologies »
Sustainable biofuels,
biomethane,
hydrogen, electricity
COMMERCIAL
TRANSPORT
Earth Hour City Challenge: Cooking up a storm for sustainabilityICLEI World Congress 2015
JOIN
US!vancouver.ca/
greenestcity
THANK YOU!
@andreareimer

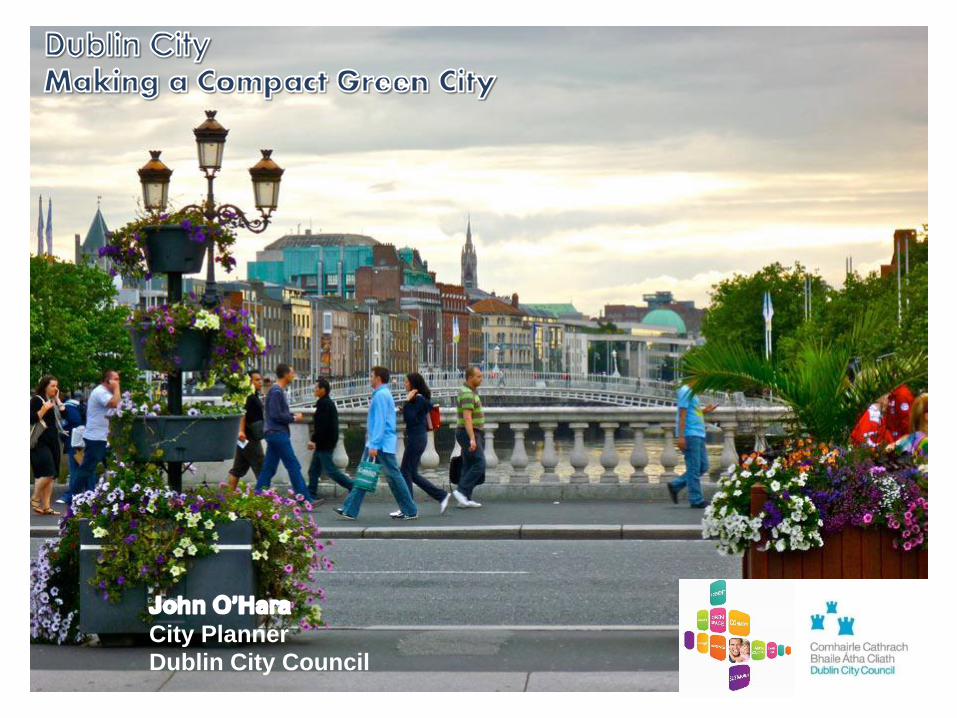
City Planner
Dublin City Council
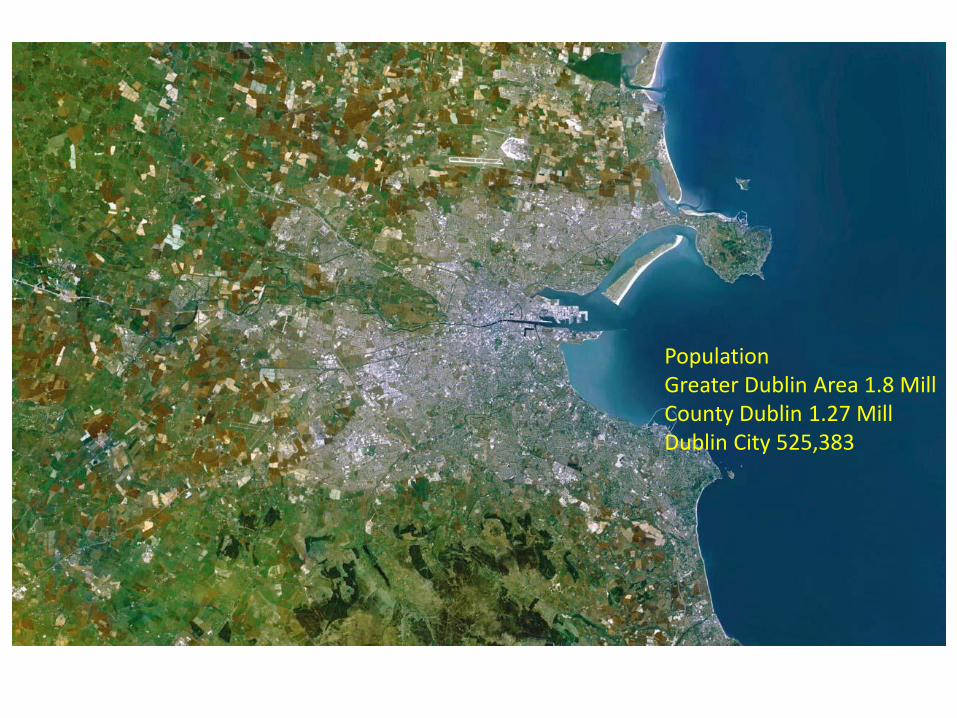
PopulationGreater Dublin Area 1.8 MillCounty Dublin 1.27 MillDublin City 525,383
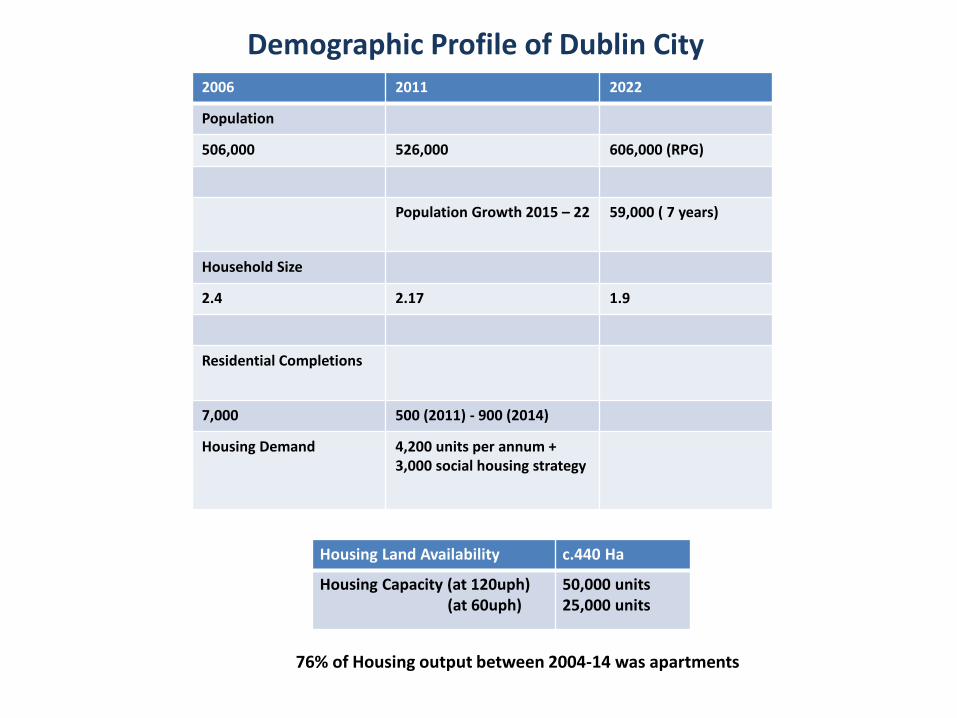
2006 2011 2022
Population
506,000 526,000 606,000 (RPG)
Population Growth 2015 – 22 59,000 ( 7 years)
Household Size
2.4 2.17 1.9
Residential Completions
7,000 500 (2011) - 900 (2014)
Housing Demand 4,200 units per annum + 3,000 social housing strategy
Housing Land Availability c.440 Ha
Housing Capacity (at 120uph)(at 60uph)
50,000 units25,000 units
76% of Housing output between 2004-14 was apartments
Demographic Profile of Dublin City
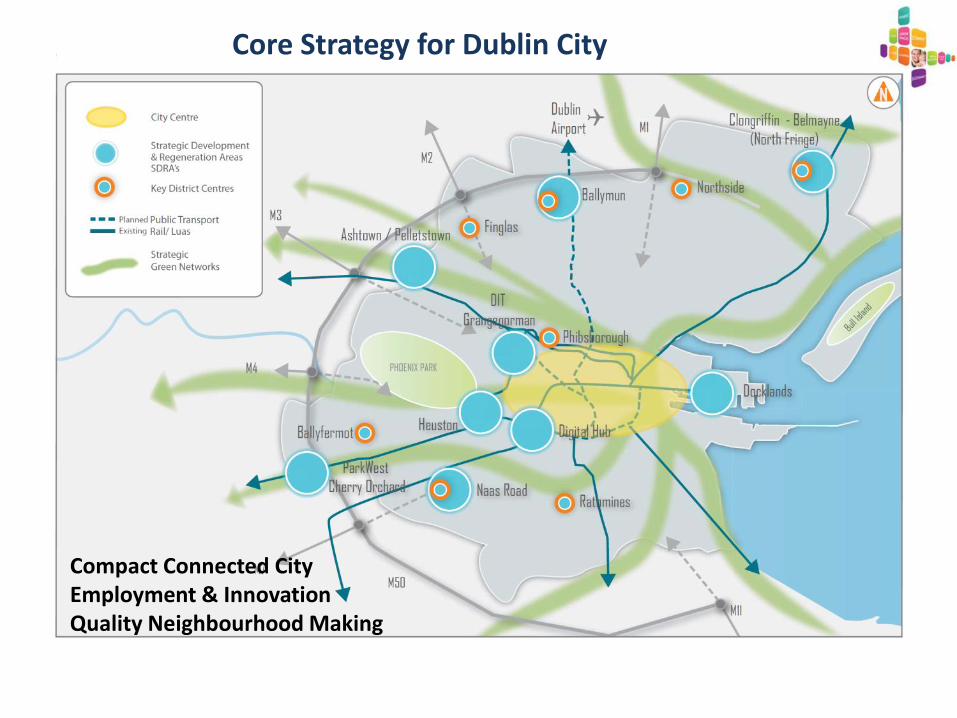
Core Strategy for Dublin City
Compact Connected City Employment & InnovationQuality Neighbourhood Making
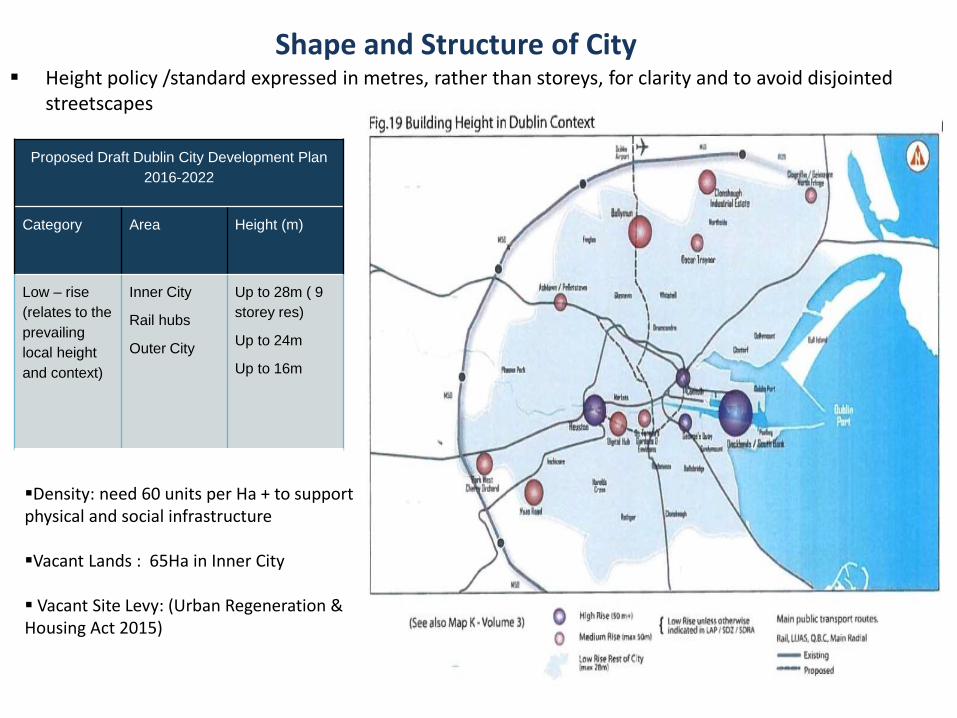
Height policy /standard expressed in metres, rather than storeys, for clarity and to avoid disjointed streetscapes
Proposed Draft Dublin City Development Plan
2016-2022
Category Area Height (m)
Low – rise
(relates to the
prevailing
local height
and context)
Inner City
Rail hubs
Outer City
Up to 28m ( 9
storey res)
Up to 24m
Up to 16m
Density: need 60 units per Ha + to support physical and social infrastructure
Vacant Lands : 65Ha in Inner City
Vacant Site Levy: (Urban Regeneration & Housing Act 2015)
Shape and Structure of City
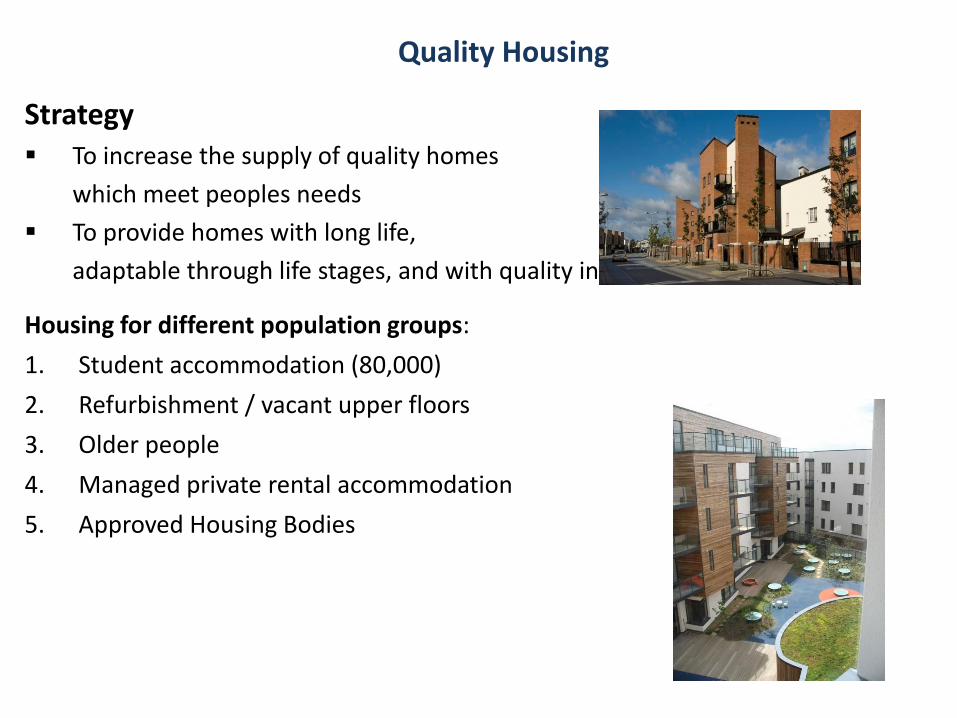
Strategy To increase the supply of quality homes
which meet peoples needs
To provide homes with long life,
adaptable through life stages, and with quality internal/external space
Housing for different population groups:
1. Student accommodation (80,000)
2. Refurbishment / vacant upper floors
3. Older people
4. Managed private rental accommodation
5. Approved Housing Bodies
Quality Housing
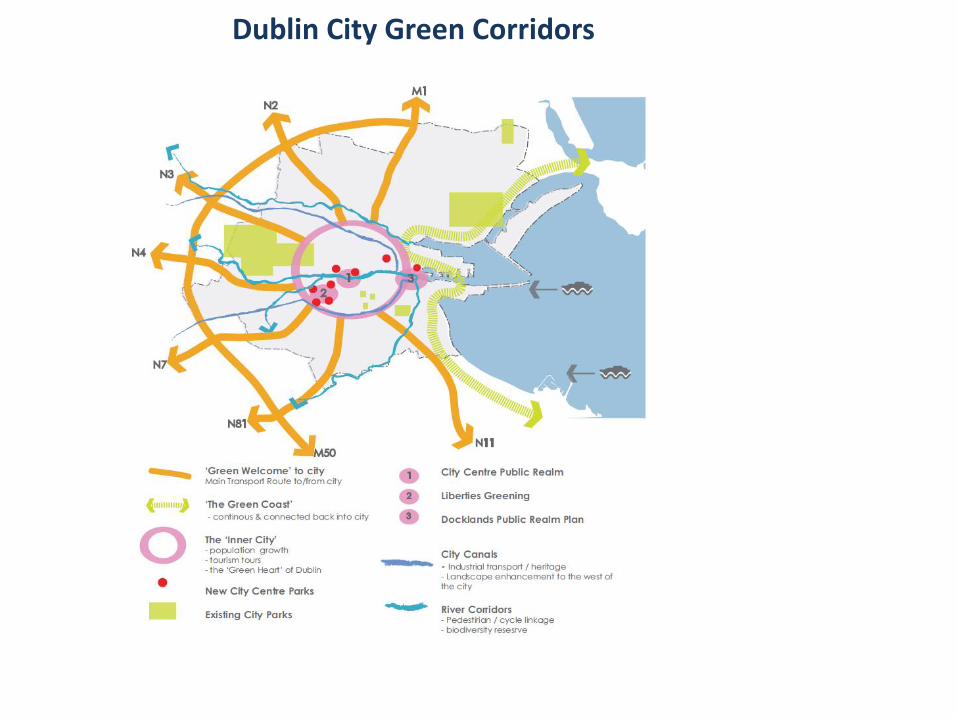
Dublin City Green Corridors
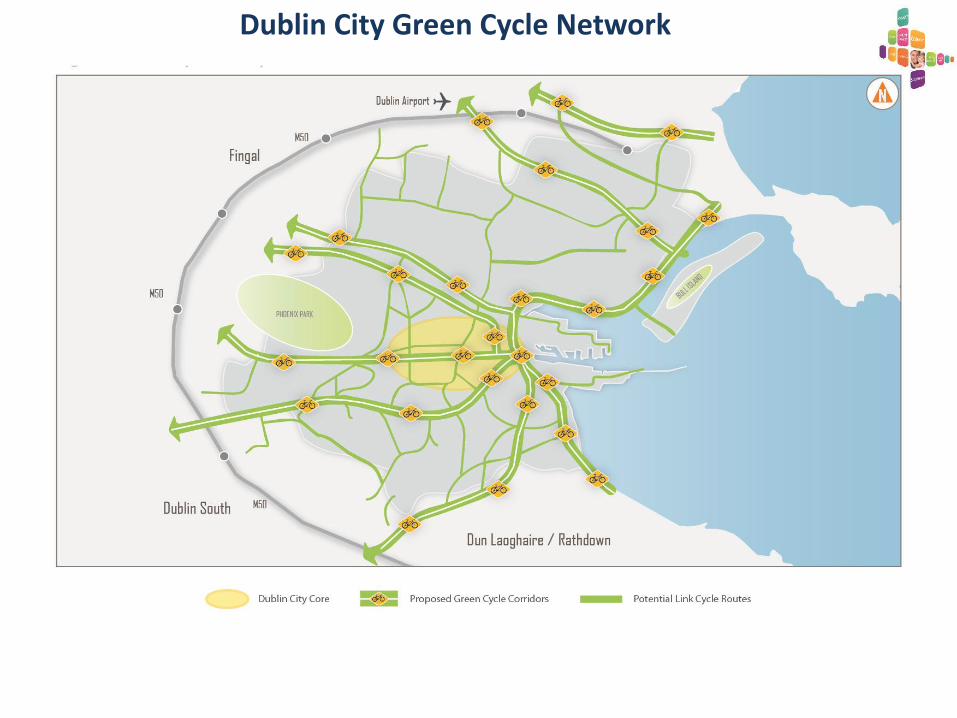
Dublin City Green Cycle Network
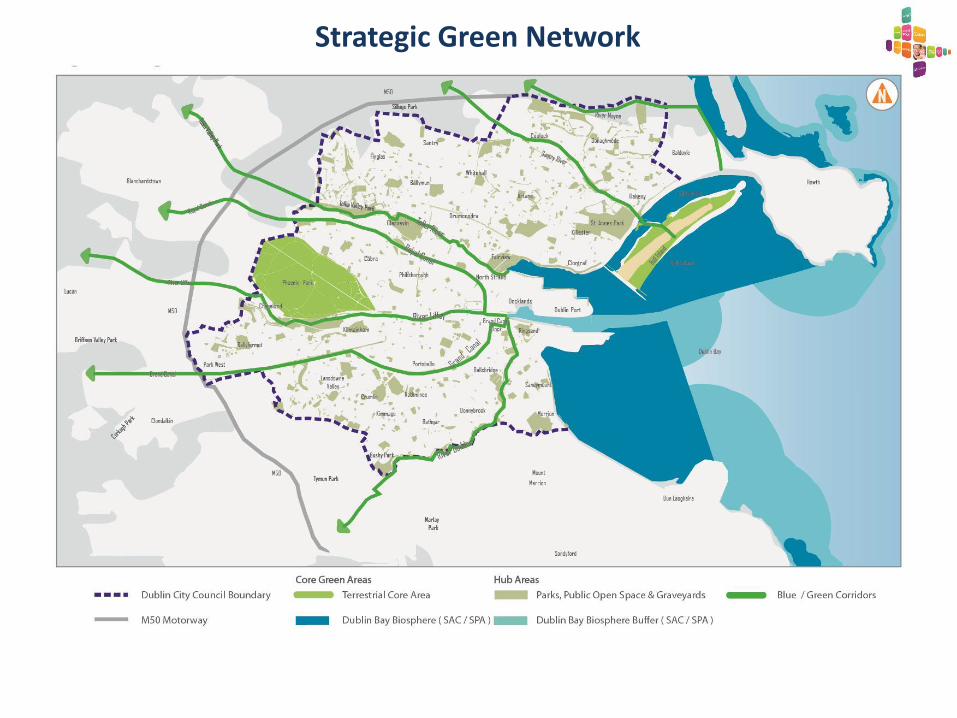
Strategic Green Network
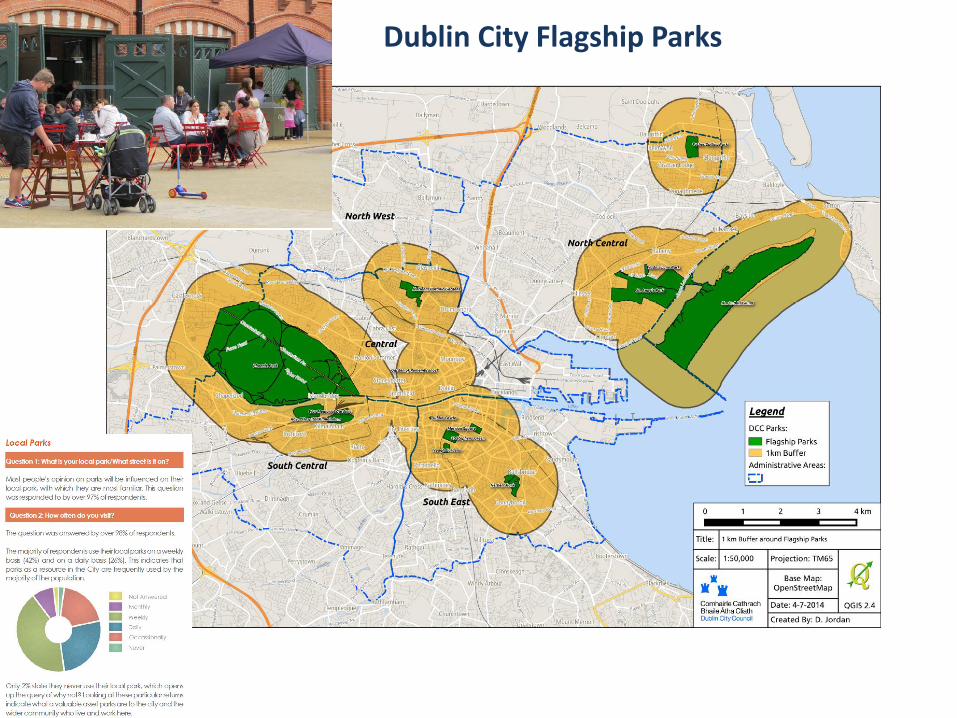
Dublin City Flagship Parks
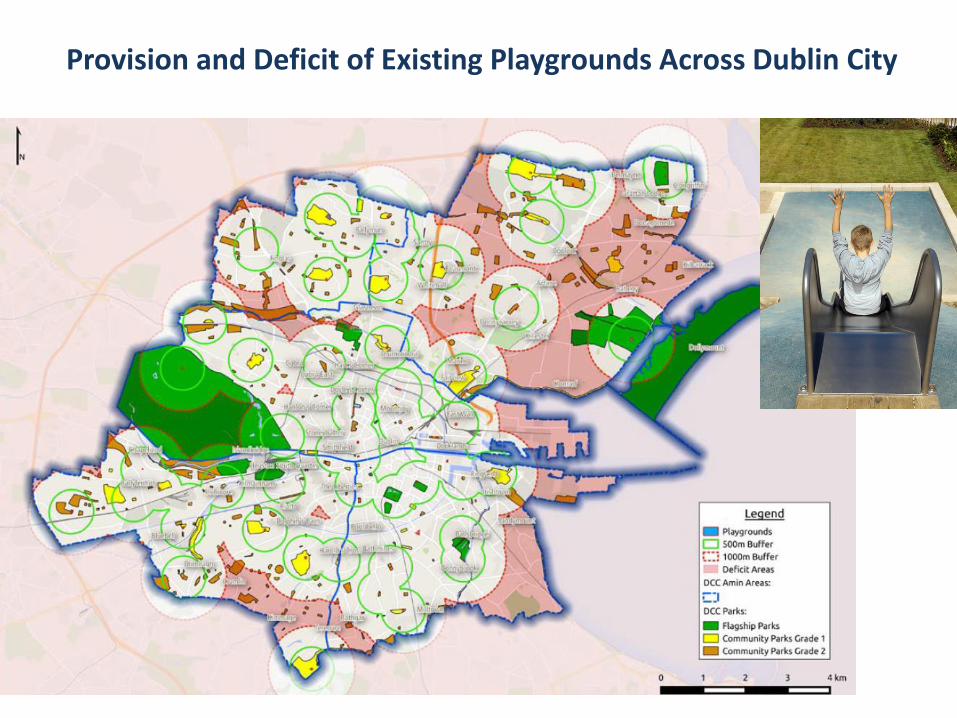
Provision and Deficit of Existing Playgrounds Across Dublin City
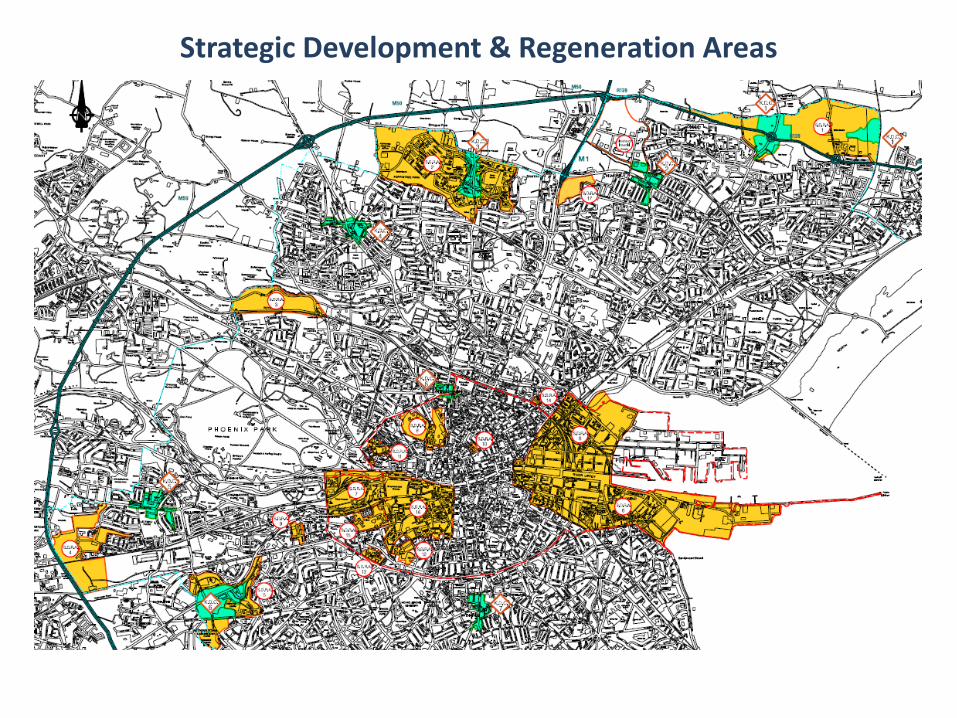
Strategic Development & Regeneration Areas
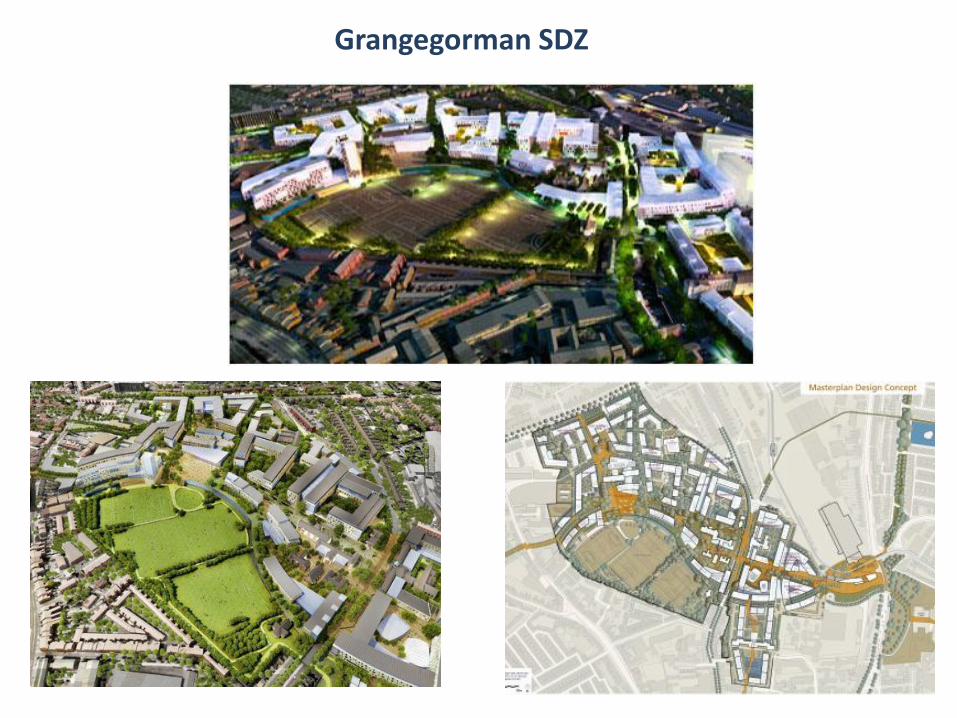
Grangegorman SDZ
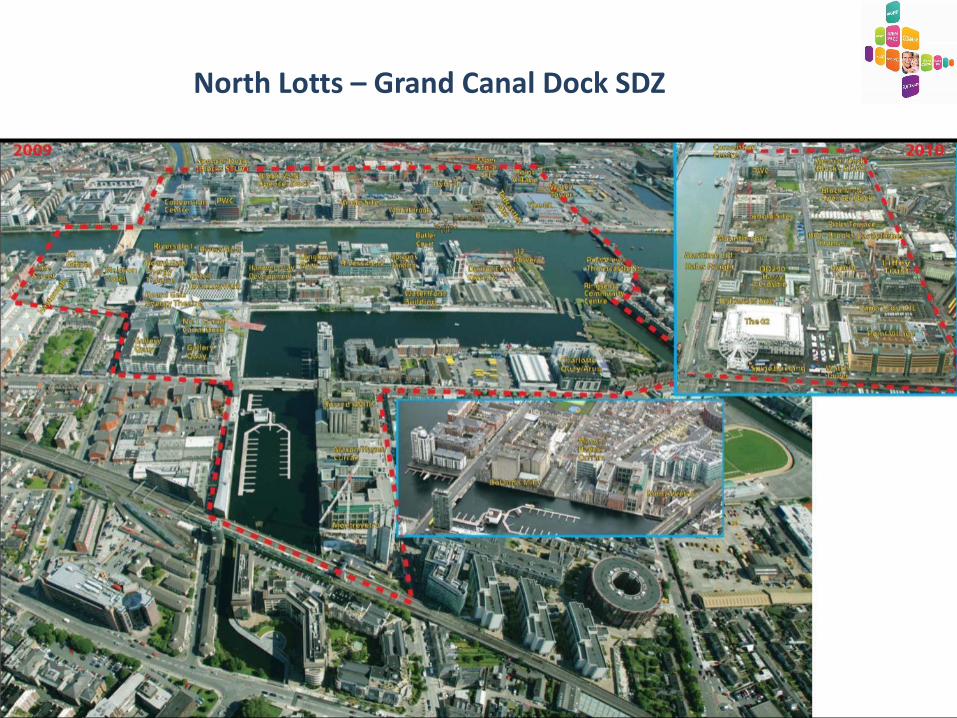
North Lotts – Grand Canal Dock SDZ

Existing Public Realm for Dublin Docklands
Proposed Public Realm for Dublin Docklands
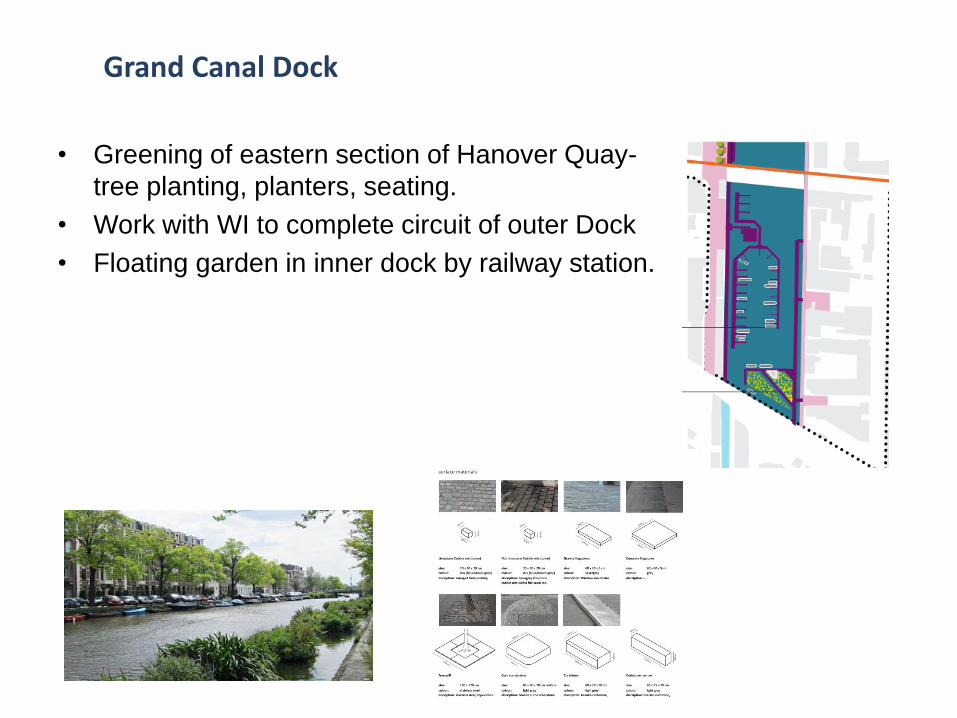
• Greening of eastern section of Hanover Quay-
tree planting, planters, seating.
• Work with WI to complete circuit of outer Dock
• Floating garden in inner dock by railway station.
Grand Canal Dock
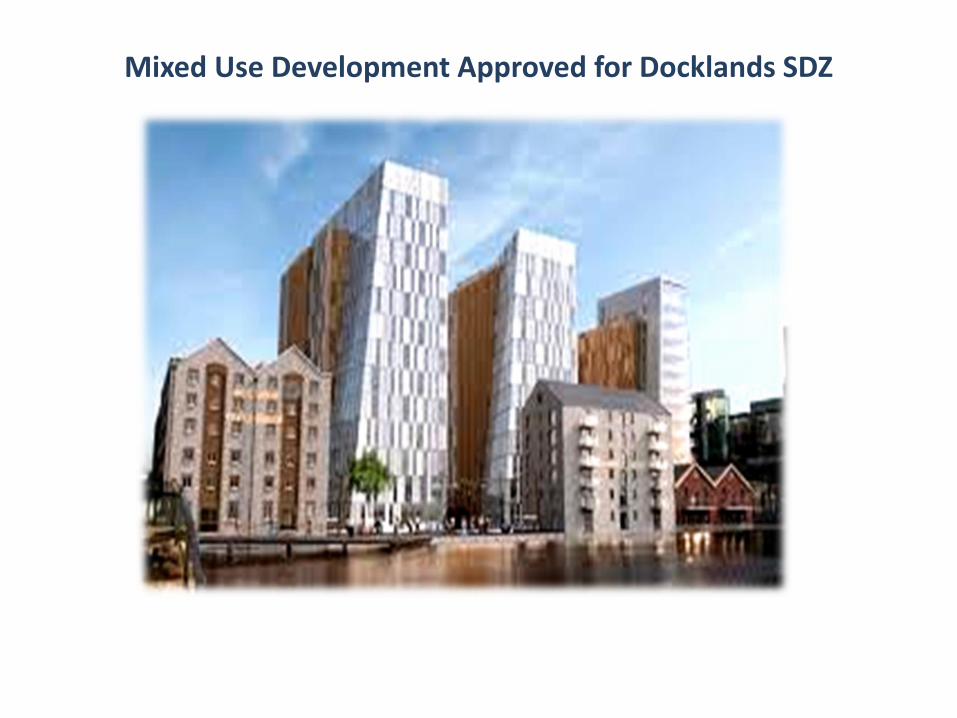
Mixed Use Development Approved for Docklands SDZ
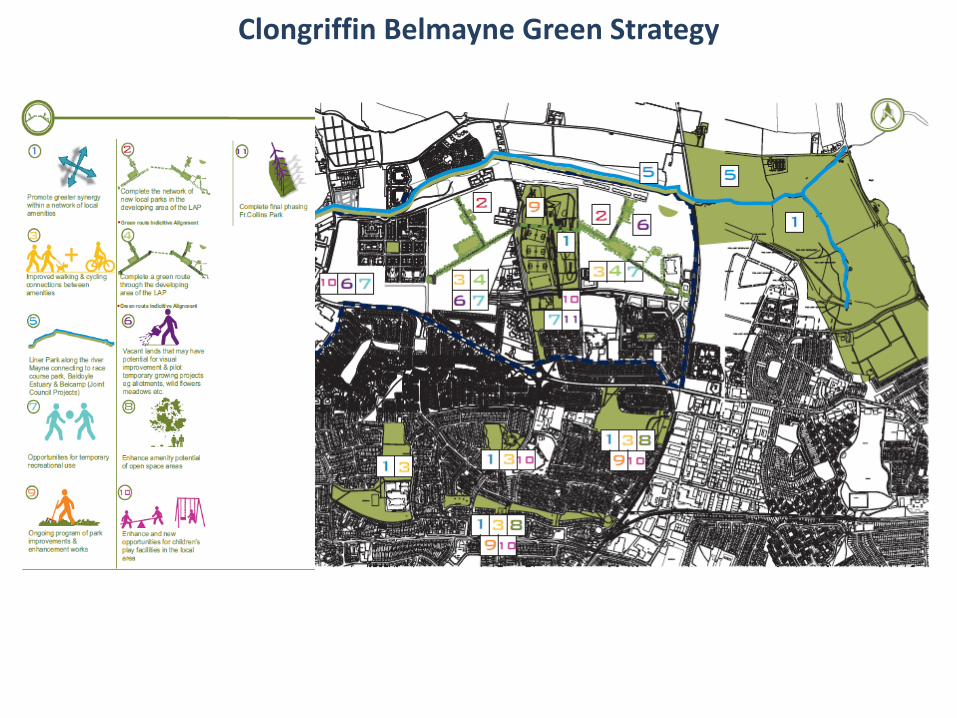
Clongriffin Belmayne Green Strategy
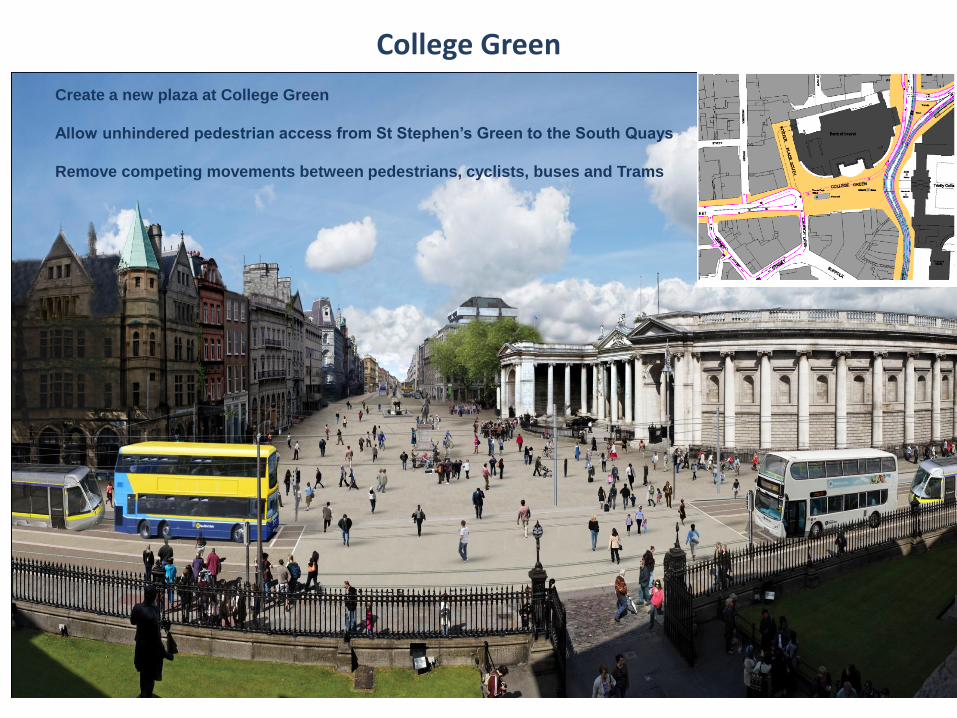
College Green
Create a new plaza at College Green
Allow unhindered pedestrian access from St Stephen’s Green to the South Quays
Remove competing movements between pedestrians, cyclists, buses and Trams
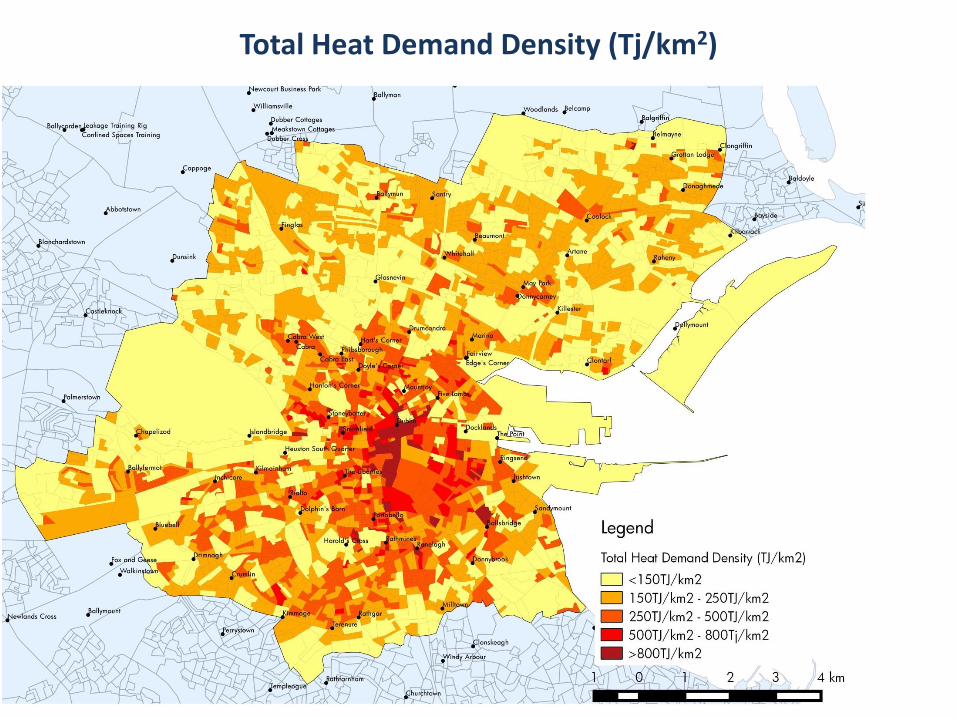
Total Heat Demand Density (Tj/km2)
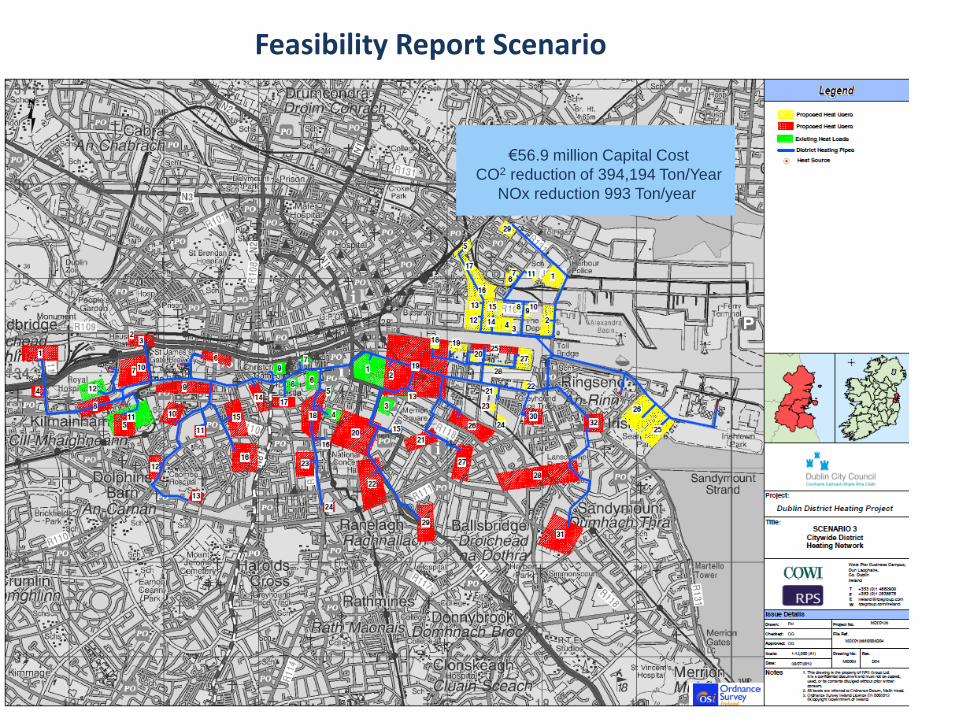
Feasibility Report Scenario
€56.9 million Capital Cost
CO2 reduction of 394,194 Ton/Year
NOx reduction 993 Ton/year
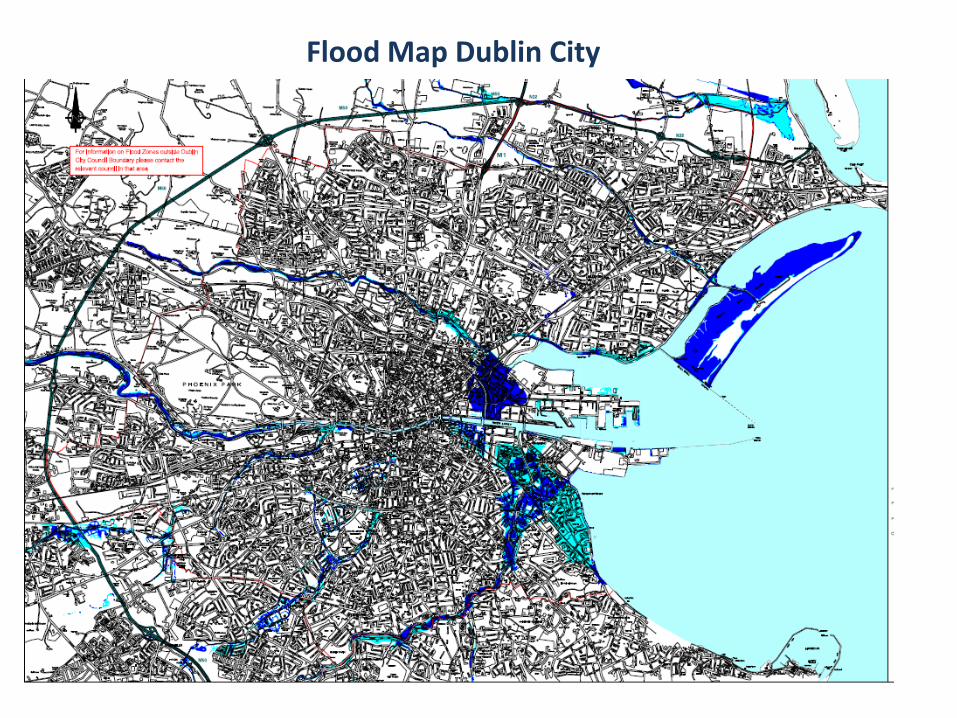
Flood Map Dublin City
Thank You