asatefbcn.comasatefbcn.com/NOTICIES/llistat general de medicaments 280307.pdfasatefbcn.com

Irish Enterprise Exporting Patterns in Goods and Services
Martina Lawless, Iulia Siedschlag
and Zuzanna Studnicka
4th April 2017 www.esri.ie
Research funded by Enterprise Ireland and
the Department of Jobs, Enterprise and Innovation

Introduction
Two reports: “Expanding and Diversifying the Manufactured Exports of
Irish-Owned Enterprises” “Services Exports and Exporters of Services”
Parts of research programme on “Exports, Innovation and Productivity” Funded by Enterprise Ireland and the Department of Jobs,
Enterprise and Innovation
Exports of both manufactured products and services are a major driver of Irish economic growth of the 1990s and 2000s.
Dominant role played by multinationals (close to ninety percent of total manufactured exports).

Expanding and Diversifying the Manufactured Exports of Irish-Owned Enterprises
Introduction
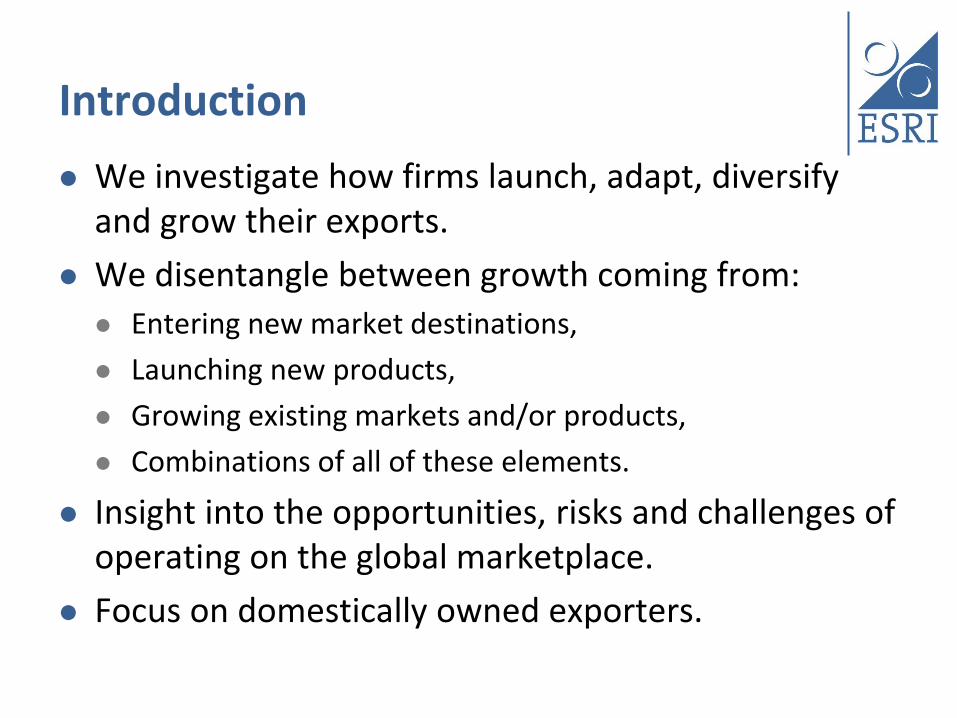
We investigate how firms launch, adapt, diversify and grow their exports.
We disentangle between growth coming from:
Entering new market destinations,
Launching new products,
Growing existing markets and/or products,
Combinations of all of these elements.
Insight into the opportunities, risks and challenges of operating on the global marketplace.
Focus on domestically owned exporters.
Research questions
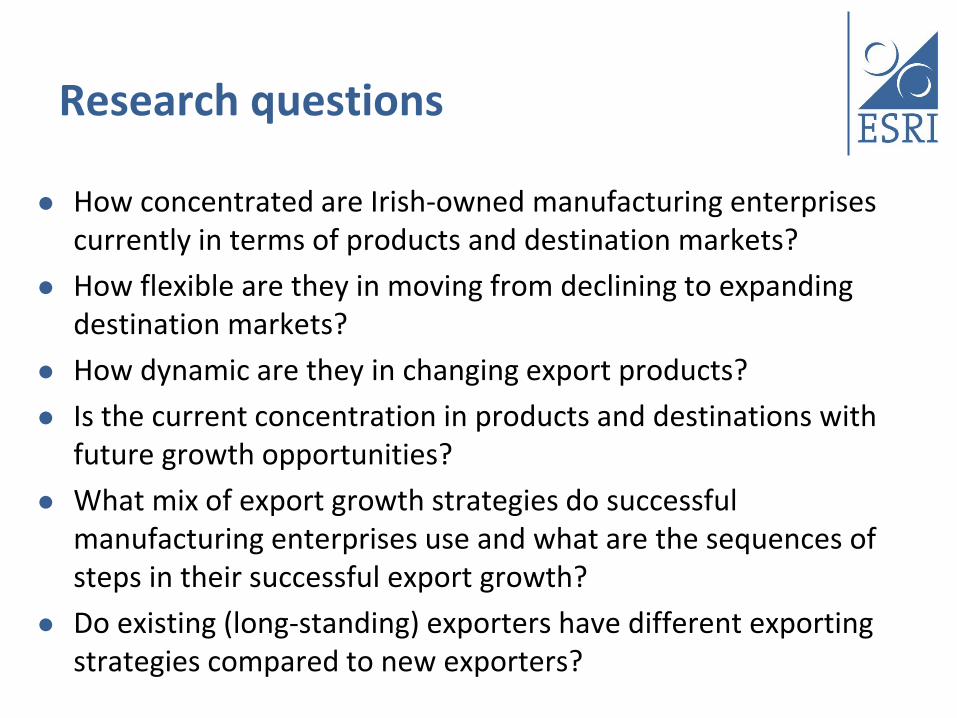
How concentrated are Irish-owned manufacturing enterprises currently in terms of products and destination markets?
How flexible are they in moving from declining to expanding destination markets?
How dynamic are they in changing export products?
Is the current concentration in products and destinations with future growth opportunities?
What mix of export growth strategies do successful manufacturing enterprises use and what are the sequences of steps in their successful export growth?
Do existing (long-standing) exporters have different exporting strategies compared to new exporters?

Data sources
We merge two key sources of manufacturing firm activity:
1. Trade data (IntraStat and ExtraStat)
Highly detailed transaction level records
Very finely defined products (HS 6-digit level)
Firm values of exported products to each destination market
Limitation – does not cover firms exporting values below €635,000
This excludes many firms but not much total trade
2. Census of Industrial Production
Firm information on characteristics such as employment, ownership etc.

Data sources Between 1,000 and 1,400 firms per year.
20-year horizon (1996-2015).
47 per cent of firms, 99 per cent of total trade.
We distinguish between: Irish and foreign-owned companies,
Small, medium and large companies,
Firms exporting: food products, non-food products, both.
% Irish Non-Irish
Small 57 61 30
Medium 32 24 46
Large 11 5 23
All firms Irish Non-Irish
All 119.3 75.1 210.2
Food 75.7 72.1 124.1
Both 232.3 153.0 404.6
Non-food 103.2 61.9 180.7 Firm size distribution and
average employment
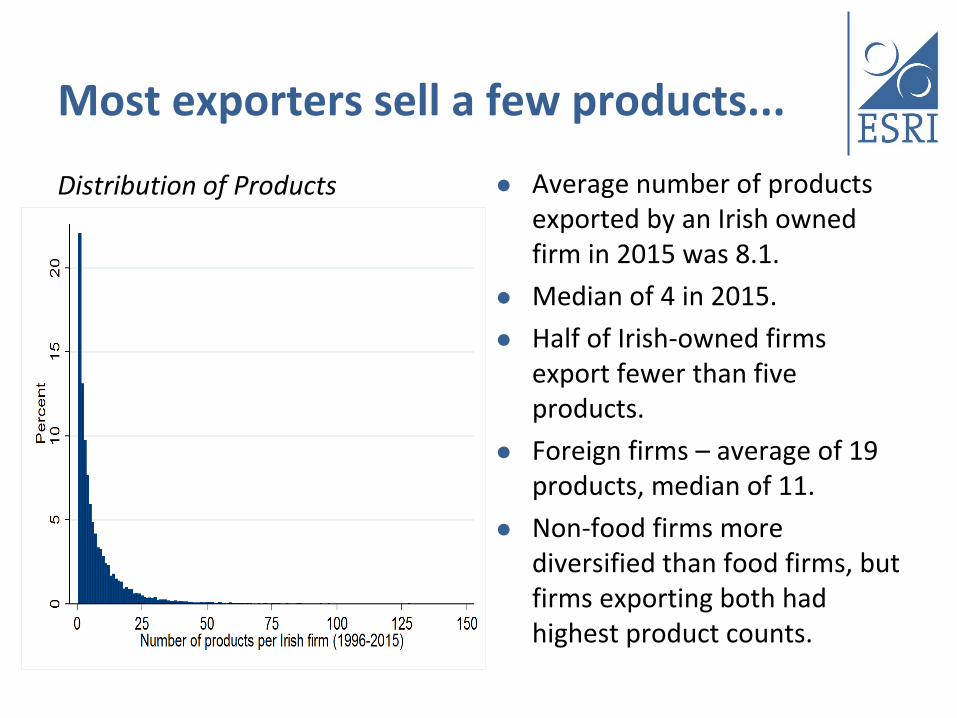
Most exporters sell a few products...
Distribution of Products Average number of products exported by an Irish owned firm in 2015 was 8.1.
Median of 4 in 2015.
Half of Irish-owned firms export fewer than five products.
Foreign firms – average of 19 products, median of 11.
Non-food firms more diversified than food firms, but firms exporting both had highest product counts.

...To a small number of markets
Distribution of Markets Exporters sell into an average
of 7.7 destinations (2015).
Median of 3 markets.
Foreign owned firms sell to on average 17.7 destinations and median of 12.
Non-food firms sell to slightly more markets (average of 6.9) compared to food firms (4.2).
Firms selling food and non-food have highest market coverage (average 14.7).

Joint Product & Destination Dimensions
Number of Products
2011-15 1 2 3-5 6-10 11-20 20+ Total
1 Market 16.93 3.90 3.51 1.64 0.86 0.08 26.91
2 Markets 1.09 3.98 5.07 2.03 1.25 0.39 13.81
3-5 Markets 0.70 0.94 5.07 5.62 3.28 2.26 17.86
6-10 Markets 0.31 0.47 2.18 4.21 3.43 3.35 13.96
11-20 Markets 0.00 0.16 0.86 2.89 4.06 4.76 12.71
20+ Markets 0.00 0.08 0.00 0.78 2.89 11.0 14.74
Total 19.03 9.52 16.69 17.16 15.76 21.84 100
Distribution of Firms by Product and Market – Irish Firms
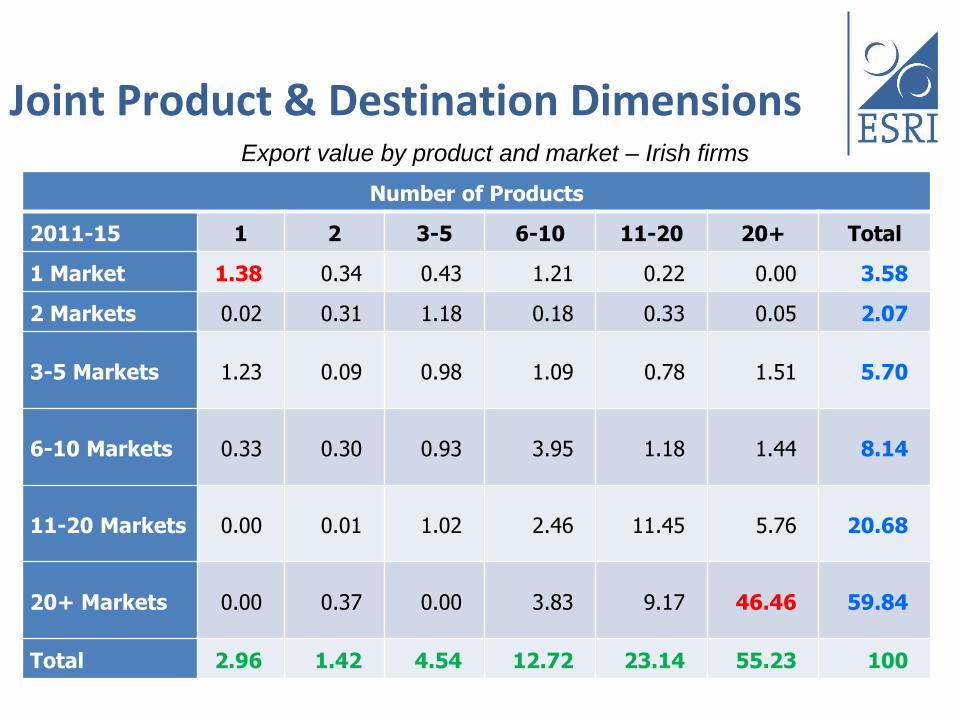
Joint Product & Destination Dimensions
Number of Products
2011-15 1 2 3-5 6-10 11-20 20+ Total
1 Market 1.38 0.34 0.43 1.21 0.22 0.00 3.58
2 Markets 0.02 0.31 1.18 0.18 0.33 0.05 2.07
3-5 Markets 1.23 0.09 0.98 1.09 0.78 1.51 5.70
6-10 Markets 0.33 0.30 0.93 3.95 1.18 1.44 8.14
11-20 Markets 0.00 0.01 1.02 2.46 11.45 5.76 20.68
20+ Markets 0.00 0.37 0.00 3.83 9.17 46.46 59.84
Total 2.96 1.42 4.54 12.72 23.14 55.23 100
Export value by product and market – Irish firms
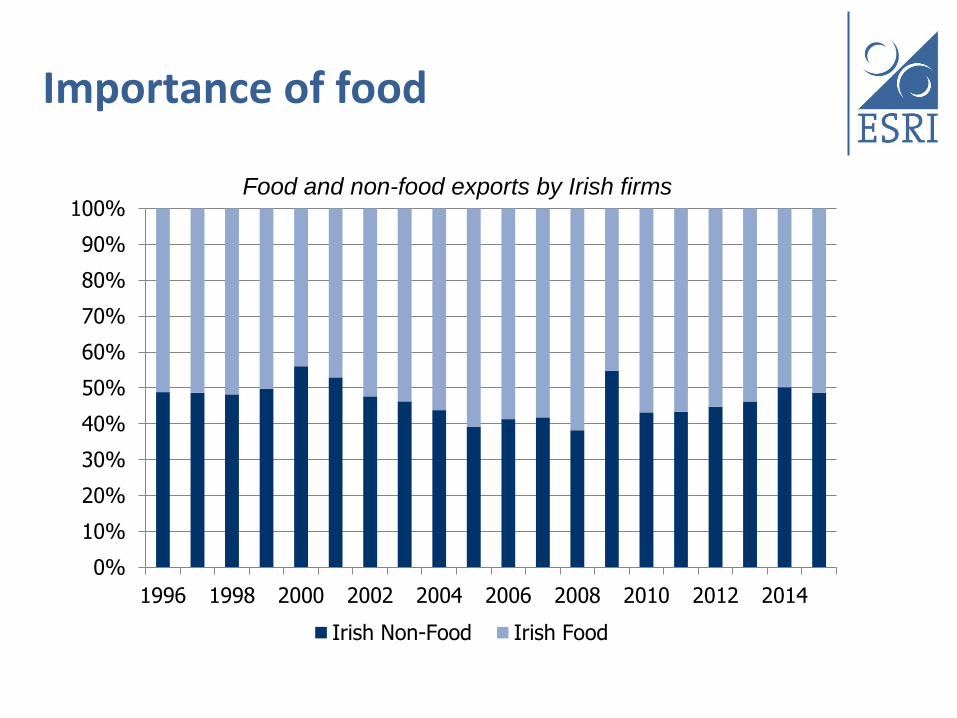
Importance of food
0%
10%
20%
30%
40%
50%
60%
70%
80%
90%
100%
1996 1998 2000 2002 2004 2006 2008 2010 2012 2014
Irish Non-Food Irish Food
Food and non-food exports by Irish firms

Top food products
HS-6
% Share of product in total Irish
Food Exports
% Irish Market
Share in Product World
Exports
% Growth of Irish Export Sales
2011-14
Product name
20130 23.3 8.32(-) 3.8 Bovine Meat – Boneless: Processed & Other
40690 4.4 0.9(+) 23.0 Other Cheese: Cheddar Cheese, Colby
40510 4.0 3.78(-) 3.2 Butter
160250 3.4 7.42(-) -0.2 Meat, Offal Meat, Blood of Bovine Animals (Prepared or Preserved)
20610 2.8 24.62(-) -8.9 Edible Offal of Bovine Animals, Fresh or Chilled of Bovine Animals, Frozen
230910 2.7 1.23(-) -1.5 Dog or Cat Food, Put up for Retail Sale
20110 2.5 5.69(+) 6.1 Carcasses and Half-carcasses, Veal, Other
190190 2.4 2.0(-) -18.4 Other Food Preparations of Malt Extract, Flour, Starch, Milk, Cream
20230 2.3 0.53(-) 5.7 Bovine animals – Boneless, Processed
20329 2.1 0.9(+) 16.1 Meat of Swine (Frozen) – Processed & Other
Total 50
Top exported food products by Irish firms

Top non-food products Top exported non-food products by Irish firms
HS-6
% Share
of
product in
total Irish
Non-Food
Exports
% Irish
Market
Share in
Product
World
Exports
%
Growth
of Irish
Export
Sales
2011-
14
Product name
350110 4.90 14.32(-) -2.1 Casein
300490 4.50 0.15(+) 1413.9 Other Medicaments (Put up in Packings for Retail Sale)
842720 2.80 1.17(+) 53.3 Other Self-Propelled Trucks
853110 2.70 2.02(+) 517.7 Burglar or Fire Alarms and Similar Apparatus
852530 2.60 0(-) new Television Cameras
330690 1.90 6.67(-) -20.4 Preparations for Oral or Dental Hygiene
390950 1.90 1.11(+) 34.6 Polyurethanes
440710 1.70 0.37(+) 11.7 Coniferous
330610 1.70 2.98(-) -24.9 Dentifrices
841221 1.70 1.46(+) 24.4 Hydraulic Power Engines and Motors, Linear Acting
Total 26

Top non-food products
Top exported products by foreign firms
Product name (HS-6) % Average share
2011-2015
1 Medicaments containing hormones, packaged 12.50
2 Heterocyclic compounds 7.11
3 Vaccines for human medicine 5.21
4 Nucleic or other heterocyclic compounds 5.00
5 Compounds containing an unfused pyridine ring 4.29
6 Other hormones and their derivatives; other steroids 4.15
7 Sulphonamides 3.91
8 Other heterocyclic compounds 2.72
9 Spectacle lenses not made of glass 2.44
10 Compounds containing a quinoline or isoquinoline ring 2.21
Total 49.52

Destination markets
Non-Food Food
% Share of
Irish Non-Food
Exports
% Average
GDP growth
2011-14
% Share of
Irish Food
Exports
% Average
GDP growth
2011-14
1 United Kingdom 41.5 2.04 United Kingdom 49 2.04
2 US 12.7 2.11 France 9.8 0.77
3 Germany 9.3 1.47 Netherlands 7.1 0.27
4 France 4.8 0.77 Germany 5.2 1.47
5 Italy 3.4 -1.12 Italy 4.6 -1.12
6 Netherlands 3.2 0.27 Sweden 3 1.47
7 Belgium 1.8 0.82 Spain 2.8 -1.00
8 Japan 1.8 0.70 China 2.2 7.74
9 Spain 1.6 -1.00 Belgium 2 0.82
10 China 1.5 7.74 Denmark 1.9 0.27
11 Poland 1.4 2.74 Nigeria 1.3 5.08
12 Australia 1.1 2.70 US 1.1 2.11
13 Sweden 1 1.47 Russia 0.9 2.37
14 Canada 0.8 2.30 Japan 0.7 0.70
15 Russia 0.8 2.37 Switzerland 0.7 1.63
Top destination markets

Irish firm exports and world demand growth
Bovine meat – boneless
Veal
Sablefish 0.0
5.0
10.0
15.0
20.0
25.0
-5.00 0.00 5.00 10.00 15.00 20.00
Share
of Ir
ish food
World growth
Food products
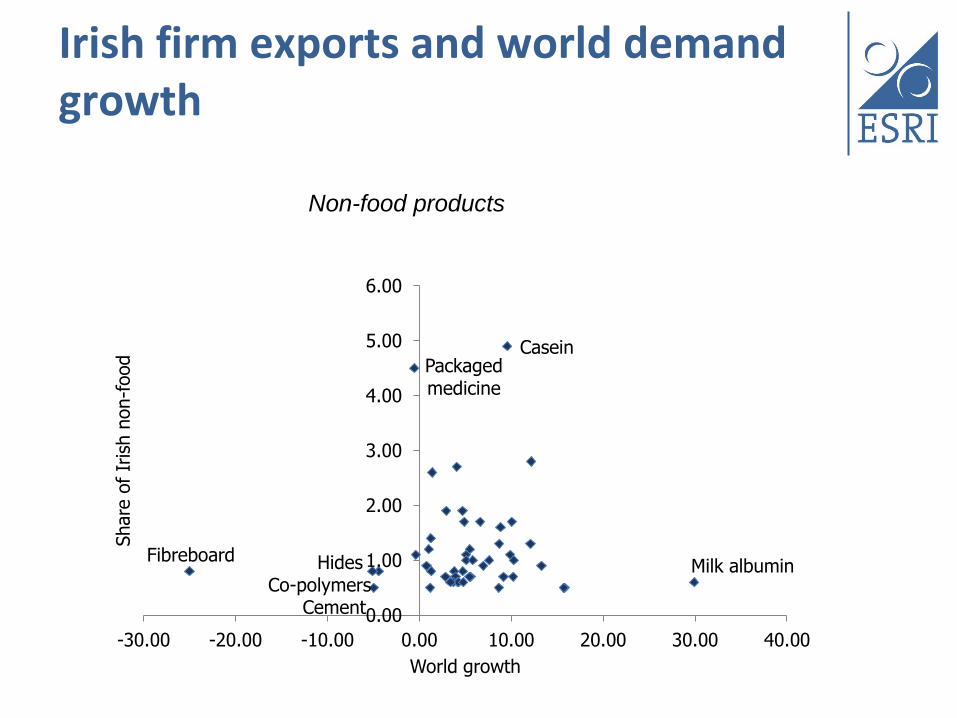
Irish firm exports and world demand growth
Casein Packaged medicine
Fibreboard Milk albumin Hides
Co-polymers Cement 0.00
1.00
2.00
3.00
4.00
5.00
6.00
-30.00 -20.00 -10.00 0.00 10.00 20.00 30.00 40.00
Share
of Ir
ish n
on-f
ood
World growth
Non-food products

Key messages – part 1
Most exporting firms sell a few products to a few destinations.
In contrast, export values are dominated by a relatively small group of export “superstars”.
11% of highly globalised Irish firms (exporting more than 20 products to over 20 destinations) account for 46% of exports.
Policy perspective: High levels of specialisation in the right products and markets may be a positive strategy for growth. But concentration also brings risk (importance of the UK).
On-going monitoring of global trends is required to keep ahead of market developments and be ready to exploit new opportunities.
Results suggest a need for on-going support to facilitate export expansion as well as entry.

Exporting risky – lots of early exits
Survival probability by firm size

Constant product dynamics...
Irish Non-Irish
Adding Dropping 1-Year Continue Adding Dropping 1-Year Continue
2005 351 393 645 602 287 327 421 410
2006 369 391 651 570 259 318 392 368
2007 335 402 669 578 257 283 366 337
2008 342 314 555 591 231 244 307 362
2009 404 322 601 609 269 232 344 344
2010 398 331 637 651 255 257 344 360
2011 434 399 727 655 249 270 355 342
2012 450 381 678 697 246 253 330 366
2013 433 408 689 732 237 263 338 355
2014 410 427 674 747 224 244 326 343
2015 742 838 330 357
Firms Changing Product Mix – Number of Firms

New products can be very short-lived
Product Survival Rates by Size (Percentage of Irish Firms)

Even for experienced exporters
Product Survival by Years of Export Experience (Percentage of Irish Firms)

Similar dynamics for new markets…
Number of Firms Changing Destinations
Irish Non-Irish
Enters Exits 1-Year Continue Enters Exits 1-Year Continue
2005 293 314 405 580 238 265 289 392
2006 313 343 433 549 208 265 260 356
2007 311 321 433 547 201 242 269 325
2008 297 284 358 559 202 198 217 342
2009 368 269 405 579 222 204 250 326
2010 383 241 448 611 237 189 247 339
2011 430 303 505 623 220 225 255 321
2012 400 330 480 681 216 207 257 345
2013 411 352 491 697 202 233 233 335
2014 405 356 497 723 194 228 228 320
2015 576 784 264 324

Similar dynamics for new markets…
Destination Survival Rates by Size (Percentage of Irish Firms)

Even for experienced exporters
Destination Survival by Years of Export Experience (Percentage of Irish Firms)

Export levels mainly due to established products and destinations
Shows total exports divided into percentage contributions of extensive
margins (number of products and destinations) and intensive margin
(average sales) using regression analysis.
All Exporters Share
Number of products 0.178***
Average exports per product 0.822***
Number of destinations 0.153***
Average exports per destination 0.847***
Regression Decomposition of Irish Firms’ Exports into
Extensive and Intensive Margins

But growth driven by entry & exit
Total Growth Continuers Entry Exit
Firm Changes
Irish 0.068 0.038 0.048 -0.018
Foreign 0.066 0.069 0.027 -0.030
Product Changes
Irish 0.068 0.031 0.093 -0.055
Foreign 0.066 0.051 0.071 -0.056
Destination Changes
Irish 0.068 0.038 0.079 -0.048
Foreign 0.066 0.055 0.056 -0.046
Percentage Contributions to Export Growth (Average 1996-2015)

Young exporters grow particularly rapidly
Total Growth Continuers Entry Exit
Product Changes
Experience 1-5 years 0.251 -0.135 0.475 -0.089
Experience 6-10 years -0.068 -0.060 0.028 -0.036
Experience >10 years 0.035 0.052 0.033 -0.050
Destination Changes
Experience 1-5 years 0.251 -0.151 0.465 -0.063
Experience 6-10 years -0.068 -0.033 0.024 -0.060
Experience >10 years 0.035 0.064 0.023 -0.053
Percentage Contributions to Export Growth (Average 1996-2015)
Key messages – part 2
Exporting is risky.
Continuing exporters are very dynamic -frequently introduce new products, drop products and enter and exit markets.
Exports sales dominated by existing product-market combinations.
However, growth is largely driven by entry of new firms and movement of exporters into new products and new markets.
Demonstrates importance of on-going support for firms taking risks moving into new product and market areas.
Support for innovation and ongoing adjustment and experimentation is a key policy takeaway for success of exporting firms

Services Exports and Exporters of Services
Introduction
International trade in services has been the fastest growing component of international trade (representing 21 per cent of world trade in goods and services in 2014).
Services formed approximately 40 per cent of total Irish exports in 2015.
Limited level of detail available in any country on services trade flows and the activities of firms exporting services.
Research questions
How important is Irish trade in services?
What are the participation rates of services firms in exporting?
How concentrated is trade in services?
What are the most important sectors?
Differences between exporters and non exporters?

Data source
Firm-level data collected through the Annual Services Inquiry (ASI) to examine the participation of non-financial services firms in exporting.
The ASI is based on a census of firms with 20 and more persons and a stratified random sample for firms with less than 20 persons.
The latest available information from the CSO indicates that about 18,000 firms were covered by the ASI.
Studied period 2008-2012.

Definition of trade in services
The General Agreement on Trade in Services (GATS) describes four modes through which services may be traded: Mode 1: Cross-border supply – the supplier in one country delivers a
service to a customer in another country remotely (e.g. via e-mail, telephone) without either supplier or customer moving location.
Mode 2: Consumption abroad – the customer travels to the country in which the supplier is located in order to avail of the service (e.g. tourism exports).
Mode 3: Commercial presence – firms supply services in another country through the presence of an affiliate in that country.
Mode 4: Presence of natural persons – the supplier travels to the country in which the customer is located in order to supply the service (e.g. business consultancy).
CSO uses this definition excluding Mode 3

Exporting is rarer in services than in goods…
Year % Share of
exporters
% Share of
serv. exp.
% Share of
goods exp.
% Share of
both exp.
2008 1.7 33.3 60.8 5.9
2009 2.0 33.1 60.3 6.6
2010 2.2 39.5 49.9 10.6
2011 2.1 38.6 50.5 10.8
2012 2.3 41.0 45.4 13.6
Shares of firms by year

And dominated by foreign firms
Total exports of services (€000s)
Year Total Foreign Irish
% Share
foreign
% Share
Irish
2008 16,794,603 13,132,846 3,661,757 78 22
2009 15,933,875 13,970,620 1,963,255 88 12
2010 34,753,887 31,528,385 3,225,501 91 9
2011 38,480,595 35,944,191 2,530,913 93 7
2012 47,106,117 43,545,699 3,560,418 92 8

What do they export?
0%
10%
20%
30%
40%
50%
60%
70%
80%
90%
2008 2009 2010 2011 2012 2008 2009 2010 2011 2012
All Sectors Excluding retail/wholesale
Foreign Irish
Average Share of Services in Firm Exports (2008-2012)

Exports are highly concentrated…
Nace
2 Description
%
Share
of
firms
Total
exports
(€000s)
% Share
in total
exports
% Share
of exp. in
sales
Av.
Exports
by firm
(€000s)
58 &
62
Publishing activities and
computer programming 4.5 20,342,938 47.43% 71.26 5,446
46
Wholesale trade, except of
motor vehicles 8.1 11,762,272 27.43% 19.98 1,734
63 Information service activities 0.1 5,928,689 13.82% 76.94 50,031
51 Air transport 0.0 579,049 1.35% 11.43 24,905
72
Scientific research and
development 0.2 534,113 1.25% 69.70 2,915
Total 12.9 91.28%
47
Retail trade, except of motor
vehicles 17.6 224,255 0.52% 0.67 15
Total exports by sector, all firms (2008-2012)

But less amongst Irish firms Exports by sector: Irish
Nace
2 Description
%
Share
of
firms
%
Share
in total
exports
46
Wholesale trade, except
of motor vehicles and
motorcycles 7.7 33.52
58 &
62
Publishing activities and
computer programming 4.3 21.19
51 Air transport 0.0 7.52
72
Scientific research and
development 0.2 5.80
52
Warehousing and
support activities for
transportation 0.7 4.85
69
Legal and accounting
activities 7.0 4.60
Total 19.9 77.5
Nace
2
Description
%
Share
of
firms
%
Share in
total
exports
58 &
62
Publishing activities and
computer programming 11.81 51.94
46
Wholesale trade, except
of motor vehicles and
motorcycles 28.94 26.38
63
Information service
activities 0.46 16.11
71
Architectural and
engineering activities 3.73 1.10
61 Telecommunications 0.84 0.71
Total 45.8 96.2
Exports by sector: foreign

Importance of online sales
Summary statistics for online sales (€000s)
Year Ownership Exporter of services
Foreign Irish Non-Exporter Exporter
2008 Av. % share online sales 17 6 6 18
Av. online sales 10,717 1,298 1,456 18,002
2009 Av. % share online sales 14 4 4 19
Av. online sales 27,992 1,024 2,097 27,164
Number of firms 2,901 121,736 123,627 1,010
2010 Av. % share online sales 14 4 4 22
Av. online sales 31,181 1,520 1,977 52,429
2011 Av. % share online sales 13 4 4 24
Av. online sales 24,108 1,182 1,721 37,485
2012 Av. % share online sales 14 4 4 27
Av. online sales 14,069 2,004 2,373 19,019

Exporters outperform non-exporters
Export premia
Employment Productivity Wages Sales
Online
sales Investment
Exporters
All 21%*** 8.6%*** 14.1%*** 8.6%*** 37.1%*** 6%
Irish 26.5%*** 9.4%*** 17.4%*** 9.4%*** 48.7%*** 9.8%
Foreign 6.9% 7.9 2.4% 15.1%** 9.2% 44.9%***
Exporters of services
All 17.5%*** 13.1%*** 15.7%*** 13.1%*** 40%*** 6.9%
Irish 24.3%*** 8.5%*** 16.6%*** 8.5%*** 29%*** 0.8%
Foreign 12.5%*** 18.2%*** 9.9%*** 18.2%*** 55.4%*** 13.6%

Key messages
The lower participation rate in exporting suggests higher obstacles to becoming an exporter exists in the services area.
Some, but not all, of this can be explained by the non-tradable nature of some sub-sectors.
Exports of services are dominated by foreign-owned firms.
Large differences in export activity and intensity between Irish and foreign firms suggests that greater international engagement by indigenous firms is not impossible.

Key messages
In terms of the shares of exports accounted for by different sectors within services, publishing activities and computer programming dominate services exports when calculated for all firms.
However, exports are less concentrated in the top few sectors amongst Irish firms.
Expansion of the client base plays a much larger role in firm export growth for services firms than it does for goods exporters.