Ireland economic crisis
21
IRELAND ECONOMIC CRISIS 2008 This document discusses about the causes and effects of the Ireland crisis occurred during the 2008 period and the measures taken by government to come out of the crisis. It also covers the trends in Macroeconomic indicators before and after the crisis period
-
Upload
vyas-vemuri -
Category
Economy & Finance
-
view
110 -
download
1
Transcript of Ireland economic crisis

IRELAND ECONOMIC CRISIS
2008 This document discusses about the causes and effects of the Ireland crisis occurred during the 2008 period and the measures taken by government to come out of the crisis. It also covers the trends in Macroeconomic indicators before and after the crisis period

2 | P a g e
Table of Contents
Causes For Ireland Economic Crisis ............................................................................................... 3
THE BEGINNING OF THE CRISIS ..................................................................................................... 3
The crisis erupts .................................................................................................................... 5
Effects of Ireland economic crisis .................................................................................................. 5
Measures adopted to control crisis ............................................................................................... 6
The EU‐IMF Program ........................................................................................................... 6
Stabilizing the Banking Sector ................................................................................................ 6
Fiscal Adjustment ................................................................................................................ 10
A Return to Growth ............................................................................................................. 11
Improving Market Sentiment and Program Exit ..................................................................... 14
Trends in Macro Economic Indicators..……………………………………………………………………………………………14
National Income: ................................................................................................................. 15
Monetary Indicators............................................................................................................. 16
Trade indicators ................................................................................................................... 17
Fiscal Indicators ................................................................................................................... 19
Exchange rate ...................................................................................................................... 20
Bibliography .............................................................................................................................. 21
3 | P a g e
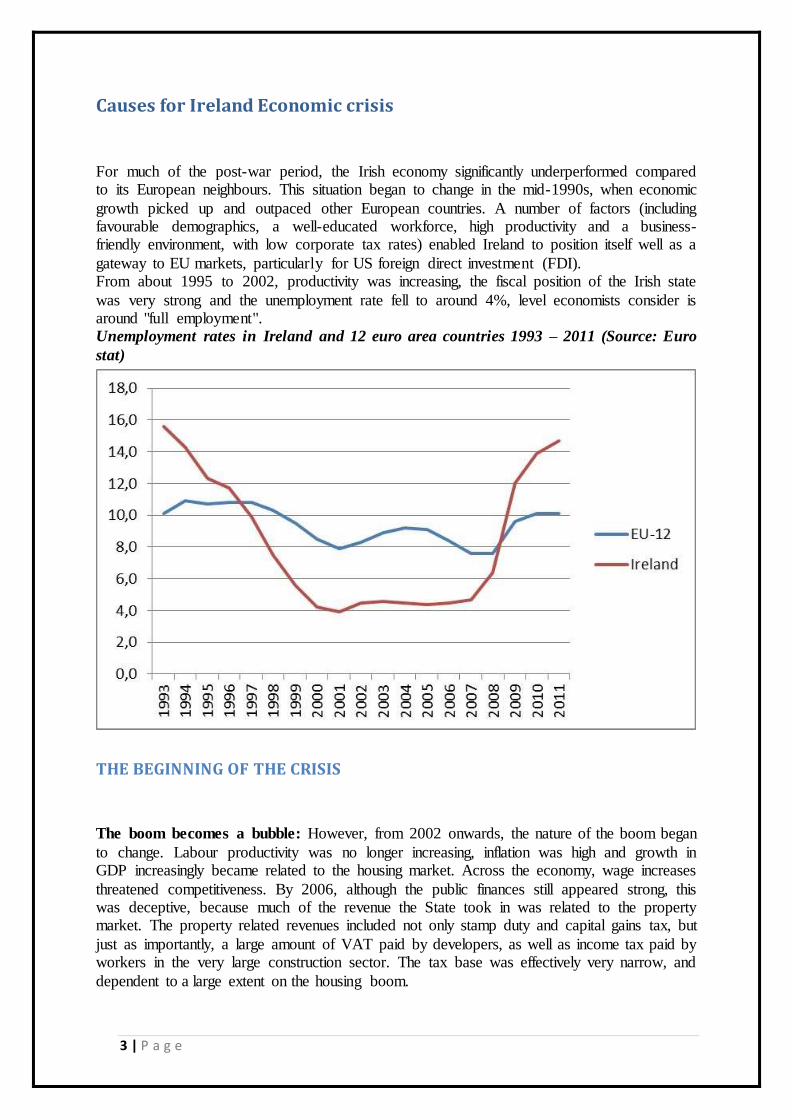
Causes for Ireland Economic crisis
For much of the post-war period, the Irish economy significantly underperformed compared to its European neighbours. This situation began to change in the mid-1990s, when economic
growth picked up and outpaced other European countries. A number of factors (including favourable demographics, a well-educated workforce, high productivity and a business-friendly environment, with low corporate tax rates) enabled Ireland to position itself well as a
gateway to EU markets, particularly for US foreign direct investment (FDI). From about 1995 to 2002, productivity was increasing, the fiscal position of the Irish state
was very strong and the unemployment rate fell to around 4%, level economists consider is around "full employment". Unemployment rates in Ireland and 12 euro area countries 1993 – 2011 (Source: Euro
stat)
THE BEGINNING OF THE CRISIS
The boom becomes a bubble: However, from 2002 onwards, the nature of the boom began
to change. Labour productivity was no longer increasing, inflation was high and growth in GDP increasingly became related to the housing market. Across the economy, wage increases
threatened competitiveness. By 2006, although the public finances still appeared strong, this was deceptive, because much of the revenue the State took in was related to the property market. The property related revenues included not only stamp duty and capital gains tax, but
just as importantly, a large amount of VAT paid by developers, as well as income tax paid by workers in the very large construction sector. The tax base was effectively very narrow, and
dependent to a large extent on the housing boom.

4 | P a g e
The collapse in property related tax show in below graph
Despite this risk, Ireland continued to increase its public expenditure, funding expensive
capital projects, but also allowing some categories of current spending to rise very rapidly.
The speculative bubble in property was supported by a surge in bank lending, and the balance
sheets of Irish banks grew disproportionately large relative to the size of the economy. The banks had traditionally relied on their deposit base to fund their lending activity. However, greater financial integration, spurred in part by the birth of the euro, allowed them to turn
more and more to short-term borrowing from abroad, from so-called wholesale money markets. This period also saw a global increase in risk appetite by financial markets, and Irish
banks were caught up in this.
This was reflected in both a concentration of lending in property, and increasingly risky lending practices, both of which would prove highly damaging when the bubble burst. In
addition, so-called ‘light touch’ oversight of banks meant that there were failures by supervisors and regulators to identify and act on risks that were emerging in the financial
system. The growth in public spending also contributed to the exuberance in the property market.
5 | P a g e
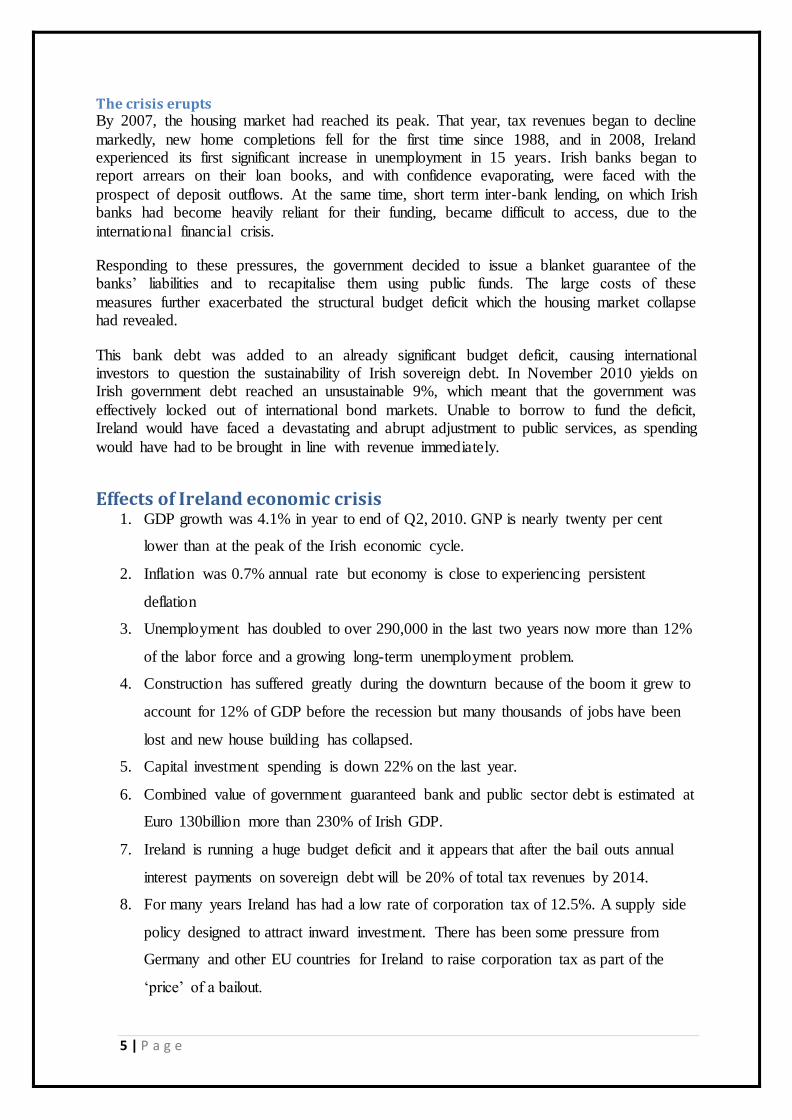
The crisis erupts By 2007, the housing market had reached its peak. That year, tax revenues began to decline
markedly, new home completions fell for the first time since 1988, and in 2008, Ireland experienced its first significant increase in unemployment in 15 years. Irish banks began to report arrears on their loan books, and with confidence evaporating, were faced with the
prospect of deposit outflows. At the same time, short term inter-bank lending, on which Irish banks had become heavily reliant for their funding, became difficult to access, due to the
international financial crisis.
Responding to these pressures, the government decided to issue a blanket guarantee of the banks’ liabilities and to recapitalise them using public funds. The large costs of these
measures further exacerbated the structural budget deficit which the housing market collapse had revealed.
This bank debt was added to an already significant budget deficit, causing international investors to question the sustainability of Irish sovereign debt. In November 2010 yields on Irish government debt reached an unsustainable 9%, which meant that the government was
effectively locked out of international bond markets. Unable to borrow to fund the deficit, Ireland would have faced a devastating and abrupt adjustment to public services, as spending
would have had to be brought in line with revenue immediately.
Effects of Ireland economic crisis 1. GDP growth was 4.1% in year to end of Q2, 2010. GNP is nearly twenty per cent
lower than at the peak of the Irish economic cycle.
2. Inflation was 0.7% annual rate but economy is close to experiencing persistent
deflation
3. Unemployment has doubled to over 290,000 in the last two years now more than 12%
of the labor force and a growing long-term unemployment problem.
4. Construction has suffered greatly during the downturn because of the boom it grew to
account for 12% of GDP before the recession but many thousands of jobs have been
lost and new house building has collapsed.
5. Capital investment spending is down 22% on the last year.
6. Combined value of government guaranteed bank and public sector debt is estimated at
Euro 130billion more than 230% of Irish GDP.
7. Ireland is running a huge budget deficit and it appears that after the bail outs annual
interest payments on sovereign debt will be 20% of total tax revenues by 2014.
8. For many years Ireland has had a low rate of corporation tax of 12.5%. A supply side
policy designed to attract inward investment. There has been some pressure from
Germany and other EU countries for Ireland to raise corporation tax as part of the
‘price’ of a bailout.

6 | P a g e
Measures adopted to control crisis
The EU‐IMF Program
In late November 2010, the Irish government agreed a multi‐year funding deal with the EU
and the IMF. Despite not providing any official money as part of the program, the ECB
were involved in over‐seeing the program along with the European Commission and the IMF, thus seeing the birth of the so‐called “troika”. The program provided funding commitments
of €67.5 billion, two‐thirds of which would come from the European funds. In return for this
funding, the program contained commitments to restructure the banking sector, to implement further fiscal adjustment and to introduce various reforms. This section describes the various
elements of the program and the performance of the Irish economy over this period.
Stabilizing the Banking Sector The first priority for the program was to stabilize the banking sector. It was announced that
the Irish government were providing an additional €17.5 billion (mainly from the National Pension Reserve Fund) towards bank recapitalization. Thus, the total amount of funds available was €85 billion, with €35 billion of that earmarked for potential use in bank
recapitalization after the conduct of a comprehensive set of stress tests.
It was hoped that this announcement would prevent further deposit outflows. In fact, at first,
the announcement of the EU‐IMF deal intensified the problem with deposits continuing to flee the Irish banking system and reliance on central bank funding increased even
further. However, the system began to stabilize in Spring 2011. The Central Bank published a “Financial Measures Report” (FMP), a detailed document that set out loss estimates for

7 | P a g e
various parts of the loan books of the domestic Irish banks under stress scenarios and capitalization requirements to cover these losses. The report also established a set of
deleveraging targets that would see the banks reduce their reliance on ECB borrowing.
The program set recapitalization requirements of €24 billion for the four banks that were
examined; the other two covered banks (Anglo and Irish Nationwide) were merged and put into wind‐down. Some of this recapitalization came from write‐downs of subordinated
bonds, a development enabled by the passage of new legislation that gave the Minister for Finance wide powers to enforce coercive write‐downs of subordinated (but not senior) bonds
in banks requiring state assistance. Bank of Ireland obtained private equity investment and remained in majority private ownership but the other banks did not. The state forked over
another €16.5 billion for recapitalization purposes and allied and two other banks were nationalized. Of the six banks that were covered by the September 2008 guarantee, only
Bank of Ireland escaped full nationalization.
Including the 2011 recapitalization, the total amount of funds provided by the Irish state to recapitalize its banking sector has come in at about €63 billion or approximately 40 per cent
of current GDP. As illustrated in Figure 12, this means that the bank bailout has contributed less than half of the increase in the ratio of public debt to GDP from 20 percent to 120 percent, with the rest of the increase mainly reflecting the large deficits that have been run
over this period. For this reason, it is not correct to blame Ireland’s recent fiscal austerity on bank bailouts. Even without spending a cent on bank bailouts, Ireland’s debt ratio in 2013
would be over 80 percent of GDP and rising. Without the significant fiscal adjustment that has taken place, it is likely that Ireland would have required an EU‐IMF program even had
there been no bank recapitalization. What is less arguable, however, is that the banking‐related costs probably made the difference between Ireland having to enter a formal
adjustment program in 2010 versus muddling through on its own.
8 | P a g e
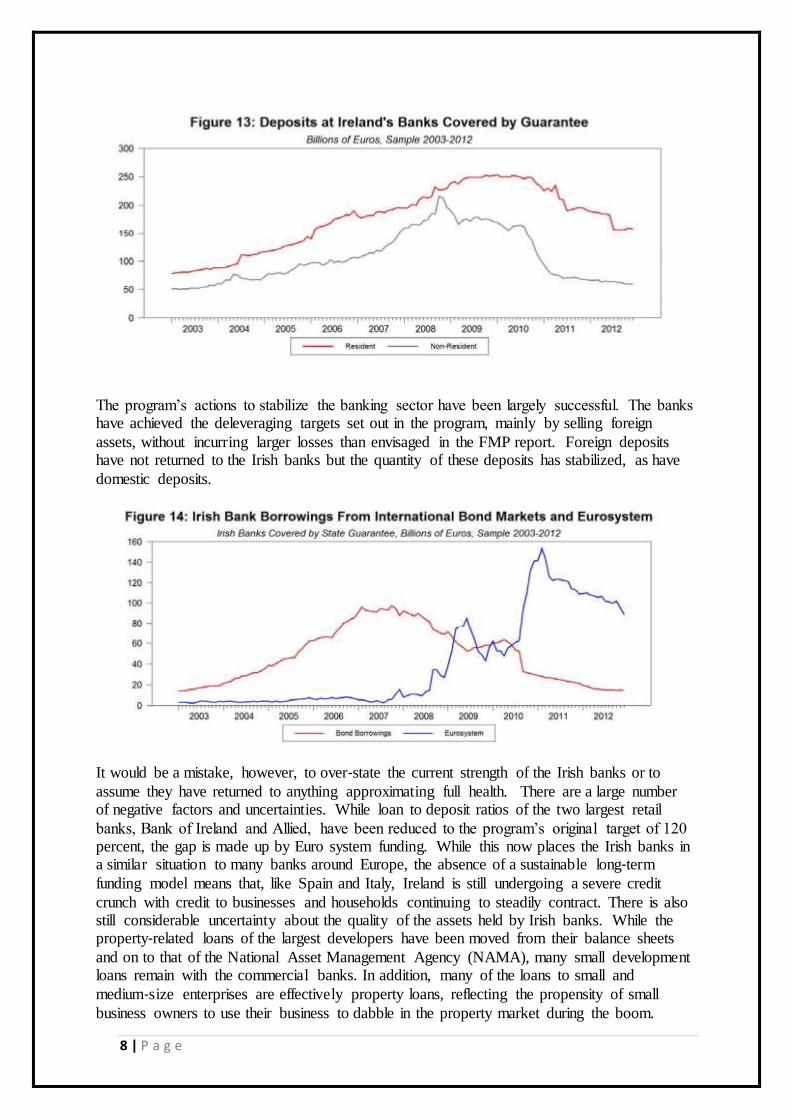
The program’s actions to stabilize the banking sector have been largely successful. The banks have achieved the deleveraging targets set out in the program, mainly by selling foreign
assets, without incurring larger losses than envisaged in the FMP report. Foreign deposits have not returned to the Irish banks but the quantity of these deposits has stabilized, as have
domestic deposits.
It would be a mistake, however, to over‐state the current strength of the Irish banks or to
assume they have returned to anything approximating full health. There are a large number of negative factors and uncertainties. While loan to deposit ratios of the two largest retail
banks, Bank of Ireland and Allied, have been reduced to the program’s original target of 120 percent, the gap is made up by Euro system funding. While this now places the Irish banks in a similar situation to many banks around Europe, the absence of a sustainable long‐term
funding model means that, like Spain and Italy, Ireland is still undergoing a severe credit
crunch with credit to businesses and households continuing to steadily contract. There is also still considerable uncertainty about the quality of the assets held by Irish banks. While the property‐related loans of the largest developers have been moved from their balance sheets
and on to that of the National Asset Management Agency (NAMA), many small development loans remain with the commercial banks. In addition, many of the loans to small and
medium‐size enterprises are effectively property loans, reflecting the propensity of small
business owners to use their business to dabble in the property market during the boom.

9 | P a g e
Ireland also has a burgeoning mortgage crisis with levels of arrears that far outstrip every other country in Europe. By the end of 2012, almost one in five mortgages on primary
residences was in arrears, with most of these over 90 days in arrears and a growing number falling ever further behind. (There is also a substantial stock of buy‐to‐let mortgages that are
performing even worse than those backed by primary residences. Most of these mortgages in arrears are also in negative equity, many significantly so. While the FMP report from 2011
provided detailed estimates of the losses likely to be incurred on mortgage books, this report assumed that unsustainable mortgages would quickly be dealt with via a wave of
repossessions. In practice, Ireland’s Dickensian legal framework relating to personal debt prevented any quick resolution of the mortgage crisis. As of mid‐2013, there are signs that
the banks are finally making some progress to restructure unsustainable mortgages but, until this process is further advanced, it will be difficult to estimate the full scale of
mortgage‐related losses.

10 | P a g e
These problems with asset quality would be less serious if the Irish banks were making reasonable operating profits. However, international competition for deposits has raised
funding costs while the large amount of ECB “tracker” mortgages issued by the two state‐owned banks, Allied and Permanent TSB, are depressing their net interest margins. The
banks are engaged in rationalizations of their branch networks and other cost‐cutting
operations but it is unclear at this point whether operational profits can offset unrealized loan losses and stave off a further round of recapitalization requirements. Another set of stress
tests are due during 2014 and the future of these banks may depend on the findings reported from these tests.
Fiscal Adjustment Ireland has made slow but steady progress in reducing its fiscal deficit and meeting the
program’s fiscal targets. A €5.4 billion fiscal adjustment (about three percent of GDP) was introduced in December 2010 in the waning days of the Fianna Fail\Green Party coalition
government to satisfy the first fiscal requirements of the EU‐IMF program. The election of February 2011 featured plenty of brave claims from opposition politicians that they planned
to renegotiate this program in various ways. However, the Fine Gael\Labour coalition government that won the election has barely changed the core conditions of the program and
have continued to implement the fiscal adjustments dictated by the agreements, with a further fiscal adjustments of €3.5 billion introduced in budgets in December 2011 and December 2012.
The fiscal targets set down in the program have been met and the government has benefited from a number of developments. First, there have been substantial adjustments to the
program’s financing costs. The initial design of the program saw the €45 billion in funds provided by the European Union carrying profit margins of around 300 basis points and having an average maturity of 7.5 years. After Greece negotiated to have profit margins on
its loans eliminated, the same deal was passed on to Ireland and a deal has recently been agreed to extend the maturity of these loans. Taken together, these concessions have
significantly reduced the annual cost of the bailout funds and reduced the medium‐term financing requirements associated with Ireland’s debt.
Second, the arrangements put in place to recapitalize Anglo Irish Bank have been
renegotiated. These arrangements had required the Irish taxpayer to provide the bank with
promissory note payments of €3.1 billion per year (about 2 percent of GDP) over the next decade mainly to allow the bank to repay its ELA debts.11 In February 2013, Anglo was liquidated and the Central Bank was compensated for its ELA loans by the provision of
government bonds. The ECB Governing Council has required that these government bonds be sold to the private sector gradually over time, so the replacement of the promissory notes
with these bonds has not changed Ireland’s public debt. However, the new arrangement does appear to provide more flexibility in relation to dealing with the burden generated by the decision to bail out Anglo Irish and Irish Nationwide.
The execution of the fiscal side of the program has been good, with spending targets being met. While this reflects well on the current government and on the Irish civil service, the
discipline in spending has been enforced by the need to meet troika targets. For example, spending on health and social welfare has consistently run ahead of targets but overall spending targets have been met because adjustment has been made elsewhere. It is perhaps

11 | P a g e
unlikely that this kind of spending discipline could have been maintained outside a formal program. Furthermore, while there has been a strong political narrative that the current
government has taken many brave decisions during the program to “restore the reputation of the country” it is worth noting that only €7.3 billion of the cumulated fiscal adjustment of
€28.8 billion from 2007‐2013 has taken place under the post‐2011 government. If credit is to be applied, it is perhaps best awarded, not to individual political parties, but rather to the Irish
people who have accepted the extraordinary scale of fiscal adjustment with a remarkable level of equanimity and without any significant turn towards radical politics. Still, with so
many spending cuts and tax increases having been implemented already, there is an increasing sense of “austerity fatigue” and the planned spending cuts and tax increases over the next few years are likely to cause more political problems than those seen up to now.
A Return to Growth Ireland’s budget deficit was still projected to be about 7.3 percent of GDP in 2013. The European Commission projected that the deficit would decline to 4.3 percent in 2014 and 2.1
percent in 2015, by which time the primary budget was projected to record a surplus of 3 percent. These improvements partly reflect further planned fiscal consolidation but they were
also reliant on projections that real GDP growth will return towards 3 percent in the coming years.
There are good grounds for scepticism about the European Commission’s growth projections. For each of the countries in the euro area, official forecasts have been projecting a gradual
return to healthy economic growth for a number of years, only to have the forecasted recovery to be continually delayed. In Ireland’s case, however, there are somewhat greater
grounds for optimism. Perhaps surprisingly, Ireland’s economy bottomed out in late 2010, right as the EU‐IMF agreement was signed. After declining steadily from early 2008
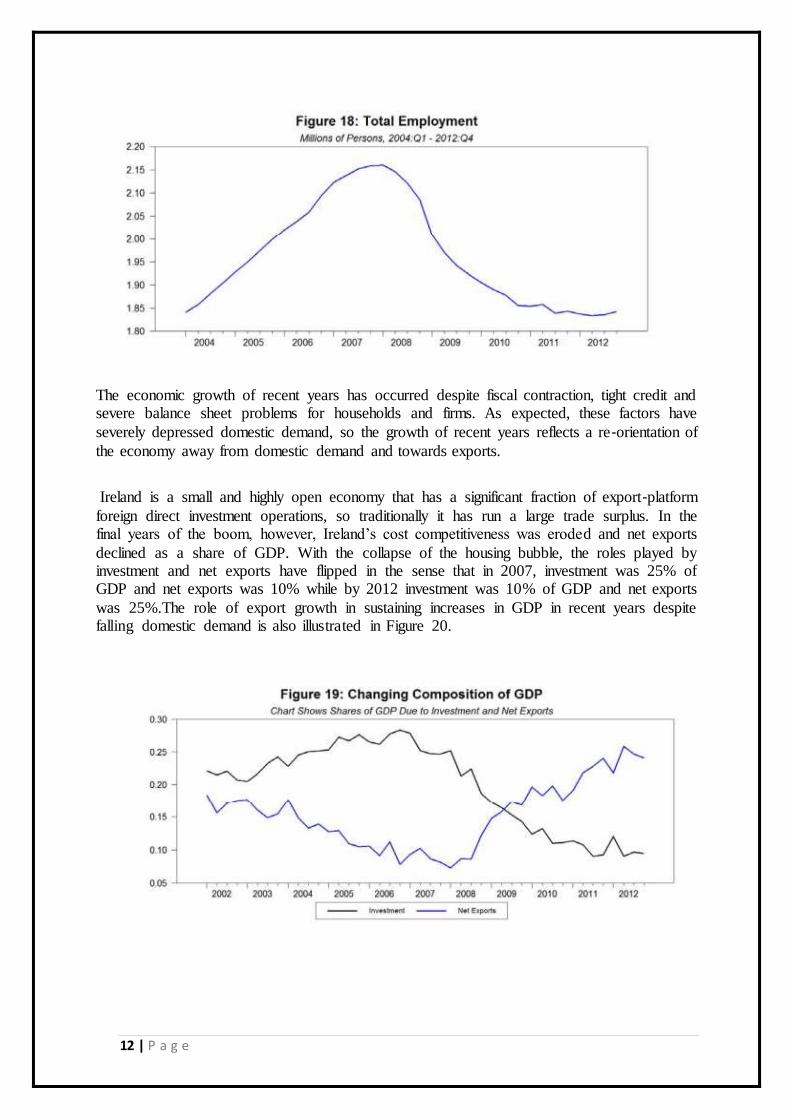
onwards, the economy recorded tentative growth in 2011 and 2012, with GDP growing by 1.4 percent and 0.9 percent respectively. (See Figure 17) Employment, which had fallen 18
percent from its peak level, began to flatten out in 2011 but has yet to show signs of significant growth.
12 | P a g e
The economic growth of recent years has occurred despite fiscal contraction, tight credit and severe balance sheet problems for households and firms. As expected, these factors have
severely depressed domestic demand, so the growth of recent years reflects a re‐orientation of
the economy away from domestic demand and towards exports.
Ireland is a small and highly open economy that has a significant fraction of export‐platform
foreign direct investment operations, so traditionally it has run a large trade surplus. In the final years of the boom, however, Ireland’s cost competitiveness was eroded and net exports
declined as a share of GDP. With the collapse of the housing bubble, the roles played by investment and net exports have flipped in the sense that in 2007, investment was 25% of GDP and net exports was 10% while by 2012 investment was 10% of GDP and net exports
was 25%.The role of export growth in sustaining increases in GDP in recent years despite falling domestic demand is also illustrated in Figure 20.

13 | P a g e
Ireland’s export growth in recent years partly reflects an improvement in competitiveness. Figure 21 reports indexes of unit labor costs for various euro area
countries. It shows that Ireland has had the most significant improvement in unit labor costs of any of the crisis countries. Still, this improvement has only made up part of the loss of
competitiveness relative to Germany that was built up during the boom period.

14 | P a g e
In terms of broader concepts of cost competitiveness, Figure 22 reports figures from Eurostat showing comparable price levels for a selected group of EU countries. Ireland went from
being an average EU country in terms of the cost of living in 1995 to being 30 percent more expensive than the average in 2008. With consumer prices down on average from their level
in 2008, about half of this excess has been eliminated but Ireland remains a pretty expensive place to live and this acts as a constraint on competitiveness. This improvement in competitiveness partly reflects the depressed state of the labour market but it also reflects the
fact that the Irish economy is relatively flexible.
Improving Market Sentiment and Program Exit In the months after the EU‐IMF agreement, market sentiment towards Irish debt worsened.
With the situation in Greece heading towards a sovereign default, investors worried that
Ireland would be among the other countries that would subsequently default. However, from August 2011 onwards, Ireland’s status as a relative success story among Europe’s high‐debt
countries has been reflected in a gradual improvement in market sentiment towards the country’s debt. Some of the positive developments reflected Irish‐specific factors, such as the return to
growth, the June 2012 statement of Euro area finance ministers that the burden of Ireland’s
bank‐related debt should be re‐examined and the subsequent renegotiation in February 2013 of the debt related Anglo and Irish Nationwide. Other factors reflected Euro zone
developments such as the introduction of the LTRO program in late 2011 and Mario Draghi’s “whatever it takes” speech and the Outright Monetary Transactions (OMT) announcement in
2012. As of mid‐2013, Ireland’s sovereign debt rates have returned to pre‐crisis level and the
country has issued a number of well‐priced long‐term bonds. (See Figure 23.) These
fund‐raising efforts mean that Ireland has sufficient cash on hand to finance budget deficits and bond rollovers through to the end of 2014. This means the country is nearly certain to
officially exit from the EU‐IMF program, a development that is likely to generate good headlines all around Europe. Still, Ireland’s economic situation remains precarious and the
negotiation of a precautionary agreement with the European Stabilization Mechanism as well as establishing eligibility for the ECB’s OMT purchases are likely events, so program
conditionality of some sort is likely to remain a feature of Irish policy‐making for years to come.

15 | P a g e
Trends in Macroeconomic Indicators:
National Income: The national income indicators like GDP, GNP, and GNI are taken from 2005 to 2013 to
understand the effect of the economic crisis occurred in 2008
The following is the table showing the data from 2005 to 2013
The graph is plotted from 2005 to 2013 to understand the direction of the national income pre
and post economic crisis
0
20,000
40,000
60,000
80,000
100,000
120,000
140,000
160,000
180,000
200,000
2005 2006 2007 2008 2009 2010 2011 2012 2013
Mili
ion
YEAR
GDP
GNP
GNI

16 | P a g e
The percentage change are taken to understand the intensity of the change happening annually and specifically during the economic crisis period
As you can see from the above three data and graphs we can clearly understand the dip in the
national income indicators during 2007-2008 and it continued to dip till 2012 for GDP and till 2011 for both GNP and GNI.
Monetary Indicators Monetary indicators like CPI (consumer price Index), interest rates are taken to analyse the trends
Due to economic crisis the CPI shoot up and it started decreasing from year ending of 2009.

17 | P a g e
As the country was stable during 2010 and was doing better the inflation came down and even went into disinflation of -6.5 and slowly it increased and it is now slightly below 0.
The Ireland country is decreasing there interest rates, as you can see from 2012 as the
inflation is decreasing below zero, it is trying to bring in liquidity into economy by reducing the interest rates
Trade indicators Imports done from 2005 to 2013 is taken to understand the trade done and the country health in trading
Exports done from 2005 to 2013 is taken to understand the country’s strength in manufacturing and other sectors

18 | P a g e
To understand the balance between the imports and exports the Balance of trade is taken from 2005 to 2013 to understand during the crisis period
Gold reserves are important to understand the country’s emphasis on the stability and to
maintain a stable currency

19 | P a g e
Fiscal Indicators
Unemployment is a major concern for a country’s growth. If the unemployment is high it
means there is no growth contribution
Debt taken by the country needs to be checked regularly and needs to be cleared ore else the liability will be increased
20 | P a g e
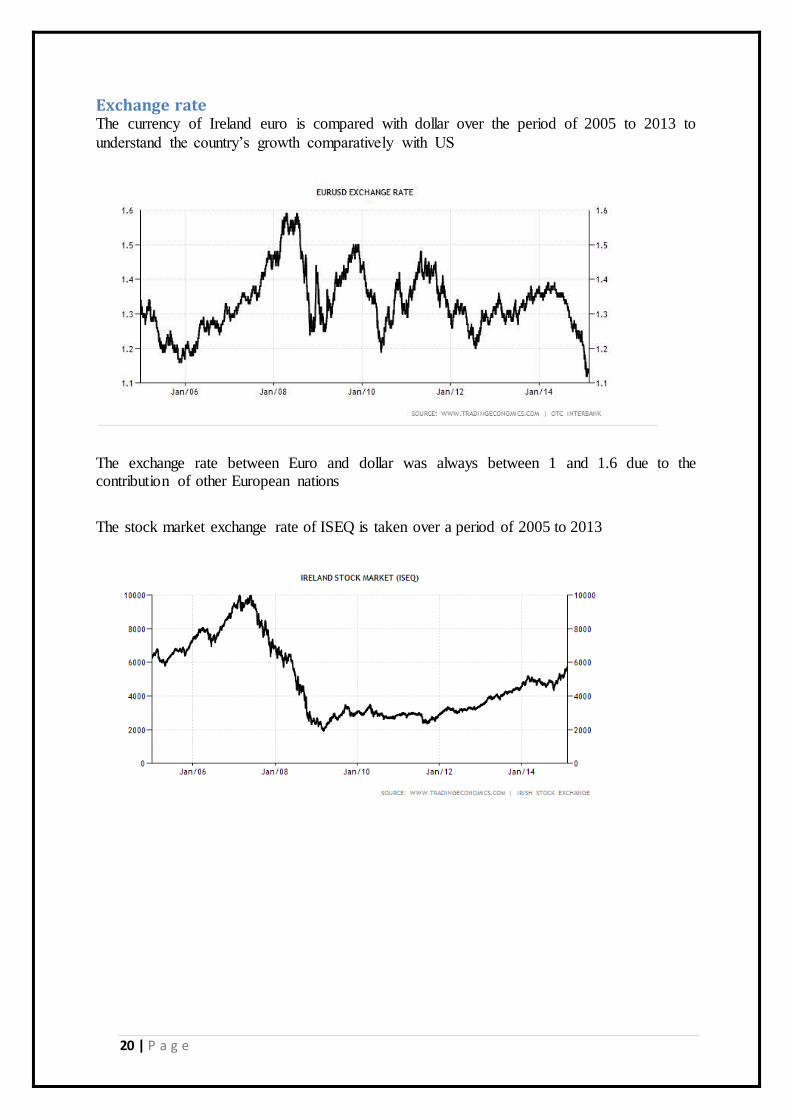
Exchange rate The currency of Ireland euro is compared with dollar over the period of 2005 to 2013 to
understand the country’s growth comparatively with US
The exchange rate between Euro and dollar was always between 1 and 1.6 due to the contribution of other European nations
The stock market exchange rate of ISEQ is taken over a period of 2005 to 2013

21 | P a g e
Bibliography:
http://www.tradingeconomics.com/
http://www.cso.ie/multiquicktables/quickTables.aspx?id=n1302
http://ec.europa.eu/ireland/key-eu-policy-areas/economy/irelands-economic-crisis/index_en.html
http://www.theglobeandmail.com/report-on-business/international-business/european-
business/ireland- is- its-recovery-sustainable/article16402437/
http://en.wikipedia.org/wiki/Post-2008_Irish_banking_crisis
http://www.karlwhelan.com/Papers/Whelan-IrelandPaper-June2013.pdf
http://www.centralbank.gov.cy/media/pdf_gr/Ir_economic_crisis.pdf
http://www.bbc.com/news/business-20207064