IPO Review Full-year and Q4 2017 - pwc.com · Source: S&P Capital IQ with analysis by PwC $13,697...
64
Global Technology IPO Review Full- y ear and Q4 201 7
Transcript of IPO Review Full-year and Q4 2017 - pwc.com · Source: S&P Capital IQ with analysis by PwC $13,697...

Global Technology IPO Review Full-year and Q4 2017
Global Technology IPO Review Full-year and Q4 2017 1
The global tech IPO market closed 2017 with recovery and hope for resurgent 2018 *
Raman Chitkara Partner and Global Technology Industry Leader PricewaterhouseCoopers LLP [email protected]
After a sluggish 2016, the global technology IPO market rebounded in 2017 against the backdrop of a stable economy, strong performance of capital markets, and decreasing market volatility in many regions. The total proceeds reached US$25.1 billion with the number of IPOs reaching 100. The Asian market continued to dominate, contributing 65% of the total listings for the year. The China IPO market outpaced the United States with the number of listings; however, a lack of a mega IPO in China left that market unable to match the proceeding of total US IPOs.
The US technology IPO market picked up pace in 2017 with a total of 24 listings raising US$8.1 billion. However, the US tech IPO market underperformed in 2017 when compared to the positive investment climate created by the strong bull capital markets. While the US did well in terms of proceeds, it received stiff competition from China. Cross-border listings in the US from China declined as more companies opted for IPOs in their home markets.
The year also witnessed some mega IPO deals across various geographies including Snap Inc., Netmarble Games Corporation, Landis+Gyr Group AG, and China Literature Limited; however, these could not raise the total proceeds to match or exceed the 2014 and 2015 numbers.
Against a background of uncertainties associated with Brexit, the UK numbers failed to paint a happier picture. On a positive note, the country did have two IPOs this year compared to 2016, which had no listings.
From a subsector perspective, Internet Software & Services maintained its dominance with 27 IPOs raising US$13.7 billion, while the Electronics subsector emerged as a new star.
Where the United States Securities and Exchange Commission decided to make the IPO process easier, the China Securities Regulatory Commission introduced stringent measures to make the IPO process more transparent with a goal to improve the quality of the companies being listed. The UK’s Financial Conduct Authority has also introduced new rules for UK IPOs that will come into force from July 1, 2018.
With the global economy embarking on growth momentum and major markets demonstrating a high level of optimism, 2018 is starting on a positive note for tech IPOs.
Sincerely,
*Issue size greater than US$40 million (includes overallotment) and based on trade date; See Methodology

Table of contents
1. Full-year 2017 global tech IPO summary 3 2. A close look at full-year 2017 technology IPOs 9
Geographic IPO trends – full-year 2017 ........................................................................................................................................ 9 Europe and the UK ................................................................................................................................................................... 9 China ....................................................................................................................................................................................... 10 United States ........................................................................................................................................................................... 11 Full-year 2017 tech IPOs – Offering details ............................................................................................................................ 12
3. Q4 2017 global tech IPO summary 18 Q4 2017 top 10 technology listings ................................................................................................................................................ 19 Q4 2017 geographic tech IPO trends ............................................................................................................................................. 21
US ............................................................................................................................................................................................ 22 China ....................................................................................................................................................................................... 23 Europe (excluding the UK) ..................................................................................................................................................... 24 UK ........................................................................................................................................................................................... 25 Asia (excluding China) ........................................................................................................................................................... 26
Average proceeds ........................................................................................................................................................................... 27 4. Q4 2017 stock exchange distribution 28 5. Q4 2017 subsector distribution 29 6. Key financials—Q4 2017 33
Q4 2017 Technology IPO listings: Valuation metric .................................................................................................................... 38 Internet Software & Services ........................................................................................................................................................ 40 Software .......................................................................................................................................................................................... 47 Semiconductors ............................................................................................................................................................................. 54
7. Methodology 61 8. For more information 62

Global Technology IPO Review Full-year and Q4 2017 3
Full-year 2017 global tech IPO summary The global tech IPO market rebounds after a depressed 2016 performance The global tech IPO market bounced back in 2017 after a lackluster 2016. With 100 technology IPOs in the year, 2017 volume increased 85% year over year. Resurgence in the US market and the consistently strong Asian markets pulled up the numbers for the year. Year-on-year proceeds surged 168% driven by large IPOs including Snap Inc., Netmarble Games Corporation, Landis+Gyr Group AG, and China Literature Limited.
The Asian market maintained its leadership with US$11,408 million in proceeds and 65 IPOs. Though the US market revived in 2017 after a slack 2016, concerns about the low level of activity in the last few years have gripped the market. Efforts to make the US capital market more attractive may increase the number of companies listing on US stock exchanges.
After a tumultuous 2016 with Brexit and the US elections, 2017 emerged as a stronger, stable, and an optimistic year.
Figure 1: Global tech IPOs 2011-2017
Source: S&P Capital IQ with analysis by PwC
$15,857$23,155
$11,446
$51,193
$27,103
$9,374
$25,116
87
69 64
118
92
54
100
-
20
40
60
80
100
120
140
2011 2012 2013 2014 2015 2016 2017 $-
$10,000
$20,000
$30,000
$40,000
$50,000
$60,000
No.
of I
POs
US$
mill
ions
Total proceeds (US$mn) Total number of IPOs
“The tech IPO market rebounded in 2017 after a weak 2016, producing the second-highest number of listings and the third-highest gross proceeds of the last ten years. However, a lack of major Unicorn IPOs and a lukewarm after-market performance of many IPOs, created a clear sense of underachievement. Looking ahead, with strong economic indicators across the globe, 2018 promises to build on the momentum of 2017.”
Raman Chitkara Global Technology Industry Leader

Global Technology IPO Review Full-year and Q4 2017 4
Sequential momentum in IPOs continued during both halves of 2017 Proceeds and volume of H1 2017 increased by 430% and 96%, respectively, compared to 2016; whereas that of H2 2017 increased by 85% and 77% respectively compared to that of H2 2016. The US proceeds of US$5,255 million were higher in the first half, while proceeds of US$4,647 million from China were higher in the second half.
The second half of the year also witnessed a rise in the number of cross-border IPOs with ten listings in H2 2017 compared to two listings in H1 2017.
The Internet Software & Services subsector had the highest proceeds in H1 with many large IPOs including Snap Inc., MuleSoft, Inc., Netmarble Games Corporation, Delivery Hero AG, and Alfa Financial Software Holdings PLC.
Figure 2: 2011-2017 1st half vs 2nd half tech IPOs
Source: S&P Capital IQ with analysis by PwC
$8,710$7,147
$20,817
$2,338$4,588
$6,858
$18,955
$32,237
$12,225
$14,878
$2,250
$7,125
$11,926$13,190
53
34
19
50
27
37
66
52
59
33
24
30
47
53
-
10
20
30
40
50
60
70
1st Half2011
2ndHalf2011
1st Half2012
2ndHalf2012
1st Half2013
2ndHalf2013
1st Half2014
2ndHalf2014
1st Half2015
2ndHalf2015
1st Half2016
2ndHalf2016
1st Half2017
2ndHalf2017
$-
$5,000
$10,000
$15,000
$20,000
$25,000
$30,000
$35,000
Total proceeds (US$mn) Number of IPOsU
S$m
illio
ns
No.
of I
POs
Global Technology IPO Review Full-year and Q4 2017 5
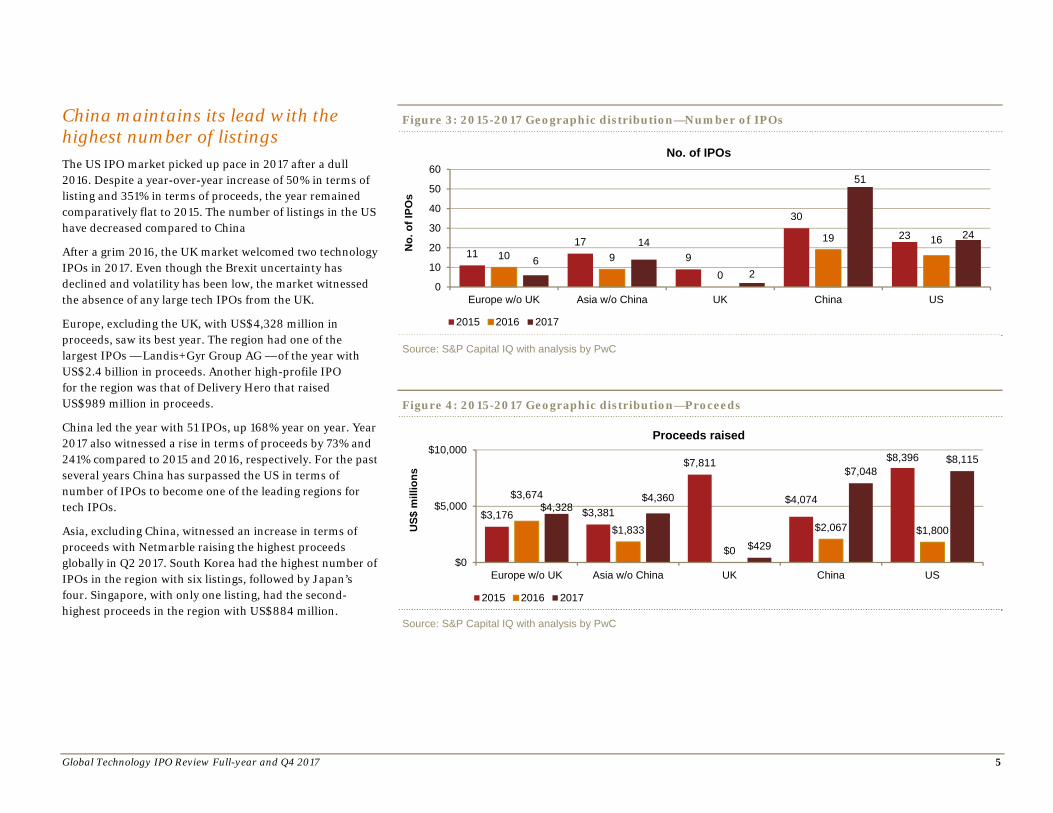
China maintains its lead with the highest number of listings The US IPO market picked up pace in 2017 after a dull 2016. Despite a year-over-year increase of 50% in terms of listing and 351% in terms of proceeds, the year remained comparatively flat to 2015. The number of listings in the US have decreased compared to China
After a grim 2016, the UK market welcomed two technology IPOs in 2017. Even though the Brexit uncertainty has declined and volatility has been low, the market witnessed the absence of any large tech IPOs from the UK.
Europe, excluding the UK, with US$4,328 million in proceeds, saw its best year. The region had one of the largest IPOs — Landis+Gyr Group AG — of the year with US$2.4 billion in proceeds. Another high-profile IPO for the region was that of Delivery Hero that raised US$989 million in proceeds.
China led the year with 51 IPOs, up 168% year on year. Year 2017 also witnessed a rise in terms of proceeds by 73% and 241% compared to 2015 and 2016, respectively. For the past several years China has surpassed the US in terms of number of IPOs to become one of the leading regions for tech IPOs.
Asia, excluding China, witnessed an increase in terms of proceeds with Netmarble raising the highest proceeds globally in Q2 2017. South Korea had the highest number of IPOs in the region with six listings, followed by Japan’s four. Singapore, with only one listing, had the second-highest proceeds in the region with US$884 million.
Figure 3: 2015-2017 Geographic distribution—Number of IPOs
Source: S&P Capital IQ with analysis by PwC
Figure 4: 2015-2017 Geographic distribution—Proceeds
Source: S&P Capital IQ with analysis by PwC
1117
9
30
23
10 90
19 16
6
14
2
51
24
Europe w/o UK Asia w/o China UK China US0
10
20
30
40
50
60No. of IPOs
2015 2016 2017
No.
of I
POs
$3,176 $3,381
$7,811
$4,074
$8,396
$3,674
$1,833
$0
$2,067 $1,800
$4,328$4,360
$429
$7,048$8,115
Europe w/o UK Asia w/o China UK China US$0
$5,000
$10,000Proceeds raised
2015 2016 2017
US$
mill
ions

Global Technology IPO Review Full-year and Q4 2017 6
Internet Software & Services remains the best-performing sector since 2011 The Internet Software & Services segment led the year in terms of proceeds and volume. The sector had some of the largest IPOs of the year including Snap Inc., Netmarble Games Corporation, Delivery Hero AG, China Literature Limited and Qudian Inc. However, the sector performance declined by 33% and 14% in terms of volume and proceeds, respectively, compared to 2016.
The Electronic and the Semiconductors subsectors had their best years in the last six years I n terms of proceeds and volume.
Figure 5: Full-year 2017 subsector distribution
Source: S&P Capital IQ with analysis by PwC
$13,697
$1,915
$908 $895 $1,335
$4,190
$2,176
27
19
5
11
5
16 17
-
5
10
15
20
25
30
Inte
rnet
Sof
twar
e &
Ser
vice
s
Sem
icon
duct
ors
Com
pute
r Sto
rage
& P
erip
hera
ls
Com
mun
icat
ions
Equ
ipm
ent
IT C
onsu
lting
& S
ervi
ces
Ele
ctro
nics
Sof
twar
e
$-
$2,000
$4,000
$6,000
$8,000
$10,000
$12,000
$14,000
Total proceeds (US$mn) Number of IPOs
US$
mill
ions
No.
of I
POs

Global Technology IPO Review Full-year and Q4 2017 7
2017 witnessed IPOs across 20 major exchanges with US stock exchanges leading in terms of proceeds 2017 witnessed listings across 20 major exchanges. The Asian exchanges outnumbered the others in terms of listings with 60 IPOs, whereas the US exchanges led in terms of proceeds with US$10.6 billion.
The NYSE led the year in terms of proceeds, raising US$8.8 billion from 15 IPOs, while the Shenzhen Stock Exchange led in terms of number of listings, with 26 IPOs.
The South Korean stock exchanges grabbed the second position in terms of proceeds, raising US$2.7 billion with just six listings, followed by the Shenzhen Stock Exchange with US$2.4 billion in proceeds.
The Stock Exchange of Hong Kong had its best year in terms of proceeds, raising US$2.1 billion.
Figure 6 2017 Full-year stock exchange distribution
Source: S&P Capital IQ with analysis by PwC
$8,835
$1,727$2,440
$1,550
$2,727
$274
$2,128
$70 $46 $267 $429 $59 $114 $989 $501
$2,422
$50 $59 $91 $340
15
13
26
18
6 4
4 1 1 1 2 1 1 1 1 1 1 1 1 1
-
6
12
18
24
30
NY
SE
Nas
daq
She
nzen
Sha
ngha
i
Sou
th K
orea
Toky
o S
E
The
Sto
ck E
xcha
nge
of H
ong
Kong
Ltd
. (SE
HK
)
BSE
(Indi
a)
Tel A
viv
Eur
onex
t Par
is (E
NXT
PA
)
Lond
on S
tock
Exc
hang
e (L
SE
)
Lond
on S
tock
Exc
hang
eA
IM M
arke
t (A
IM)
The
Toro
nto
Sto
ckE
xcha
nge
(TSX
)
Deu
tsch
e B
oers
e AG
(DB
)
OM
X N
ordi
c E
xcha
nge
Hel
sink
i (H
LSE)
SIX
Sw
iss
Exch
ange
(SW
X)
ASX
OM
X N
ordi
c E
xcha
nge
Sto
ckho
lm (O
M)
Osl
o B
ors
(OB)
The
Joha
nnes
burg
Sec
uriti
es E
xcha
nge
(JS
E)$0
$2,000
$4,000
$6,000
$8,000
$10,000
Total proceeds (US$mn) Number of IPOs
US$
mill
ions
No.
of I
POs
Global Technology IPO Review Full-year and Q4 2017 8
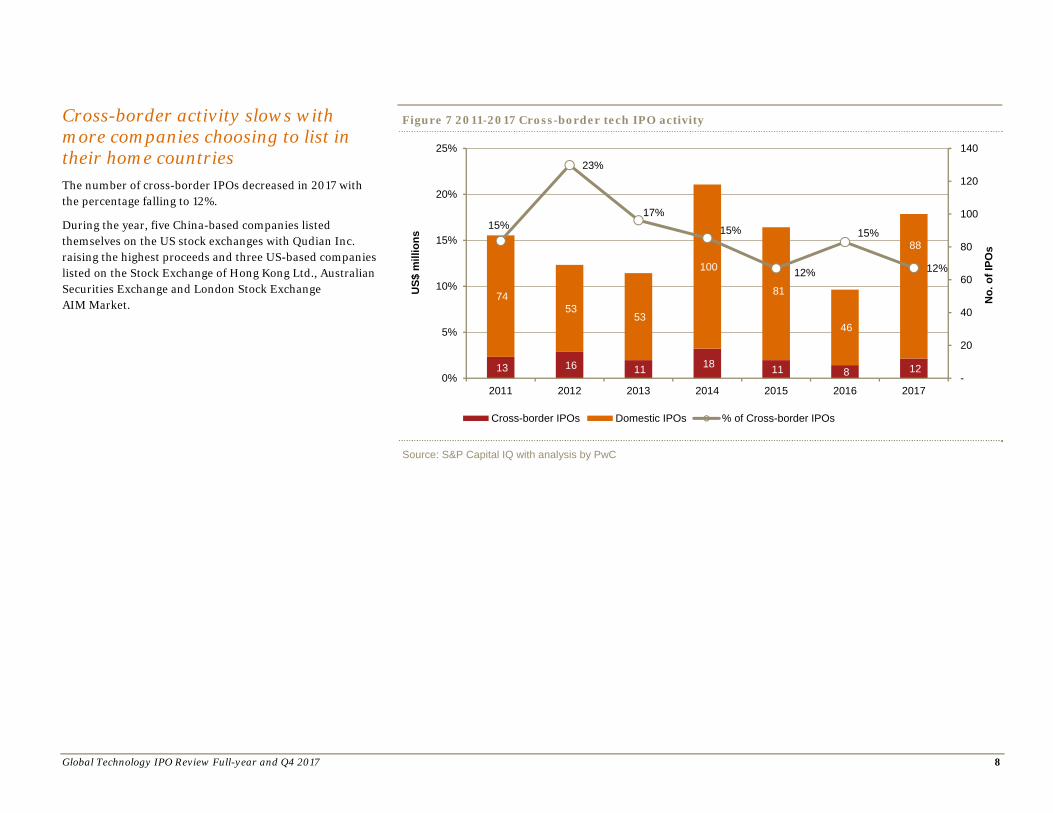
Cross-border activity slows with more companies choosing to list in their home countries The number of cross-border IPOs decreased in 2017 with the percentage falling to 12%.
During the year, five China-based companies listed themselves on the US stock exchanges with Qudian Inc. raising the highest proceeds and three US-based companies listed on the Stock Exchange of Hong Kong Ltd., Australian Securities Exchange and London Stock Exchange AIM Market.
Figure 7 2011-2017 Cross-border tech IPO activity
Source: S&P Capital IQ with analysis by PwC
13 16 11 18 11 8 12
74 53
53
100
81
46
88
15%
23%
17%
15%
12%
15%
12%
-
20
40
60
80
100
120
140
2011 2012 2013 2014 2015 2016 20170%
5%
10%
15%
20%
25%
US$
mill
ions
Cross-border IPOs Domestic IPOs % of Cross-border IPOs
No.
of I
POs

Global Technology IPO Review Full-year and Q4 2017 9
A close look at full-year 2017 technology IPOsGeographic IPO trends – full-year 2017
Europe and the UK
Both regions performed marginally well with the IPOs of Landis+Gyr Group AG and Alfa Financial Software being the highlights.
With a decrease in the number of listings since 2014, the European tech IPO market fared well in 2017 with the total proceeds being the highest in the last seven years.
The IPO of Landis+Gyr Group AG raising US$2.4 billion was the largest in Switzerland in 11 years. The tech IPO outlook for the region is positive in the backdrop of a revived Eurozone economy, stable indices and strength in equity markets.
The UK tech IPO market after a dry spell of no IPOs in 2016 had two listings in 2017 of Alfa Financial Software Holdings PLC and Sumo Digital Ltd.
However, uncertainty of Brexit negotiations and volatility of the UK market has led to some technology companies delaying their IPOs.
The FCA has brought into effect new rules for UK IPOs that will come into force on July 1, 2018.
Figure 8: 2011-2017 Europe (without UK)
Figure 9: 2011-2017 UK
Source: S&P Capital IQ with analysis by PwC
$1,846
$352$754
$3,571$3,176
$3,674 $4,328
6
3 4
8
11
10
6
-
2
4
6
8
10
12
2011 2012 2013 2014 2015 2016 2017 $-
$1,000
$2,000
$3,000
$4,000
$5,000
Total proceeds (US$mn) Number of IPOs
US$
mill
ions
No.
of I
POs
$0 $0$730
$3,277
$7,811
$0 $429- -
4
7 9
-
2
-
2
4
6
8
10
2011 2012 2013 2014 2015 2016 2017 $-
$1,800
$3,600
$5,400
$7,200
$9,000
Total proceeds (US$mn) Number of IPOs
US$
mill
ions
No.
of I
POs

Global Technology IPO Review Full-year and Q4 2017 10
China
Market continues to gain momentum with highest number of listings since 2011 The number of technology IPO listings in China improved significantly in 2017. Even with 51 listings for the year, the lack of mega-sized IPOs led to the proceeds reaching US$7 billion. Though the proceeds have increased by 73% compared to 2015 and 241% compared to 2016, the market has been inconsistent with the number of listings.
Though China has overtaken the US in terms of number of listings, it still lags in terms of proceeds. Year 2017 witnessed some major IPOs; however, none were from China except for that of Qudian Inc. Over the last few years, many Chinese companies debuted on US stock exchanges rather than in their home country.
But since 2014, the number of Chinese tech IPOs being listed on US stock exchanges has declined. This can be attributed to the government’s support to ease clearances and acceleration of the IPO approval process by the Chinese Securities Regulatory Commission (CSRC). However, the CSRC has undertaken review measures to make the IPO application more transparent and the vetting process more stringent with an aim to ensure the quality of listed companies.
Figure 10: 2011-2017 China tech IPOs
Source: S&P Capital IQ with analysis by PwC
$7,415
$2,439
$1,026
$29,063
$4,074 $2,067$7,048
50
33
8
45
30
19
51
-
12
24
36
48
60
2011 2012 2013 2014 2015 2016 2017 $-
$7,000
$14,000
$21,000
$28,000
$35,000
Total proceeds (US$mn) Number of IPOsU
S$m
illio
ns
No.
of I
POs
"I am pleased to see the number of China Tech IPO has reached a record high in 2017. Although this is primarily attributed to domestic listings, we are seeing more Chinese technology companies exploring overseas capital markets again. With the Hong Kong stock exchange's move to allow dual class of shares and to promote development stage bio-tech IPOs, I anticipate the Hong Kong stock exchange will reach a historical high of technology IPOs in 2018."
Jianbin Gao Technology Industry Leader, PwC China

Global Technology IPO Review Full-year and Q4 2017 11
United States
Market makes a comeback in 2017, but lags in terms of volume compared with China The US IPO market rebounded in 2017 after a depressing perfomance in 2016. The proceeds improved by 351% year on year, whereas the number of listings increased by 50%. Stable econimic factors, improved corporate earnings, as well as low market volitality and improved job growth led to the upswing in the IPO market.
Despite the below-average after market performance of Snap Inc. and Blue Apron, the later part of the year witnessed some major IPOs — Cloudera Inc., Okta Inc. Despegar.com, and Roku.
Though the market performed well compared to 2016, the number of listings were disappointing compared to the last few years.
Figure 11: 2011-2017 US tech IPOs
Source: S&P Capital IQ with analysis by PwC
$4,926
$20,316
$7,591 $7,850 $8,396
$1,800
$8,115
24
32
35 37
23
16
24
-
8
16
24
32
40
2011 2012 2013 2014 2015 2016 2017 $-
$5,000
$10,000
$15,000
$20,000
$25,000
Total proceeds (US$mn) Number of IPOs
US$
mill
ions
No.
of I
POs
"For the overall IPO market, strong favorable market conditions in 2017 combined with low volatility, market highs in key indices and good returns in equities set the stage for continued IPO issuance and performance in 2018. For Technology IPOs, the market was characterized by a focus on high growth companies with a delineated path to profitability. This resulted in Technology IPOs rewarding investors as the returns handily beat the S&P 500 returns."
Alan Jones Technology Deals Partner, PwC US

Global Technology IPO Review Full-year and Q4 2017 12
Full-year 2017 tech IPOs – Offering details Table 1: 2017 tech IPOs – By issue date
Issue date Company Subsector Proceeds (US$mn) Primary exchange Domicile location Q1 03/01/2017 Snap Inc. Internet Software &
Services 3,910.0 New York Stock Exchange United States
03/16/2017 Yealink Network Technology Co Ltd
Communications Equipment
240.1 Shenzhen Stock Exchange China
03/09/2017 Presidio Inc IT Consulting & Services 233.3 NASDAQ Global Select United States
03/16/2017 MuleSoft Inc Internet Software & Services
221.0 New York Stock Exchange United States
01/06/2017 Shenzhen Kinwong Electronic Co Ltd
Semiconductor 159.8 Shanghai Stock Exchange China
01/03/2017 G-bits Network Technology (Xiamen) Co Ltd
Internet Software & Services
138.4 Shanghai Stock Exchange China
03/23/2017 Alteryx Inc Software 126.0 New York Stock Exchange United States
01/18/2017 Guangzhou Shiyuan Electronic Technology Co Ltd
Electronic Computer Manufacturing
112.9 Shenzhen Stock Exchange China
03/13/2017 Jiangsu JieJie Microelectronics Co Ltd
Semiconductors 94.3 Shenzhen Stock Exchange China
02/19/2017 Shanghai Fullhan Microelectronics Co Ltd
Semiconductors 90.1 Shenzhen Stock Exchange China
01/10/2017 Queclink Wireless Solutions Co Ltd
Communications Equipment
82.3 Shenzhen Stock Exchange China
03/16/2017 Beaglee Inc Internet Software & Services
78.1 The Tokyo Stock Exchange
Japan
01/19/2017 Shanghai Athub Co Ltd IT Consulting & Services 59.8 Shanghai Stock Exchange China
03/10/2017 Tanyuan Technology Co Ltd Computers & Peripherals 59.3 Shanghai Stock Exchange China
01/24/2017 Shenzhen TXD Technology Co Ltd
Electronic Computer Manufacturing
56.0 Shenzhen Stock Exchange China
03/20/2017 Shanghai Huace Navigation Technology Ltd
Communications Equipment
55.1 Shenzhen Stock Exchange China

Global Technology IPO Review Full-year and Q4 2017 13
Full-year 2017 tech IPOs – Offering details Table 1: 2017 tech IPOs – By issue date
Issue date Company Subsector Proceeds (US$mn) Primary exchange Domicile location 03/29/2017 Aucnet Inc Internet Software &
Services 48.0 The Tokyo Stock
Exchange Japan
01/22/2017 Jilin Jlu Communication Design Institute Co Ltd
Communications Equipment
48.3 Shenzhen Stock Exchange China
Q2 05/02/2017 Netmarble Games Corporation Internet Software &
Services 2,355.8 Korea Stock Exchange
(KOSE) South Korea
06/29/2017 Delivery Hero AG Internet Software & Services
989.1 Deutsche Boerse AG (DB) Germany
05/26/2017 Alfa Financial Software Holdings PLC Internet Software & Services
324.1 London Stock Exchange (LSE)
United Kingdom
04/05/2017 X-FAB Silicon Foundries SE Semiconductors 266.6 Euronext Paris (ENXTPA) Belgium
04/27/2017 Cloudera Inc Internet Software & Services
258.8 New York Stock Exchange United States
04/17/2017 Olympic Circuit Technology Co LTD Semiconductors 194.7 Shanghai Stock Exchange China
04/06/2017 Okta Inc Internet Software & Services
187.0 NASDAQ Global Select United States
04/12/2017 Yext Inc Internet Software & Services
132.8 New York Stock Exchange United States
05/05/2017 Real Matters Inc Internet Software & Services 114.4 The Toronto Stock Exchange Canada
04/11/2017 Raisecom Technology Co Ltd Communications Equipment
113.1 Shanghai Stock Exchange China
04/06/2017 Zhejiang Jiemei Electronic and Technology Co Ltd
Semiconductors 110.6 Shenzhen Stock Exchange China
05/12/2017 Shenzhen Genvict Technologies Co Ltd
Electronic Computer Manufacturing
93.3 Shenzhen Stock Exchange China
06/28/2017 Fujian Raynen Technology Co Ltd Software 76.3 Shanghai Stock Exchange China
05/24/2017 Appian Corporation Software 75.0 NASDAQ Global Market United States

Global Technology IPO Review Full-year and Q4 2017 14
Full-year 2017 tech IPOs – Offering details Table 1: 2017 tech IPOs – By issue date
Issue date Company Subsector Proceeds (US$mn) Primary exchange Domicile location 04/25/2017 Jiangsu Transimage Technology
Co Ltd Computers & Peripherals 69.9 Shenzhen Stock Exchange China
04/27/2017 China Rapid Finance Limited Internet Software & Services
69.0 New York Stock Exchange China
06/05/2017 SG Micro Corp Semiconductors 65.7 Shenzhen Stock Exchange China
06/14/2017 Suzhou Etron Technologies Co Ltd
Electronics 62.9 Shanghai Stock Exchange China
06/29/2017 Tintri Inc Internet Software & Services
60.0 NASDAQ Global Market United States
05/12/2017 Fujian Apex Software Co Ltd Software 58.1 Shanghai Stock Exchange China
05/23/2017 Nanjing Huamai Technology Co Ltd
Communications Equipment
55.6 Shanghai Stock Exchange China
05/24/2017 Shenzhen Sunnypol Optoelectronics Co Ltd
Computers & Peripherals 55.5 Shenzhen Stock Exchange China
05/26/2017 EmbedWay Technologies (Shanghai) Corporation
Semiconductors 51.6 Shanghai Stock Exchange China
05/23/2017 SMART Global Holdings Inc Semiconductors 50.6 NASDAQ Global Select United States
05/29/2017 Philoptics Co Ltd Semiconductors 49.7 KOSDAQ South Korea
05/29/2017 Telrad Networks Ltd Communications Equipment
45.7 Tel Aviv Stock Exchange Israel
06/26/2017 Shenzhen JingQuanHua Electronics Co Ltd
Electronics 45.4 Shenzhen Stock Exchange China
04/23/2017 Will Semiconductor CO Ltd Shanghai Semiconductors 42.4 Shenzhen Stock Exchange China
04/17/2017 Shanghai Koal Software Co Ltd Software 40.1 Shanghai Stock Exchange China
Q3 07/20/2017 Landis+Gyr Group AG Electronics 2,421.8 SIX Swiss Exchange (SWX) Switzerland
09/28/2017 Rovio Entertainment Oyj Software 500.7 OMX Nordic Exchange Helsinki (HLSE)
Finland
09/20/2017 Despegar.com Co Internet Software & Services 381.8 New York Stock Exchange Argentina
Global Technology IPO Review Full-year and Q4 2017 15
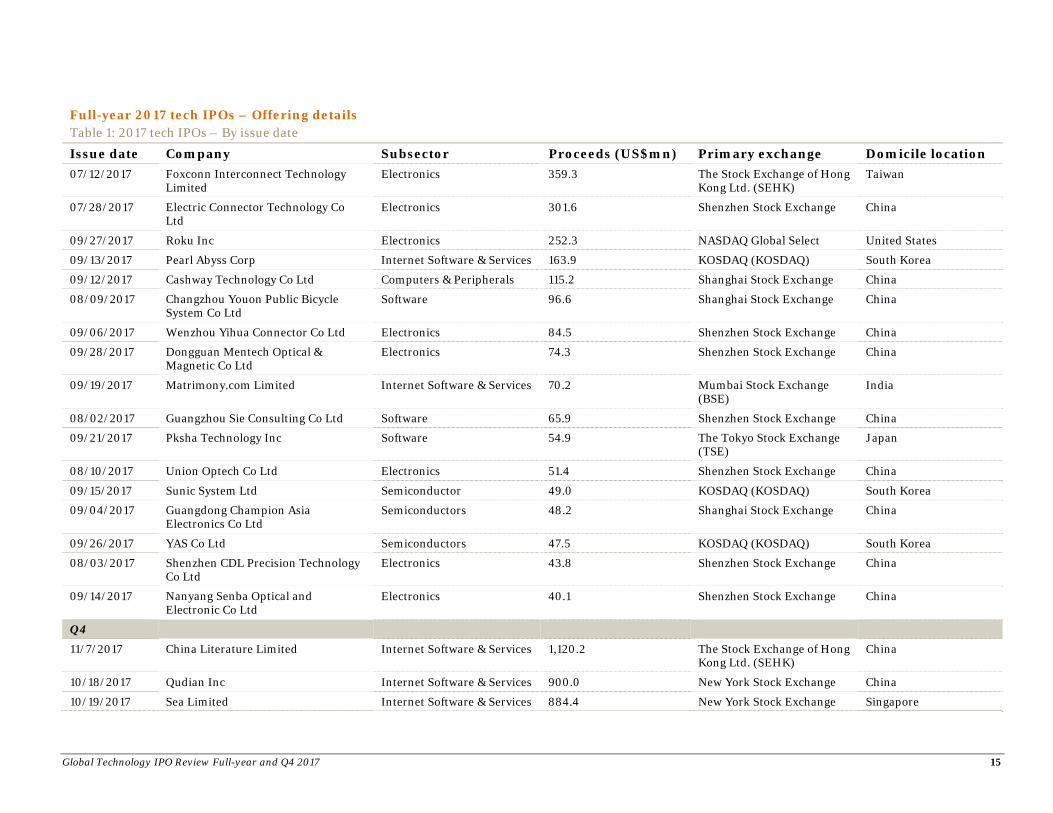
Full-year 2017 tech IPOs – Offering details Table 1: 2017 tech IPOs – By issue date
Issue date Company Subsector Proceeds (US$mn) Primary exchange Domicile location 07/12/2017 Foxconn Interconnect Technology
Limited Electronics 359.3 The Stock Exchange of Hong
Kong Ltd. (SEHK) Taiwan
07/28/2017 Electric Connector Technology Co Ltd
Electronics 301.6 Shenzhen Stock Exchange China
09/27/2017 Roku Inc Electronics 252.3 NASDAQ Global Select United States
09/13/2017 Pearl Abyss Corp Internet Software & Services 163.9 KOSDAQ (KOSDAQ) South Korea
09/12/2017 Cashway Technology Co Ltd Computers & Peripherals 115.2 Shanghai Stock Exchange China
08/09/2017 Changzhou Youon Public Bicycle System Co Ltd
Software 96.6 Shanghai Stock Exchange China
09/06/2017 Wenzhou Yihua Connector Co Ltd Electronics 84.5 Shenzhen Stock Exchange China
09/28/2017 Dongguan Mentech Optical & Magnetic Co Ltd
Electronics 74.3 Shenzhen Stock Exchange China
09/19/2017 Matrimony.com Limited Internet Software & Services 70.2 Mumbai Stock Exchange (BSE)
India
08/02/2017 Guangzhou Sie Consulting Co Ltd Software 65.9 Shenzhen Stock Exchange China
09/21/2017 Pksha Technology Inc Software 54.9 The Tokyo Stock Exchange (TSE)
Japan
08/10/2017 Union Optech Co Ltd Electronics 51.4 Shenzhen Stock Exchange China
09/15/2017 Sunic System Ltd Semiconductor 49.0 KOSDAQ (KOSDAQ) South Korea 09/04/2017 Guangdong Champion Asia
Electronics Co Ltd Semiconductors 48.2 Shanghai Stock Exchange China
09/26/2017 YAS Co Ltd Semiconductors 47.5 KOSDAQ (KOSDAQ) South Korea 08/03/2017 Shenzhen CDL Precision Technology
Co Ltd Electronics 43.8 Shenzhen Stock Exchange China
09/14/2017 Nanyang Senba Optical and Electronic Co Ltd
Electronics 40.1 Shenzhen Stock Exchange China
Q4
11/7/2017 China Literature Limited Internet Software & Services 1,120.2 The Stock Exchange of Hong Kong Ltd. (SEHK)
China
10/18/2017 Qudian Inc Internet Software & Services 900.0 New York Stock Exchange China
10/19/2017 Sea Limited Internet Software & Services 884.4 New York Stock Exchange Singapore

Global Technology IPO Review Full-year and Q4 2017 16
Full-year 2017 tech IPOs – Offering details Table 1: 2017 tech IPOs – By issue date
Issue date Company Subsector Proceeds (US$mn) Primary exchange Domicile location 11/8/2017 Sogou Inc Internet Software & Services 658.4 New York Stock Exchange China
10/6/2017 Switch Inc IT Consulting & Services 610.9 New York Stock Exchange United States
11/10/2017 Razer Inc Computers & Peripherals 608.2 The Stock Exchange of Hong Kong Ltd. (SEHK)
United States
12/18/2017 Ayo Technology Solutions Limited IT Consulting & Services 339.7 The Johannesburg Securities Exchange (JSE)
South Africa
11/16/2017 SailPoint Technologies Holdings Inc Software 240.0 New York Stock Exchange United States
11/15/2017 Jianpu Technology Inc Internet Software & Services 220.0 New York Stock Exchange China
12/12/2017 Shennan Circuit Company Limited Semiconductors 204.0 Shenzhen Stock Exchange China
10/18/2017 MongoDB Inc Software 192.0 Nasdaq Global Market United States
10/31/2017 Altair Engineering Inc Software 179.4 Nasdaq Global Select United States
10/11/2017 CarGurus Inc Internet Software & Services 173.0 Nasdaq Global Select United States
11/30/2017 Aoshikang Technology Co Ltd Semiconductors 165.5 Shenzhen Stock Exchange China
11/14/2017 SendGrid Inc Software 150.9 New York Stock Exchange United States
12/4/2017 Suzhou Chunqiu Electronic Technology Co Ltd
Electronics 122.7 Shanghai Stock Exchange China
10/26/2017 ForeScout Technologies Inc Software 116.2 Nasdaq Global Market United States
12/18/2017 Sumo Digital Ltd Software 104.7 London Stock Exchange (LSE)
United Kingdom
12/19/2017 Optorun Co Ltd Semiconductors 93.1 The Tokyo Stock Exchange (TSE)
Japan
11/7/2017 Crayon Group Holding ASA IT Consulting & Services 91.3 Oslo Bors (OB) Norway
11/9/2017 Bandwidth Inc Internet Software & Services 80.0 Nasdaq Global Select United States
12/14/2017 Casa Systems Inc Communications Equipment
78.0 Nasdaq Global Select United States
11/20/2017 Shenzhen Sinovatio Technology Co Ltd
Communications Equipment
76.1 Shenzhen Stock Exchange China
11/2/2017 Aquantia Corp Semiconductors 70.6 New York Stock Exchange United States
11/20/2017 Zhuzhou Hongda Electronics Corp Ltd
Electronics 67.5 Shenzhen Stock Exchange China

Global Technology IPO Review Full-year and Q4 2017 17
Full-year 2017 tech IPOs – Offering details Table 1: 2017 tech IPOs – By issue date
Issue date Company Subsector Proceeds (US$mn) Primary exchange Domicile location 12/1/2017 Mecaro Co Ltd Semiconductors 61.0 KOSDAQ (KOSDAQ) South Korea
11/14/2017 Boku Inc Internet Software & Services 59.1 London Stock Exchange AIM Market (AIM)
United States
12/7/2017 MAG Interactive AB (publ) Software 59.0 OMX Nordic Exchange Stockholm (OM)
Sweden
11/2/2017 CIG ShangHai Co Ltd Communications Equipment
55.7 Shanghai Stock Exchange China
12/8/2017 Credible Labs Inc Internet Software & Services 50.3 Australian Securities Exchange (ASX)
United States
11/2/2017 Hexindai Inc Internet Software & Services 50.0 Nasdaq Global Market China
10/31/2017 GHT Co Ltd Communications Equipment
45.4 Shenzhen Stock Exchange China
12/14/2017 Digital Hollywood Interactive Limited
Software 40.3 The Stock Exchange of Hong Kong Ltd. (SEHK)
China
Source: S&P Capital IQ with analysis by PwC

Global Technology IPO Review Full-year and Q4 2017 18
Q4 2017 global tech IPO summary 0
All-time high stock markets, improved macro economy led to resurgent global tech IPO market Q4 2017, with 33 IPOs and proceeds of US$7.9 billion, was one of the best quarters on record since Q4 2014, which had 34 IPOs. The number of IPOs were up by 65% with proceeds growing by 53% compared to Q3 2017. Compared to Q4 2016, the proceeds improved by 357% and number of IPOs grew by 230%.
In the fourth quarter of 2017 five unicorns, Sogou Inc., Sea Limited, Razer Inc., MongoDB, Inc., and ForeScout Technologies, Inc.) were listed.
China Literature Limited, an company in the Internet Software and Services sector, had the highest proceeds of US$1.1 billion this quarter.
With China and the US’s strong tech IPO market and all major global economies poised on an upward trajectory, this momentum is expected to carry forward into 2018.
Figure 12: Q4 2016-Q4 2017 Global technology IPO trends
Source: S&P Capital IQ with analysis by PwC
$1,742
$5,813 $6,114
$5,223
$7,968
10
18
29
20
33
$-
$1,000
$2,000
$3,000
$4,000
$5,000
$6,000
$7,000
$8,000
$9,000
Q4 2016 Q1 2017 Q2 2017 Q3 2017 Q4 20170
7
14
21
28
35
42
Total proceeds (US$mn) Number of IPOs
US$
mill
ions
No.
of I
POs
Global Technology IPO Review Full-year and Q4 2017 19
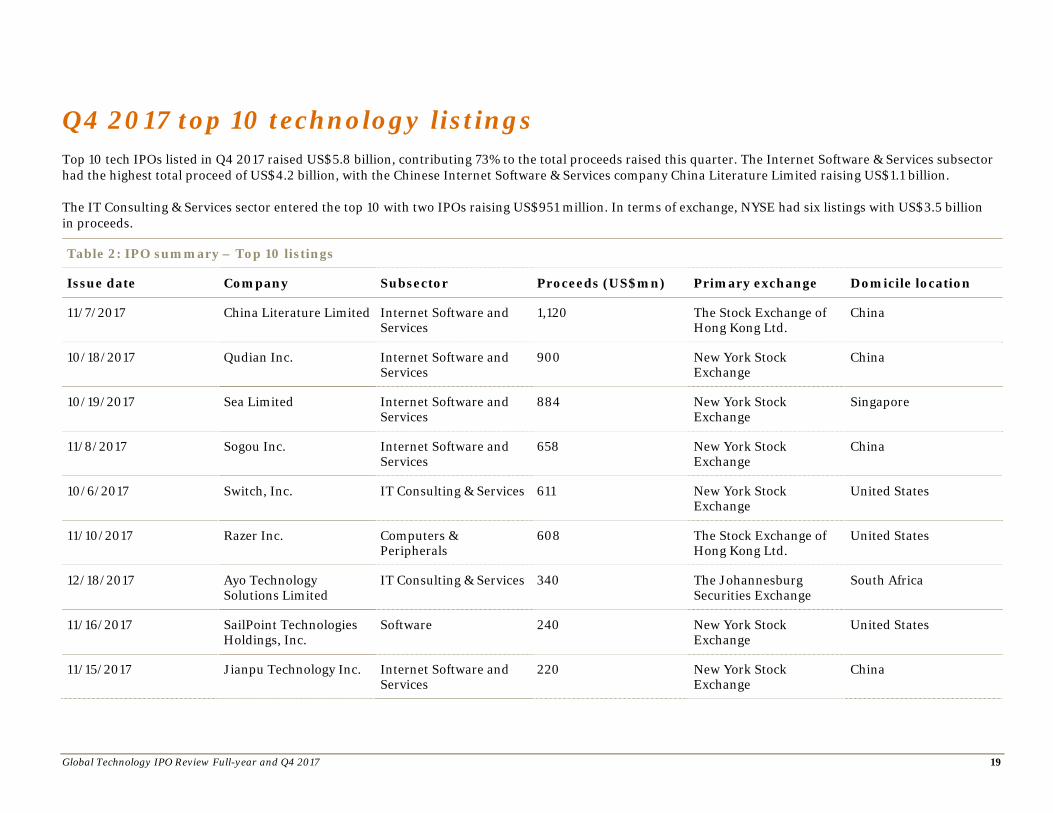
Q4 2017 top 10 technology listings Top 10 tech IPOs listed in Q4 2017 raised US$5.8 billion, contributing 73% to the total proceeds raised this quarter. The Internet Software & Services subsector had the highest total proceed of US$4.2 billion, with the Chinese Internet Software & Services company China Literature Limited raising US$1.1 billion.
The IT Consulting & Services sector entered the top 10 with two IPOs raising US$951 million. In terms of exchange, NYSE had six listings with US$3.5 billion in proceeds.
Table 2: IPO summary – Top 10 listings
Issue date Company Subsector Proceeds (US$mn) Primary exchange Domicile location
11/7/2017 China Literature Limited Internet Software and Services
1,120 The Stock Exchange of Hong Kong Ltd.
China
10/18/2017 Qudian Inc. Internet Software and Services
900 New York Stock Exchange
China
10/19/2017 Sea Limited Internet Software and Services
884 New York Stock Exchange
Singapore
11/8/2017 Sogou Inc. Internet Software and Services
658 New York Stock Exchange
China
10/6/2017 Switch, Inc. IT Consulting & Services 611 New York Stock Exchange
United States
11/10/2017 Razer Inc. Computers & Peripherals
608 The Stock Exchange of Hong Kong Ltd.
United States
12/18/2017 Ayo Technology Solutions Limited
IT Consulting & Services 340 The Johannesburg Securities Exchange
South Africa
11/16/2017 SailPoint Technologies Holdings, Inc.
Software 240 New York Stock Exchange
United States
11/15/2017 Jianpu Technology Inc. Internet Software and Services
220 New York Stock Exchange
China
Global Technology IPO Review Full-year and Q4 2017 20
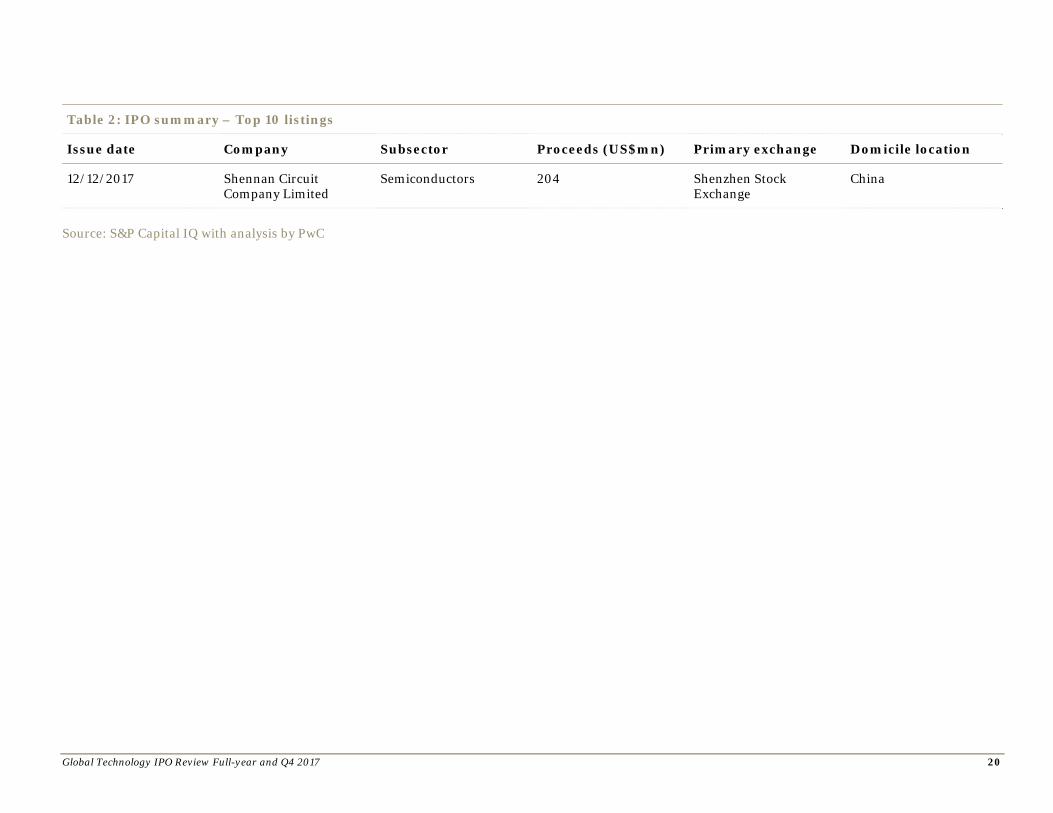
Table 2: IPO summary – Top 10 listings
Issue date Company Subsector Proceeds (US$mn) Primary exchange Domicile location
12/12/2017 Shennan Circuit Company Limited
Semiconductors 204 Shenzhen Stock Exchange
China
Source: S&P Capital IQ with analysis by PwC

Global Technology IPO Review Full-year and Q4 2017 21
Q4 2017 geographic tech IPO trends China led Q4 tech IPO activity with five of the top ten listings Greater geographical spread was the trend of Q4 2017 with nine countries issuing tech IPOs. The US and China led the way with 13 IPOs each, raising US$2.6 billion and US$3.7 billion, respectively.
China reported the two biggest IPOs: China Literature Limited raising US$1.1 billion and Qudian Inc. with proceeds of US$900 million. Singapore reported the third biggest IPO (Sea Limited) which raised US$884 million. The biggest cross-border listing was of Qudian Inc, a Chinese company listed on the NYSE.
Finally, Singapore, South Africa, Japan, Norway, South Korea, the UK and Sweden had one tech IPO each.
Figure 13: Q4 2017 Geographic distribution
Source: S&P Capital IQ with analysis by PwC
$2,608
$3,726
$93 $91
$884
$340 $61 $59 $105
13 13
1 1 1
1 1 1 1
-
2
4
6
8
10
12
14
UnitedStates
China Japan Norway Singapore SouthAfrica
SouthKorea
Sweden UnitedKingdom
$0
$500
$1,000
$1,500
$2,000
$2,500
$3,000
$3,500
$4,000
Total proceeds (US$mn) Number of IPOs
US$
mill
ions
No.
of I
POs

Global Technology IPO Review Full-year and Q4 2017 22
US
The US had 13 tech IPOs with total proceeds of US$2.6 billion. Proceeds were much higher than both Q4 2016 and sequentially. It was a 444% increase compared to last year and 934% increase sequentially. The number of IPOs was also the highest in the last four quarters.
Switch Inc was the biggest US IPO, raising US$611 million on the NYSE. Razer Inc raised US$608 million and came in a close second and listed on Hong Kong SE. The uptick in US tech IPOs was driven by lower market volatility, and the continuously high rising US benchmark index. There was also a resurgence in cross-border IPOs.
The momentum is likely to continue into 2018, which is expected to be a strong year for tech IPOs. The only unknown is the US tax policies that are yet to be fully understood. If the unicorns that got listed this quarter deliver positive returns for investors, the rest of 2018 is expected to come up with many more unicorn IPOs, which were until now waiting on the sidelines.
Figure 14: Q4 2017 US tech IPOs
Source: S&P Capital IQ with analysis by PwC
$480
$4,490
$764 $252
$2,608
5 4
6
1
13
-
2
4
6
8
10
12
14
Q4 2016 Q1 2017 Q2 2017 Q3 2017 Q4 2017$0
$500
$1,000
$1,500
$2,000
$2,500
$3,000
$3,500
$4,000
$4,500
$5,000
Total proceeds (US$mn) Number of IPOsU
S$m
illio
ns
No.
of I
POs
Global Technology IPO Review Full-year and Q4 2017 23
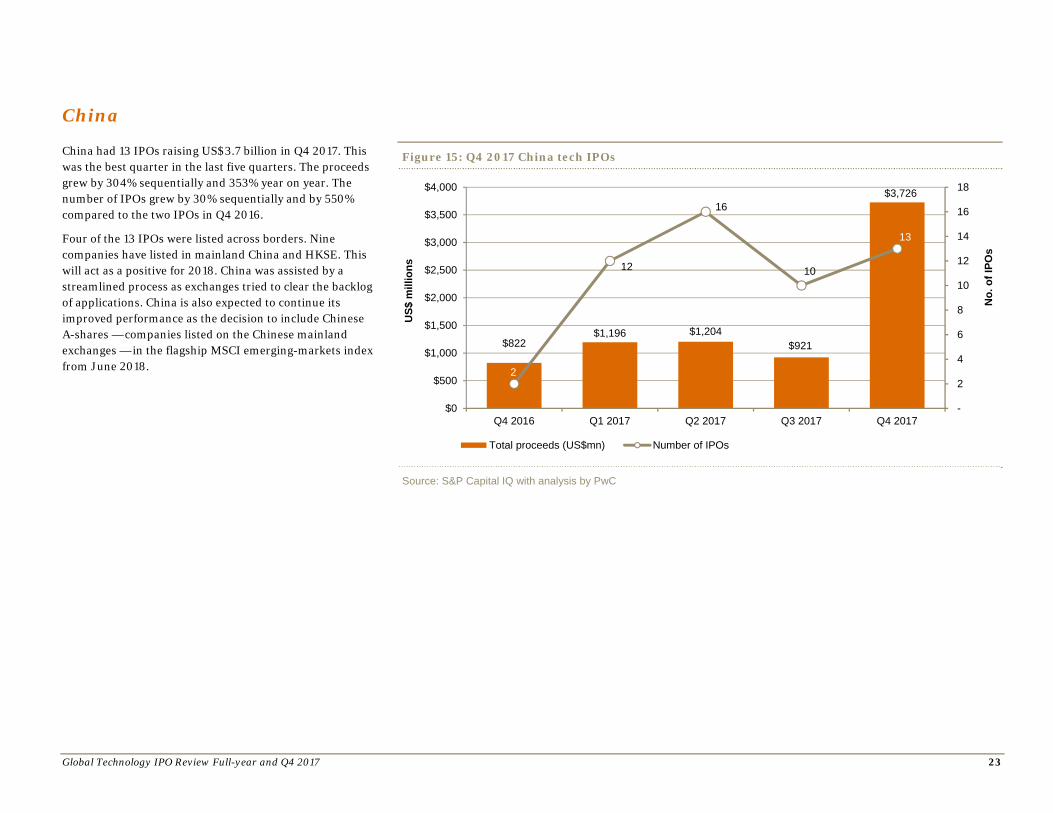
China
China had 13 IPOs raising US$3.7 billion in Q4 2017. This was the best quarter in the last five quarters. The proceeds grew by 304% sequentially and 353% year on year. The number of IPOs grew by 30% sequentially and by 550% compared to the two IPOs in Q4 2016.
Four of the 13 IPOs were listed across borders. Nine companies have listed in mainland China and HKSE. This will act as a positive for 2018. China was assisted by a streamlined process as exchanges tried to clear the backlog of applications. China is also expected to continue its improved performance as the decision to include Chinese A-shares — companies listed on the Chinese mainland exchanges — in the flagship MSCI emerging-markets index from June 2018.
Figure 15: Q4 2017 China tech IPOs
Source: S&P Capital IQ with analysis by PwC
$822$1,196 $1,204
$921
$3,726
2
12
16
10
13
$0
$500
$1,000
$1,500
$2,000
$2,500
$3,000
$3,500
$4,000
Q4 2016 Q1 2017 Q2 2017 Q3 2017 Q4 2017 -
2
4
6
8
10
12
14
16
18
Total proceeds (US$mn) Number of IPOs
US$
mill
ions
No.
of I
POs

Global Technology IPO Review Full-year and Q4 2017 24
Europe (excluding the UK)
Europe (ex-UK) had two IPOs, one each from Norway and Sweden.
Crayon Group Holding ASA from Norway was the biggest IPO of the quarter, raising US$91 million, and MAG Interactive AB from Sweden raised US$59 million. The companies belonged to the IT consulting & services and software subsectors, respectively.
The proceeds declined by 95% sequentially and 55% year on year, whereas the volume remained flat sequentially and compared to Q4 2016. Major economies have started reporting positive economic growth, which might encourage investors to ignore political issues that have been damping investment.
Figure 16: Q4 2017 European tech IPOs (Excluding UK)
Source: S&P Capital IQ with analysis by PwC
$331
$0
$1,256
$2,922
$150
2
-
2 2 2
$0
$700
$1,400
$2,100
$2,800
$3,500
Q4 2016 Q1 2017 Q2 2017 Q3 2017 Q4 2017 -
1
2
3
4
5
Total proceeds (US$mn) Number of IPOs
US$
mill
ions
No.
of I
POs
Global Technology IPO Review Full-year and Q4 2017 25
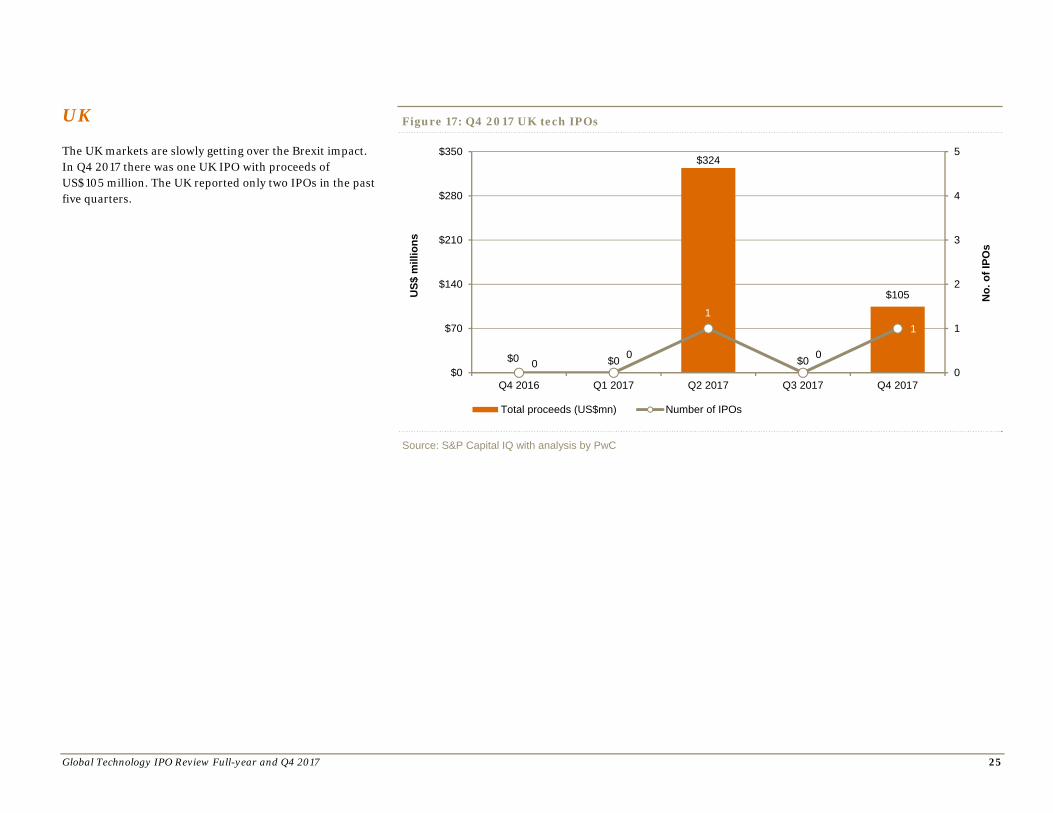
UK
The UK markets are slowly getting over the Brexit impact. In Q4 2017 there was one UK IPO with proceeds of US$105 million. The UK reported only two IPOs in the past five quarters.
Figure 17: Q4 2017 UK tech IPOs
Source: S&P Capital IQ with analysis by PwC
$0 $0
$324
$0
$105
00
1
0
1
$0
$70
$140
$210
$280
$350
Q4 2016 Q1 2017 Q2 2017 Q3 2017 Q4 20170
1
2
3
4
5
Total proceeds (US$mn) Number of IPOsU
S$m
illio
ns
No.
of I
POs

Global Technology IPO Review Full-year and Q4 2017 26
Asia (excluding China)
The participation of Asian countries other than China decreased significantly in Q4 2017. There were just three tech IPOs outside China, which reported 13 tech IPOs. Other Asian countries reporting IPOS include Japan, Singapore, and South Korea, with Singapore leading with its IPO of Sea Limited, which raised proceeds of US$884 million. Total proceeds for Asia (ex-China) reached US$1.0 billion, up 39% sequentially and 838% year on year.
Figure 18: Q4 2017 Asia tech IPOs (excluding China)
Source: S&P Capital IQ with analysis by PwC
$111 $126
$2,451
$745
$1,038
1
2
3
6
3
$-
$500
$1,000
$1,500
$2,000
$2,500
$3,000
Q4 2016 Q1 2017 Q2 2017 Q3 2017 Q4 2017 -
1
2
3
4
5
6
7
Total proceeds (US$mn) Number of IPOs
US$
mill
ions
No.
of I
POs

Global Technology IPO Review Full-year and Q4 2017 27
Average proceeds
Number of IPOs witnessed the highest improvement in the last five quarters, with 33 tech IPOs in Q4 2017, but the average proceeds were US$241 million, an 8% decline sequentially and a 39% increase compared to Q4 2016.
Figure 19: Q4 2017 Average proceeds
Source: S&P Capital IQ with analysis by PwC
$174
$323
$211
$261$241
10
18
29
20
33
-
5
10
15
20
25
30
35
Q4 2016 Q1 2017 Q2 2017 Q3 2017 Q4 2017 $-
$50
$100
$150
$200
$250
$300
$350
Average proceeds Number of IPOsU
S$m
illio
ns
No.
of I
POs

Global Technology IPO Review Full-year and Q4 2017 28
Q4 2017 stock exchange distribution US NYSE led Q4 2017 in terms of both proceeds and number of IPOs NYSE garnered 47% of the total tech proceeds this quarter with US$3.7 billion raised by the exchange through eight IPOs. It was followed by SEHK with US$1.8 billion in proceeds (22%) with three IPOs. In terms of the number of IPOs, NASDAQ had seven listings, raising US$869 million.
Stock exchange distribution was also widespread this quarter with 12 stock exchanges participating with at least one tech IPO. With investor sentiment at an all-time high in the US markets they grabbed the major share of the tech IPO listing. China came in second with the two major exchanges having seven tech IPO listing. Also, cross-border listings made a comeback with eight cross-border IPOs.
Figure 20: Q4 2017 Stock exchange distribution
Source: S&P Capital IQ with analysis by PwC
3,735
869
178
559
340
1,769
93 91 59 61 50 164
8 7
2
5
1
3
1 1 1 1 1
2
-
1
2
3
4
5
6
7
8
9
NY
SE
NAS
DAQ
Sha
ngha
i SE
SZS
E
Joha
nnes
burg
SE SE
HK
Toky
o S
E
Osl
o Bo
rse
OM
X N
ordi
c
Kos
daq
AS
X
Lond
on S
E
$-
$500
$1,000
$1,500
$2,000
$2,500
$3,000
$3,500
$4,000
Total proceeds (US$mn) Number of IPOs
US$
mill
ions
No.
of I
POs

Global Technology IPO Review Full-year and Q4 2017 29
Q4 2017 subsector distributionInternet Software & Services maintained its lead and eclipsed Software subsector in Q4 2017 in terms of number of IPOs and proceeds In Q4 2017 the Internet Software & Services led the IPO market with ten listings, raising US$4.2 billion. The Software subsector came in second with eight IPOs, raising US$1.1 billion. These two sectors together cornered 65% of proceeds and 55% of the share of total number of tech IPOs. The biggest IPO this quarter of China Literature Limited was also from Internet Software & Services, with proceeds of US$1.1 billion.
These two subsectors had four out of the five unicorns listed. The last unicorn was from the Computers & Peripheral sector.
Figure 21: Q4 2017 Subsector distribution
Source: S&P Capital IQ with analysis by PwC
$255$608
$190
$4,195
$594
$1,083
$1,0424
1
2
10
5
8
3
-
2
4
6
8
10
12
Com
mun
icat
ions
Equ
ipm
ent
Com
pute
rs&
Per
iphe
rals
Ele
ctro
nic
Com
pute
rM
anuf
actu
ring
Inte
rnet
Sof
twar
ean
d S
ervi
ces
Sem
icon
duct
ors
Sof
twar
e
IT C
onsu
lting
& S
ervi
ces
$-
$900
$1,800
$2,700
$3,600
$4,500
Total proceeds (US$mn) Number of IPOs
US$
mill
ions
No.
of I
POs

Global Technology IPO Review Full-year and Q4 2017 30
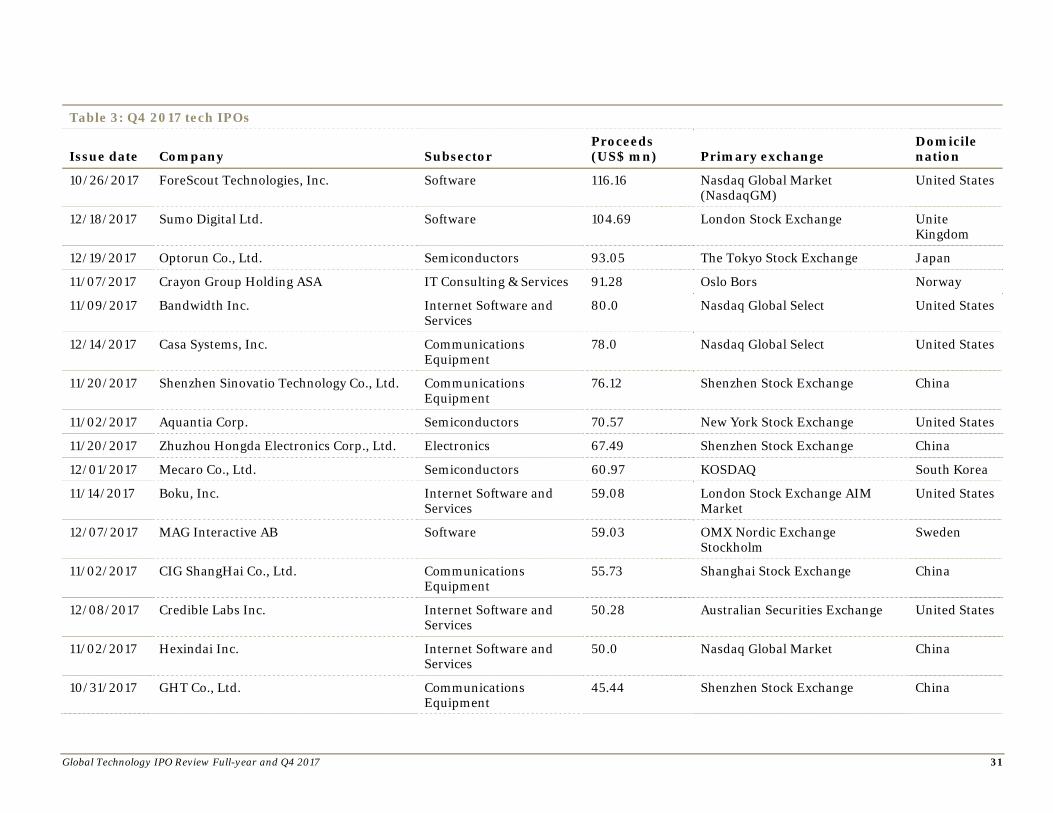
Table 3: Q4 2017 tech IPOs
Issue date Company Subsector Proceeds (US$ mn) Primary exchange
Domicile nation
11/07/2017 China Literature Limited Internet Software and Services
1,120.19 The Stock Exchange of Hong Kong Ltd.
China
10/18/2017 Qudian Inc. Internet Software and Services
900.0 New York Stock Exchange China
10/19/2017 Sea Limited Internet Software and Services
884.4 New York Stock Exchange Singapore
11/08/2017 Sogou Inc. Internet Software and Services
658.37 New York Stock Exchange China
10/06/2017 Switch, Inc. IT Consulting & Services 10.94 New York Stock Exchange United States
11/10/2017 Razer Inc. Computers & Peripherals 608.22 The Stock Exchange of Hong Kong Ltd.
United States
12/18/2017 Ayo Technology Solutions Limited IT Consulting & Services 339.74 The Johannesburg Securities Exchange
South Africa
11/16/2017 SailPoint Technologies Holdings, Inc. Software 240.0 New York Stock Exchange United States
11/15/2017 Jianpu Technology Inc. Internet Software and Services
220.0 New York Stock Exchange China
12/12/2017 Shennan Circuit Company Limited Semiconductors 204.04 Shenzhen Stock Exchange China
10/18/2017 MongoDB, Inc. Software 192.0 Nasdaq Global Market (NasdaqGM)
United States
10/31/2017 Altair Engineering Inc. Software 179.4 Nasdaq Global Select United States
10/11/2017 CarGurus, Inc. Internet Software and Services
172.96 Nasdaq Global Select United States
11/30/2017 Aoshikang Technology Co., Ltd Semiconductors 165.53 Shenzhen Stock Exchange China
11/14/2017 SendGrid, Inc. Software 150.88 New York Stock Exchange United States
12/04/2017 Suzhou Chunqiu Electronic Technology Co., Ltd
Electronics 122.73 Shanghai Stock Exchange China
Global Technology IPO Review Full-year and Q4 2017 31
Table 3: Q4 2017 tech IPOs
Issue date Company Subsector Proceeds (US$ mn) Primary exchange
Domicile nation
10/26/2017 ForeScout Technologies, Inc. Software 116.16 Nasdaq Global Market (NasdaqGM)
United States
12/18/2017 Sumo Digital Ltd. Software 104.69 London Stock Exchange Unite Kingdom
12/19/2017 Optorun Co., Ltd. Semiconductors 93.05 The Tokyo Stock Exchange Japan
11/07/2017 Crayon Group Holding ASA IT Consulting & Services 91.28 Oslo Bors Norway
11/09/2017 Bandwidth Inc. Internet Software and Services
80.0 Nasdaq Global Select United States
12/14/2017 Casa Systems, Inc. Communications Equipment
78.0 Nasdaq Global Select United States
11/20/2017 Shenzhen Sinovatio Technology Co., Ltd. Communications Equipment
76.12 Shenzhen Stock Exchange China
11/02/2017 Aquantia Corp. Semiconductors 70.57 New York Stock Exchange United States
11/20/2017 Zhuzhou Hongda Electronics Corp., Ltd. Electronics 67.49 Shenzhen Stock Exchange China
12/01/2017 Mecaro Co., Ltd. Semiconductors 60.97 KOSDAQ South Korea
11/14/2017 Boku, Inc. Internet Software and Services
59.08 London Stock Exchange AIM Market
United States
12/07/2017 MAG Interactive AB Software 59.03 OMX Nordic Exchange Stockholm
Sweden
11/02/2017 CIG ShangHai Co., Ltd. Communications Equipment
55.73 Shanghai Stock Exchange China
12/08/2017 Credible Labs Inc. Internet Software and Services
50.28 Australian Securities Exchange United States
11/02/2017 Hexindai Inc. Internet Software and Services
50.0 Nasdaq Global Market China
10/31/2017 GHT Co., Ltd. Communications Equipment
45.44 Shenzhen Stock Exchange China

Global Technology IPO Review Full-year and Q4 2017 32
Table 3: Q4 2017 tech IPOs
Issue date Company Subsector Proceeds (US$ mn) Primary exchange
Domicile nation
12/14/2017 Digital Hollywood Interactive Limited Software 40.34 The Stock Exchange of Hong Kong Ltd.
China
Source: S&P Capital IQ with analysis by PwC

Global Technology IPO Review Full-year and Q4 2017 33
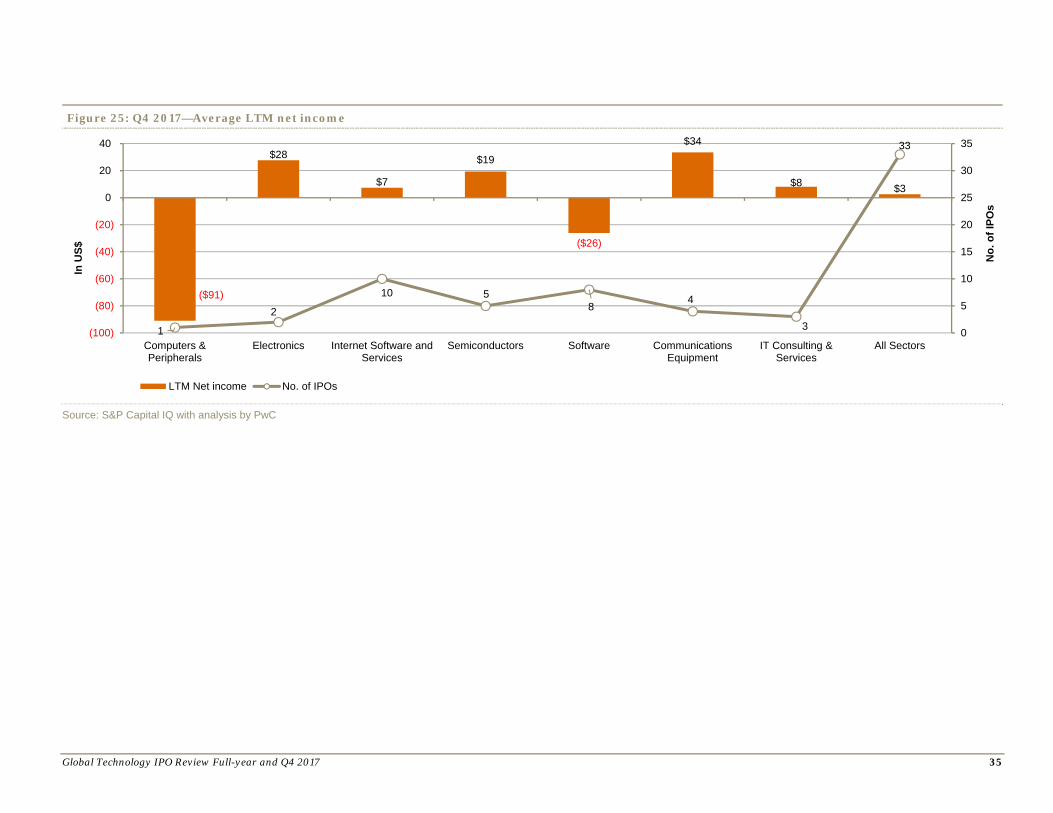
Key financials—Q4 2017 The average last twelve months (LTM) earnings for Q4 2017 was a net profit of US$2.6 million, with of 59% of the companies reporting net income of the 33 tech IPOs in the last quarter of 2017. Qudian Inc. in the Internet Software & Services subsector had the highest net income of US$304 million. While Casa Systems Inc. an American company from the Communications Equipment subsector had the second-highest LTM net income at US$100 million. Sea Limited from the Internet Software & Services subsector and MongoDB Inc. an American company from Software subsector reported the widest LTM net loss of US$370 million and LTM US$92 million respectively.
For the full year, the percentage of companies with net income was relatively higher compared to Q4 at 70% vs 61%. Qudian Inc., in the Internet Software & Services subsector, had the highest net income of US$304 million. Snap Inc. an American company from Internet Software & Services subsector reported the widest LTM net loss of US$514.6 million.
Companies in the Software subsector were responsible for pulling down the average LTM net income along with the Computer Peripherals companies this quarter. In the software subsector six of eight companies (75%) reported a net loss and four of ten (40%) companies reported a net loss in the Internet Software and Services subsector. In 2017, 70% companies reported LTM net income compared to 57% of 2016.
Among the companies that went public in this quarter Crayon Group Holding ASA of the IT Consulting & Services subsector from Norway reported the highest LTM revenue of US$854 million and Australian company Credible Labs Inc. from Internet Software & Services subsector has reported the lowest LTM revenue of US$16 million.
The Computers & Peripherals subsector posted the highest average LTM revenue of US$437 million with only one listing, where IT Consulting & Services subsector acquired the second spot on average LTM revenue with US$418 million. Software subsector has reported the least average LTM revenue of US$129 million with second highest number of subsector listing of this quarter.
Figure 22: Full-year and Q4 2017 technology IPOs – Net income
Source: S&P Capital IQ with analysis by PwC
59%
41%
Q4 2017
Positive net income Net loss
70%
30%
Full-year 2017
Positive net income Net loss

Global Technology IPO Review Full-year and Q4 2017 34
Figure 23: Q4 2017—Average LTM revenue
Figure 24: Q4 2017—Average LTM EBITDA
Source: S&P Capital IQ with analysis by PwC
$437
$165
$303
$264
$129
$184
$418
$247
1 210
58 4 3
33
0
7
14
21
28
35
$-
$100.0
$200.0
$300.0
$400.0
$500.0
Computers &Peripherals
Electronics Internet Softwareand Services
Semiconductors Software CommunicationsEquipment
IT Consulting &Services
All Sectors
No.
of I
POs
LTM revenue No. of IPOs
In U
S$ m
illio
ns
($87)
$37 $24
$41
($15)
$45 $63
$20
1 210
5
84
3
33
0
7
14
21
28
35
(150)
(100)
(50)
0
50
100
Computers &Peripherals
Electronics Internet Softwareand Services
Semiconductors Software CommunicationsEquipment
IT Consulting &Services
All Sectors
No.
of I
POs
LTM EBITDA No. of IPOs
In U
S$ m
illio
ns
Global Technology IPO Review Full-year and Q4 2017 35
Figure 25: Q4 2017—Average LTM net income
Source: S&P Capital IQ with analysis by PwC
($91)
$28
$7
$19
($26)
$34
$8 $3
1
2
10 58
4
3
33
0
5
10
15
20
25
30
35
(100)
(80)
(60)
(40)
(20)
0
20
40
Computers &Peripherals
Electronics Internet Software andServices
Semiconductors Software CommunicationsEquipment
IT Consulting &Services
All Sectors
No.
of I
POs
LTM Net income No. of IPOs
In U
S$
Global Technology IPO Review Full-year and Q4 2017 36
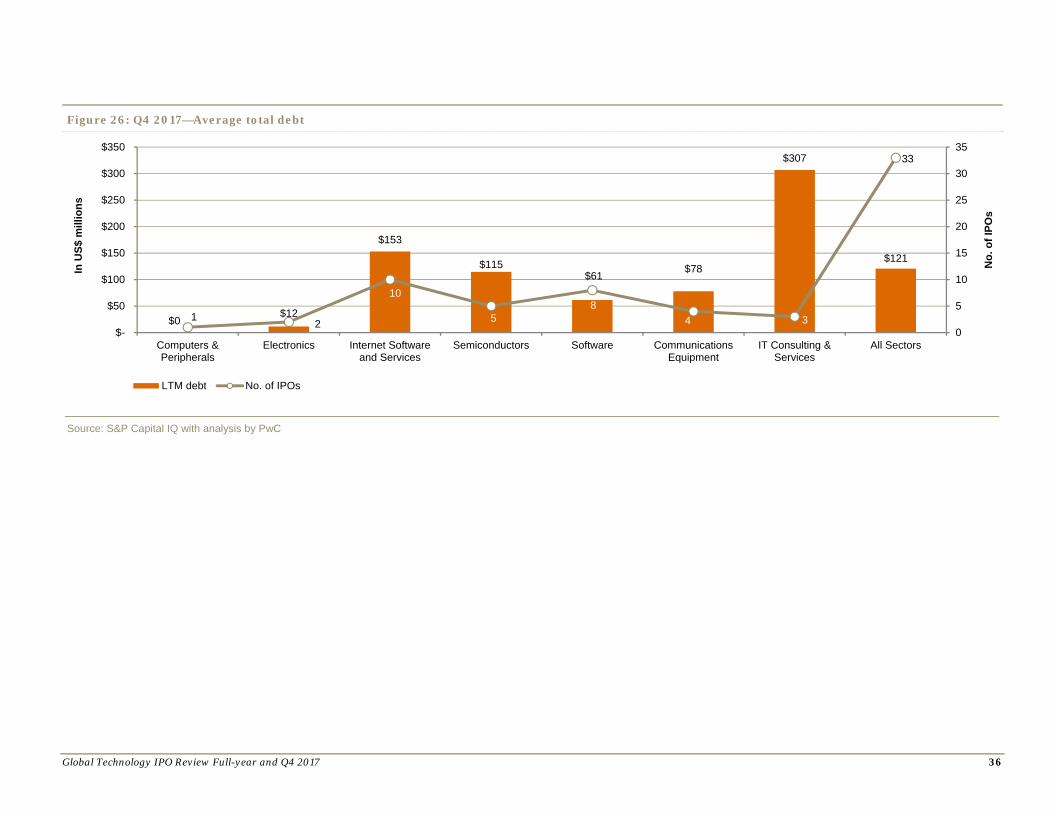
Figure 26: Q4 2017—Average total debt
Source: S&P Capital IQ with analysis by PwC
$0$12
$153
$115$61
$78
$307
$121
1 2
10
58
4 3
33
0
5
10
15
20
25
30
35
$-
$50
$100
$150
$200
$250
$300
$350
Computers &Peripherals
Electronics Internet Softwareand Services
Semiconductors Software CommunicationsEquipment
IT Consulting &Services
All Sectors
No.
of I
POs
LTM debt No. of IPOs
In U
S$ m
illio
ns

Global Technology IPO Review Full-year and Q4 2017 37
Figure 27: Q4 2017—Average Enterprise Value
Source: S&P Capital IQ with analysis by PwC
$4,374
$1,322
$3,242
$1,402$981 $1,109
$960
$1,867
1 2
10
58 4 3
33
0
7
14
21
28
35
$-
$1,000
$2,000
$3,000
$4,000
$5,000
Computers &Peripherals
Electronics Internet Softwareand Services
Semiconductors Software CommunicationsEquipment
IT Consulting &Services
All Sectors
No.
of I
POs
Enterprise value No. of IPOs
In U
S$ m
illio
ns

Global Technology IPO Review Full-year and Q4 2017 38
Q4 2017 Technology IPO listings: Valuation metrics The overall valuation of technology IPOs marginally decreased in Q4 2017 compared to Q4 2016. Internet Software & Services and Computers & Peripherals led the valuation metrics with an average of 10.7x and 10.0x, respectively.
The average EV/LTM revenue for listed IPOs in Q4 2017 was 7.6x, lower than 8.1x in Q4 2016. The Computers & Peripherals subsector had only one listing with the highest enterprise value of US$4,374 million and also highest LTM revenue of US$437 million, thus making the EV/LTM revenue 10.0x, which has acquired the second position.
Companies in the Electronics subsector has posted an average revenue multiple of 8.0x, followed by Software at 7.6x. The IT Consulting & Services subsector reported the lowest revenue multiple of 2.3x.
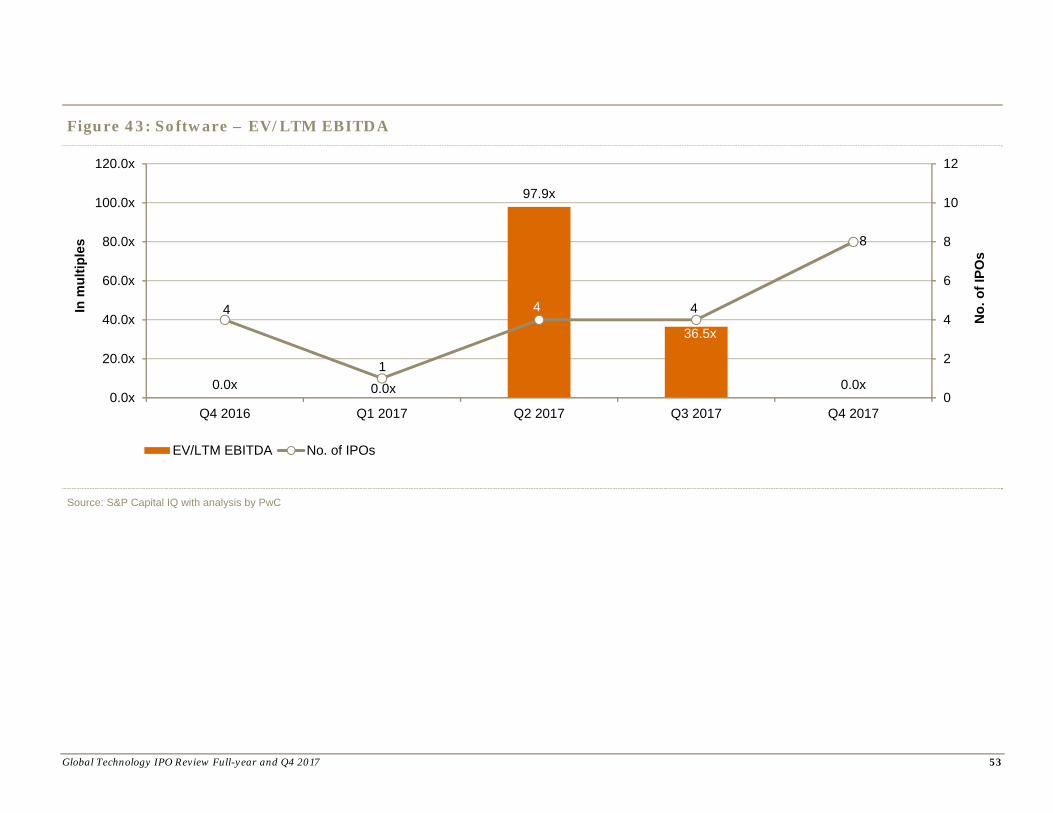
The Internet Software & Services subsector led with the highest average EV/LTM EBITDA multiple of 137.9x, followed by the Electronics subsector at 35.6x and the Semiconductor subsector at 34.4x. The IT Consulting & Services subsector has posted the lowest EV/LTM EBITDA as well, at 15.3x.
Figure 28: Q4 2017 EV/LTM revenue
Source: S&P Capital IQ with analysis by PwC
10.0x
8.0x
10.7x
5.3x
7.6x
6.0x
2.3x
7.6x
1 2
10
5
8
4
3
33
0
7
14
21
28
35
0.0x
3.0x
6.0x
9.0x
12.0x
15.0x
Com
pute
rs&
Per
iphe
rals
Ele
ctro
nics
Inte
rnet
Sof
twar
ean
d S
ervi
ces
Sem
icon
duct
ors
Sof
twar
e
Com
mun
icat
ions
Equ
ipm
ent
IT C
onsu
lting
& S
ervi
ces
All
Sec
tors
No.
of I
POs
EV/LTM revenue No. of IPOs
In m
ultip
les

Global Technology IPO Review Full-year and Q4 2017 39
Figure 29: Q4 2017 EV/LTM EBITDA
Source: S&P Capital IQ with analysis by PwC
0.0x
35.6x
137.9x
34.4x
0.0x
24.9x
15.3x
94.6x
1
2
10
5
8
4
3
33
0
7
14
21
28
35
0.0x
40.0x
80.0x
120.0x
160.0x
Computers &Peripherals
Electronics Internet Softwareand Services
Semiconductors Software CommunicationsEquipment
IT Consulting &Services
All Sectors
No.
of I
POs
EV/ LTM EBITDA No. of IPOs
In m
ultip
les

Global Technology IPO Review Full-year and Q4 2017 40
Internet Software & Services Except for Q3 2017 this sector held on to the top spot in terms of tech IPO volume with 10 IPOs, in the rest of the three quarters including Q4 2017.
The subsector reported a 233% increase in terms of number of deals quarter on quarter.
Average LTM revenue for the quarter increased by 54% quarter on quarter. Sectorial average LTM EBIDTA and LTM net income took a fall, led by Sea Limited with US$352 million of negative LTM EBITDA and a LTM net loss of US$370 million.
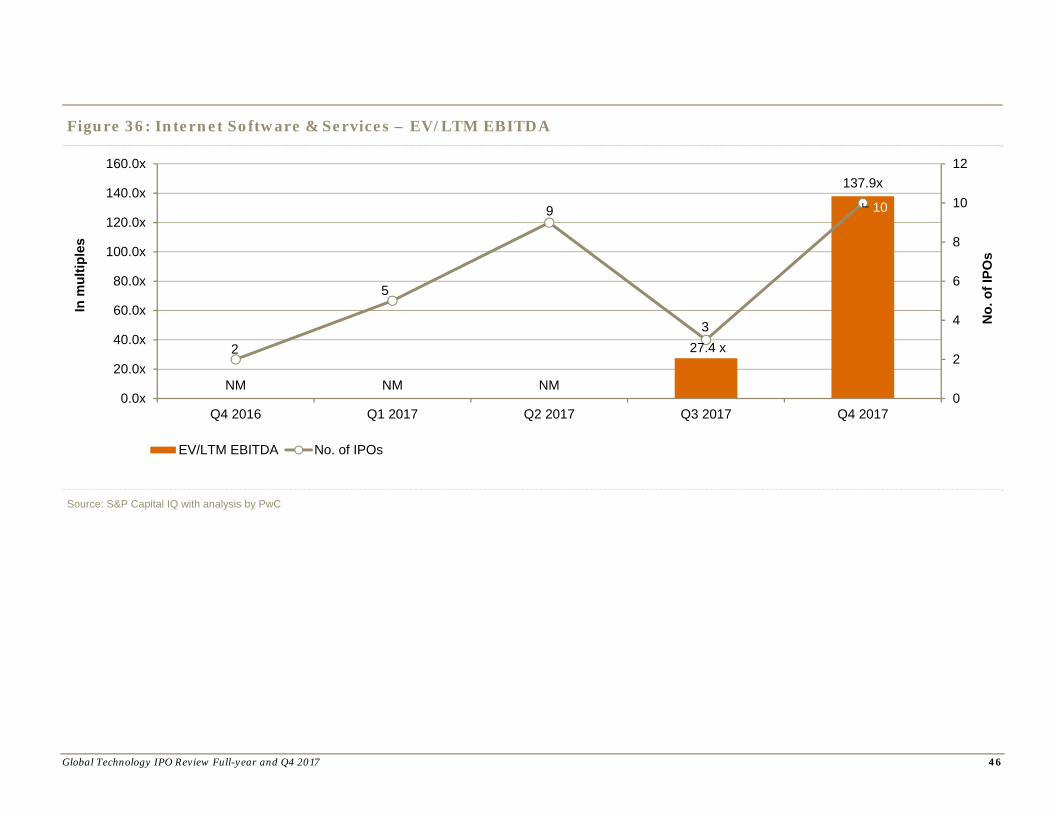
The EV/LTM revenue multiple was 10.7x for Q4 2017, which was also the highest sectorial EV/LTM revenue in the quarter. EV/LTM EBITDA was 137.9x, which was also the highest among all the sectors.
Figure 30: Internet Software & Services – LTM revenue
Source: S&P Capital IQ with analysis by PwC
$472
$204
$312
$198
$303
2
5
9
3
10
0
2
4
6
8
10
12
$0
$100
$200
$300
$400
$500
$600
Q4 2016 Q1 2017 Q2 2017 Q3 2017 Q4 2017
No.
of I
POs
LTM revenue No. of IPOs
US$
mill
ions

Global Technology IPO Review Full-year and Q4 2017 41
Figure 31: Internet Software & Services – LTM EBITDA
Source: S&P Capital IQ with analysis by PwC
($54)
($92)
($42)
42.8 $24
2
5
9
3
10
0
2
4
6
8
10
12
($120)
($90)
($60)
($30)
$0
$30
$60
Q4 2016 Q1 2017 Q2 2017 Q3 2017 Q4 2017
No.
of I
POs
LTM EBITDA No. of IPOs
US$
mill
ions

Global Technology IPO Review Full-year and Q4 2017 42
Figure 32: Internet Software & Services – LTM net income
Source: S&P Capital IQ with analysis by PwC
($479)
($92) ($77)
$30 $7
2
5
9
3
10
0
2
4
6
8
10
12
($500)
($400)
($300)
($200)
($100)
$0
$100
Q4 2016 Q1 2017 Q2 2017 Q3 2017 Q4 2017
No.
of I
POs
LTM net income No. of IPOs
US$
mill
ions

Global Technology IPO Review Full-year and Q4 2017 43
Figure 33: Internet Software & Services – Enterprise value
Source: S&P Capital IQ with analysis by PwC
$4,587
$5,674
$3,015
$1,173
$3,242
2
5
9
3
10
0
2
4
6
8
10
12
$0
$1,000
$2,000
$3,000
$4,000
$5,000
$6,000
Q4 2016 Q1 2017 Q2 2017 Q3 2017 Q4 2017
No.
of I
POs
Enterprise value No. of IPOs
US$
mill
ions

Global Technology IPO Review Full-year and Q4 2017 44
Figure 34: Internet Software & Services – Total debt
Source: S&P Capital IQ with analysis by PwC
$28
$11$31
$5
$153
2
5
9
3
10
0
2
4
6
8
10
12
0
20
40
60
80
100
120
140
160
180
Q4 2016 Q1 2017 Q2 2017 Q3 2017 Q4 2017
No.
of I
POs
Total debt No. of IPOs
US$
mill
ions

Global Technology IPO Review Full-year and Q4 2017 45
Figure 35: Internet Software & Services – EV/LTM revenue
Source: S&P Capital IQ with analysis by PwC
9.7x
27.9x
9.7x
5.9x
10.7x
2
5
9
3
10
0
2
4
6
8
10
12
0.0x
5.0x
10.0x
15.0x
20.0x
25.0x
30.0x
Q4 2016 Q1 2017 Q2 2017 Q3 2017 Q4 2017
No.
of I
POs
EV/LTM revenue No. of IPOs
In m
ultip
les
Global Technology IPO Review Full-year and Q4 2017 46
Figure 36: Internet Software & Services – EV/LTM EBITDA
Source: S&P Capital IQ with analysis by PwC
NM NM NM
27.4 x
137.9x
2
5
9
3
10
0
2
4
6
8
10
12
0.0x
20.0x
40.0x
60.0x
80.0x
100.0x
120.0x
140.0x
160.0x
Q4 2016 Q1 2017 Q2 2017 Q3 2017 Q4 2017
No.
of I
POs
EV/LTM EBITDA No. of IPOs
In m
ultip
les

Global Technology IPO Review Full-year and Q4 2017 47
Software As per the number of IPOs listed in this quarter, with eight IPO listing, the Software subsector got placed just after the Internet Software & Services.
Software reported average revenue of US$129 million in Q4 2017, a decrease of 4.2% quarter on quarter but increased 29% year on year. In terms of the number of deals, the subsector has seen a 100% increase in both quarter on quarter and year-on-year. The sector’s average LTM EBIDTA turned negative, led by the negative LTM EBITDA number of MongoDB Inc. and ForeScout Technologies Inc.
The subsector posted negative average LTM net income of US$26 million in this quarter compared to its previous quarter LTM net income of US$14 million. The fall was mainly led by the negative number posted by MongoDB Inc. of US$92 million, followed by ForeScout Technologies Inc. of US$72 million.
The average EV for the quarter is US$980.8 million, a decrease of 4.5% quarter on quarter.
Figure 37: Software – LTM revenue
Source: S&P Capital IQ with analysis by PwC
$100$86
$112
$135$129
4
1
4 4
8
0
2
4
6
8
10
12
$0
$30
$60
$90
$120
$150
$180
Q4 2016 Q1 2017 Q2 2017 Q3 2017 Q4 2017
No.
of I
POs
LTM revenue No. of IPOs
US$
mill
ions

Global Technology IPO Review Full-year and Q4 2017 48
Figure 38: Software – LTM EBITDA
Source: S&P Capital IQ with analysis by PwC
($7) ($21)$7
$28
($15)
4
1
4 4
8
0
2
4
6
8
10
12
($30)
($18)
($6)
$6
$18
$30
$42
Q4 2016 Q1 2017 Q2 2017 Q3 2017 Q4 2017
No.
of I
POs
LTM EBITDA No. of IPOs
US$
mill
ions

Global Technology IPO Review Full-year and Q4 2017 49
Figure 39: Software – LTM net income
Source: S&P Capital IQ with analysis by PwC
($18)
($24)
$5
$14
($26)
4
1
44
8
(4)
(2)
0
2
4
6
8
10
12
($36)
($29)
($22)
($15)
($8)
($1)
$6
$13
$20
Q4 2016 Q1 2017 Q2 2017 Q3 2017 Q4 2017
No.
of I
POs
LTM net income No. of IPOs
US$
mill
ions

Global Technology IPO Review Full-year and Q4 2017 50
Figure 40: Software – EV
Source: S&P Capital IQ with analysis by PwC
$756
$1,004
$678
$1,027$981
4
1
4 4
8
0
2
4
6
8
10
12
$0.00
$200.00
$400.00
$600.00
$800.00
$1,000.00
$1,200.00
Q4 2016 Q1 2017 Q2 2017 Q3 2017 Q4 2017
No.
of I
POs
Enterprise value No. of IPOs
US$
mill
ions

Global Technology IPO Review Full-year and Q4 2017 51
Figure 41: Software – Total debt
Source: S&P Capital IQ with analysis by PwC
$30
$0
$11 $12
$61
4
1
4 4
8
0
4
8
12
$0
$14
$28
$42
$56
$70
Q4 2016 Q1 2017 Q2 2017 Q3 2017 Q4 2017
No.
of I
POs
Total debt No. of IPOs
US$
mill
ions

Global Technology IPO Review Full-year and Q4 2017 52
Figure 42: Software – EV/LTM revenue
Source: S&P Capital IQ with analysis by PwC
7.5x
11.7x
6.0x
7.6x7.6x
4
1
4 4
8
0
2
4
6
8
10
12
0.0x
2.0x
4.0x
6.0x
8.0x
10.0x
12.0x
Q4 2016 Q1 2017 Q2 2017 Q3 2017 Q4 2017
No.
of I
POs
EV/LTM revenue No. of IPOs
In m
ultip
les
Global Technology IPO Review Full-year and Q4 2017 53
Figure 43: Software – EV/LTM EBITDA
Source: S&P Capital IQ with analysis by PwC
0.0x 0.0x
97.9x
36.5x
0.0x
4
1
4 4
8
0
2
4
6
8
10
12
0.0x
20.0x
40.0x
60.0x
80.0x
100.0x
120.0x
Q4 2016 Q1 2017 Q2 2017 Q3 2017 Q4 2017
No.
of I
POs
EV/LTM EBITDA No. of IPOs
In m
ultip
les

Global Technology IPO Review Full-year and Q4 2017 54
Semiconductors With five IPOs in the quarter, the Semiconductors subsector came in third, below Internet Software & Services and Software. The average LTM revenue in Q4 was US$264 million. This was up 158% quarter on quarter and a decent 44% year on year. This increase was primarily driven by Shennan Circuit Company Limited (US$842 million) and Aoshikang Technology Co. Ltd. (US$245 million).
This subsector reported an average EV of US$1,402 million in Q4 2017, a massive 220% increase quarter on quarter. Average LTM EBIDTA rose a huge 111% and 827% quarter on quarter and year on year, respectively, whereas average LTM net income turned around to US$19 million from LTM a net loss of US$8 million.
LTM net income of Chinese company Shennan Circuit Company Limited posted the highest number while American company Aquantia Corp. was the only company to report a net loss, which hit US$4 million.
Figure 44: Semiconductors – LTM revenue
Source: S&P Capital IQ with analysis by PwC
$183 $181
$270
$102
$264
23
8
3
5
0
2
4
6
8
10
12
$0
$50
$100
$150
$200
$250
$300
Q4 2016 Q1 2017 Q2 2017 Q3 2017 Q4 2017
No.
of I
POs
LTM revenue No. of IPOs
In U
S$ m
illio
ns

Global Technology IPO Review Full-year and Q4 2017 55
Figure 45: Semiconductors – LTM EBITDA
Source: S&P Capital IQ with analysis by PwC
$4
$49
$41
$19
$41
2 3
8
3
5
0
2
4
6
8
10
12
$0
$10
$20
$30
$40
$50
$60
Q4 2016 Q1 2017 Q2 2017 Q3 2017 Q4 2017
No.
of I
POs
LTM EBITDA No. of IPOs
In U
S$ m
illio
ns

Global Technology IPO Review Full-year and Q4 2017 56
Figure 46: Semiconductors – LTM net income
Source: S&P Capital IQ with analysis by PwC
($8)
$36
$21 $13 $19
2 3
8
3
5
0
2
4
6
8
10
12
($14)
($5)
$4
$13
$22
$31
$40
Q4 2016 Q1 2017 Q2 2017 Q3 2017 Q4 2017
No.
of I
POs
LTM Net income No. of IPOs
In U
S$ m
illio
ns

Global Technology IPO Review Full-year and Q4 2017 57
Figure 47: Semiconductors – EV
Source: S&P Capital IQ with analysis by PwC
$342
$1,614
$791 $439
$1,402
23
8
3
5
0
2
4
6
8
10
12
$0
$300
$600
$900
$1,200
$1,500
$1,800
Q4 2016 Q1 2017 Q2 2017 Q3 2017 Q4 2017
No.
of I
POs
Enterprise value No. of IPOs
In U
S$ m
illio
ns

Global Technology IPO Review Full-year and Q4 2017 58
Figure 48: Semiconductors – Total debt
Source: S&P Capital IQ with analysis by PwC
$35
$19
$73
$14
$115
2
3
8
3
5
0
2
4
6
8
10
12
$0
$20
$40
$60
$80
$100
$120
Q4 2016 Q1 2017 Q2 2017 Q3 2017 Q4 2017
No.
of I
POs
Total debt No. of IPOs
In U
S$ m
illio
ns

Global Technology IPO Review Full-year and Q4 2017 59
Figure 49: Semiconductors – EV/LTM revenue
Source: S&P Capital IQ with analysis by PwC
1.9x
8.9x
2.9x
4.3x5.3x
2
3
8
35
0
2
4
6
8
10
12
0.0x
2.0x
4.0x
6.0x
8.0x
10.0x
12.0x
Q4 2016 Q1 2017 Q2 2017 Q3 2017 Q4 2017
No.
of I
POs
EV/LTM revenue No. of IPOs
In m
ultip
les

Global Technology IPO Review Full-year and Q4 2017 60
Figure 50: Semiconductors – EV/LTM EBITDA
Source: S&P Capital IQ with analysis by PwC
77.7x
33.1x
19.3x
22.7x 34.4x
23
8
3
5
0
2
4
6
8
10
12
0.0x
15.0x
30.0x
45.0x
60.0x
75.0x
90.0x
Q4 2016 Q1 2017 Q2 2017 Q3 2017 Q4 2017
No.
of I
POs
EV/LTM EBITDA No. of IPOs
In m
ultip
les

Global Technology IPO Review Full-year and Q4 2017 61
Methodology The Global Technology IPO Review for Q4 and full-year 2017 is based on PwC’s analysis of transaction data extracted from S&P Capital IQ. The analysis considers IPOs across all countries worldwide during the period of 1 October 2017 to 31 December 2017 (Q4), 1 January 2016 to 31 December 2017 (full-year) and from 2010-2017 Financial data was also obtained from S&P Capital IQ.
The definition of the Technology sector is based on the S&P Capital IQ database industry classifications and includes the following subsectors:
Internet Software & Services IT Consulting & Services Professional Services (e.g., Application Software, Software Solutions) Semiconductors Software Computers & Peripherals
– Computers, Computers Peripheral Equipment – Computers, Storage Device Manufacturing
Electronic Computers Manufacturing (“Electronics”) Communications Equipment
Only IPOs with an issue size greater than US$40 million were included in the analysis.
All monetary amounts are in US dollars unless otherwise indicated.
Most figures are rounded to one decimal.
Global Technology IPO Review Full-year and Q4 2017 62
For more information
If you would like to discuss how these findings might impact your business or your future strategy, please reach out to any of our technology industry leaders listed below.
Raman Chitkara Global Technology Leader Phone: 1 408 817 3746 Email: [email protected]
Rod Dring – Australia Phone: 61 2 8266 7865 Email: [email protected]
Estela Vieira – Brazil Phone: 55 1 3674 3802 Email: [email protected]
Christopher Dulny – Canada Phone: 1 416 869 2355 Email: [email protected]
Jianbin Gao – China Phone: 86 21 2323 3362 Email: [email protected]
Pierre Marty – France Phone: 33 1 5657 58 15 Email: [email protected]
Werner Ballhaus – Germany Phone: 49 211 981 5848 Email: [email protected]
Sandeep Ladda – India Phone: 91 22 6689 1444 Email: [email protected]
Masahiro Ozaki – Japan Phone: 81 3 5326 9090 Email: [email protected]
Steven Kang – Korea Phone: 82 2 709 0201 Email: [email protected]
Ilja Linnemeijer – The Netherlands Phone: 31 88 792 4956 Email: [email protected]
Yury Pukha – Russia Phone: 7 495 223 5177 Email: [email protected]
Mark Jansen – Singapore Phone: 65 6236 7388 Email: [email protected]
Jass Sarai – UK Phone: 44 0 1895 52 2206 Email: [email protected]
Mark McCaffrey – US Phone: 1 408 817 4199 Email: [email protected]
Alan Jones – US (Deals partner) Phone: 1 415 498 7398 Email: [email protected]
About PwC’s technology institute The Technology Institute is PwC’s global research network that studies the business of technology and the technology of business with the purpose of creating thought leadership that offers both fact-based analysis and experience-based perspectives. Technology Institute insights and viewpoints originate from active collaboration between our professionals across the globe and their first-hand experiences working in and with the technology industry.
About PwC At PwC, our purpose is to build trust in society and solve important problems. We’re a network of firms in 157 countries with more than 223,000 people who are committed to delivering quality in assurance, advisory and tax services. Find out more and tell us what matters to you by visiting us at http://www.pwc.com/
This content is for general information purposes only and should not be used as a substitute for consultation with professional advisors.
© 2017 PwC. All rights reserved. PwC refers to the US member firm or one of its subsidiaries or affiliates, and may sometimes refer to the PwC network. Each member firm is a separate legal entity. Please see www.pwc.com/structure for further details.