
IPNI and the World of Crop Nutrition September, 2013 Paul E. Fixen Sr. Vice President...
34
IPNI and the World of Crop Nutrition September, 2013 Paul E. Fixen Sr. Vice President [email protected]
-
Upload
albert-stevenson -
Category
Documents
-
view
216 -
download
1
Transcript of IPNI and the World of Crop Nutrition September, 2013 Paul E. Fixen Sr. Vice President...

• IPNI is a not-for-profit, scientific organization in its 7th year of operation
• Established in 2007 from the Potash Phosphate Institute (PPI)
The mission of IPNI is to develop and promote scientific information about the responsible management of plant nutrition for the benefit of the human family.

IPNI is supported by leading fertilizer manufacturers …

… and industry associations

IPNI ... 34 scientists and 13 Program Areas
Eastern Europe & Central AsiaNorth America
Brazil
Latin America Southern Cone
Northern Latin America
Mexico & Central America
Australia & New Zealand
Sub-Saharan Africa
North AfricaMiddle East
Southeast Asia
South Asia
China
Agronomic programs focus on research and education
1. Collaborate with others to lead in the development of regional and global plant nutrition issues
2. Facilitate research supporting 4R nutrient stewardship for the sustainable use of plant nutrients
3. Educate and engage our stakeholders to enable continuous improvement of nutrient stewardship
4. Support IPNI members in their research and educational activities related to nutrient use

IPNI scientists have regional and global responsibilities• Regional programs are driven by local staff to address local
challenges and opportunities related to plant nutrition– Agronomic education– Research and demonstration activities– Member company support
• Global nutrient issues are addressed through thematic working groups
– Nutrient use & cycling– Nutrient stewardship performance & environment– Nutrient stewardship educational tools– Nutrient decision support – maize systems– Nutrient decision support – soybean systems– Nutrient decision support – precision agriculture

Decision Support Tools …. integrate the numerous site factors used in making decisions about nutrient management practices…
Nutrient Expert for wheat helps you to:• Evaluate current nutrient management practices• Determine a meaningful yield goal • Estimate fertilizer NPK rates• Translate rates into fertilizer sources• Develop application strategy (source, rate, time, place)• Compare expected or actual benefit of current and improved practices

Precision Ag in IPNI programs
• The premier precision event with over 1100 attendees
• 5 concurrent sessions• 78 speakers• Going annual – 7/2014• A key to the future of
nutrient stewardship
101 Exhibits

Communications and Websites• Hard copy and e-publications• Press releases, folders, periodicals,
manuals, books, posters, slide sets, Better Crops, etc.
www.ipni.net

Soil Test Levels in North America
• 4.4 million samples from 60 private and public labs
• P, K, Mg, S, Cl-, Zn and pH
• represents about 75% of samples taken

Percent of samples testing below critical levels for major crops in 2010
P Levels K Levels
Source: Soil Test Levels in North America, 2010. IPNI
• Median soil test P = 25 ppm; declined 6 ppm from 2005• Median soil test K = 150 ppm; declined 4 ppm from 2005
ppm = parts per million
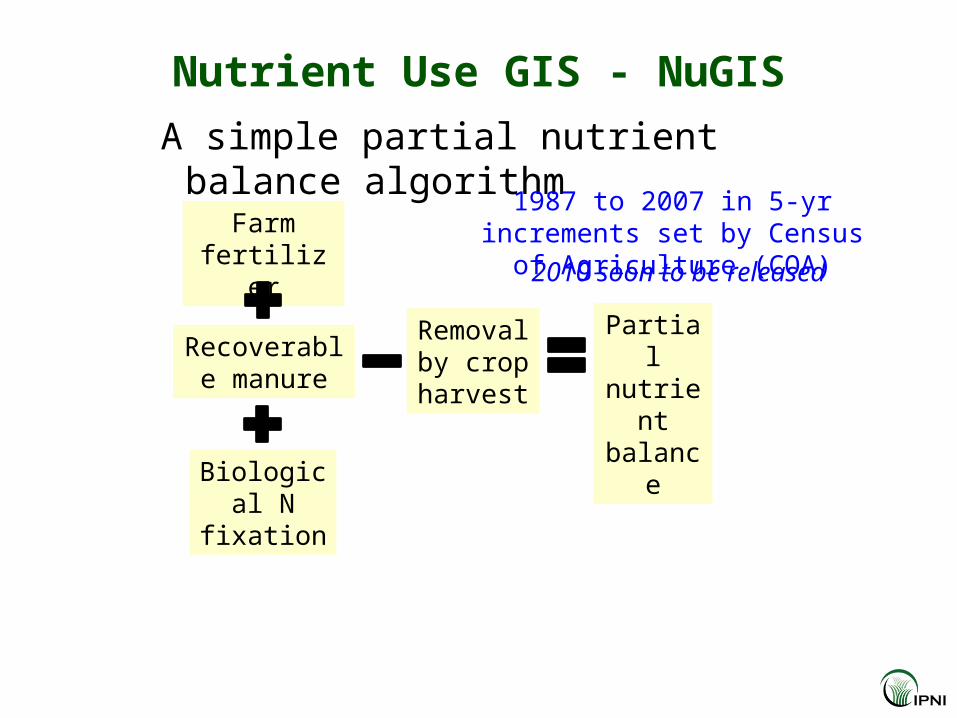
Nutrient Use GIS - NuGISA simple partial nutrient balance algorithm
Farm fertilizer
Recoverable manure
Biological N fixation
Removal by crop harvest
Partial nutrient balance
1987 to 2007 in 5-yr increments set by Census of Agriculture (COA)
2010 soon to be released

Interactive Graphics
3,117 counties2,150 8-digit hydrologic units18 Hydrologic regions
http://www.ipni.net/nugis
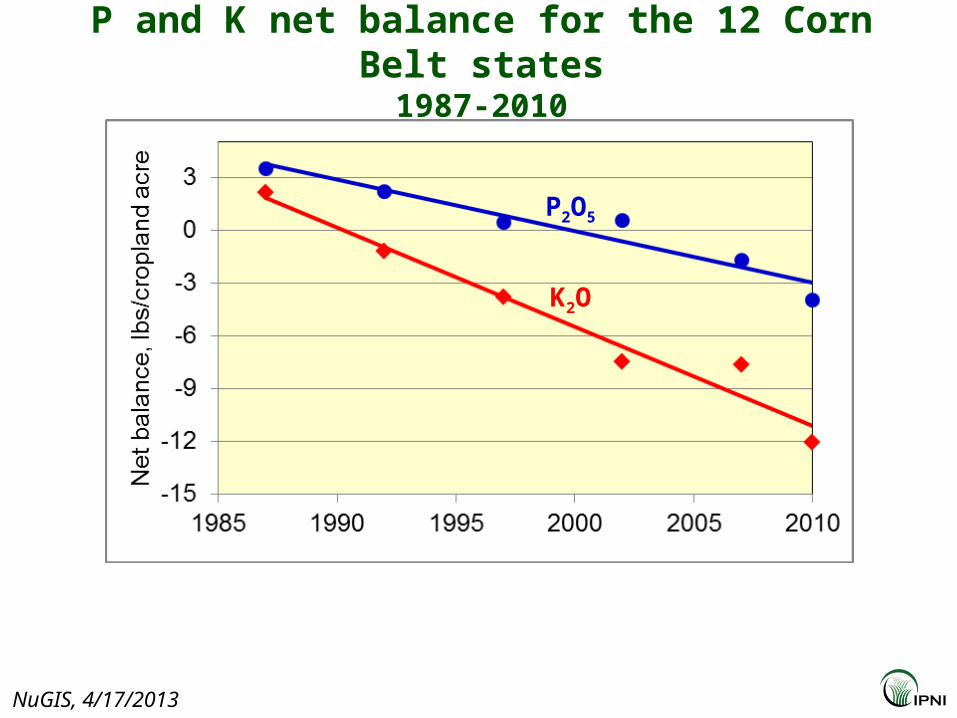
P and K net balance for the 12 Corn Belt states1987-2010
P2O5
K2O
NuGIS, 4/17/2013
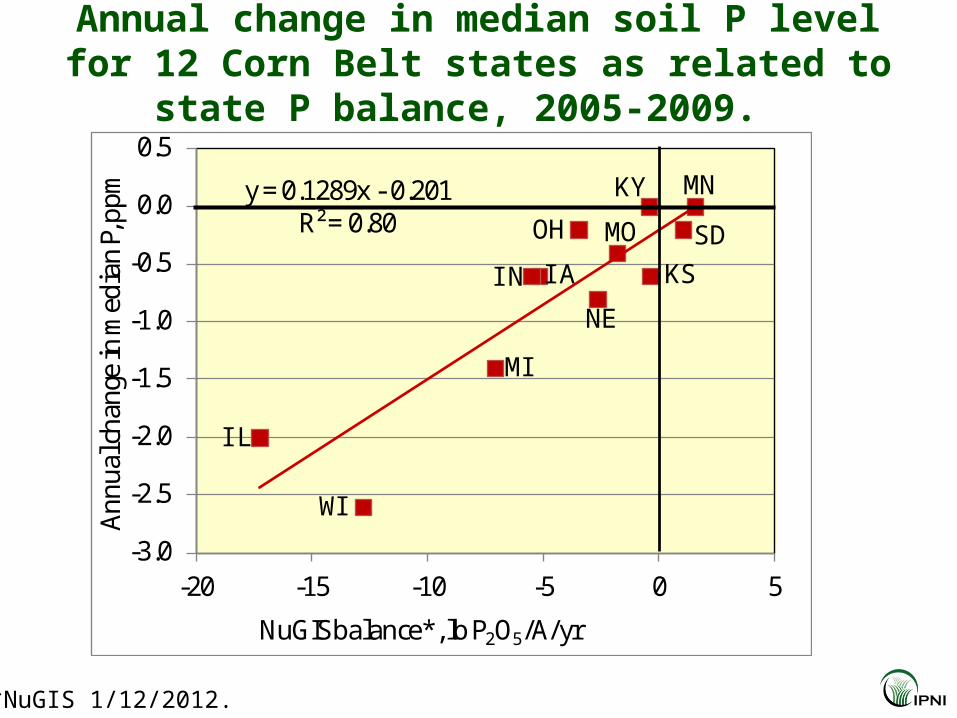
y = 0.1289x - 0.201R² = 0.80
-3.0
-2.5
-2.0
-1.5
-1.0
-0.5
0.0
0.5
-20 -15 -10 -5 0 5
Annu
al ch
ange
in m
edia
n P,
ppm
NuGIS balance*, lb P2O5/A/yr
Annual change in median soil P level for 12 Corn Belt states as related to state P balance, 2005-2009.
*NuGIS 1/12/2012.
WI
IL
MI
IA
MN
SD
KS
OH
IN
NE
KY
MO
Annual program report highlight activities.
Available at: http://www.ipni.net/programreport
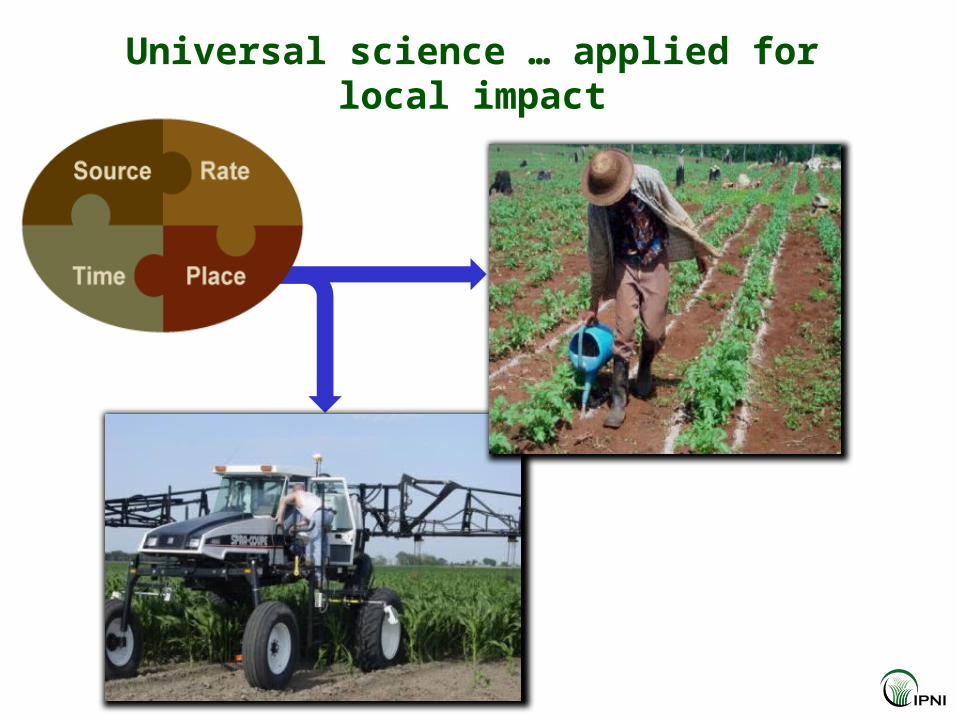
Universal science … applied for local impact

Our biggest challenge: the permanent “greening” of this map
% of population undernourished

World population prediction to 2100 (UN, 2010)
7 billion today, 9 billion by 2050
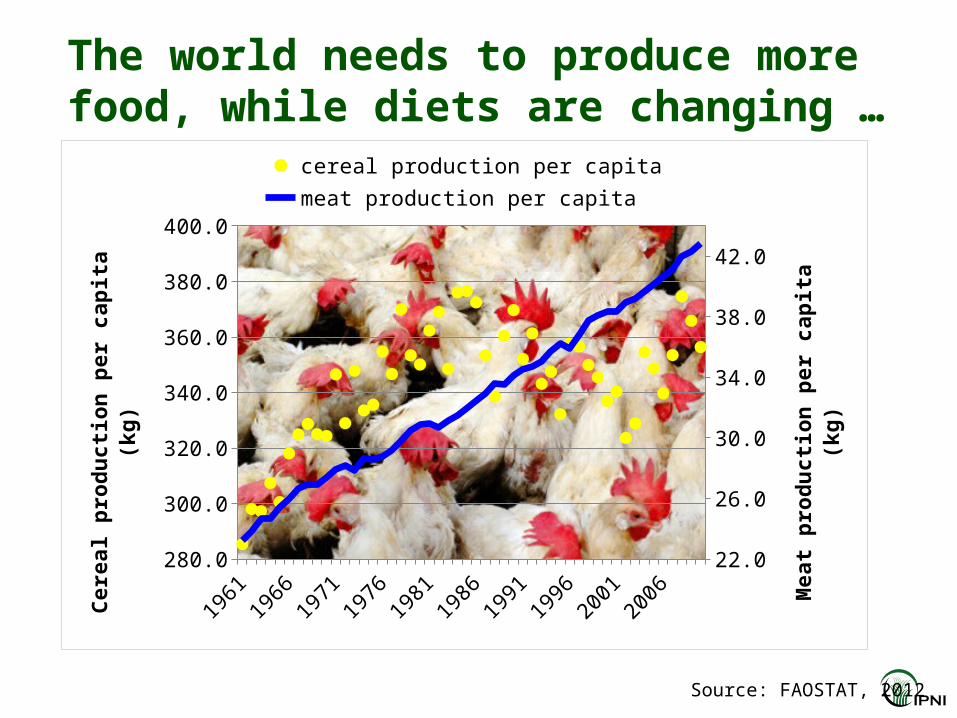
The world needs to produce more food, while diets are changing …
1961
1964
1967
1970
1973
1976
1979
1982
1985
1988
1991
1994
1997
2000
2003
2006
2009
280.0
300.0
320.0
340.0
360.0
380.0
400.0
22.0
26.0
30.0
34.0
38.0
42.0
cereal production per capita meat production per capita
Ce
rea
l p
rod
uc
tio
n p
er
ca
pit
a (
kg
)
Me
at
pro
du
cti
on
pe
r c
ap
ita
(k
g)
Source: FAOSTAT, 2012

The world needs to produce more food … 50 to 70 % increase by 2050, some predict 100%
Options:
1. Increase harvested area
2. Increase yield
1965 1970 1975 1980 1985 1990 1995 2000 2005 2010 201540
60
80
100
120
140
160
180
Corn
gra
in y
ield
, bu/
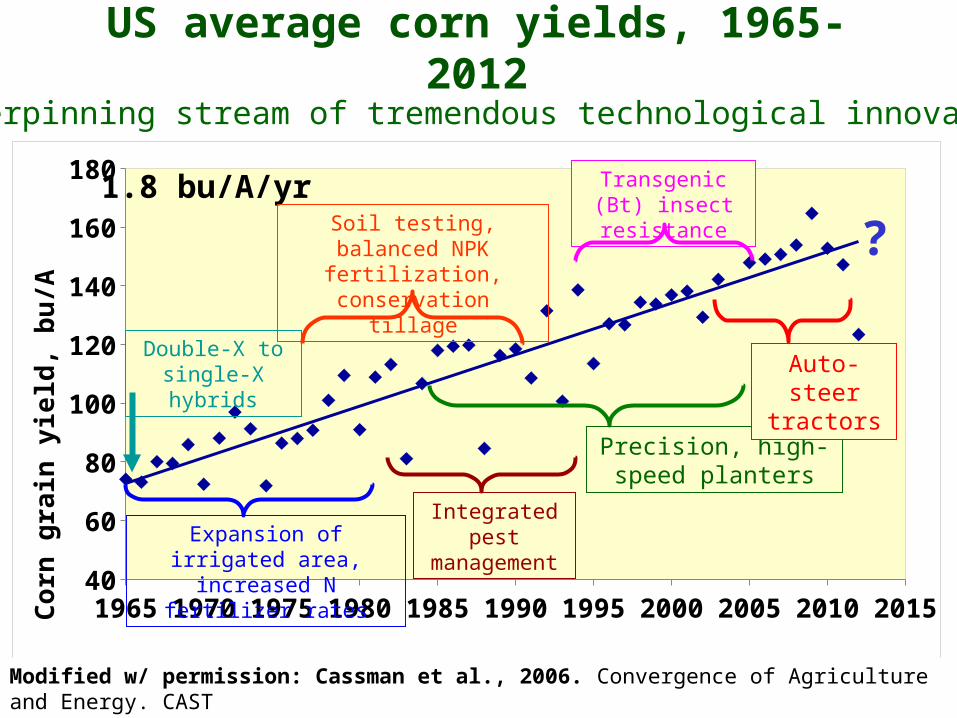
AUS average corn yields, 1965-2012
Modified w/ permission: Cassman et al., 2006. Convergence of Agriculture and Energy. CAST
1.8 bu/A/yr
(underpinning stream of tremendous technological innovation)
Double-X to single-X hybrids
Expansion of irrigated area, increased N fertilizer rates
Soil testing, balanced NPK fertilization, conservation
tillage
Transgenic (Bt) insect resistance
Integrated pest management
Precision, high-speed planters
Auto-steer tractors
?

Potential impact of climate change on crop yields in 2050 relative to 2000
With full CO2 fertilization
Without CO2 fertilization
% change
Which map “… will much depend on availability of additional inputs, especially N.”
World Bank (Background note to the World Development Report 2010).
What is the role of fertilization?

Yield attributable to fertilizer
• Temperate soils: 40-60% • Tropical soils: much higher
Stewart et al., 2005.

Response to P & K fertilization in the cerrado of Brazil

Our biggest challenge: the permanent “greening” of this map
Improved crop nutrition will play a major role in meeting that challenge
% under-nourished

Underlying factors for the challenges of the coming decades
Soil & nutrient management are
common to all threeHuman nutrition
LandCarbon
• Land use• Soil quality• Water use & quality• Waste disposal• Etc.
• Climate change• Cheap energy• Bioenergy• Etc.
• Food quantity• Food quality• Food cost
Carbon and land concept by Henry Janzen, 2009
A triangle of opportunity for those offering
solutionsor
a target for those perceived as contributing
to problems

A multitude of economic, environmental, and social issues involving crop nutrients
Coastal hypoxiaClimate change
Biofuels Air qualityFood quality
Fresh water eutrophication
Biodiversity in natural eco-systems
Food supply and cost
Conserving natural lands
Fertilizer costs& security

4R Nutrient Stewardship
Applying the Right Source at the Right Rate at the Right Time and in the Right Place within well managed cropping systems
Right is defined by practice impact on system performance
Cropping system

Sustainability Initiatives by major food retailersChanneling consumer interests
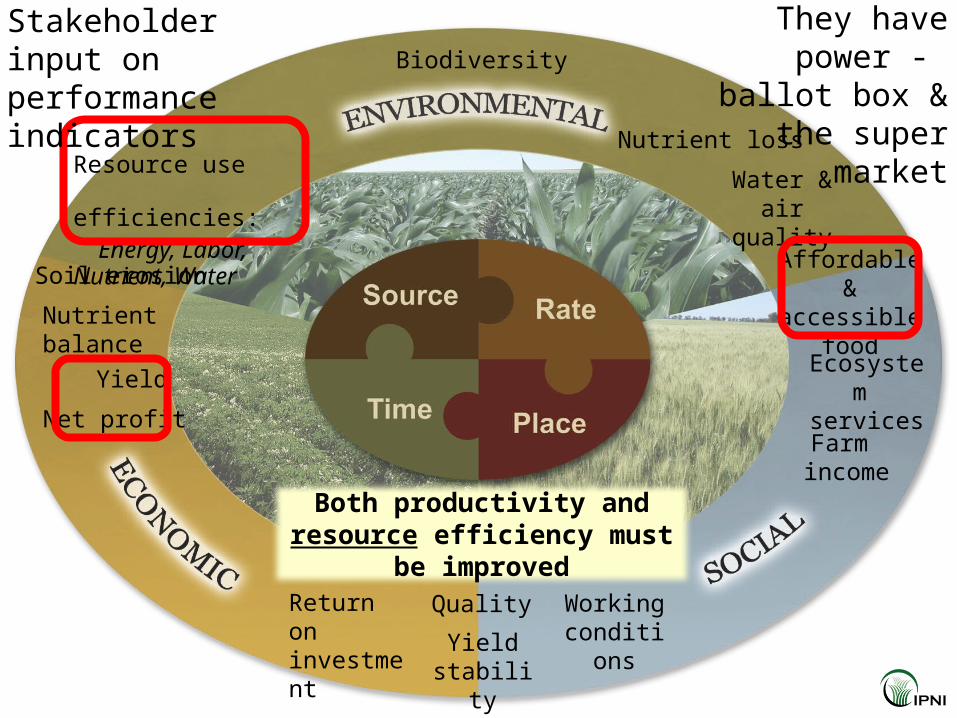
Net profit
Resource use efficiencies: Energy, Labor,Nutrient, Water
Return on investment Yield
stability
Water &air quality
Farm income
Working conditions
Nutrientbalance
Nutrient loss
Yield
Quality
Soil erosion
Biodiversity
Ecosystem services
Affordable& accessible
food
Both productivity and resource efficiency must be improved
Stakeholder input on performance indicators
They have power - ballot box & the
super market
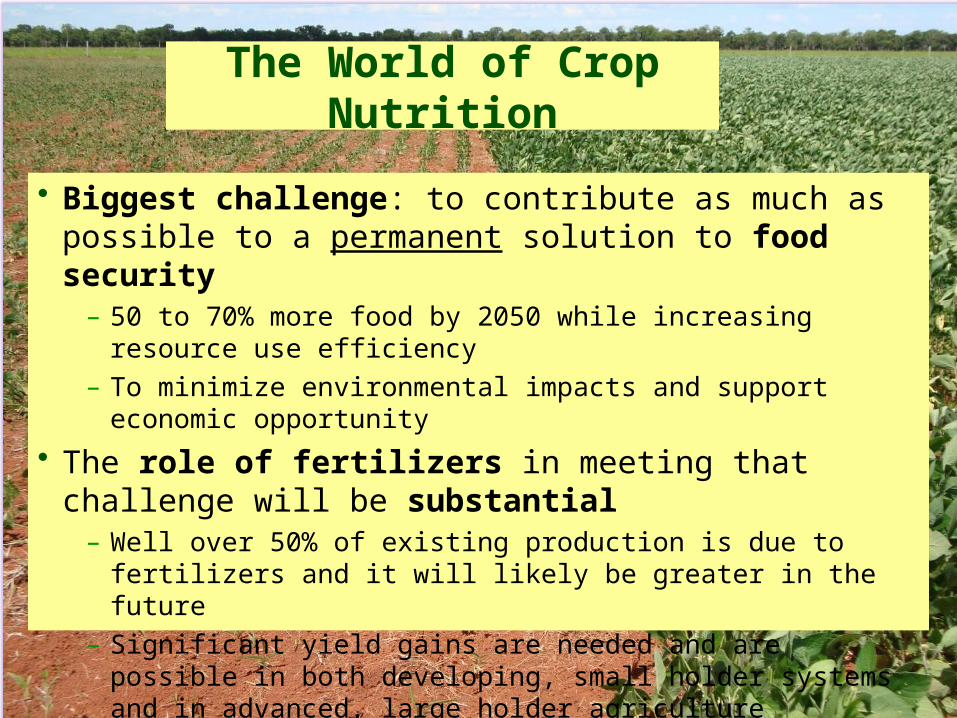
The World of Crop Nutrition
• Biggest challenge: to contribute as much as possible to a permanent solution to food security
– 50 to 70% more food by 2050 while increasing resource use efficiency – To minimize environmental impacts and support economic opportunity
• The role of fertilizers in meeting that challenge will be substantial– Well over 50% of existing production is due to fertilizers and it will likely be
greater in the future– Significant yield gains are needed and are possible in both developing,
small holder systems and in advanced, large holder agriculture• Site-specific BMPs based on 4R Nutrient Stewardship are critical
in meeting the challenge