IP Data Management and Uses of IP Data by IP Offices: The ...
35
IP Data Management and Uses of IP Data by IP Offices: The Zimbabwean Experience MORNCLIFF MUDZVATANGI Senior Examiner – Industrial Property
Transcript of IP Data Management and Uses of IP Data by IP Offices: The ...

IP Data Management and Uses of IP Data by IP Offices:
The Zimbabwean Experience
MORNCLIFF MUDZVATANGI Senior Examiner – Industrial Property
National IP Office
ZIPO
38 Nelson Mandela Avenue 4th Floor Century Hosue East Harare, Zimbabwe Tel: +263-4-775545/6 Web: www.dcip.gov.zw
Brief Background on ZIPO
Started operations on 7 May 1894, as an extended functionary of the Deeds Office under the Attorney Generals Office.
Influenced by Roman-Dutch law from the Cape Colony Office with the mandate to register/grant and publish Intellectual
Property Rights Falls under the Ministry of Justice, Legal and Parliamentary Affairs Headed by the Controller of Patents, Trade marks and Industrial
Designs The Office acts as a custodian of all records, books, drawings,
specifications, documents, and other papers and items relating to intellectual property rights applications filed with the Office.

ZIPO Structure
Under Ministry of Justice, LPA. – Section within the Department of Deeds, Companies and Intellectual Property
Headed by a Controller of Patents, trade marks and Designs 7 examiners 7 administrative staff (2 records, 4 Data Capturing, 1 executive assistant)
Services Offered by ZIPO
Examine applications for IPRs. Monitor and appraise the functioning of collecting societies. Promote the use of patent information as a tool for technology
development. Publish regularly in its own publication the IPR applications received,
registered or amended. Conduct primary hearings on contested intellectual property rights. Coordinate with other government agencies, offices and the private sector
efforts to formulate and implement plans and policies to strengthen the protection of intellectual property rights in the country.
Represent government of Zimbabwe in the regional and international fora. Making national intellectual property registers accessible to the public
where necessary.

Acts Administered
The Patents Acts Chapter 26:03
The Trade marks Acts Chapter 26:04
The Copyright and Neighbouring rights Act Chapter 26:05
The Industrial Designs Act Chapter 26:02
The Integrated Circuits Layout-Designs Act, Chapter 26:07
The Armorial Bearings, Names, Uniforms and Badges Act Chapter 10:01
The Geographical Indications Act Chapter 26:06

International Memberships
Berne Convention for the Protection of Literary and Artistic Works (April 18, 1980)
Paris Convention for the Protection of Industrial Property (April 18, 1980)
Convention Establishing the World Intellectual Property Organization (December 29, 1981)
Agreement establishing the World Trade Organization (WTO) (March 5, 1995)
World Trade Organization (WTO) - Agreement on Trade-Related Aspects of Intellectual Property Rights (TRIPS Agreement) (1994) (March 5, 1995)
Patent Cooperation Treaty (June 11, 1997)

Regional Treaties
Lusaka Agreement on the Creation of the African Regional Intellectual Property Organization (ARIPO) (November 11, 1980)
Harare Protocol on Patents and Industrial Designs Within the Framework of the African Regional Industrial Property Organization (ARIPO) (April 25, 1984)
Banjul Protocol on Marks Within the Framework of the African Regional Industrial Property Organization (ARIPO) (March 6, 1997)
Swakopmund Protocol on the Protection of Traditional Knowledge and Expressions of Folklore within the Framework of the African Regional Intellectual Property Organization (ARIPO)
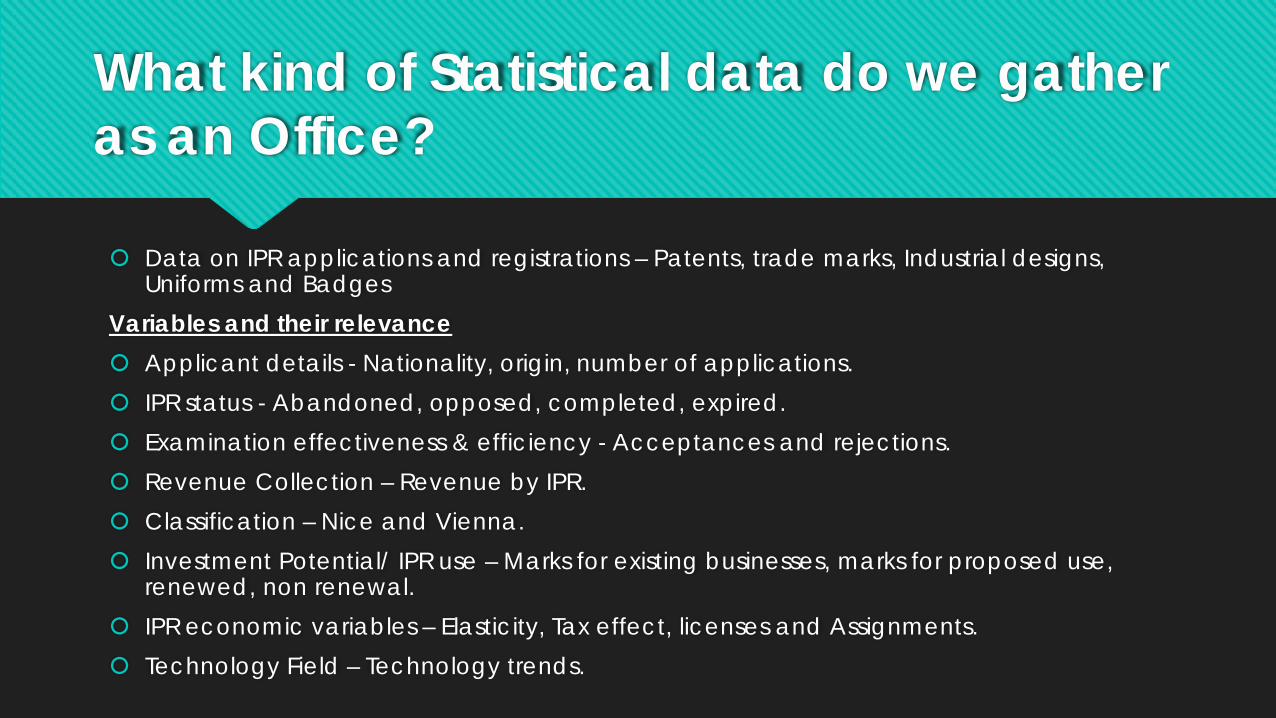
What kind of Statistical data do we gather as an Office?
Data on IPR applications and registrations – Patents, trade marks, Industrial designs, Uniforms and Badges
Variables and their relevance Applicant details - Nationality, origin, number of applications. IPR status - Abandoned, opposed, completed, expired. Examination effectiveness & efficiency - Acceptances and rejections. Revenue Collection – Revenue by IPR. Classification – Nice and Vienna. Investment Potential/ IPR use – Marks for existing businesses, marks for proposed use,
renewed, non renewal. IPR economic variables – Elasticity, Tax effect, licenses and Assignments. Technology Field – Technology trends.

Sources of IP Data
Internal Records – Source Documents (Application Documentation, Receipts), IPAS Database, Member States Module, RBM documents, Policy and Strategy Documents
External Sources - ROMARIN, Madrid Module IPAS - (WIPO); POLite+ (ARIPO), University and Research Institutions, Courts.
Standards observed when extracting and managing Data WIPO standards - WIPO Standards: ST.3, ST.9. ST.60, ST.80, ST.13, ST.16, ST.14, and XML
Standards.
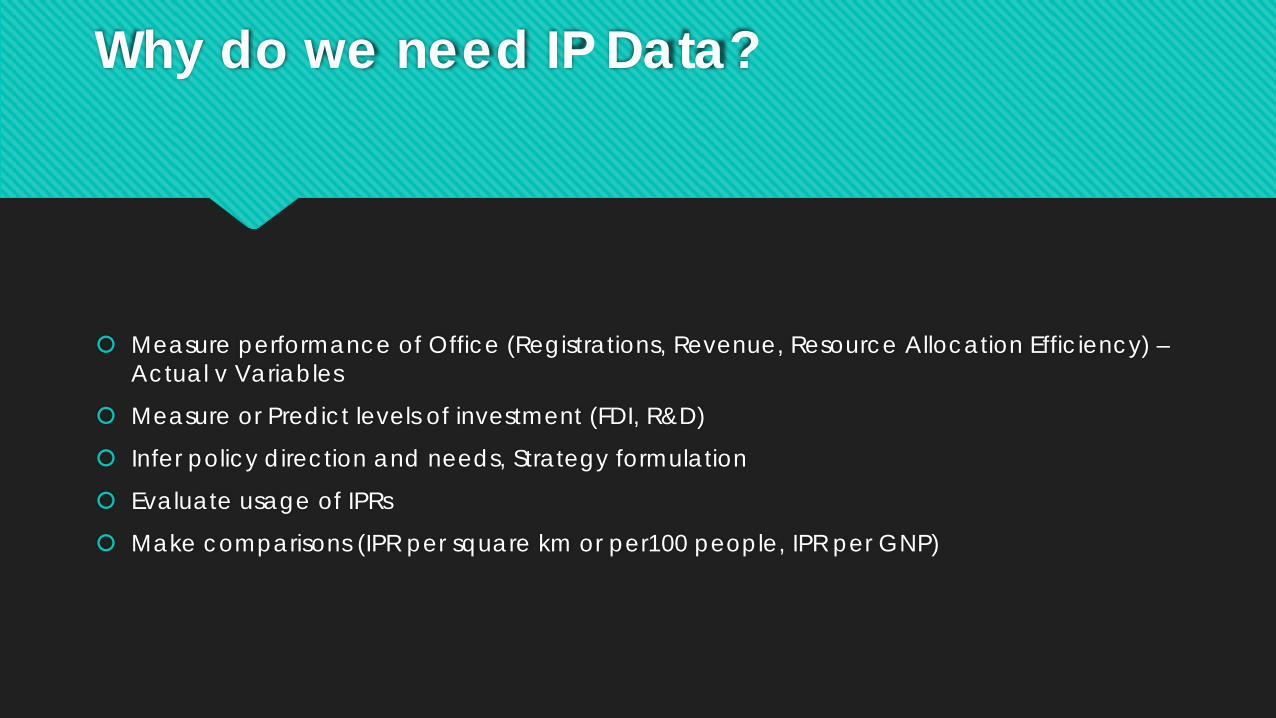
Why do we need IP Data?
Measure performance of Office (Registrations, Revenue, Resource Allocation Efficiency) – Actual v Variables
Measure or Predict levels of investment (FDI, R&D)
Infer policy direction and needs, Strategy formulation
Evaluate usage of IPRs
Make comparisons (IPR per square km or per100 people, IPR per GNP)

Challenges (Data management)
Parallel systems of data management (Physical records and e-records) / data not harmonized
Lack of expert knowledge of WIPO Standards
Measured implementation of changes to Standards / Classification
Lack of verification and validation tools and systems
Data secrecy (data bureaucracy , defensive data management)
Data dressing , Data beautification,
No defined allowable margins of error (confidence levels)

Challenges (Data use)
IPR data is insufficient on its own to give a wholesome view of socio-economic events. (Other parameters need consideration e.g. Disposal Income, taxation, law strength.
Data insignificant to give logical deductions.
No strict adherence to classification standards – e.g., Nice Classification, Vienna, Locarno, and the IPC.
Incomplete Data
Data comparisons (between countries) often distorted without rebasing to even standard units – i. Fees against average earnings / inflation
ii. Population dynamics

Error in data capturing

Capability of IPAS and MS Module to Generate Statistics
Ability to generate Statistics based on:
Applicant details – Application/Registration by Nationality, Ownership
Application type – Banjul, PCT, National Patent, Madrid
IPR type – Patents, trade marks, designs
IPR time lines – e.g Trade marks applied for in a given year or month
Revenue state / collected

Basic Search in IPAS web

Productivity Reports

Statistics Generation – IPAS Admin

Statistics: Trademarks
2006 2007 2008 2009 2010 2011 2012 2013 2014 2015
1556 1590 1475 1033 2023 1654 1875 1790 1991 2097

Trademark Applications table
Year Applications Forecast(Applications) Lower Confidence Bound(Applications) Upper Confidence Bound(Applications)
2006 1556
2007 1590
2008 1475
2009 1033
2010 2023
2011 1654
2012 1875
2013 1790
2014 1991
2015 2097 2097 2097.00 2097.00
2016 2128.472917 1616.25 2640.69
2017 2196.718024 1680.38 2713.05
2018 2264.96313 1744.48 2785.44

TM Graphical Presentation and Forecast
0
500
1000
1500
2000
2500
3000
2006 2007 2008 2009 2010 2011 2012 2013 2014 2015 2016 2017 2018
Applications Forecast(Applications) Lower Confidence Bound(Applications) Upper Confidence Bound(Applications)

Trade marks by applicant nationality
USA 516
Zimbabwe 285
South Africa 248
China 96
UK 68
Data includes, Banjul, Madrid and National Applications for 2015

Trade mark oppositions
In 2015 oppositions stood at 37 cases (Banjul 7 and National 30)
Usually less than %1of applications per year
However case turnover is also very low.

Patents
Year 2006 2007 2008 2009 2010 2011 2012 2013 2014 2015
Applications 28 30 22 15 21 21 24 23 24 25

Graphical Presentation and Forecast
0
5
10
15
20
25
30
35
40
Applications Forecast(Applications) Lower Confidence Bound(Applications) Upper Confidence Bound(Applications)
0
5
10
15
20
25
30
35
2006 2007 2008 2009 2010 2011 2012 2013 2014 2015
Patent Applications

Analysis: Patents including Harare Protocol Applications
2015 total Applications – 539 (PCT National Phase 4, Harare Protocol 517, Non Convention Applications 14, Provisional Applications 4)
Top ten Applicants Top Technologies
USA 187
South Africa 44
Zimbabwe 39 Japan 33
Switzerland 24 France 23 German 23
Great Britain 23 China 12
Netherlands 11
Pharmaceuticals
Pump Technologies
Mining technologies - ferrochrome, slug purification

Industrial Design Applications
Year 2006 2007 2008 2009 2010 2011 2012 2013 2014 2015
Applications 14 12 10 4 6 5 3 4 5 7

Graph showing Industrial design Applications
0
2
4
6
8
10
12
14
16
2006 2007 2008 2009 2010 2011 2012 2013 2014 2015
Industrial Design Applications
-5
0
5
10
15
2006 2007 2008 2009 2010 2011 2012 2013 2014 2015 2016 2017 2018
Applications Forecast(Applications) Lower Confidence Bound(Applications) Upper Confidence Bound(Applications)

Industrial Design by applicant nationality
Republic of Korea 34
South Africa 11
USA 6
Zimbabwe 5
India 4
The Top technology is related to Phone Covers by Samsung

Fee Comparison IPR Patents (Application Fee) Trademarks (Application Fee) Industrial Designs (Application
Fee)
Zimbabwe Provisional $80
Full Specification $400
Renewal $80 - $160
Individual $200
Local SME $200
Foreign $200
$120
South Africa Provisional $6
Full Specification $60
Renewal $9 - $22
Individual (R590) $60
$24
Botswana Provisional $5.40
Full Specification : Individuals and SMEs $10.80
Large corporates $21.60
Individual $13
Local SME $13
Large Corps $26
Individuals and SMEs $3.30
Body Corps $6.60
Kenya Provisional $50
Locals: 1000Ksh $11.07
Full Specification $150
Local: 3000Ksh $33.21
Individual 4000Ksh $44.30
Local SME 4000Ksh $44.30
Foreign $200.00
3000 Ksh (US$33.21) local
US$150 Foreign
Zambia Provisional $39.53
Foreign $208.74
Full Specification $47.00
Foreign $237.21
Individual K300.06 $47
Local SME K300.06 $47
Foreign K900.00 $142
Locals 150K $23.72
Foreigners $94.88
Mozambique Full Specification 4600Mtn $144.54 950Mtn $29.85
750Mtn (US$23.57)

Common weak points in Graphs
Economic crisis 2007 - 2009
Dollarization of the economy 2009
High human resources turnover 2006 – 2009
De-industrialization 2006 – 2009
Shift of applicants to ARIPO post 2009

Registrations
Statistics not verified
A huge overlap of registrations from previous years
IPAS data not reliable in terms of registrations

Going Forward (Data Strategy Short term)
Complete data capturing
Embark on a data verification and validation process
Re-categorization of files according to status (abandoned, registered etc.)
Data cleansing (IPAS)
Time line / process management (for renewals, certification etc.)
Timeous compilation of Statistics
Avail data to all stakeholders freely

Policy Change
Ease of doing business to improve business landscape
STEM policy to influence IPR registrations
IP Policy to close weak points in the IP system over time
Change in Office business processes

Thank You
Morncliff Mudzvatangi - Senior Examiner Zimbabwe Intellectual Property Office
Ministry of Justice, Legal and Parliamentary Affairs
Tel: +263-4-775545/6 Fax: +263-4-777372
Email: [email protected]