IOPP Tier Scoring Methodology - Ginnie Mae€¢ Absolute Tier Scoring Methodology. Relative Tier...
15
IOPP Tier Scoring Methodology Last Updated June 14, 2017
Transcript of IOPP Tier Scoring Methodology - Ginnie Mae€¢ Absolute Tier Scoring Methodology. Relative Tier...
IOPP Tier Scoring Methodology
Last Updated June 14, 2017

Contents
• Relative Tier Scoring Methodology
• Absolute Tier Scoring Methodology

Relative Tier Methodology
Operational Metric Relative Tier Calculation: Metric Scores
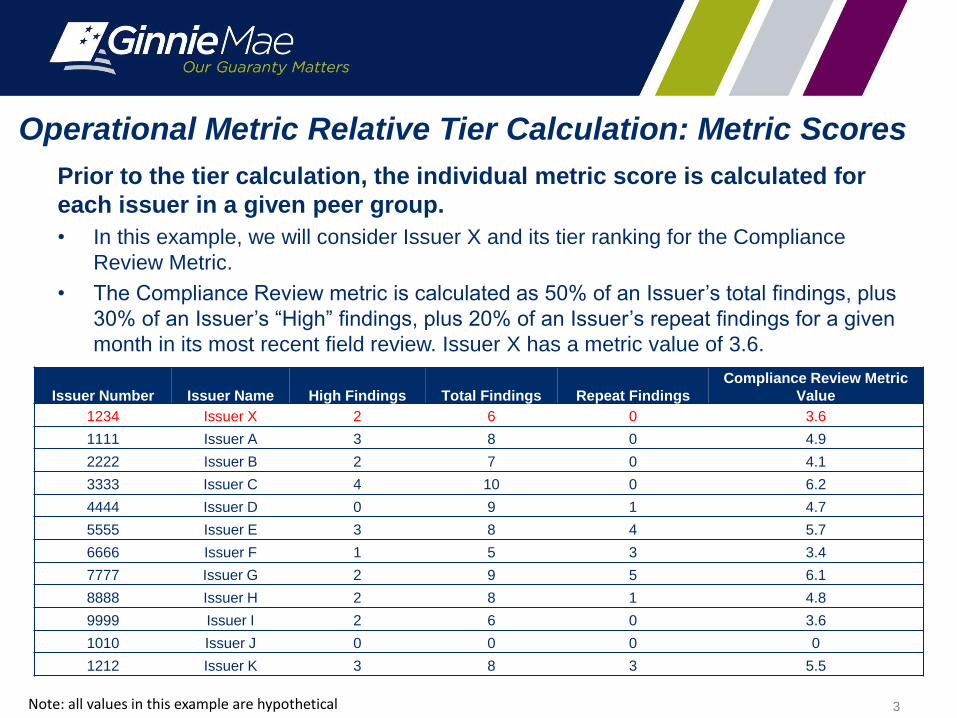
Prior to the tier calculation, the individual metric score is calculated for
each issuer in a given peer group.
• In this example, we will consider Issuer X and its tier ranking for the Compliance
Review Metric.
• The Compliance Review metric is calculated as 50% of an Issuer’s total findings, plus
30% of an Issuer’s “High” findings, plus 20% of an Issuer’s repeat findings for a given
month in its most recent field review. Issuer X has a metric value of 3.6.
3Note: all values in this example are hypothetical
Issuer Number Issuer Name High Findings Total Findings Repeat Findings
Compliance Review Metric
Value
1234 Issuer X 2 6 0 3.6
1111 Issuer A 3 8 0 4.9
2222 Issuer B 2 7 0 4.1
3333 Issuer C 4 10 0 6.2
4444 Issuer D 0 9 1 4.7
5555 Issuer E 3 8 4 5.7
6666 Issuer F 1 5 3 3.4
7777 Issuer G 2 9 5 6.1
8888 Issuer H 2 8 1 4.8
9999 Issuer I 2 6 0 3.6
1010 Issuer J 0 0 0 0
1212 Issuer K 3 8 3 5.5
Operational Metric Relative Tier Calculation: Peer Group
4Note: all values in this example are hypothetical
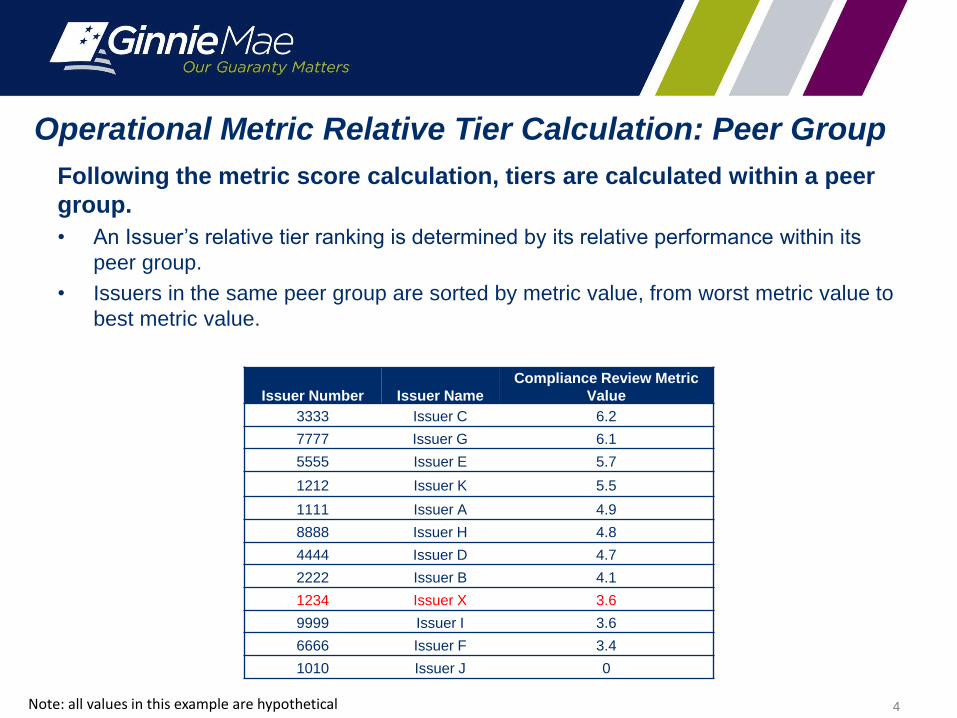
Following the metric score calculation, tiers are calculated within a peer
group.
• An Issuer’s relative tier ranking is determined by its relative performance within its
peer group.
• Issuers in the same peer group are sorted by metric value, from worst metric value to
best metric value.
Issuer Number Issuer Name
Compliance Review Metric
Value
3333 Issuer C 6.2
7777 Issuer G 6.1
5555 Issuer E 5.7
1212 Issuer K 5.5
1111 Issuer A 4.9
8888 Issuer H 4.8
4444 Issuer D 4.7
2222 Issuer B 4.1
1234 Issuer X 3.6
9999 Issuer I 3.6
6666 Issuer F 3.4
1010 Issuer J 0
Operational Metric Relative Tier Calculation: Tier Assignment
5Note: all values in this example are hypothetical
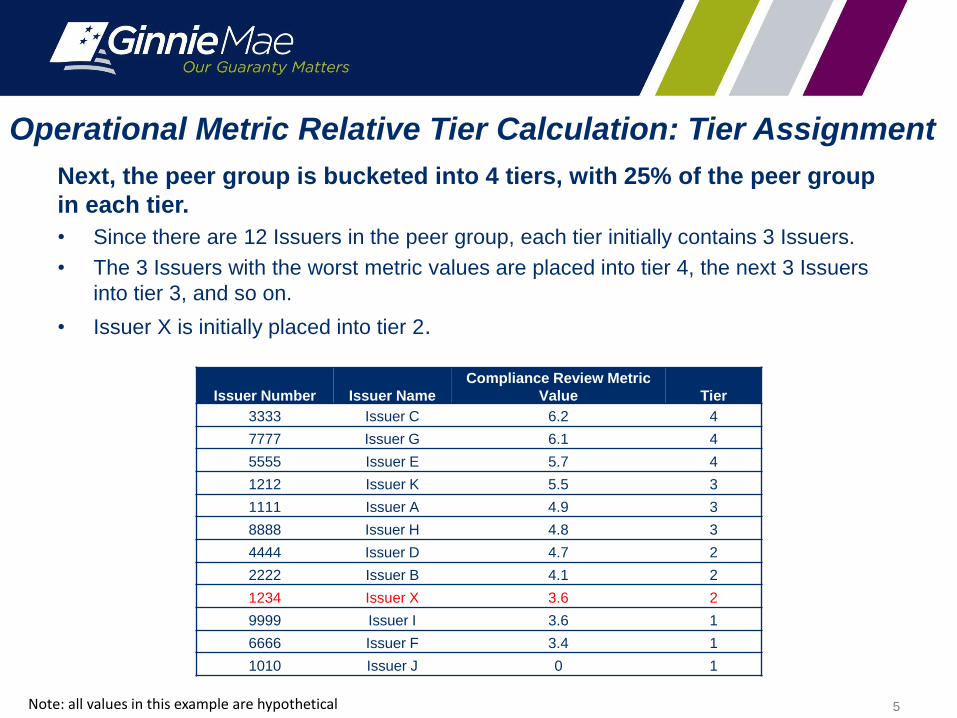
Next, the peer group is bucketed into 4 tiers, with 25% of the peer group
in each tier.
• Since there are 12 Issuers in the peer group, each tier initially contains 3 Issuers.
• The 3 Issuers with the worst metric values are placed into tier 4, the next 3 Issuers
into tier 3, and so on.
• Issuer X is initially placed into tier 2.
Issuer Number Issuer Name
Compliance Review Metric
Value Tier
3333 Issuer C 6.2 4
7777 Issuer G 6.1 4
5555 Issuer E 5.7 4
1212 Issuer K 5.5 3
1111 Issuer A 4.9 3
8888 Issuer H 4.8 3
4444 Issuer D 4.7 2
2222 Issuer B 4.1 2
1234 Issuer X 3.6 2
9999 Issuer I 3.6 1
6666 Issuer F 3.4 1
1010 Issuer J 0 1
Operational Metric Relative Tier Calculation: Displayed Tier
6Note: all values in this example are hypothetical
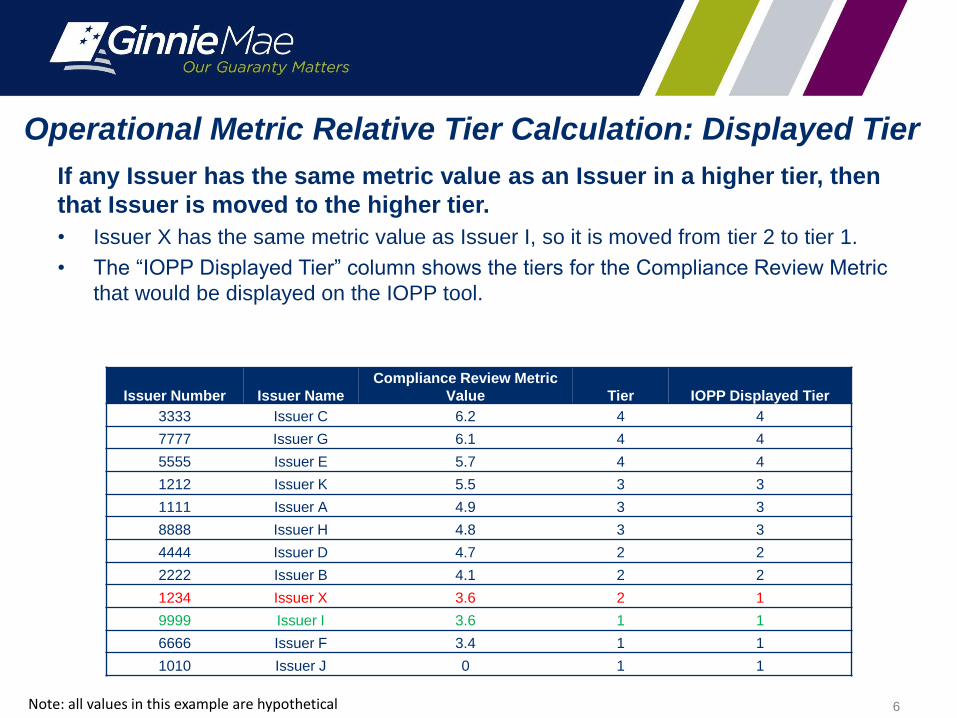
If any Issuer has the same metric value as an Issuer in a higher tier, then
that Issuer is moved to the higher tier.
• Issuer X has the same metric value as Issuer I, so it is moved from tier 2 to tier 1.
• The “IOPP Displayed Tier” column shows the tiers for the Compliance Review Metric
that would be displayed on the IOPP tool.
Issuer Number Issuer Name
Compliance Review Metric
Value Tier IOPP Displayed Tier
3333 Issuer C 6.2 4 4
7777 Issuer G 6.1 4 4
5555 Issuer E 5.7 4 4
1212 Issuer K 5.5 3 3
1111 Issuer A 4.9 3 3
8888 Issuer H 4.8 3 3
4444 Issuer D 4.7 2 2
2222 Issuer B 4.1 2 2
1234 Issuer X 3.6 2 1
9999 Issuer I 3.6 1 1
6666 Issuer F 3.4 1 1
1010 Issuer J 0 1 1

Operational Metric Relative Tier Calculation: Null Values
7Note: all values in this example are hypothetical
Issuers with a null metric value are initially assigned an N/A tier.
• Null metric tiers are excluded from Overall Metric Score calculations.
• In this example, we will consider Issuer X and its tier ranking for the Early Pool
Termination metric. – Issuer X has a null metric value for Early Pool Terminations and is assigned an N/A tier accordingly.
– The rest of the Issuers are bucketed and tiered against each other as per usual relative tier treatment.
Issuer Number Issuer Name
Early Pool Termination Metric
Value Tier IOPP Displayed Tier
8888 Issuer H 4 4 4
1111 Issuer A 3 3 3
2222 Issuer B 2 2 2
9999 Issuer I 1 1 1
1234 Issuer X Null N/A N/A

Default Relative Tier Calculation: Using Controlled Metrics
8Note: all values in this example are hypothetical
Default metrics tier calculations rank based on a Controlled Metric Value
rather than the Issuer’s metric value.
• The Controlled Metric Value is calculated using the controlled peer group average,
which buckets loans by cohort, state/region and loan purpose.
• This allows the default metrics to compare loans with similar characteristics to each
other.
• First, we will calculate the controlled peer group average for Issuer X for the % of Loans
in Foreclosure metric. Below is a sample of buckets for Issuer X.
rs’
Bucket Issuer's Loan
Counts in a
Bucket
Total Issuer's
Loan Counts
Issuer's % of
Loans
[A]
% of Loans in
Foreclosure of
Peers Loans in
Same Buckets
[B]
[A] x [B]
State Cohort Purpose
VA 2012 Purchase 190 237,109 0.08% 1.1% 0.001%
VA 2012 Refinance 142 237,109 0.06% 3.7% 0.002%
VA 2012 Modification 1399 237,109 0.59% 1.2% 0.007%
ₒ ₒ ₒ
ₒ ₒ ₒ
Total – All Buckets 100% 34.2%
Default Relative Tier Calculation: Controlled Peer Group Avg.
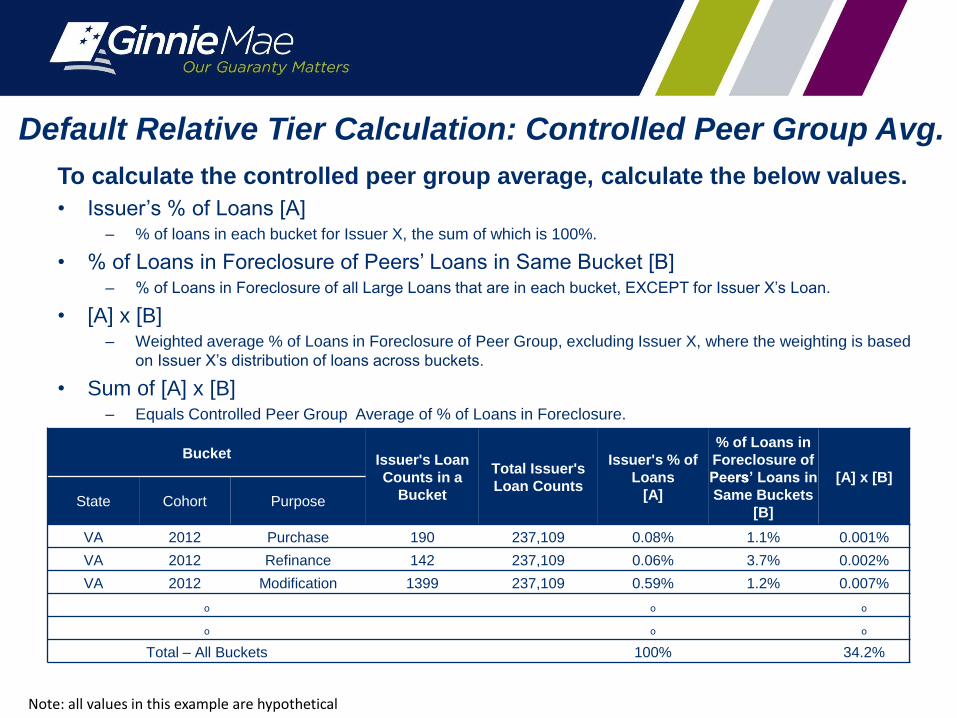
To calculate the controlled peer group average, calculate the below values.
• Issuer’s % of Loans [A]– % of loans in each bucket for Issuer X, the sum of which is 100%.
• % of Loans in Foreclosure of Peers’ Loans in Same Bucket [B]– % of Loans in Foreclosure of all Large Loans that are in each bucket, EXCEPT for Issuer X’s Loan.
• [A] x [B]– Weighted average % of Loans in Foreclosure of Peer Group, excluding Issuer X, where the weighting is based
on Issuer X’s distribution of loans across buckets.
• Sum of [A] x [B]– Equals Controlled Peer Group Average of % of Loans in Foreclosure.
rs’
Bucket Issuer's Loan
Counts in a
Bucket
Total Issuer's
Loan Counts
Issuer's % of
Loans
[A]
% of Loans in
Foreclosure of
Peers Loans in
Same Buckets
[B]
[A] x [B]
State Cohort Purpose
VA 2012 Purchase 190 237,109 0.08% 1.1% 0.001%
VA 2012 Refinance 142 237,109 0.06% 3.7% 0.002%
VA 2012 Modification 1399 237,109 0.59% 1.2% 0.007%
ₒ ₒ ₒ
ₒ ₒ ₒ
Total – All Buckets 100% 34.2%
Note: all values in this example are hypothetical

Default Relative Tier Calculation: Controlled Metric Value
Issuer
NameLoans
Number of
Buckets
Issuer’s %
of Loans in
Foreclosure
[C]
Peer Group
Average % of
Loans in
Foreclosure
Controlled Peer
Group Average % of
Loans in Foreclosure
[D]
Controlled
Metric
Value
[C] / [D]
Issuer’s
Loans
included in
Calculation
Issuer’s Buckets
included in
Calculation
Issuer X 341,782 1,018 4.13% 1.78% 1.69% 244.38% 100% 100%
Issuer A 179,134 1,036 1.05% 1.78% 1.86% 56.45% 100% 100%
Issuer B 237,109 1,063 2.14% 1.78% 1.77% 120.90% 100% 100%
The Controlled Metric Value is calculated using the Issuer’s Metric
Value and the Controlled Peer Group Average Controlled Peer Group
Average.
• The Controlled Peer Group Average represents a Peer Group average that is
adjusted for each Issuer’s unique distribution of loans across the buckets.
• The Controlled Metric Value is the ratio of the Issuer’s actual % of Loans in
Foreclosure Ratio to its Controlled Peer Group Average of % of Loans in
Foreclosure ( [C]/[D] ).
Note: all values in this example are hypothetical
Default Relative Tier Calculation: Rank the Controlled
Metric Values
11Note: all values in this example are hypothetical
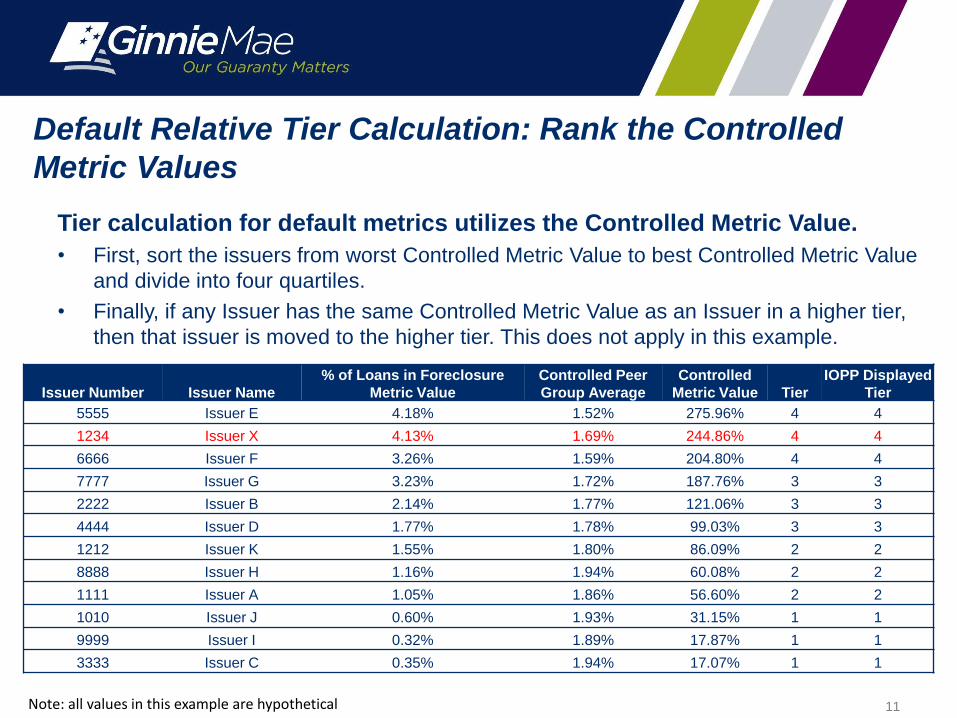
Tier calculation for default metrics utilizes the Controlled Metric Value.
• First, sort the issuers from worst Controlled Metric Value to best Controlled Metric Value
and divide into four quartiles.
• Finally, if any Issuer has the same Controlled Metric Value as an Issuer in a higher tier,
then that issuer is moved to the higher tier. This does not apply in this example.
Issuer Number Issuer Name
% of Loans in Foreclosure
Metric Value
Controlled Peer
Group Average
Controlled
Metric Value Tier
IOPP Displayed
Tier
5555 Issuer E 4.18% 1.52% 275.96% 4 4
1234 Issuer X 4.13% 1.69% 244.86% 4 4
6666 Issuer F 3.26% 1.59% 204.80% 4 4
7777 Issuer G 3.23% 1.72% 187.76% 3 3
2222 Issuer B 2.14% 1.77% 121.06% 3 3
4444 Issuer D 1.77% 1.78% 99.03% 3 3
1212 Issuer K 1.55% 1.80% 86.09% 2 2
8888 Issuer H 1.16% 1.94% 60.08% 2 2
1111 Issuer A 1.05% 1.86% 56.60% 2 2
1010 Issuer J 0.60% 1.93% 31.15% 1 1
9999 Issuer I 0.32% 1.89% 17.87% 1 1
3333 Issuer C 0.35% 1.94% 17.07% 1 1
Absolute Tier Methodology

Absolute Tier Calculations
Metric absolute tiers are assigned by predetermined metric value
thresholds.
• Absolute tiers are determined entirely from metric values and regardless of Issuer
peer group.
13
Metric FormulaApplicable
ProgramsTier 1/2 Cutoff Tier 2/3 Cutoff Tier 3/4 Cutoff
Number of DK’s
Number of DKs
in Past 12
Months /
Number of
Pools Issued in
Past 12 Months
SF, MF, HMBS 0.0225 0.04515 0.0903
Issuer Number Issuer Name Number of DK’s Absolute Tier
5555 Issuer E 0.0346 2
1234 Issuer X 0.0198 1
6666 Issuer F 0.0000 1
7777 Issuer G 0.1584 4
2222 Issuer B 0.0789 3
4444 Issuer D 0.0988 4
Note: all values in this example are hypothetical

Absolute Tier ThresholdsMetric Tier 1-2 Cutoff Tier 2-3 Cutoff Tier 3-4 Cutoff
Failure to Report Binary: If > 0 observations in 6 months, Tier 4, else Tier 1
RPB Corrections Binary: If > 0 observation in 3 months, Tier 4, else Tier 1
RFS Exceptions 0.0133 0.0302 0.0782
HRA Exceptions 0.180004696 0.190002348 0.2
% of Pools not
Certified1.00% 7.50% 15.00%
Disclosure Edits 1 2 3
New Pool Errors 1 2 3
Compliance Review
Metric2 3 4
Insurance Matching 99.85% 99.50% 99.00%
Failure to Purchase
Participations when
Mandatory Event
Occurs
Binary: If > 0 observation in 12 months, Tier 4, else Tier 1
Commitment
Authority
Shortage/Surplus
Binary: If < 20% of 4 month commitment authority usage remaining, Tier 4, else Tier 1
Number of DKs 0.0225 0.04515 0.0903
Insufficient
Commitment
Authority
1 2 3
Early Pool
Terminations0.02005 0.0251 0.0868
Manual Deletions Binary: If > 0 observation in 3 months, Tier 4, else Tier 1
14


![METHODOLOGY OpenAccess Automatedshape ...1278303/...Polychronidouetal.BMCBioinformatics2018,19(Suppl14):414 Page69of176 appliedin[24]forafeaturerepresentationonaPosition-Specific Scoring](https://static.fdocuments.us/doc/165x107/5e2b16bd4862d8744140f684/methodology-openaccess-automatedshape-1278303-polychronidouetalbmcbioinformatics201819suppl14414.jpg)