Ionization in atmospheres of brown dwarfs and extrasolar ...
54
Ionization in atmospheres of brown dwarfs and extrasolar planets VI: properties of large-scale discharge events R.L. Bailey, Ch. Helling, G. Hodosán, C. Bilger and C.R. Stark This is the author's final version of this article © American Astronomical Society (AAS) The final published version is available from doi: https://doi.org/10.1088/0004-637X/784/1/43 Bailey, R.L., et al. 2014. Ionization in atmospheres of brown dwarfs and extrasolar planets VI: properties of large-scale discharge events. Astrophysical Journal. 784(1): 43. doi: 10.1088/0004-637X/784/1/43
Transcript of Ionization in atmospheres of brown dwarfs and extrasolar ...

Ionization in atmospheres of brown dwarfs and extrasolar planets VI: properties of large-scale discharge eventsR.L. Bailey, Ch. Helling, G. Hodosán, C. Bilger and C.R. Stark
This is the author's final version of this article © American Astronomical Society (AAS)The final published version is available from doi:https://doi.org/10.1088/0004-637X/784/1/43
Bailey, R.L., et al. 2014. Ionization in atmospheres of brown dwarfs and extrasolar planets VI: properties of large-scale discharge events. Astrophysical Journal. 784(1): 43. doi: 10.1088/0004-637X/784/1/43

Not to appear in Nonlearned J., 45.
Ionisation in atmospheres of brown dwarfs and extrasolar planets
VI: Properties of large-scale discharge events
R. L. Bailey1,2 , Ch. Helling1, G. Hodosan1, C. Bilger1,3, C. R. Stark1
1 SUPA, School of Physics & Astronomy, University of St Andrews, St Andrews, KY16
9SS, UK
[email protected] (May 2, 2017)
2 Zentralanstalt fur Meteorologie und Geodynamik, Hohe Warte 38, 1190 Vienna, Austria
3 Department of Engineering, University of Cambridge, Cambridge CB2 1PZ, UK
ABSTRACT
Mineral clouds in substellar atmospheres play a special role as a catalyst for
a variety of charge processes. If clouds are charged, the surrounding environment
becomes electrically activated, and ensembles of charged grains are electrically
discharging (e.g. by lightning), which significantly influences the local chemistry
creating conditions similar to those thought responsible for life in early plan-
etary atmospheres. We note that such lightning discharges contribute also to
the ionisation state of the atmosphere. We apply scaling laws for electrical dis-
charge processes from laboratory measurements and numerical experiments to
Drift-Phoenix model atmosphere results to model the discharge’s propaga-
tion downwards (as lightning) and upwards (as sprites) through the atmospheric
clouds. We evaluate the spatial extent and energetics of lightning discharges.
The atmospheric volume affected (e.g. by increase of temperature or electron
number) is larger in a brown dwarf atmosphere (108 − 1010 m3) than in a giant
gas planet’s (104 − 106 m3). Our results suggest that the total dissipated energy
in one event is < 1012 J for all models of initial solar metallicity. First attempts
to show the influence of lightning on the local gas phase indicate an increase
of small carbohydrate molecules like CH and CH2 at the expense of CO and
CH4. Dust forming molecules are destroyed and the cloud particle properties are
frozen-in unless enough time is available for complete evaporation. We summarise
instruments potentially suitable to observe lightning on extrasolar objects.
Subject headings: brown dwarfs, atmospheres, dust, ionisation, magnetic coupling
arX
iv:1
312.
6789
v3 [
astr
o-ph
.EP]
7 J
an 2
014
– 2 –
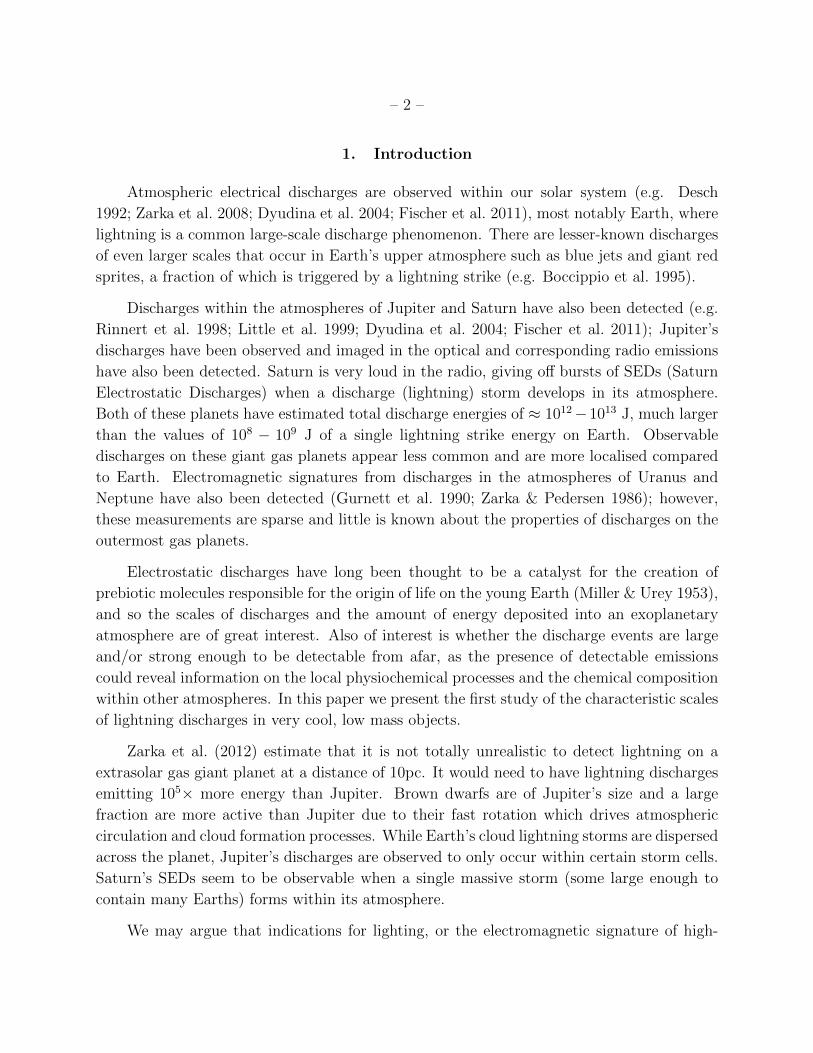
1. Introduction
Atmospheric electrical discharges are observed within our solar system (e.g. Desch
1992; Zarka et al. 2008; Dyudina et al. 2004; Fischer et al. 2011), most notably Earth, where
lightning is a common large-scale discharge phenomenon. There are lesser-known discharges
of even larger scales that occur in Earth’s upper atmosphere such as blue jets and giant red
sprites, a fraction of which is triggered by a lightning strike (e.g. Boccippio et al. 1995).
Discharges within the atmospheres of Jupiter and Saturn have also been detected (e.g.
Rinnert et al. 1998; Little et al. 1999; Dyudina et al. 2004; Fischer et al. 2011); Jupiter’s
discharges have been observed and imaged in the optical and corresponding radio emissions
have also been detected. Saturn is very loud in the radio, giving off bursts of SEDs (Saturn
Electrostatic Discharges) when a discharge (lightning) storm develops in its atmosphere.
Both of these planets have estimated total discharge energies of ≈ 1012−1013 J, much larger
than the values of 108 − 109 J of a single lightning strike energy on Earth. Observable
discharges on these giant gas planets appear less common and are more localised compared
to Earth. Electromagnetic signatures from discharges in the atmospheres of Uranus and
Neptune have also been detected (Gurnett et al. 1990; Zarka & Pedersen 1986); however,
these measurements are sparse and little is known about the properties of discharges on the
outermost gas planets.
Electrostatic discharges have long been thought to be a catalyst for the creation of
prebiotic molecules responsible for the origin of life on the young Earth (Miller & Urey 1953),
and so the scales of discharges and the amount of energy deposited into an exoplanetary
atmosphere are of great interest. Also of interest is whether the discharge events are large
and/or strong enough to be detectable from afar, as the presence of detectable emissions
could reveal information on the local physiochemical processes and the chemical composition
within other atmospheres. In this paper we present the first study of the characteristic scales
of lightning discharges in very cool, low mass objects.
Zarka et al. (2012) estimate that it is not totally unrealistic to detect lightning on a
extrasolar gas giant planet at a distance of 10pc. It would need to have lightning discharges
emitting 105× more energy than Jupiter. Brown dwarfs are of Jupiter’s size and a large
fraction are more active than Jupiter due to their fast rotation which drives atmospheric
circulation and cloud formation processes. While Earth’s cloud lightning storms are dispersed
across the planet, Jupiter’s discharges are observed to only occur within certain storm cells.
Saturn’s SEDs seem to be observable when a single massive storm (some large enough to
contain many Earths) forms within its atmosphere.
We may argue that indications for lighting, or the electromagnetic signature of high-

– 3 –
energy discharge processes, may have already been detected in extrasolar substellar atmo-
spheres. While quiescent X-ray emission decays between objects of spectral class M7 and M9
(Berger et al. 2010), objects as cool as L5/T7 brown dwarfs exhibit long-lived Hα emission
and quiescent radio emission (Hall 2002; Burgasser et al. 2011, 2013). Route & Wolszczan
(2013) and Williams et al. (2013a) observed the radio emission from a T6.5 dwarf. The
physical mechanism behind flaring, quiescent X-ray and radio emission may be the result
of the energy release into the ambient atmosphere associated with reconnecting magnetic
field lines. This implies a coupling between the bulk, convective motions of the atmosphere
and the ambient magnetic field. Despite uncertainty regarding the origin of magnetic fields
in fully convective objects, the more pressing question is which processes contribute to the
ionisation of such ultra-cool atmospheres such that convective energy can be released by
magnetic field coupling. This paper will contribute to resolving this question by presenting
a first study of large-scale discharge properties in extrasolar, ultra-cool atmospheres.
Other plasma-initiated emission may also be present in substellar atmospheres. Mag-
netospheric electrons that are accelerated along magnetic field lines will interact with the
neutral atmosphere stimulating auroral-type emission as suggested in Nichols et al. (2012).
However, a seed plasma is also required for such auroral emissions which originate from the
solar wind, cosmic rays and the geologically active Io in the Jupiter system. It might be
suggestive to think about moons in conjunction with satellite systems (that exert tidal forces
on the moon) as plasma sources for exoplanets, similar sources (incl. host star winds) can
not a priori be expected to be available to brown dwarfs or brown dwarf systems. Hence the
same question arises, namely, where does the seed plasma come from that drives an aurora.
The onset of lightning is not well understood (e.g. MacGorman & Rust 1998). However,
streamer discharges are thought to play a major role and are suggested to determine the early
stages of large-scale discharges like lightning and associated sprites (Phelps 1974; Raizer 1991;
MacGorman & Rust 1998; Briels et al. 2008a) as they occur in a variety of ionised media
with a large range of pressure and temperature.
We adopt the idea that a large-scale lightning strike or a large-scale sprite discharge
is composed of various small streamer events, and that a streamer triggers and develops
into such a large-scale discharge event. This is not always the case since most of the gas-
discharges in an atmosphere may in fact not even develop into a streamer (see e.g. Helling
et al. 2013). However, in this paper we are interested in investigating the scales that large-
scale gas-discharges can develop, what atmospheric volume might be affected, and what
amount of energy may be deposited into the atmospheres of brown dwarfs and planets by
large-scale lightning discharges. We also discuss how the local gas phase can be affected by
the temperature increase in a discharge channel in the atmosphere.

– 4 –
We utilised scaling laws for discharge processes based on laboratory measurements
(Briels et al. 2008a,b; Nijdam et al. 2008) and numerical experiments (Pancheshnyi et al.
2005) in order to provide a first investigation of the spatial extent and energetics of dis-
charges within the atmospheres of substellar objects, i.e. in brown dwarfs and extrasolar
giant gas planets. In principle, these investigations can also be applied to smaller planets
such as those currently observed by the Kepler space mission.
We start with a summary (Sect. 2) of our work on clouds in the atmospheres of brown
dwarfs and giant gas planets. Section 3 introduces the scaling laws which we use and outlines
our method of applying these scaling laws to brown dwarf and giant gas planet atmospheres.
Section 4 summarises our results. Lightning on Earth produces a large number of observable
signatures across the energy spectrum. We summarise these signatures in Sect. 7 and collate
possible instruments for their detection on Brown Dwarfs or exoplanets.
2. Cloudy Substellar Atmospheres
Atmospheres of very cool, substellar objects like brown dwarfs (BD) and giant gas plan-
ets (GP) are cold and dense enough that cloud particles can condense from the atmospheric
gas. The formation of dust by seed formation and bulk growth takes place in a temperature
window of ≈ 500 − 2100 K and leads to the formation of mineral clouds. Gravitational
settling, convective mixing and element depletion are major processes that occur in such
atmospheres. Helling, Woitke & Thi (2008) have shown that the upper cloud region (low-
temperature and low-pressure) will be dominated by small, dirty (i.e. inclusions of other
materials) silicate grains with inclusions of iron and metal oxides; and the warmer, denser
cloud base by bigger, dirty iron grains with metal inclusions. The actual size of the cloud
particles deviate from this mean value according to a height dependent size distribution (Fig.
8 in Helling, Woitke & Thi 2008). The chemical material compositions as well as the local
grain size distribution change with height inside a cloud in a quasi-stationary environment.
These cloud particles can be charged (Helling et al. 2011a) and the resulting electric field may
be sufficiently strong to initiate small-scale streamers that develop into large-scale discharge
processes like lightning (Helling et al. (2011b, 2013)).
We utilise one-dimensional atmosphere models in what follows, hence, we do not take
into account any horizontal motions that are so obvious on Jupiter and are stipulated for
irradiated, extrasolar planets from works by Showman et al. (e.g. Showman et al. 2013a).
Such horizontal motions will produce patchy cloud coverage rather than a homogeneous
cloud coverage as assumed in 1D models. More complicated atmospheric structures involving
winds and dynamic meteorology will introduce additional effects such as ionization via Alfven

– 5 –
ionization (Stark et al. 2013).
2.1. Atmospheres and Clouds
We use Drift-Phoenix model atmosphere structures (Dehn 2007; Helling et al. 2008a,b;
Witte et al. 2009, 2011) as input for the local gas temperature and gas pressure. Drift-
Phoenix model atmospheres are determined by a coupled system of equations describing
radiative transfer, convective energy transport (modelled by mixing length theory), chemical
equilibrium (modelled by laws of mass action), hydrostatic equilibrium and dust cloud for-
mation. The dust cloud formation model includes a model for seed formation (nucleation),
surface growth, evaporation of mixed materials and gravitational settling (Woitke & Helling
2003, 2004; Helling & Woitke 2006; Helling, Woitke & Thi 2008; Helling & Fomins 2013).
The results of the Drift-Phoenix model atmosphere simulations include the gas tempera-
ture - gas pressure structure (Tgas, pgas), the local gas-phase composition, the local electron
number density (ne), the number of dust grains (nd) and their mean sizes (< a >); which
are all dependent on atmospheric height. These models are determined by the effective tem-
perature, Teff , the surface gravity, log(g), and the initial element abundances which are set
to solar values unless specified otherwise.
Atmospheres of varying parameters were used: The effective temperatures, which rep-
resent the total wavelength-integrated radiative flux, ranged from 1500 K to 2000 K. Within
each effective temperature category, the substellar atmospheres split into categories of brown
dwarfs (BDs; log(g) > 4.0) and giant gas planets (GPs, log(g) < 4.0), for which we consider
solar metallicity ([M/H]= 0.0) and sub-solar metallicity ([M/H]= −3.0) models. The initial
element abundances are oxygen-rich, i.e. more oxygen than carbon is available.
Dusty cloud layers are expected to form within these substellar atmospheres. With the
formation of initial seed particles, chemicals can gather on their surface and dust grains grow
while simultaneously depleting the local elemental abundances. As the grains grow in mass,
they fall down through the cloud and gravitationally settle in the lower layers. Convection
in the atmosphere allows for the constant replenishment of chemicals in the cloud for the
growth of dust grains, as well as the mixing of dust grains of different size and composition
(Helling et al. 2008c).
Due to the 1D nature of the models, the clouds are assumed to form in horizontally
extended layers within the atmospheres. The cloud deck is here defined as the first particle
nucleation maximum and the point at which all cloud particles have evaporated due to the

– 6 –
Fig. 1.— Cloud layer boundaries (square = cloud top, triangle = cloud base) in Drift-
Phoenix model atmosphere structure of brown dwarfs (brown) and giant gas planets (red)
with Teff = 1500 K. Over-plotted are two cases of different metallicity (solar, [M/H]= 0.0 –
solid lines; sub-solar, [M/H]= −3.0 – dashed lines).

– 7 –
Fig. 2.— Vertical cloud extension, ∆H(Teff), for Drift-Phoenix model atmospheres of
different Teff with log(g) = 3.0 (GP, red), 5.0 (BD, brown); [M/H] = 0.0 (solid lines), -
3.0 (dashed lines). The error bars indicate the uncertainty with which the cloud height is
determined based on the Drift-Phoenix atmosphere models (see also Sect 5.2).

– 8 –
locally high temperature1. These cloud decks are usually of the order of 107 m in vertical
extension (∆H) in the GPs and 104 m in the BDs due to the higher surface gravity (Fig.
2). Clouds in low-metallicity atmospheres form at lower temperatures and higher pressures
than clouds in the solar-metallicity atmospheres (Witte et al. 2009). GP atmospheres also
form clouds at much lower pressures than their BD counterparts (Fig. 1). With increasing
effective temperature, the clouds also form at decreasing pressure, hence they are located at
higher atmospheric altitudes.
2.2. Large-scale charge separation within clouds
Charge separation requires motion and friction for the separation and relocation of
charges to occur. This can be provided by convective and turbulent motions, which are
common in atmospheres and cloud regions, and have been observed in the cloud and storm
systems of Jupiter and Saturn. Large-scale motions (global circulation patterns) on exoplan-
ets are inferred from thermal emission observations from infrared lightcurves e.g. (Knutson
et al. 2012) and from simulations e.g. (Heng et al. 2011; Dobbs-Dixon et al. 2012; Rauscher
& Menou 2012; Perna et al. 2012; Showman et al. 2013b). All suggest a displacement of the
hot-spot (a global temperature maximum of the atmosphere due to irradiation by the host
star) as result of a fast eastward windflow at the equator that displaces the thermal maxima
to the east. Resulting differential, height-dependent rotation of the atmosphere can naturally
be expected. Collisions between the cloud particles can lead to tribo-electric charging, which
occurs due to friction as one material surface rubs against another and charge is transported
from one grain to another. Experiments show that in systems of colliding particles, negative
charge moves to the smaller particles while the larger particles become positively charged
(Lacks and Levandovsky, 2007; Krauss et al., 2003; Zheng et al., 2003). Larger particles
will sink faster to the bottom of the cloud while smaller particles remain longer at the top
and can be easily transported by winds, establishing large-scale charge separation within the
cloud. Similar scenarios are suggested in Merrison et al. (2012); Zarka et al. (2004), and in
Farrell et al. (1999).
Another mechanism at work in very turbulent atmospheres would be fracto-emission.
Fracto-emission is the emission of particles and electrons during and after the fracture of a
dust grain due to external stresses. This process results in the emitted, fractured material
acquiring different charges (Dickinson et al. 1984). The different transport properties of the
charged grains cause them to migrate within the dust cloud and an electric field can be
1See Eq. 16 in Woitke & Helling (2004) for a different definition of the cloud height.

– 9 –
established. The shattering process depends strongly on the relative velocities involved in
the collisions.
3. Application of gas-discharge scaling laws
to brown dwarf and giant gas planetary atmospheres
We aim to investigate the geometrical extension of potential discharge processes in BD
and GP atmospheres, and to find out where potential lightning discharges occur. We utilise
experimentally obtained scaling laws (similarity relations) describing discharge properties to
provide a first insight into the potential scale size of discharge processes in BDs and GPs and
derive values for the energy deposited and the atmospheric volume affected. Knowing both
the pressure-temperature scales in our model atmospheres and the cloud extensions (from
Drift-Phoenix atmosphere simulations) enables us to estimate how discharge properties
(such as the discharge propagation length, the radius of the discharge channel or the gas
volume affected by the discharge) scale within the modelled cloud layers.
We first outline our modelling ansatz in Sects. 3.1– 3.3. Section 3.4 introduces the
scaling laws which we utilise.
3.1. Modelling ansatz
To investigate atmospheric discharge events we model the top and bottom of the cloud
layer as two equal and oppositely charged surfaces analogous to the parallel plates of a capac-
itor. This ansatz has been applied by Raizer et al. (1998), Yair et al. (2009) and by Pasko
et al. (2000) to study sprites in solar system planetary atmospheres and fractal streamer
propagation. It serves as a first-order-approximation to investigate the latent physics and
chemistry of the system. It is assumed that a streamer-initiated discharge can occur between
two charge-carrying surfaces (i.e. the cloud top and the cloud base) if the build-up of electric
charge is large enough for the resulting electric field to overcome the local breakdown field.
The net charge on the cloud top and base (and hence the resulting electric field) is
unknown, unless all necessary charging processes can be modelled. Therefore, a two-fold
strategy was followed to evaluate the electric field which was inspired by previous works
(Raizer et al. (1998); Pasko et al. (2000); Yair et al. (2009)).
In case (i) Q =const: the local electric field is evaluated by assuming a constant charge
Q. The discharge would then propagate from a point in the cloud, zinit at which the local
electric field E(zinit, Q) corresponding to charge Q, exceeds the break-down field strength

– 10 –
Eth: E(z,Q) > Eth. The exact position of this point and the distance from the cloud top
varies between the different model atmospheres.
In case (ii) z0 = const: the discharge is initiated for the charge Q that fulfils the break-
down criterion E(z0, Q) > Eth at a fixed point, z0, below the cloud top. This results in the
minimum amount of charge, Qmin, required to initiate a discharge at a fixed point. From
this initiation point the discharge propagates into a rising breakdown field. However, due
to the enhanced field at the streamer tip it can continue to propagate; therefore, from the
point of initiation the propagation is independent of the initial ambient field.
In both cases, (i) and (ii), we assume horizontal homogeneity of the ambient gas; there-
fore, only the streamer scaling into the vertical direction is considered. This assumption is
reasonable since on Earth electric currents flow in the atmospheric electric field preferen-
tially upwards, towards the apex of the geomagnetic field line (Rycroft & Harrison (2012)).
The propagating discharge has the form of a sprite-like discharge, starting with only a few
branches that split into more and more filaments (Figs. 3).
The discharge propagates through the atmospheric gas according to scaling laws (Sect. 3.4).
Each discharge starts with a characteristic diameter and as the discharge evolves and branches,
it does so into branches of progressively smaller diameters until the minimum diameter is
reached. At this point the whole discharge event stops. This approach follows Ebert et al.
(2010a) and their description of streamer behaviour.
3.2. Breakdown field
The breakdown field, Eth, is the minimum threshold electric field that must be overcome
in a medium for electrical breakdown to occur. For electric fields above this value, the gas
ionisation rate exceeds the electron attachment rate and the ionisation front can propagate.
The breakdown field changes depending on the composition of the surrounding medium and
the product of the gas pressure and the distance between the electrodes. We use the same
description for the breakdown field as in Helling et al. (2013),
Eth
p=
B
C + ln(pd), (1)
where B, C and pd are constants and values are summarised in Helling et al. (2013). Eq. 1
defines the breakdown criterion as a function of gas pressure p and electrode separation d. For
a given gas composition there exits a critical value of (pd)min that yields the minimum electric
field strength for electrical breakdown Eth,min. For values of pd < (pdmin) the breakdown field
Eth decreases with increasing pd; and for values of pd > (pd)min, the breakdown field Eth

– 11 –
Fig. 3.— This image is adopted from Briels et al. (2008b) [ c©IOP Publishing. Reproduced with
permission. All rights reserved.] to visualise the streamer properties evaluated in laboratory
experiments and used in this paper: The segment length, L (Eq. 6), is the length of a single
segment of the streamer. The minimum diameter, dmin (Eq. 5), is the minimal segment
diameter seen on a streamer. The branching angle, α (Eq. 7), is the angle between two
branches from the same parent segment. The energy per length, Etot/l (Eq. 8), is the
amount of dissipated energy per length of single segment.

– 12 –
increases with increasing pd. Here, we use the parameters initially determined for Jupiter’s
atmosphere (Sect. 4.2). We evaluate the dependence on different chemical composition of
the atmosphere in Sect. 5.1.
3.3. Model electric field for atmospheric discharges
For simplicity we model the electric field of the cloud with net charge Q as a simple
electric dipole,
E(z) =Q
4πε0
[1
(z − zbase)2− 1
(z − ztop)2
]. (2)
A charge distribution within a cloud that has undergone large-scale charge separation can
be complex, with opposing layers of charge not always sitting parallel to the horizontal axis
but also beside each other due to potentially complex convective cells. Multiple pockets of
localised charge distributed across the cloud could also be a likely situation (Rakov & Uman
2003). For simplicity and ease of comparison with similar studies (Raizer et al. 1998; Yair
et al. 2009), the dipole electric field in Eq. 2 of two poles (or small pockets of opposite charge)
was adopted to emulate a simplified Earth storm cloud cell as suggested by Rakov & Uman
(2003). The electric dipole field should provide a fair approximation due to the potentially
large distances between the charge centres. Both the local field and the breakdown field
are shown in Fig. 4 (for case (ii)): Q = Qmin), and a discharge starts at the point in the
atmosphere where E(z) > Eth.
The same model is used to study if and where sprites may occur above the cloud at
where E(z) > Eth (Fig. 5). Current sprite theory suggests that these forms of electrostatic
discharge occur when charge below is removed suddenly by a lightning stroke, so that a qua-
sistatic field appears above the cloud where a single charge centre remains (e.g. MacGorman
& Rust (1998); Briels et al. (2008b)). It is expected that a mirror charge may appear in a
conducting ionosphere (see Raizer et al. (1998)); however, no ionospheric considerations have
been included here due to lack of knowledge on the nature of ionospheres in brown dwarfs
and extrasolar giant gas planets. Sprites occur only milliseconds after powerful lightning
strikes within this quasistatic electric field above the cloud.
Although both the local field and the sprite field decay above the cloud, there is a point
at which the electrical breakdown condition is satisfied (see Fig. 5). We assume that a sprite
launches at this point, triggered by a lightning discharge at lower altitudes.

– 13 –
Fig. 4.— The local electric field (red) and the breakdown field (blue) between the charged
top and bottom of the cloud layer (depicted in grey) for a Drift-Phoenix giant gas planet
atmosphere model with Teff = 1500 K, log(g) = 3.0 and [M/H]=0.0. Top and bottom of the
cloud are assumed to carry a charge of 2.58×10²²e of opposite polarity. This is the minimum
amount of charge required for a discharge to occur (case (ii)). The discharge occurs at the
height z at which E(z) > Eth.

– 14 –
Fig. 5.— The electric field and the breakdown field above the cloud, which is an enlarged
portion of the field shown in Fig. 4. At a distance of ∼ 106 m above the cloud, the electric
field exceeds the breakdown field suggesting that a sprite may occur here.

– 15 –
3.4. Scaling laws for Streamers and Sprites
Various laboratory experiments in recent years (Briels et al. 2008a,b; Nijdam et al.
2008; Pancheshnyi et al. 2005) studied the properties of the basic discharge instability which
occurs in the form of streamers. Streamers are electron avalanches, initiated by fast-moving
free ‘seed’ electrons that have been accelerated by a sufficiently strong external electric field.
The initial electrons acquire enough energy to knock further electrons from the ambient
atom or molecules, which liberate more electrons and the event cascades into an avalanche.
This evolves into a self-propagating ionisation front that advances through the medium
evolving into a discharge. Laboratory experimental studies of streamers have identified
empirical scaling laws that relate characteristic properties of their evolution. This enables
us to apply such scaling laws to physically similar systems such as those found in BD and
GP atmospheres. Similar investigations have been made in the upper atmosphere of Earth,
where the properties of sprites have been quantified (Pasko et al. 1997; Gerken et al. 2000;
Cummer et al. 2006; Stenbaek-Nielsen et al. 2007). Sprites, which are massive discharges
that occur above thunderstorms milliseconds after powerful lightning strikes, have a similar
filamentary structure to streamers. It has therefore been suggested (Briels et al. 2006; Ebert
et al. 2010a) that streamers and sprites share similar mechanisms inferring that sprites are
streamers scaled to atmospheric pressures.
Empirical scaling laws for the following streamer properties were experimentally deter-
mined: the streamer segment lengths (L), the minimum diameters (dmin), the total energy
(Etot) and volume (Vtot) of a discharge event (Fig. 3, Briels et al. (2008a,b); Nijdam et al.
(2008)). These were found to scale with the gas pressure and applied voltage.
Electron mean free path: The streamer length was observed to scale with the local gas pres-
sure. The physical reason is that a streamer is a flux of electrons travelling through an
ambient gas: the mean free path of a single electron before it hits a neutral gas particle is:
lmfp = (σn)−1, (3)
and hence, lmfp ∝ n−1 or lmfp ∝ p−1gas. σ is the collisional cross sectional area for an electron-
neutral interaction and n is the number density of the gas, which is related to the gas
pressure pgas by the ideal gas law pgasV = nkBTgas. This relates to the Paschen curves,
which plot the breakdown voltage of a gas as a function of pd, the product of the gas
pressure and separation of the capacitor electrodes (for a summary see Helling et al. 2013).
For values of pd < (pd)min the breakdown voltage decreases with increasing pd; and for values
of pd > (pd)min, the breakdown voltage increases with increasing pd.
At high pressures, the mean free path is smaller with respect to the electrode separation
resulting in more collisions during the electrons transit between the electrodes. Each collision

– 16 –
randomises the electrons motion and will reduce the electrons energy. This means that the
electrons energy may be insufficient to ionise the neutrals it collides with; therefore, requiring
a larger voltage to insure sufficient electron energization for electrical breakdown to occur.
At low pressures, the electron mean free path is larger with respect to the electrode
separation and the electrons will participate in fewer collisions. In this scenario, the electron
may retain its energy but will have fewer collisions requiring a greater breakdown voltage to
insure that the collisions that occur are ionising.
The lowest breakdown voltage is found at the value of pd where these two competing
effects balance. While the breakdown voltage depends on the gas pressure, it also depends
on the type of gas as each species has a different ionisation energy.
Minimum diameter : The minimum diameter is the minimal width of a streamer segment,
below which it does not propagate (Fig. 3). Minimal diameter streamers do not branch into
further segments, and are observed at the very final tips of streamers. The assumption that
streamers have a minimal diameter is explained in Briels et al. (2008b): the streamer tip
consists of a space charge layer, which causes an enhancement of the local electric field. The
size of the space charge layer is defined by the inverse of the maximum of the Townsend
ionisation coefficient, which is derived from the molecular properties of the gas and changes
with pressure. The diameter needs to be larger than this space charge layer to propagate
farther, hence there is a minimum possible streamer diameter for a given gas and gas pressure.
Most empirically derived relations are of the following form,
pdmin = A [mm bar], (4)
The value for the constant A varies between authors. This relation was tested in detail by
Briels et al. (2008b), where they found results of Aair = 0.20± 0.02 to 0.30± 0.02 in air and
AN2 = 0.12± 0.03 in an N2 gas. Dubrovin et al. (2010) expanded on this by looking at the
properties of planetary gas mixtures. For a Jovian mixture they found AJ = 0.26 ± 0.03,
for a Venusian mixture AV = 0.09± 0.03 and a value of Aair = 0.12± 0.03 in air, similar to
Briels et al. (2008b).
Briels et al. (2008b) studied images of sprites in the upper terrestrial atmosphere and
evaluated a height-dependent minimum diameter. From this, the dependence of the local
gas temperature obeys the relation
pdmin
T= A
[mm bar
293K
]. (5)
The temperature dependence in Eq. 5 is predicated on the product nd, and can be written
as nd = pd/(kBT ) assuming an ideal gas. We note that the ideal gas law can only be

– 17 –
applied to the ambient gas into which the streamer travels, not to the gas that is affected
by the streamer. At standard temperature and pressure, Eq. 5 applies to streamers and is
consistent with the experimental values in Briels et al. (2008b), supporting the assumption
that sprites and streamers are similar in nature.
All experimental works cited below have been performed under normal pressure on the
Earth surface (∼ 0.1 . . . 1bar) and for gases of a nitrogen/oxygen mixture or pure nitro-
gen. Helling et al. (2013) demonstrated that different gas composition do not significantly
influence the electric field breakdown in the astrophysical systems studied here. This leads
us to assume that the scaling laws applied will not significantly be affected by the different
gas-phase composition in our extrasolar atmospheres.
Segment Length: The length L is the value of the diameter-dependent segment length in air
as suggested in Briels et al. (2008b). It describes the distance a single segment travels after
a branching event and before the segment itself branches.
L
d= 11± 4, (6)
with d being the segment diameter. The values for the segment length, L, change slightly
depending on the gas mixture, and a value of 9±3 was found for streamers in an N2 gas. This
relation is pressure independent. The error estimates given above result from experimental
error estimates given by the referenced authors.
Branching angle: The branching angle, α, is the angle between new segment branches when
a single segment breaks into two new segments. It was investigated by Nijdam et al. (2008)
using 3D images of laboratory streamers and the approximately Gaussian distribution with
a mean angle was found to be,
α = 43.0± 12.3◦. (7)
The error estimate results from experimental estimates given in Nijdam et al. (2008). We
note that streamer channels can also reconnect due to different polarities of the channels
(Ebert et al. (2010b)) which we can not take into account in the model presented here.
McHarg et al. (2010) observe sprite events above mesoscale thunderstorms and show that
propagating streamer heads are both smaller in width and dimmer than splitting streamer
heads. The reason for streamer head splitting is the development of a Laplacian instability
caused by an increasing electric field in the streamer head (for more details see McHarg et al.
(2010)).
Energy : The total energy, Etot, of a whole discharge event is calculated by looking at each
of the individual segments and their lengths. The value for the total dissipated energy per

– 18 –
length is taken to be (Krider et al. (1968); Cooray (1997); Rakov & Uman (2003)):
Etot
l= 105J m−1, (8)
with l a unit length in [m]. The exact number in Eq. 8 depends on the details of the lightning
process, e.g. if the first return stroke channel is considered (Cooray 1997). The energy will be
dissipated into the heating of the discharge channel and the ambient gas around the channel
(e.g. Borovsky 1995). Paxton et al. (1986) suggest that 70% of the total energy input into a
channel is optical radiation from the channel. MacLachlan et al. (2013) demonstrate that the
energy transfer calculation in a discharge channel needs to take into account a whole variety
of collisional processes as for example elastic and inelastic scattering, metastable excitation,
ionisation, metastable ionisation, electron-ion recombination. Hence, the precise value in
Eq. 8 may differ between authors.
Briels et al. (2008b) observe that the streamer intensity increases with further branching
and increasing segment diameter. In comparison, the total energy dissipated per event is
estimated to be 107 − 109J on Earth and ≈ 1012 J on Jupiter and Saturn.
Initial diameter : The behaviour of streamers scaling with voltage was described in Briels
et al. (2008a,b), where it was observed that higher voltages led to more intense, longer
streamers with thicker branches. The work also showed that the segment diameter increased
with increasing voltage, i.e. d ∝ V . However, no empirical relation was derived. Following
this result, we assume a voltage dependence to estimate the initial diameter for streamer
propagation in our calculations
dinit = nV Vinit, (9)
where nV = 10−8 is a constant and is an estimate of the diameter-voltage relation taken
from a linear fit to Fig. 5 in Briels et al. (2008b). This expression is of practical interest to
us since dinit determines the final total length of the discharge.
3.5. Model for large-scale discharge structures
We adopt the idea that a large-scale lightning strike or a large-scale sprite discharge is
composed of multiple streamer events that evolve into such large-scale discharge phenomena.
This may not always to be the case and most of the gas-discharges in an atmosphere may in
fact not even develop into a streamer as discussed in Helling et al. (2013). However, in this
paper we are interested in the scale sizes that large-scale gas-discharge events can occur for
in substellar atmospheres assuming that they occur.

– 19 –
The empirical scaling laws for streamers (Sect. 3.4) will be evaluated for the given
set of model atmospheres in Sect. 4. After the electric field at a fixed point below the
charged cloud top is calculated (Eq. 2), the initial diameter of the streamer, dinit (Eq. 9),
is evaluated. From this initial diameter the streamer branches after each segment length, L
(Eq. 6), into two new segments with a separation angle, α (Eq. 7). This approach follows
Briels et al. (2008a), where bright streamers were described as starting with thick diameters
that continued to branch into thinner streamers with smaller diameters until the minimum
diameter was reached, at which point propagation stops. The diameters of each new segment
follow an area conservation law,
dnew =√
1/2dold
dmin,old
dmin,new. (10)
which depends on the local pressure by Eq. 5. This ensures that lengths are smaller when
moving into higher pressures and increase if moving into lower pressures.
To find the minimum diameter of each segment given in Eq. 5, the parameter A is taken
from Dubrovin et al. (2010) for a Jovian atmosphere at room temperature, which we assume
to be most similar (hydrogen-based, initially oxygen-rich) to an extrasolar atmosphere,
pdmin
T= 0.26± 0.03
[mm bar
293K
]. (11)
The total length of the discharge, Ldischarge (distance between the initiation point and
termination point of the discharge), and the width of the discharge, 2Wdischarge, were evalu-
ated using the segment length given in Eq. 6 and the branching angle in Eq. 7. We assume
that the two new branches always split at equal angles of α/2 relative to the vertical axis;
therefore,
Ldischarge = L0 +
j∑i=1
Li cos(α/2) (12)
Wdischarge =
j∑i=1
Li sin(α/2), (13)
where j is the total number of steps the discharge takes (where a step is defined as
the point at which a new layer of segments has branched out of the old), so that the total
number of segments in any step is given by 2j and L0 is the length of the initial, solitary
segment.

– 20 –
The total number of segments, Nsegment, was also evaluated as it is related to the total
energy. It was calculated by adding the number of branches over each step,
Nsegment =
j∑i=0
2i. (14)
The volume of the discharge can be derived in two ways: a) The cone volume Vcone (Eq. 15),
which is simply the volume filled by the cone of a height and width taken from the results of
Eqs. 12 & 13 formed by the discharge branches, and b) Vtotal (Eq. 16), which is the sum over
the total number of individual segments of the discharge, each of which has been treated as
a simple cylinder,
Vtot =1
3πW 2
dischargeLdischarge [m3] (15)
Vsegments =
j∑i=0
2i
(πd2
i
4Li
)[m3]. (16)
The total dissipated energy, Etot, is calculated in a similar fashion: it is the sum over the
total number of segments, where the length of each segment is multiplied by the energy per
length given in Eq. 8,
Etot =
j∑i=0
2i(105Li
)[J ]. (17)
4. Results
In this section, we discuss the results of our model for large-scale discharges (see
Sect. 3.5) for brown dwarf (BD) and gas giant (GP) model atmospheres, and for their
subsolar ([M/H] = 0.0) and sub-solar ([M/H] = -3.0) metallicity counterparts. We investi-
gate how these scales change with global model parameters like the effective temperature
(Teff = 1500 − 2000K). The range of effective temperatures considered comprises those ex-
trasolar, low-mass objects where dust clouds form inside the atmosphere and determine
the observable spectrum. As outlined in Sect. 3.1, the results are derived by two different
methods:
Case (i) The first method compares the results for each model atmosphere for a constant
total number of charges (Q1 = 6.24×10²¹ e andQ2 = 3.12×10²² e) Using a prescribed number
of charges, the maximum distance from the cloud top of a possible discharge initiation within
the cloud was found by searching for the point in the cloud at which Ez,Qconst. > Eth. This

– 21 –
Fig. 6.— Electric fields for the emerging large-scale discharges within gas giant and brown
dwarf atmospheres (break-down field – dashed blue line; local electric field – solid red line).
Top (case (i)): The total number of charges is prescribed (shown for Q1 = 6.24 × 10²¹ e).
Bottom (case (ii)): Atmospheric altitude of discharge inset is prescribed which allows to
determine a minimum total charge needed for the break-down to occur (Qmin = 2.58×10²² e
for the model shown). The Drift-Phoenix model atmosphere parameters are Teff = 1500
K, log(g) = 3.0, and [M/H]=0.0.

– 22 –
point is zinit. The top panel in Fig. 6 shows zinit for the Drift-Phoenix model atmosphere
of a giant gas planet (Teff = 1500 K, log(g) = 3.0) of initial solar metallicity ([M/H]=0.0).
Case (ii) The second method compares the results for the minimum amount of charge,
Qmin, required for a discharge to occur at a point zinit below the cloud top for each individual
model atmosphere. To evaluate comparable minimum charges for each atmosphere, a set
point of discharge initiation below the cloud top was put at a distance 1/20th the height of
the cloud: zinit = ztop − (∆H/20), where ∆H is the height of the cloud. Discharges would
initiate at the bottom of this layer, and the minimum amount of charge, Qmin, required to
overcome the breakdown field at that point was found such that E(zinit, Qmin) = Eth. From
there, the discharge was allowed to propagate assuming the value of initial minimum charge
was present in the cloud region. The bottom panel in Fig. 6 shows E(zinit, Qmin) = Eth for
the Drift-Phoenix model atmosphere of a giant gas planet (Teff = 1500 K, log(g) = 3.0)
of initial solar metallicity ([M/H]=0.0).
The two-fold evaluation process is necessary because we do not know a priori how many
charges are available in the atmosphere. For the same reason, Raizer et al. (1998); Pasko
et al. (2000) and Yair et al. (2009) assume the presence of a certain number of charges at
the height in their atmospheres under investigation. In contrast, calculations for the Earth’s
atmosphere are somewhat guided by in situ measurements.
4.1. Minimum Charges for electrical breakdown
We first evaluate the minimum charge required in a cloud layer for a discharge to initi-
ate just below the cloud top (case (ii), bottom panel 6). The results for the different model
atmospheres are shown in Fig. 7: the amount of charge required to initiate a discharge de-
creased from the cool atmospheres to the hotter atmospheres. This arises as a consequence
that the cloud decks form at lower pressures (hence lower gas temperatures) as the effective
temperature increases. In analogy with a classical breakdown in a capacitor discharge, our
atmosphere system is operating in the regime pd > (pd)min, where d is the electrode’s sepa-
ration. This means for a fixed d and a decreasing gas pressure that the required breakdown
voltage, and hence the corresponding Qmin, decreases. Therefore, if Teff increases we expect
Qmin to decrease.
The breakdown field depends only on gas pressure p and chemical composition of the gas
parametrised by some constants characterising the discharge. In this study, we are assuming
that H2 is the most abundant gas species in the atmosphere and so the breakdown conditions
are defined for a H2-dominated gas. However, the chemical composition of low-metallicity

– 23 –
Fig. 7.— The minimum charge, Qmin, required to initiate a discharge in model atmospheres
of different effective temperatures, Teff for BDs (brown) and GGs (red) and for different
metallicities (solar = solid line, subsolar = dashed line). Independent data points are con-
nected to visualise potential trends in the results. Due to pressure differences in the cloud
layers, the brown dwarfs require less amounts of charge than the gas giants, and in both
cases the lower-metallicity atmosphere models require greater amounts of charge than the
solar-metallicity atmospheres. The error bars indicate the uncertainty with which the cloud
height is determined based on the Drift-Phoenix atmosphere models (see also Sect 5.2).

– 24 –
atmospheres will differ to the solar case. Although H2 remains the most abundant gas-phase
species, other molecules will be less abundant, which has an impact on the thermodynamic
structure of the atmosphere due to radiative transfer effects: low-metallicity atmospheres are
generally more compact for a given temperature compared to their solar counterparts which
causes the clouds to form at higher pressures (but lower temperature) in low-metallicity
atmospheres. Therefore, the metal abundances have an indirect influence on Qmin: we find
that Qmin is larger in low-metallicity atmospheres since the clouds form at higher pressure
and require a greater breakdown voltage.
Figure 7 suggests that GP atmospheres require larger amounts of charge to initiate an
electric breakdown of the gas. However, referring back to Fig. 1, we see that the BD clouds
form at higher pressures, which should lead to the BDs having large values of Qmin. This
discrepancy is caused by the vertical extension of BD clouds, which have extensions of only
104 m in comparison to the 107 m clouds in the GP atmospheres. The small extension
causes the field to be larger throughout the cloud in comparison to the GP case. This leads
to BD models needing lower amounts of charge to initiate a field breakdown due to the
comparatively larger local electric fields.
4.2. Large-scale discharge properties
This section evaluates the initiation height of the discharge in the atmosphere; the total
length of a discharge event; the total number of segments that compose the discharge event;
the atmospheric volume affected by the discharge; and the total energy per discharge dissi-
pated into the atmosphere. All quantities are evaluated for various sets of Drift-Phoenix
model atmospheres defined by: the effective temperature, the gravitational acceleration and
the metallicity (Teff = 1500, 1600, 1800, 2000 K, log(g) = 3.0, 5.0, [M/H] = 0.0, -3.0).
4.2.1. Initiation height
We evaluate the discharge initiation height, zinit, for a given number of charges (Q1 =
6.24×10²¹ e and Q2 = 3.12×10²² e) as the height below the cloud top where the local electric
field exceeds the breakdown threshold field, i.e. where E(z) > Eth is satisfied. Results for
all the atmospheric types are plotted in Fig. 8, where the two separate point types represent
the two charge amounts. Increasing the prescribed charge increases the local electric field
strength, allowing the local breakdown field to be overcome in regions of higher pressure.
As a result, since the gas pressure increases with distance below the cloud top, the distance

– 25 –
Fig. 8.— Distances between the cloud top and the discharge initiation height, zinit, the point
at which the local electric field grew larger than the breakdown threshold field (E(z) >
Eth) for different atmosphere models (top - GPs (log(g)=3.0), bottom - BDs (log(g)=5.0),).
Results are shown for two different value of number of charges (squares: Q1 = 6.24 × 10²¹
e; triangles: Q2 = 3.12 × 10²² e) and for a solar metallicity (solid lines) and a sub-solar
metallicity (dashed line) case. The error bars indicate the uncertainty with which the cloud
height is determined based on the Drift-Phoenix atmosphere models (see also Sect 5.2.)

– 26 –
from the cloud top for a discharge initiation, zinit, will increase. Furthermore, an increase in
effective temperature causes the discharge initiation height to move further into the cloud,
i.e. into regions of higher gas pressure. Cloud regions in hotter atmospheres form at lower
pressures (i.e. higher up in the atmosphere) with increasing Teff (compare Fig. 1), and the
local electric field in these clouds (for a constant number of charges) is greater than the
breakdown field for a greater distance into the cloud.
The behaviour of the low metallicity GP stands out in these plots as the initiation
distance from the charges is nearly coinciding with the charge carrying cloud top, where
the field is very large. As shown in Fig. 7, minimal charges of the order of 1023 e were
required to initiate a discharge in these low-metallicity atmospheres due to the cloud tops
forming at comparatively higher pressures, hence deep inside the atmosphere. This means
that the only region in which a discharge could realistically initiate is directly on the charge
carrying surface, where the field is near-infinite. In this scenario, the dipole electric field
model is insufficient to model the system since the initiation point is in such close proximity
to the charged surface that the spatial distribution of charge and the resulting field effects
would need to be considered. This may suggest that discharges would not occur in sub-solar
metallicity cloud models for the given number of charges (Q1 = 6.24×10²¹ e, Q2 = 3.12×10²²
e) assumed in Fig. 8.
4.2.2. Total discharge lengths
The total discharge lengths for the two different cases of a prescribed number of charges
(case (i)) and for a calculated minimum charge, Qmin, to start a electrical breakdown (case
(ii)) are shown in Figs. 9. Both cases demonstrate that discharges can be expected to be
much more extended in a brown dwarf atmosphere than in a giant gas planet atmosphere
(10× the GP values) if both are considered to result from the same number of charges (left
of Fig. 9).
Figure 9 shows that a large-scale discharge can propagate over 0.5 − 4 km which is
strongly dependent on the metallicity and surface gravity. Our results suggest that high-
pressure atmospheres, due to high surface gravity or low metallicity, produce exceptionally
large discharges: low-metallicity atmospheres and brown dwarfs seem to have the largest
total discharge length. The high pressure results in a small mean free path and more col-
lisions occurring during the electron transit between the cloud ‘electrodes’. Each collision
randomises the electron motion and will reduce the electron energy. Therefore, for an atmo-
sphere with higher pressure, the magnitude of the electric field required to initiate electrical
breakdown is greater. Following the empirical scaling relations, this implies that the initial

– 27 –
breakdown potential is greater and hence the size of the initial diameter of the subsequent
streamer: dinit = nV Vinit. As a consequence, as the streamer propagates through the atmo-
sphere and begins to branch, the length of the resulting streamer segments will be greater
since L ∝ d. Therefore, we expect discharges to have a greater spatial scale in high pressure
atmospheres such as brown dwarfs. Furthermore, for a high pressure atmosphere we would
expect the minimum diameter (dmin ∝ T/p) to be small, enabling the streamer to propagate
for a greater distance before the minimum diameter is reached.
Therefore, a high-pressure gas will allow for the streamer process to progress over a
longer distance through an ambient gas while it will die out quickly in a low-pressure envi-
ronment. Therefore, lighting discharges can be expected to be larger, and therefore easier to
detect, in brown dwarfs and low-metallicity planetary atmospheres. Although a larger volume
would be affected, less radiation may be emitted due to a lower number of collisions due to
lower densities, unless a saturated process dominates the emission process. The dependence
on the effective temperature is not very strong if Q = const as in Figs. 9.
All of the total discharge propagation lengths decrease with increasing effective tem-
perature. The total lengths in the Teff=2000 K atmospheres were in some cases 50% the
total discharge length in a Teff=1500 K model atmosphere. The primary reason is a large
geometrical extension of the cloud in the hotter atmospheres leads to a lower electric field
value for the same amount charge, which results in a smaller discharge length. A higher
number of total charges led to larger discharge lengths in all model atmospheres considered.
Comparing the BD model discharge lengths between the Q = const. and Q = Qmin mod-
els (Figs. 9) produces a similar conclusion supporting this result: the minimum number of
charges required to initiate discharges in BD atmospheres were of the order of 1020− 1021 e,
much smaller than the charges applied in Fig. 9 (case (i)).
4.2.3. Total number of segments
We evaluate the the total number of segments (or branches), Nsegments (Eq. 14), that
compose the whole discharge event in the atmosphere. Figure 10 shows Nsegments for a
prescribed constant number of total charges (top plot) and shows Nsegments for the minimum
number of charges needed for field break-down (bottom plot). Both figures suggest an almost
exponential decrease of the number of branches across all atmospheres, and that they are
much more numerous in the low-metallicity atmospheres.
The number of segments grows exponentially with the total length of the discharge. If
a discharge reaches greater lengths, it may branch more often. The behaviour of Nsegments

– 28 –
Fig. 9.— The total lengths, Ldischarge, that a large-scale discharge can reach in different
atmospheres (top - GPs (log(g)=3.0), bottom - BDs (log(g)=5.0)) with solar metallicity
(solid lines) and a sub-solar metallicity (dashed line). Left: Results for two different value
of a constant number of charges (squares: Q1 = 6.24 × 10²¹ e; triangles: Q2 = 3.12 × 10²²
e). Right: Results for the minimum number of charges needed for a field break-down. The
error bars indicate the uncertainty with which the cloud height is determined based on the
Drift-Phoenix atmosphere models (see also Sect 5.2).

– 29 –
is similar to that of the total discharge length: higher pressure atmospheres (due to higher
gravitational acceleration or lower metallicity) require a higher breakdown voltage, resulting
in a larger dinit, larger segment lengths L and a lower dmin. Therefore a large-scale discharge
with a greater spatial extent is more likely to have a greater number of segments.
Fig. 10.— The total number of discharge segments, Nsegments, in the discharge channel for dif-
ferent model atmospheres (top panels - GPs (log(g)=3.0), bottom panels - BDs (log(g)=5.0)).
All results are shown for a solar metallicity (solid lines) and a sub-solar metallicity (dashed
line) case. Left: results for two different value of a constant number of charges (squares:
Q1 = 6.24 × 10²¹ e; triangles: Q2 = 3.12 × 10²² e), Right: results for minimum charges
needed for field breakdown. The error bars indicate the uncertainty with which the cloud
height is determined based on the Drift-Phoenix atmosphere models (see also Sect 5.2).
4.2.4. Total energy dissipated
We now estimate the total energy dissipated by a large-scale discharge event in a sub-
stellar atmosphere. We utilise the total dissipation energy per length, Etot in units of
[J/m](Eq. 8), and combine it with our estimate for the number of segments, Nsegment (Eq. 14),
and the length of each of these segments, L (Eq. 6), which leads to Eq. 17. We note, how-
ever, that the factor of 105 in Eq. 8 may vary for different atmospheric chemistries. Our
investigation of the electric break-down conditions in (Helling et al. 2013) show, however,
that the gas-phase composition does only introduce small differences.
We evaluate the total dissipated energies (Eq. 17) depending on the model atmosphere
parameters Teff , log(g), and on metallicity. This is done for both cases: (i) for a constant

– 30 –
Fig. 11.— The total dissipated energy for different model atmospheres (top panels - GPs
(log(g)=3.0), bottom panels - BDs (log(g)=5.0)). All results are shown for a solar metallicity
(solid lines) and a sub-solar metallicity (dashed line) case. Left: results for two different
value of a constant number of charges (squares: Q1 = 6.24×10²¹ e; triangles: Q2 = 3.12×10²²
e), Right: results for minimum charges needed for field breakdown. The error bars indicate
the uncertainty with which the cloud height is determined based on the Drift-Phoenix
atmosphere models (see also Sect 5.2).

– 31 –
Fig. 12.— Characteristic discharge values for a given total dissipation energy, Etot = 1013J.
Top: The minimum charge, Qmin [e], needed to achieve a field-breakdown with a total dissi-
pation energy Etot = 1013 J (Etot,Jupiter = 1012 . . . 1013J, Etot,Saturn ≈ 1012J); Middle: Total
propagation length, Ldischarge [m], of the large-scale discharge dissipating Etot = 1013 J.;
Bottom: Total atmospheric volume affected by the propagating discharge that dissipates a
Jupiter/Saturn equivalent of Etot = 1013 J. All values are shown for different model atmo-
spheres. The error bars indicate the uncertainty with which the cloud height is determined
based on the Drift-Phoenix atmosphere models (see also Sect 5.2).

– 32 –
number of charges; and (ii) the minimum charges for each atmosphere. The results in
Fig. 11 demonstrate that the total dissipated energy is of the order of 106 - 109 J for solar
metallicity atmospheres. These values are comparable to typical solar system values which
are Etot,Earth = 108 − 109J, Etot,Venus = 109 − 1010J, Etot,Jupiter = 1012 − 1013J, and
Etot,Saturn ≈ 1012J. Our estimates suggest that more energy is released in a brown dwarf
atmosphere than in a giant gas planet because of the large dissipation length. The total
dissipation energy in our example GP atmospheres is generally more comparable to the
lightning dissipation energy on Earth. However, the total dissipated energy reaches its
highest values of 1010 − 1013 J for the low-metallicity objects, which had both higher values
of Qmin and longer total discharge lengths than their solar metallicity counterparts, leading
therefore to higher energies.
For a better comparison with known solar system values of energies of 1012-1013 J in
Saturn’s and Jupiter’s atmospheric discharges, the discharge propagation model was ran
with increasing applied charge (similar to the constant charge case) until a Jupiter/Saturn
equivalent dissipation energy of Etot = 1013 J was reached. The results plotted in Fig.12 show
that larger lengths are required in the hotter atmospheres to reach the same amount of dissi-
pated energy. This confirms our previous result for a constant charge, that smaller discharge
lengths should occur in hotter atmospheres compared to cooler atmospheres (Sect. 4.2.2).
Our results also demonstrate in Fig. 12 that a geometrically larger downward-propagating
discharge would be required in a GP atmosphere than in a brown dwarf in order to achieve
the same dissipation energy in both objects. Similarly, the discharge length is smaller in the
low-metallicity atmospheres compared to the solar-metallicity atmospheres.
This later test of finding the discharge properties for a given total dissipation energy
leads us to conclude that our results are consistent within the framework of our discharge
scaling model. Our model is based on scaling laws derived from laboratory and numerical
experiments on streamers. However, we can not exclude the possibility that other processes,
not quantified by the experimental studies, can affect the the amount of energy dissipated
or the length scale of the discharge process.
4.2.5. Total discharge volume
The volumes of atmosphere affected by a discharge propagating through the atmospheric
gas was treated as a cone filled by the discharge branches as defined in Eqs. 15 and 16. The
results for constant charges are shown in Fig. 13 (left), and those at Qmin in Fig. 13 (right).
For discharges of the size of 102 m (GP) and 103 m (BD, see Fig. 9), we observe total cone

– 33 –
Fig. 13.— The total volume of atmospheric gas that is affected by propagating discharges
through the atmospheres studied. Left: for two constant charges (Q1 = 6.24 × 10²¹ e,
Q2 = 3.12× 10²² e), Right: the minimum charges. The error bars indicate the uncertainty
with which the cloud height is determined based on the Drift-Phoenix atmosphere models
(see also Sect 5.2).
volumes of the orders of 104 − 106 m3 and 108 − 1010 m3 respectively. This is the estimated
volume of the atmospheric gas where a population of ions, metastables and electrons has
been injected in the streamer wake. Combined with the local electric field and associated
change in local temperature, this will allow chemical reactions not normally permitted in
the ambient atmosphere.
However, the volume of the atmospheric gas that is exposed to the discharge may be
underestimated in our simplistic scaling model. For example, a fractal ansatz for discharge
propagation as suggested in (Pasko et al. 2000) might yield larger volume values.
4.3. Sprites
Streamer discharges are suggested to determine the early stages of lightning discharges
and of sprites (Phelps (1974); Raizer (1991); MacGorman & Rust (1998); Briels et al.
(2008a)). Sprites, which are massive discharges that occur above thunderstorms milliseconds
after powerful lightning strikes (and are therefore also referred to as above-cloud discharges),
have a similar filamentary structure to streamers. It has therefore been suggested (e.g. Briels
et al. (2006) and Ebert et al. (2010a)) that streamers and sprites share similar underlying

– 34 –
physical mechanisms. Massive National Lightning Detection Networks provide evidence that
sprites and lightning discharges are linked: About 80% of the observed sprites on Earth co-
incide with lightning ground strokes (Boccippio et al. 1995). This is confirmed by numerical
modelling in combination with high-speed measurements of sprite optical emissions in Liu
et al. (2009) and Gamerota et al. (2011), as well as by dedicated observation campaigns for
single events (Fullekrug et al. (2013))
An electromagnetic pulse that results from a very large cloud discharge in the Earth’s
atmosphere can transfer (positive) charges downwards. The consequence is a large elec-
trostatic field above the thundercloud that exceeds the (classical) threshold electric field
for breakdown and creates an upward directed sprite discharge (e.g. Rycroft & Harrison
(2012)). The classical breakdown field (Sect.3.2) does generally not incorporate the idea
of a runaway breakdown as described in e.g. Roussel-Dupre et al. (2008), and therefore
overestimates the critical field strength needed for electrical breakdown to start. However,
the classical approach can still provide guidance for first-order-investigations as performed
in this paper in order to gain insight into how sprite extensions may change in different,
extrasolar environments.
The comparison of the local electric field resulting from a large-scale charge distribution
with the critical (classical) break-down field (Fig. 5) shows that the local electric field can
exceed the breakdown field below and above the charge-carrying cloud layer. This indicates
that the discharge process can start downwards into the cloud and along a positive density
gradient and upwards above the cloud travelling into a negative density gradient. The
downwards travelling discharges could be considered equivalent to intra-cloud lightning on
Earth, and the upward directed discharge resulting in an upward travelling ionisation front
could be considered equivalent to a sprite.
The electric field for a possible sprite, as shown in Fig. 5, was evaluated in the regions
above the cloud deck in the different cloud-forming model atmospheres considered here.
Figure 14 shows at which height above a cloud top a sprite would initiate for brown dwarfs
and giant gas planets of different Teff . The condition for the appearance of sprites is the
same as that for other discharges considered here, namely that the electric field above the
cloud charge distribution must be larger than the breakdown field. Figure 14 therefore plots
at which height above the cloud Einit,sprite > Eth. This method was used by Yair et al. (2009)
to investigate the possibility of Sprites in other solar system planets than Earth.
Figure 14 (left) only contains results for the models describing atmospheres of giant gas
planets because the electric field strength exceeds Eth for all locations above the cloud in
brown dwarf atmospheres. Hence, sprites would potentially appear at any height above the
cloud layer in a brown dwarf. A similar behaviour occurs in giant gas planet atmospheres

– 35 –
Fig. 14.— The heights above the cloud top for possible sprite initiation points for different
model atmospheres (red - GPs (log(g)=3.0), brown - BDs (log(g)=5.0)). All results are shown
for a solar metallicity (solid lines) and a sub-solar metallicity (dashed line) case. Left: results
for two different value of a constant number of charges (squares: Q1 = 6.24×10²¹ e; triangles:
Q2 = 3.12 × 10²² e), Right: results for minimum charges needed for field breakdown. The
error bars indicate the uncertainty with which the cloud height is determined based on the
Drift-Phoenix atmosphere models (see also Sect 5.2).

– 36 –
(Fig. 14, left) where for an increasing number of charges, hence an increasing electric field
strength, sprites appear closer and closer to the cloud top. The distance from the cloud top
dropping to zero in the solar metallicity Teff = 2000 K atmosphere signifies the same result
as that for the BDs: that a sprite could occur at any point above the cloud.
A less straight forward behaviour occurs if the minimum charges for field break-down is
considered (Fig. 14, right): the distance from the cloud top increases slightly as the effective
temperature rises.
The total gas volume affected by one streamer should intuitively be larger than a tra-
ditional lightning-affected volume because a Sprite can travel much further. However, it is
not obvious how the column density would differ between a lightning and a Sprite discharge
because of the outward negative density gradient in an atmosphere. In the framework of
our streamer propagation model, we can not evaluate the atmospheric gas volume affected
by a sprite as the diameter of the discharge channels increase as they propagate into lower
pressure regions. Our method diverges for sprites (Eq. 4) because we utilise the existence
of a minimum streamer diameter as termination criterion for streamer propagation. This is
appropriate for streamer propagation along a positive pressure gradient into an atmosphere.
If the streamer propagates along a negative pressure gradient, its diameter increases and its
propagation would be terminated by the increasing mean free path of the avalanche electrons
which at some point will not have enough energy to travel further. However, this process is
not incorporated by our simple streamer propagation model.
5. Uncertainty assessment of large-scale discharge properties
5.1. The influence of the gas composition
All of the above results were calculated for Drift-Phoenix model atmospheres using
the parametrisation for the breakdown field Eth, for the chemical composition of a Jupiter
atmosphere (Helling et al. 2013). This is inconsistent in comparison to the initial solar or
subsolar element abundances used in the atmosphere models. We therefore assess in how far
different chemical compositions of the atmospheric ionising gas may change our results.
First, we calculate the minimum charges, Qmin, needed to achieve a local electric field
larger than the threshold breakdown field for the different atmospheres, assuming an atmo-
spheric gas that has a composition comparable to Earth, Mars, Venus, Saturn (parameters
used from (Helling et al. 2013)). The results are plotted in Fig. 15 for giant gas planet
atmospheres (log(g) = 3.0) of solar composition ([M/H] = 0.0) and for different effective
temperatures. The charge needed to initiate electrical breakdown is largest in an Earth-like

– 37 –
N2-dominated atmospheric gas; and smallest in a atmosphere of a Jupiter-like H2-dominated
composition. The results may reflect the higher ionisation energy of N2 (15.5808 eV) com-
pared to H2 (15.4259eV). However, the difference between these two values is not very large,
which leads us to refer to the effect of so-called Penning-mixtures (or neon lamp effect). The
effect here is that the gas contains a species which is easier to ionise than the most abundant
species; hence, it efficiently seeds the field breakdown at lower voltages. In general, the
numbers are not significantly different between the different atmospheric gases.
Fig. 15.— Dependence of large-scale discharge properties on chemical composition that
influences the break-down values of atmospheric gas for different Teff . Left: The minimum
charge, Qmin, required to overcome the breakdown field at every point in the atmosphere
for ionising gases of different chemical composition. Right: The total discharge length
Ldischarge (top), the total volume V dischargetot (centre), and the total energy Edischarge
tot (bottom)
are plotted for different discharge chemistries with each minimum charge as shown on the
left of this figure. Venus and Mars lie very close. We evaluate giant gas planet atmospheres
(log(g) = 3.0) of different Teff and solar metallicity ([M/H] = 0.0).
Using these minimum charges in Fig. 15, we show what effect different atmospheric
chemistries might have on the total propagation length of the discharge (total discharge
length), Ldischarge; the total atmospheric volume affected by the discharge ionisation, V dischargetot ;
and the total energy dissipated into the surrounding gas, Edischargetot (left of Fig. 15).
The total propagation length of the whole discharge event does not change appreciably
with the chemical composition of the gas for the higher-temperature models. Given the dif-
ferences in Ldischarge and the total atmospheric volume affected by the discharge ionisation,

– 38 –
V dischargetot , it is only logical that the total dissipation energy is higher in an Earth-like atmo-
sphere compared to Jupiter. The effect of the different atmospheric chemical compositions
appear to have the largest impact on the discharge properties of the low-temperature models.
Fig. 16.— Dependence of large-scale discharge properties on different branching angles.
Top: discharge lengths, Middle: volume of the discharge cone, Bottom: total dissipated
energies. The dotted lines represent the upper and lower limits of the branching angle
(Nijdam et al. 2008). The results are for atmospheres with log(g) = 3.0, [M/H] = 0.0.
5.2. The influence of experimental uncertainties
All our estimates in the previous section are based on laboratory experiments and eval-
uation of numerical results. We assess the uncertainties introduced by the somewhat large
uncertainties in the branching angle, α, and by the determination of the cloud boundaries
from the Drift-Phoenix model atmospheres.
Branching angle α: The branching angle was given by Nijdam et al. (2008) with an
error estimate of α = 43.0± 12.3◦ (Sect. 3.4). Figure 16 demonstrates how this uncertainty
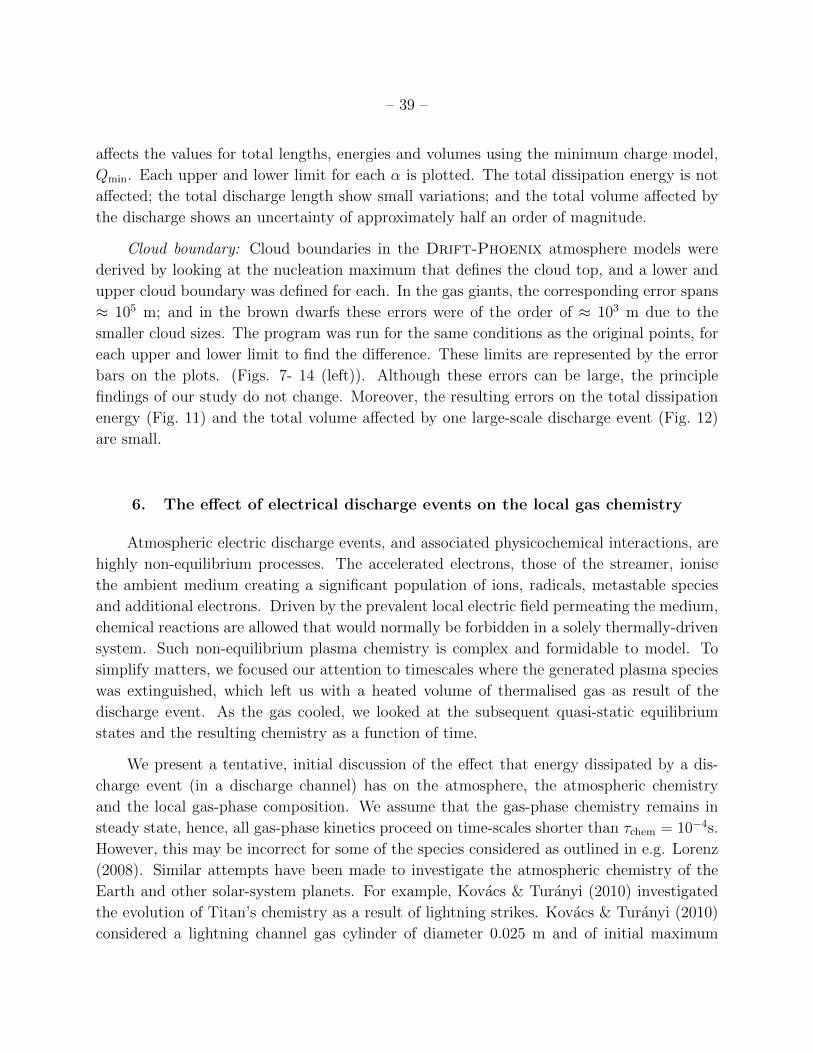
– 39 –
affects the values for total lengths, energies and volumes using the minimum charge model,
Qmin. Each upper and lower limit for each α is plotted. The total dissipation energy is not
affected; the total discharge length show small variations; and the total volume affected by
the discharge shows an uncertainty of approximately half an order of magnitude.
Cloud boundary: Cloud boundaries in the Drift-Phoenix atmosphere models were
derived by looking at the nucleation maximum that defines the cloud top, and a lower and
upper cloud boundary was defined for each. In the gas giants, the corresponding error spans
≈ 105 m; and in the brown dwarfs these errors were of the order of ≈ 103 m due to the
smaller cloud sizes. The program was run for the same conditions as the original points, for
each upper and lower limit to find the difference. These limits are represented by the error
bars on the plots. (Figs. 7- 14 (left)). Although these errors can be large, the principle
findings of our study do not change. Moreover, the resulting errors on the total dissipation
energy (Fig. 11) and the total volume affected by one large-scale discharge event (Fig. 12)
are small.
6. The effect of electrical discharge events on the local gas chemistry
Atmospheric electric discharge events, and associated physicochemical interactions, are
highly non-equilibrium processes. The accelerated electrons, those of the streamer, ionise
the ambient medium creating a significant population of ions, radicals, metastable species
and additional electrons. Driven by the prevalent local electric field permeating the medium,
chemical reactions are allowed that would normally be forbidden in a solely thermally-driven
system. Such non-equilibrium plasma chemistry is complex and formidable to model. To
simplify matters, we focused our attention to timescales where the generated plasma species
was extinguished, which left us with a heated volume of thermalised gas as result of the
discharge event. As the gas cooled, we looked at the subsequent quasi-static equilibrium
states and the resulting chemistry as a function of time.
We present a tentative, initial discussion of the effect that energy dissipated by a dis-
charge event (in a discharge channel) has on the atmosphere, the atmospheric chemistry
and the local gas-phase composition. We assume that the gas-phase chemistry remains in
steady state, hence, all gas-phase kinetics proceed on time-scales shorter than τchem = 10−4s.
However, this may be incorrect for some of the species considered as outlined in e.g. Lorenz
(2008). Similar attempts have been made to investigate the atmospheric chemistry of the
Earth and other solar-system planets. For example, Kovacs & Turanyi (2010) investigated
the evolution of Titan’s chemistry as a result of lightning strikes. Kovacs & Turanyi (2010)
considered a lightning channel gas cylinder of diameter 0.025 m and of initial maximum

– 40 –
temperature 30000 K. The plasma in the lightning column extinguished quite rapidly, but
the gas temperature decreased on a longer time scale. This intense heating of the lighting
channel is observed as optical emission in Earth and on Jupiter (e.g. Zarka et al. 2004).
Kovacs & Turanyi (2010) numerically solved the heat conductivity equation in order to cal-
culate the time-dependent temperature cooling profile of the lightning channel (their Fig.
1). Titan has a different chemical composition than the extrasolar objects considered in this
paper; however, the principle physical mechanisms of an electrical breakdown are the same,
independent of the local difference in chemistry. Foreseeable differences in time-scales can
result from the chemistry dependent cooling efficiency, particularly in rich gas mixtures (e.g
Fig. 12 in Woitke et al. 1996). Such time-scale effects are not too important for our study
as our main interest is the changing temperature during the cooling process.
-50
-40
-30
-20
-10
-50
-40
-30
-20
-10
3.2 3.4 3.6 3.8-50
-40
-30
-20
-10
-50
-40
-30
-20
-10
3.2 3.4 3.6 3.8
Fig. 17.— Carbon molecules concentrations at different times after a lightning event in the
cloud layer of a giant gas planet model atmosphere (Teff = 1500, log(g)=3, solar). The figure
panels follow the post-lightning temperature profile from Kovacs & Turanyi (2010).
We started our chemistry calculations from a Drift-phoenix atmosphere model for

– 41 –
3.4 3.5 3.6 3.7 3.8-40
-30
-20
-10
-50
-40
-30
-20
-10
3.5 3.6 3.7 3.8-50
-40
-30
-20
-10
Fig. 18.— Left: A blow-up for the small hydrocarbon molecule concentration in a gas heated
by lightning discharge to 5000K, 10−4 s after the initiation of the ionisation front. Note the
increase of CH and C2H in expense of CH4. Right: Same for oxygen-binding molecules
which participate in cloud particle condensation. H2O is only indirectly affected by cloud
formation, namely by the depletion of oxygen.
a giant gas planet (Teff = 1500 K, log(g)=3, solar). We discuss possible changes of the
gas-phase composition due to changed thermal conditions of the atmospheric region that
was affected by a lighting discharge. The time-dependent temperature decrease after the
lightning event is directly adopted from Fig. 1 in Kovacs & Turanyi (2010).
The lightning channel inside the dust cloud of our example gas-giant atmosphere affected
the atmospheric gas at heights bracketed by Tgas = 930K and Tgas = 1088K (plotted as z-
values in Figs. 17 and 18), which is equivalent to a atmospheric volume of ∼ 1013 m3. We
applied a chemical equilibrium routine to evaluate the vertical profiles of C-bearing molecules
(Figs. 17, 18) and of molecules that are involved in the cloud particle condensation process
(Fig.18, right) by mimicking the effect of an electrical breakdown by the enhancement of the
local gas temperature. Each panel in Figure 17 represents a different time after the electric
discharge occurred, and hence a different channel temperature: 5000K (0.0001 seconds),
4799K (0.001 seconds), 3342K (0.01 seconds) and 1275K (0.1 seconds). The sharp edges
correspond to the discontinuity in the temperature profile, which suddenly rises to 5000K,
for example. The production of certain carbonaceous species is hindered by these high gas
temperatures: the high temperature breaks the stable molecules such as methane and carbon
monoxide into radicals, which may recombine to form molecules that are more stable at high
temperatures (e.g. CH, C2H, HC3N). These results generally agree with the lightning model

– 42 –
of Kovacs & Turanyi (2010) for Titan. We did, however, not reproduce the increase in the
concentration of C2H6, and did not measure a significant production of HCN, one of the
proposed chemical products of lightning (e.g. Lorenz 2008; Hurley et al. 2012). This is an
indication that the chemical equilibrium approach is not appropriate for reactions affecting
these molecules. Indeed, the after-lightning concentrations of HCN, C2H2 and C2H3 only
increase for a lower channel temperature of 3342K.
The oxygen-bearing molecules underwent a decrease in their abundances for every chan-
nel temperature considered, and also H2O is dissociated at such high temperatures. The
decreased abundances of molecules like TiO, SiO, SiO2, MgOH, and FeO suggests a sud-
den stop of potential condensation processes, hence, a freeze-in of the dust properties (e.g.
grain sizes), unless the high-temperature time span is sufficiently long to evaporate the cloud
particles completely.
The analysis presented here is a tentative investigation of the effects of electrical dis-
charges on atmospheric chemistry. It is by no means an exhaustive study. This work is a first
step to see which kind of differences in the gas-phase chemistry could be expected due to the
extreme temperature changes during a discharge event in extrasolar atmospheres. Inspired by
the Miller-Urey experiment, our interest was to see if large carbon-binding macro-molecules
could be affected in the frame of our ansatz. This is a first step to identify chemical species
as a possible spectral fingerprint for extrasolar lighting.
7. On the observation of lightning in extrasolar atmospheres
Lightning and cosmic rays are important sources providing electrons to the terrestrial
atmosphere and the ionosphere. Lightning will play a comparable role in Brown Dwarfs
and exoplanets contributing to the pool of non-thermal electrons that can accelerate along
magnetic field lines or that participate in coherent plasma motion, both producing, for
example, radio and X-ray emission. Such radio and X-ray radiation was detected in brown
dwarfs and is thought to origin from accelerated electrons (Berger et al. 2010; Hall 2002;
Burgasser et al. 2011, 2013; Route & Wolszczan 2013; Williams et al. 2013a,b; Cook et al.
2013).
Nearby brown dwarfs that are not hiding inside a host-stars magnetosphere are an easier
target than exoplanets to detect radio emission that originates from lightning directly (e.g.
WISE1541: 2.8pc, GJ845Ba&b: 3.6pc; Belu et al. 2013). Further, the brown dwarfs known
to us are at much closer distances than known extrasolar planets. The nearest brown dwarf is
the binary (L8±1 / T1±1) Luhman 16 (WISEJ1049) at a distance of ∼ 2pc which is a factor

– 43 –
of 5× less than the distance assumed in Zarka et al. (2012). Luhman 16 (and other brown
dwarfs) have been suggested to show cloud-related variability (Gillon et al. 2013) in the
T-dwarf component, but no radio observations are available yet for this object. The brown
dwarf binary 2MASSJ1314 (L5/T7) has been reported to show hyperactive quiescent radio
emission (Burgasser et al. 2013). Williams et al. (2013a) present the first quiescent radio
emission from a T dwarf (T6.5, 2MASS J1047), which demonstrates that radio emission is
detectable from the coolest of the brown dwarfs. This radio emission is thought to arise from
gyrosynchrotron emission potentially pointing towards the presence of a weak chromosphere,
however, other mechanisms can not be rules out yet. Non-equilibrium (like cosmic rays,
Rimmer & Helling 2013) or dynamic ionisation processes (Alfven ionisation, Stark et al.
2013) were suggested in addition to lightning discharges to play a significant role in feeding
the atmospheric plasma in ultra-cool, low-mass objects to interact with its magnetosphere
in order to explain the origin of this radiation.
To predict observable signature for lightning itself is not a trivial task as atmospheric
electrical discharges produce broad-band observable signatures across the electromagnetic
spectrum. Direct emission results from the afore mentioned acceleration of electrons (radio,
X-ray and gamma-ray emission) and the excitation of atomic states, such as metastable
states (IR, optical emission) during the discharge process. Indirect emission results from the
effect on the local chemistry due to the electrified environment or the associated acoustic
shock. Additional emission as a consequence of secondary effects, such as the triggering of
sprites and energetic electron beams, are also possible and have been detected for terrestrial
lightning storms on Earth (Fullekrug et al. 2013).
Research on discharge observables has focused on single events in the Earth atmosphere
and atmospheres in the solar system. Table 12 summarises these signatures and links them
to astronomical instruments according to their wavelength capacity (right column). Which
signature might appear in which exoplanet’s or brown dwarf’s atmosphere depends on the
atmospheric composition, temperature, element abundance, and maybe velocity fields. The
effect of the discharges on the local chemistry manifests in the higher or lower abundance
of certain molecules3 as we show in Sect. 6. A sensible assessment of potential spectral
2 Terrestrial Gamma-ray Flashes (TGFs) are brief (typically < 1 ms) bursts of γ-rays with a mean energy
of 2 MeV originating from the Earth’s atmosphere (Lu et al. 2011). Both γ-ray and X-ray emissions are
consequences of the production of energetic runaway electrons by lightning (Dwyer et al. 2012). Sferics (or
atmospherics) are radio emissions in the low-frequency range with a power density peak at 10 kHz on Earth.
Whistlers are electromagnetic waves propagating along magnetic field lines and emitting in the VLF range.
The effect of the discharges on the local chemistry manifests in the higher abundance of certain molecules.
3 For example, the largest natural source of nitrogen-oxyds in the Earth’s troposphere is lightning (Yair

– 44 –
signatures for planets other than solar-system-twins will require a radiative transfer solution
similar to the synthetic spectrum analysis done in model atmosphere simulations.
8. Concluding summery
Fossil evidence suggests lightning has influenced the Earth’s atmosphere for at least
250 million years (Harland & Haker 1966). It has also been speculated that lightning could
be responsible for synthesising the first prebiotic molecules in a young Earth’s atmosphere
(Miller & Urey 1953, 1959; Johnson et al. 2008). Stark et al. (2013) demonstrate that prebi-
otic molecules could be synthesised on the surface of charged dust grains that are submerged
in an atmospheric plasma. In order to assess the potential role of lightning in brown dwarfs
and extrasolar planetary atmospheres, we applied laboratory and numerical scaling laws for
streamer discharges to atmospheres where mineral clouds form. A comparison between the
breakdown electric field and the local electric field shows that electrical breakdown can oc-
cur at two locations: inside the cloud layer (intra-cloud lightning) and above the cloud layer
(sprite). Boccippio et al. (1995) observed that 80% of the sprites on Earth coincide with
lightning ground strokes which was confirmed by numerical modelling in combination with
high-speed measurements of sprite optical emissions (Liu et al. 2009; Gamerota et al. 2011).
From these locations in the atmosphere, the discharge propagates through the atmo-
sphere with subsequent branching until a minimum diameter is reached and the discharge
terminates. The total length of the lightning strike generally extends over a longer dis-
tance in the atmosphere of a brown dwarf than of a giant gas planet. Consequently, the
atmospheric gas volume affected by one of these discharge events (e.g. by an increase of
heat or an increase of the local number of electrons) is larger in a brown dwarf atmosphere
(108 − 1010 m3) than in a giant gas planet’s atmosphere (104 − 106 m3). The total dissi-
pated energy in one event is < 1012 J for all models of initial solar metallicity which is below
the values observed for Saturn and Jupiter. The dissipated energy is higher in brown dwarf
atmospheres than in giant gas planetary atmospheres and increases with decreasing effective
temperature in both cases.
This all suggests that lightning events occurring in the atmospheres of BDs may be easier
2012). Krasnopolsky (2006) suggested that the observed NO abundance in Venus’s atmosphere may be the
result of lightning discharges. On Earth, they typically emit in the blue and red range of the spectrum.
Borucki et al. (1996) simulated the atmosphere of a Jupiter-like planet and found that the He 588 nm line
could appear in the spectrum of a lightning discharge. Tessenyi et al. (2013) found that ozone’s 9.6 and 14.3
µm band could be significant in the atmosphere of super-Earths.

– 45 –
to observe than on planets. However, the likelihood of detection depends on the energetics
of the discharge and the proximity of its host to Earth. Many of the known exoplanets, in
particular those in the habitable zone, are considerably farther away from Earth than the
nearest brown dwarfs (e.g. Lo Curto et al. 2013). Therefore, a non-detection is not evidence
for the absence of lightning on exoplanets.
The energy release by lightning is dissipated into the ambient medium and, hence,
causes an increase of the gas temperature inside the discharge channel. Assuming that
the chemistry remains in a steady state (for all kinetic reactions τchem < 10−4s), we have
presented a tentative investigation of the impact lightning has on the molecular composition
of a GP atmospheric gas of solar metallicity. We modelled the enhanced temperature in a
localised atmospheric volume as a result of the discharge event, and its effect on the local
chemistry. First attempts to show the influence of lightning on the local gas phase indicate
an increase of small carbohydrate molecules like CH and CH2 at the expense of CO and CH4.
Dust forming molecules are destroyed and the dust properties are frozen-in unless enough
time is available for complete evaporation.
The dissipated energy per lightning event calculated from our simplified model is com-
parable to terrestrial values, and only reach values comparable to Jupiter in a low-metallicity
atmosphere which is ∼ 104 − 105× the terrestrial value. As there is no reason to doubt
the fundamental physics of streamer propagation being applicable outside of our solar sys-
tem, external factors like rotation rates and cosmic rays may influence the occurrence of
such large-scale discharges. Rimmer & Helling (2013) show that cosmic rays can ionise the
upper atmosphere of free-floating brown dwarfs and giant gas planets, and cosmic rays may
also trigger lightning (Beloglazov & Akhmetov 2010; Rycroft & Harrison 2012; Babich et al.
2012). The impact of cosmic rays will be stronger for a brown dwarf because they are not
shielded by a host star’s wind. Brown dwarfs can be rapid rotators (e.g. Scholz et al. 2011)
which influences the wind speeds and the local conditions for charge separation. Volcano
plumes, which are composed of small silicate ash particles, have a lightning activity that
is order of magnitudes larger than in a common thundercloud on Earth. These arguments
suggest that our results provide a lower limit for the lightning dissipation energy and that
lightning can be expected to be stronger and more frequent in fast rotating extraterrestrial
objects that form mineral clouds.
Acknowledgement: We thank the anonymous referee for a very constructive refereeing
process. We thank Declan A. Diver, M. Fullekrug, Aline Vidotto, Scott Gregory, and Peter
Woitke for helpful discussions. ChH, CRS, GH highlight financial support of the European
Community under the FP7 by an ERC starting grant. RB thanks the Physics Trust of the
University of St Andrews for supporting her summer placement. Most literature search was

– 46 –
performed using the ADS. Our local computer support is highly acknowledged.
REFERENCES
Akalin, F., Gurnett, D. A., Averkamp, T. F., et al. 2006, Geophys. Res. Lett., 33, 20107
Aplin, K. L. 2013, Electrifying Atmospheres: Charging, Ionisation and Lightning in the Solar
System and Beyond, doi:10.1007/978-94-007-6633-4
Babich, L. P., Bochkov, E. I., Dwyer, J. R., & Kutsyk, I. M. 2012, Journal of Geophysical
Research (Space Physics), 117, 9316
Beloglazov, M. I., & Akhmetov, O. I. 2010, Geomagnetism and Aeronomy/Geomagnetizm i
Aeronomiia, 50, 781
Belu, A. R., Selsis, F., Raymond, S. N., et al. 2013, ApJ, 768, 125
Berger, E., Basri, G., Fleming, T. A., et al. 2010, ApJ, 709, 332
Boccippio, D. J., Williams, E. R., Heckman, S. J., et al. 1995, Science, 269, 1088
Borovsky, J. E. 1995, J. Geophys. Res., 100, 2697
Borucki, W. J., McKay, C. P., Jebens, D., Lakkaraju, H. S., & Vanajakshi, C. T. 1996,
Icarus, 123, 336
Braude, S. I., Megn, A. V., Riabov, B. P., Sharykin, N. K., & Zhuk, I. N. 1978, Ap&SS, 54,
3
Briels, T. M. P., Kos, J., van Veldhuizen, E. M., & Ebert, U. 2006, Journal of Physics D
Applied Physics, 39, 5201
Briels, T. M. P., Kos, J., Winands, G. J. J., van Veldhuizen, E. M., & Ebert, U. 2008a,
Journal of Physics D Applied Physics, 41, 234004
Briels, T. M. P., van Veldhuizen, E. M., & Ebert, U. 2008b, Journal of Physics D Applied
Physics, 41, 234008
Burgasser, A. J., Melis, C., Zauderer, B. A., & Berger, E. 2013, ApJ, 762, L3
Burgasser, A. J., Sitarski, B. N., Gelino, C. R., Logsdon, S. E., & Perrin, M. D. 2011, ApJ,
739, 49

– 47 –
Cook, B. A., Williams, P. K. G., & Berger, E. 2013, ArXiv e-prints, arXiv:1310.6758
Cooray, V. 1997, J. Geophys. Res., 102, 21401
Cummer, S. A., Jaugey, N., Li, J., et al. 2006, Geophysical Research Letters, 33, 4104
Dehn, M. 2007, PhD Thesis, University Hamburg
Desch, M. D. 1992, in Planetary Radio Emissions III, Proceedings of the 3rd International
Workshop held at Graz, Austria, September 2-4, 1991. Edited by H.O. Rucker, S.J.
Bauer, and M.L. Kaiser. Austrian Academy of Sciences Press, Vienna, 1985., p.371,
ed. H. O. Rucker, S. J. Bauer, & M. L. Kaiser, 371
Desch, S. J., Borucki, W. J., Russell, C. T., & Bar-Nun, A. 2002, Reports on Progress in
Physics, 65, 955
Dickinson, J. T., Jensen, L. C., & Jahan-Latibari, A. 1984, Journal of Vacuum Science
Technology, 2, 1112
Dobbs-Dixon, I., Agol, E., & Burrows, A. 2012, ApJ, 751, 87
Dubrovin, D., Nijdam, S., van Veldhuizen, E. M., et al. 2010, Journal of Geophysical Research
(Space Physics), 115, 0
Dwyer, J. R., Smith, D. M., & Cummer, S. A. 2012, Space Sci. Rev., 173, 133
Dwyer, J. R., Rassoul, H. K., Al-Dayeh, M., et al. 2004, Geophys. Res. Lett., 31, 5118
Dyudina, U. A., del Genio, A. D., Ingersoll, A. P., et al. 2004, Icarus, 172, 24
Ebert, U., Nijdam, S., Li, C., et al. 2010a, Journal of Geophysical Research (Space Physics),
115, 0
—. 2010b, Journal of Geophysical Research (Space Physics), 115, 0
Ehrenreich, D., Tinetti, G., Lecavelier Des Etangs, A., Vidal-Madjar, A., & Selsis, F. 2006,
A&A, 448, 379
Farrell, W. M., Kaiser, M. L., & Desch, M. D. 1999, Geophys. Res. Lett., 26, 2601
Fischer, G., Gurnett, D. A., Kurth, W. S., et al. 2008, Space Sci. Rev., 137, 271
Fischer, G., Kurth, W. S., Gurnett, D. A., et al. 2011, Nature, 475, 75
Fullekrug, M., Kolmasova, I., Santolik, O., et al. 2013, 0

– 48 –
Gamerota, W. R., Cummer, S. A., Li, J., et al. 2011, Journal of Geophysical Research (Space
Physics), 116, 2317
Gerken, E. A., Inan, U. S., & Barrington-Leigh, C. P. 2000, Geophysical Research Letters,
27, 2637
Gillon, M., Triaud, A. H. M. J., Jehin, E., et al. 2013, ArXiv e-prints, arXiv:1304.0481
Green, J. C., Froning, C. S., Osterman, S., et al. 2012, ApJ, 744, 60
Gurnett, D. A., Kurth, W. S., Cairns, I. H., & Granroth, L. J. 1990, J. Geophys. Res., 95,
20967
Hall, P. B. 2002, ApJ, 580, L77
Harland, W. B., & Haker, J. 1966, Adv.Sci., 22, 663
Helling, C., Dehn, M., Woitke, P., & Hauschildt, P. H. 2008a, Astrophysical Journal, 675,
L105
—. 2008b, Astrophysical Journal, 677, L157
Helling, C., Jardine, M., Diver, D., & Stark, C. 2013, (ApJ), 767, 136
Helling, C., Jardine, M., & Mokler, F. 2011a, ApJ, 737, 38
Helling, C., Jardine, M., Witte, S., & Diver, D. A. 2011b, Astrophysical Journal, 727, 4
Helling, C., Ackerman, A., Allard, F., et al. 2008c, MNRAS, 391, 1854
Heng, K., Menou, K., & Phillipps, P. J. 2011, MNRAS, 413, 2380
Hernandez, S., & et al. 2012, Space Telescope Imaging Spectrograph Instrument Handbook
for Cycle 21 v. 12.0
Houck, J. R., Roellig, T. L., van Cleve, J., et al. 2004, ApJS, 154, 18
Hurley, J., Irwin, P. G. J., Fletcher, L. N., et al. 2012, Planet. Space Sci., 65, 21
Johnson, A. P., Cleaves, H. J., Dworkin, J. P., et al. 2008, Science, 322, 404
Kassim, N. E., Polisensky, E. J., Clarke, T. E., et al. 2005, in Astronomical Society of the
Pacific Conference Series, Vol. 345, From Clark Lake to the Long Wavelength Array:
Bill Erickson’s Radio Science, ed. N. Kassim, M. Perez, W. Junor, & P. Henning, 392

– 49 –
Kaufl, H.-U., Ballester, P., Biereichel, P., et al. 2004, in Society of Photo-Optical Instrumen-
tation Engineers (SPIE) Conference Series, Vol. 5492, Ground-based Instrumentation
for Astronomy, ed. A. F. M. Moorwood & M. Iye, 1218–1227
Knutson, H. A., Lewis, N., Fortney, J. J., et al. 2012, ApJ, 754, 22
Kovacs, T., & Turanyi, T. 2010, Icarus, 207, 938
Krasnopolsky, V. A. 2006, Icarus, 182, 80
Krider, E. P., Dawson, G. A., & Uman, M. A. 1968, J. Geophys. Res., 73, 3335
Kumar, A., Ghosh, S. K., Hutchings, J., et al. 2012, in Society of Photo-Optical Instru-
mentation Engineers (SPIE) Conference Series, Vol. 8443, Society of Photo-Optical
Instrumentation Engineers (SPIE) Conference Series
Lacy, J. H., Richter, M. J., Greathouse, T. K., Jaffe, D. T., & Zhu, Q. 2002, PASP, 114, 153
Le Fevre, O., Saisse, M., Mancini, D., et al. 2003, in Society of Photo-Optical Instru-
mentation Engineers (SPIE) Conference Series, Vol. 4841, Instrument Design and
Performance for Optical/Infrared Ground-based Telescopes, ed. M. Iye & A. F. M.
Moorwood, 1670–1681
Little, B., Anger, C. D., Ingersoll, A. P., et al. 1999, Icarus, 142, 306
Liu, N., & Pasko, V. P. 2007, Geophys. Res. Lett., 34, 16103
Liu, N. Y., Pasko, V. P., Adams, K., Stenbaek-Nielsen, H. C., & McHarg, M. G. 2009,
Journal of Geophysical Research (Space Physics), 114, 0
Lo Curto, G., Mayor, M., Benz, W., et al. 2013, ArXiv e-prints, arXiv:1301.2741
Lorenz, R. D. 2008, Space Sci. Rev., 137, 295
Lu, G., Cummer, S. A., Li, J., et al. 2011, Journal of Geophysical Research (Space Physics),
116, 3316
MacGorman, D., & Rust, W. 1998, The electric nature of storms (Oxford University Press)
MacLachlan, C. S., Potts, H. E., & Diver, D. A. 2013, Plasma Sources Science Technology,
22, 015025
Mandell, A. M., Bast, J., van Dishoeck, E. F., et al. 2012, ApJ, 747, 92
Marisaldi, M., Tavani, M., Argan, A., et al. 2010, AGU Fall Meeting Abstracts, A330

– 50 –
Mayor, M., Pepe, F., Queloz, D., et al. 2003, The Messenger, 114, 20
McHarg, M. G., Stenbaek-Nielsen, H. C., Kanmae, T., & Haaland, R. K. 2010, Journal of
Geophysical Research (Space Physics), 115, 0
McLean, I. S., Becklin, E. E., Bendiksen, O., et al. 1998, in Society of Photo-Optical In-
strumentation Engineers (SPIE) Conference Series, Vol. 3354, Infrared Astronomical
Instrumentation, ed. A. M. Fowler, 566–578
Meegan, C., Lichti, G., Bhat, P. N., et al. 2009, ApJ, 702, 791
Merrison, J. P., Gunnlaugsson, H. P., Hogg, M. R., et al. 2012, Planet. Space Sci., 60, 328
Miller, S., & Urey, H. 1953, Science, 117
Miller, S. L., & Urey, H. C. 1959, Science, 130, 245
Nichols, J. D., Burleigh, M. R., Casewell, S. L., et al. 2012, ApJ, 760, 59
Nijdam, S., Moerman, J. S., Briels, T. M. P., van Veldhuizen, E. M., & Ebert, U. 2008,
Applied Physics Letters, 92, 101502
Noxon, J. F. 1976, Geophys. Res. Lett., 3, 463
Pancheshnyi, S., Nudnova, M., & Starikovskii, A. 2005, Physical Review E, 71, 016407
Pasko, V. P. 2007, Plasma Sources Science Technology, 16, 13
Pasko, V. P., Inan, U. S., & Bell, T. F. 2000, Geophys. Res. Lett., 27, 497
Pasko, V. P., Inan, U. S., Bell, T. F., & Taranenko, Y. N. 1997, Journal of Geophysical
Research, 102, 4529
Paxton, A. H., Gardner, R. L., & Baker, L. 1986, Physics of Fluids, 29, 2736
Perna, R., Heng, K., & Pont, F. 2012, ApJ, 751, 59
Phelps, C. T. 1974, Journal of Atmospheric and Terrestrial Physics, 36, 103
Raizer, Y. 1991, Gas Discharge Physics (Berlin, Springer)
Raizer, Y. P., Milikh, G. M., Shneider, M. N., & Novakovski, S. V. 1998, Journal of Physics
D Applied Physics, 31, 3255
Rakov, V., & Uman, M. 2003, Lightning: Physics and Effects (Cambridge University Press)

– 51 –
Rauscher, E., & Menou, K. 2012, ApJ, 750, 96
Rimmer, P., & Helling, C. 2013, (ApJ, submitted), 0, 0
Rinnert, K., Lanzerotti, L. J., Uman, M. A., et al. 1998, Journal of Geophysical Research,
103, 22979
Roming, P. W. A., Kennedy, T. E., Mason, K. O., et al. 2005, Space Sci. Rev., 120, 95
Roussel-Dupre, R., Colman, J. J., Symbalisty, E., Sentman, D., & Pasko, V. P. 2008, Space
Science Reviews, 137, 51
Route, M., & Wolszczan, A. 2013, ApJ, 773, 18
Rycroft, M., & Harrison, R. 2012, Space Science Review, 168, 363
Scholz, A., Irwin, J., Bouvier, J., et al. 2011, MNRAS, 413, 2595
Showman, A. P., Fortney, J. J., Lewis, N. K., & Shabram, M. 2013a, ApJ, 762, 24
—. 2013b, ApJ, 762, 24
Stark, C. R., Helling, C., Diver, D. A., & Rimmer, P. B. 2013, ArXiv e-prints,
arXiv:1311.4408
Stenbaek-Nielsen, H. C., McHarg, M. G., Kanmae, T., & Sentman, D. D. 2007, Geophysical
Research Letters, 34, 11105
Tavani, M., Barbiellini, G., Argan, A., et al. 2006, in Society of Photo-Optical Instru-
mentation Engineers (SPIE) Conference Series, Vol. 6266, Society of Photo-Optical
Instrumentation Engineers (SPIE) Conference Series
Tessenyi, M., Tinetti, G., Savini, G., & Pascale, E. 2013, Icarus, 226, 1654
van Haarlem, M. P., Wise, M. W., Gunst, A. W., et al. 2013, A&A, 556, A2
Vernet, J., Dekker, H., D’Odorico, S., et al. 2011, A&A, 536, A105
Viana, A. 2009, Near Infrared Camera and Multi-Object Spectrometer Instrument Handbook
for Cycle 17 v. 11.0
Wallace, L. 1964, ApJ, 139, 994
Williams, P. K. G., Berger, E., & Zauderer, B. A. 2013a, ApJ, 767, L30

– 52 –
Williams, P. K. G., Cook, B. A., & Berger, E. 2013b, ArXiv e-prints, arXiv:1310.6757
Witte, S., Helling, C., Barman, T., Heidrich, N., & Hauschildt, P. H. 2011, A&A, 529, A44
Witte, S., Helling, C., & Hauschildt, P. H. 2009, Astronomy and Astrophysics, 506, 1367
Woitke, P., & Helling, C. 2004, A&A, 414, 335
Woitke, P., Krueger, D., & Sedlmayr, E. 1996, A&A, 311, 927
Yair, Y. 2012, Advances in Space Research, 50, 293
Yair, Y., Fischer, G., Simoes, F., Renno, N., & Zarka, P. 2008, Space Sci. Rev., 137, 29
Yair, Y., Takahashi, Y., Yaniv, R., Ebert, U., & Goto, Y. 2009, Journal of Geophysical
Research (Planets), 114, 9002
Zarka, P., Farrell, W. M., Fischer, G., , & Konovalenko, A. 2008, in Planetary Atmopsheric
Electricity, Edited by F.Leblanc, K.L. Aplin, Y.Yair, R.G. Harrison. J.P. Lebreton,
M. Blanc, p.257, ed. F. Leblanc, K. L. Aplin, Y. Yari, R. G. Harrison, L. J. P., &
B. M., 257
Zarka, P., Farrell, W. M., Kaiser, M. L., Blanc, E., & Kurth, W. S. 2004, Planet. Space Sci.,
52, 1435
Zarka, P., & Pedersen, B. M. 1986, Nature, 323, 605
Zarka, P., Bougeret, J.-L., Briand, C., et al. 2012, Planet. Space Sci., 74, 156
This preprint was prepared with the AAS LATEX macros v5.2.

– 53 –
Process Signature Wavelength Celestial body References Instrument with
suitable
wavelength range
Direct lightning
emission
γ - ray
(TGF)
20 eV - 40 MeV
Earth
Lu et al. (2011); Yair (2012)
Marisaldi et al. (2010)
Fermi GBM, Meegan et al. (2009)
AGILE, Tavani et al. (2006)
X - ray 30 − 250 keV Dwyer et al. (2004)
Dwyer et al. (2012)
AGILE
Astrosat-SXT1
Astrosat-LAXPC2
He 588 nm Jupiter Borucki et al. 1996
Aplin (2013)
VLT - X-SHOOTER
Vernet et al. (2011)
VLT - VIMOS, Le Fevre et al. (2003)
NUV to NIR
many lines of
N2, N(II),
O(I), O(II)
See: Wallace (1964)
(310-980 nm)
0.35-0.85 µm
(direct imaging)
Earth
Jupiter
Wallace (1964)
Baines et al. 2007
Astrosat - UVIT, Kumar et al. (2012)
Swift-UVOT, Roming et al. (2005)
VLT - X-SHOOTER
VLT - VIMOS
HARPS, Mayor et al. (2003)
HST-NICMOS, Viana (2009)
IRTF - TEXES, Lacy et al. (2002)
Spitzer IRS, Houck et al. (2004)
whistlers tens of Hz - kHz Earth
Saturn
Jupiter
Desch et al. (2002)
Yair et al. (2008); Yair (2012)
Akalin et al. (2006)
Fischer et al. (2008)
LOFAR, van Haarlem et al. (2013)
UTR 2, Braude et al. (1978)
LWA, Kassim et al. (2005)
sferics 1 kHz - 100 MHz Earth
Saturn
Uranus
Desch et al. (2002)
Yair et al. (2008)
Fischer et al. (2008)
Zarka & Pedersen (1986)
LOFAR
UTR 2
LWA
Effect on
local
chemistry
NOx 439 nm (NO2)
445 nm (NO2)
5.3 µm (NO)
Earth
Venus
Lorenz (2008)
Noxon (1976)
Krasnopolsky (2006)
HST-STIS
Hernandez & et al. (2012)
VLT -X-SHOOTER
VLT - VIMOS
HARPS
HST - NICMOS
IRTF-TEXES
Spitzer IRS
O3 9.6 µm
14.3 µm
200 − 350 nm
420 − 830 nm
Earth Tessenyi et al. (2013)
Ehrenreich et al. (2006)
HCN 2.97525 µm
3.00155 µmJupiter
Desch et al. (2002)
Mandell et al. (2012)
VLT - CRIRES, Kaufl et al. (2004)
Keck - NIRSPEC, McLean et al. (1998)C2H2 2.998 µm
3.0137 µm
Emission caused
by secondary
events
(e.g. sprites)3
1PN2 609 − 753 nm
EarthPasko (2007)
Liu & Pasko (2007)
HST - STIS
VLT - X-SHOOTER
VLT - VIMOS
HARPS
1NN+2 391.4 nm
2PN2 337 nm
LBH N2 150 − 280 nm HST-COS,Green et al. (2012)
HST-STIS
1 http://astrosat.iucaa.in/?q=node/142 http://astrosat.iucaa.in/?q=node/123 1PN2 is the first, 2PN2 is the second positive, LBH N2 is the Lyman-Birge-Hopfield N2 band system. 1NN+
2 is the first negative band system of N+2 .
Table 1: Lightning discharges signatures observed in the Solar System. The right column lists
potentially useful instruments to observe lightning on extrasolar planets or brown dwarfs.