Ion concentration variations at short distances downwind of continuous and quasi-instantaneous point...
12
Pesric. Sci. 1977, 8, 84-95 Ion Concentration Variations at Short Distances Downwind of Continuous and Quasi-instantaneous Point Sourcesa Christopher D. Jones Chemical Defence Establishment, Porton Down, Salisbury, Wilts. (Manuscript received 4 February 1976) An improved experimental technique is described which enables the fine structure of the ion concentration variations downwind of both continuous and instantaneous point sources to be examined. The method, which involves the use of ionised air, permits resolution of features within diffusing clouds of the order of centimetres since the detector response time is about ten milliseconds. The success of the method can be attributed to the fact that the measurements are entirely electrical in nature, thereby eliminating certain defects inherent in most other sensing techniques. However, the method does possess disadvantages and these are critically examined. Experimental results are presented which show clearly the presence of considerable fine structure hitherto suspected, but not quantitatively observed, in diffusing plumes, i.e. from continuous sources, and puffs, i.e. from instantaneous sources. The implications of these data are considered briefly. 1. Introduction Scientific examination of activities such as crop-spraying necessitates detailed understanding of the small-scale transport and diffusion processes occurring in the lower atmosphere. Near the surface, atmospheric motion is usually turbulent' and, moreover, this turbulence is spatially inhomogeneous and temporally non-stationary.2 Prediction of both the trajectories of and the concentration distributions within individual clouds is therefore extremely difficult if not inherently impossible; however, in many cases,3-5 the assumption of Gaussian profiles of dosage and concentration has proved of value, even though the justification for it is weak. The deficiencies of Gaussian profiles are most evident in the investigation of instantaneous concentration distributions and have long been recognised,e though relatively little work has been undertaken in this field because of the very considerable theoretical and experimental difficulties encountered. Consideration of the frequency spectrum of the velocity variations present in atmospheric turbulence' suggests that, at least as far as 100 m downwind from a source, fine structure having a scale of the order of tens of centimetres will exist in diffusing clouds. Therefore, in any experiments to investigate these phenomena stringent requirements will be placed on detector response-time if adequate resolution of the structure is to be obtained. Thus, although Goslines, using nitric oxide as a tracer with a detector response time of 10 s, and Ramsdell and Hinds,e using krypton with a response time of 38 s, employed fast response instruments by normal standards, the more rapid variations in concentration would probably have been missed. Despite this limitation, subsequent analysis10 showed that the time distribution of the concentration variations experienced at a given point was approximately logarithmic-normal, provided zero readings of concentration were discounted. If this type of analysis is to have maximum applicability in practical situations then examination of the entire spectrum of the concentration variations would be highly desirable. In this paper an experimental techniquell. 12 for investigating the fine structure of diffusing clouds is presented and some preliminary observations are discussed. Presented at a meeting Droplrts in air, Part I: The generation and behaviorrr ofairborne disprsions on 7 October 1975, organised jointly by the Physicochemical and Biophysical Panel (Pesticide Group) and the Colloid and Surface Chemistry Group, Society of Chemical Industry, and the Society of Cosmetic Chemists of Great Britain. 84
-
Upload
christopher-d-jones -
Category
Documents
-
view
213 -
download
1
Transcript of Ion concentration variations at short distances downwind of continuous and quasi-instantaneous point...
Pesric. Sci. 1977, 8, 84-95
Ion Concentration Variations at Short Distances Downwind of Continuous and Quasi-instantaneous Point Sourcesa
Christopher D. Jones
Chemical Defence Establishment, Porton Down, Salisbury, Wilts.
(Manuscript received 4 February 1976)
An improved experimental technique is described which enables the fine structure of the ion concentration variations downwind of both continuous and instantaneous point sources to be examined. The method, which involves the use of ionised air, permits resolution of features within diffusing clouds of the order of centimetres since the detector response time is about ten milliseconds. The success of the method can be attributed to the fact that the measurements are entirely electrical in nature, thereby eliminating certain defects inherent in most other sensing techniques. However, the method does possess disadvantages and these are critically examined. Experimental results are presented which show clearly the presence of considerable fine structure hitherto suspected, but not quantitatively observed, in diffusing plumes, i.e. from continuous sources, and puffs, i.e. from instantaneous sources. The implications of these data are considered briefly.
1. Introduction
Scientific examination of activities such as crop-spraying necessitates detailed understanding of the small-scale transport and diffusion processes occurring in the lower atmosphere. Near the surface, atmospheric motion is usually turbulent' and, moreover, this turbulence is spatially inhomogeneous and temporally non-stationary.2 Prediction of both the trajectories of and the concentration distributions within individual clouds is therefore extremely difficult if not inherently impossible; however, in many cases,3-5 the assumption of Gaussian profiles of dosage and concentration has proved of value, even though the justification for it is weak. The deficiencies of Gaussian profiles are most evident in the investigation of instantaneous concentration distributions and have long been recognised,e though relatively little work has been undertaken in this field because of the very considerable theoretical and experimental difficulties encountered. Consideration of the frequency spectrum of the velocity variations present in atmospheric turbulence' suggests that, at least as far as 100 m downwind from a source, fine structure having a scale of the order of tens of centimetres will exist in diffusing clouds. Therefore, in any experiments to investigate these phenomena stringent requirements will be placed on detector response-time if adequate resolution of the structure is to be obtained. Thus, although Goslines, using nitric oxide as a tracer with a detector response time of 10 s, and Ramsdell and Hinds,e using krypton with a response time of 38 s, employed fast response instruments by normal standards, the more rapid variations in concentration would probably have been missed. Despite this limitation, subsequent analysis10 showed that the time distribution of the concentration variations experienced at a given point was approximately logarithmic-normal, provided zero readings of concentration were discounted. If this type of analysis is to have maximum applicability in practical situations then examination of the entire spectrum of the concentration variations would be highly desirable. In this paper an experimental techniquell. 12 for investigating the fine structure of diffusing clouds is presented and some preliminary observations are discussed.
Presented at a meeting Droplrts in air, Part I : The generation and behaviorrr ofairborne disprsions on 7 October 1975, organised jointly by the Physicochemical and Biophysical Panel (Pesticide Group) and the Colloid and Surface Chemistry Group, Society of Chemical Industry, and the Society of Cosmetic Chemists of Great Britain.
84
Ion concentrations around point sources 85
2. Theory and limitations of the ion tracer technique
2.1. Initial remarks
Unipolar ions are capable of persisting in the lower atmosphere for several minutes13 before they are neutralised by recombination. Because in short-range atmospheric diffusion investigations travel times are only a few tens of seconds, such ions might be a suitable tracer to use in this work.14.15 However, the charge on the cloud will affect it in two ways as compared with an uncharged cloud.12 Firstly, the cloud will expand because of the outward electrostatic forces and secondly, due to the proximity of the ground, electrostatic image forces will induce downward motion.= If these effects are substantial compared with those of turbulent diffusion, then the use of ions in the application envisaged would be precluded.
2.2. The electrostatic repulsion force and comparison of its effects with those of turbulent diffusion
Assuming that the expansion is due entirely to electrostatic forces, for an ion plume (i.e. from a continuous source) of initial radius ro, the radius* rpiume at a distance x downwind is given approximately12 by
where p is the small-ion mobility, i the ion generator output current, u the wind velocity and co
the permittivity of free space. The relation
3piArx ‘ I 3 rpuri= r03+- [ ~ U ? T C O ]
where AT is the short time interval over which the ions are released, has been derived for an ion puff,” i.e. that from an instantaneous source.
The next step is to incorporate the effects of turbulent diffusion into equations (1) and (2). In many cases the turbulent spreading of puffs and plumes can be approximately estimated from empirical formulae involving power laws of x. In neutral conditions a representative puff radius r’ is given byle
r ‘ = 0.1 3~0.92 + ro’ (3)
where ro’ is the initial radius. This relation is particularly useful in that it can also be used to estimate the instantaneous transverse radius of a plume. However, further simplification is required prior to developing the analysis and this is achieved by approximating r’ to a linear function of x. Tq the region of interest equation (3) can be adequately described by
(4) r’=Kx+ro’,where K=0.1 .
Consider the situation at x where the radius is R. If the total expansion rate, for a charged system is dRldx then
dx
a The additional motion arising from the Earth’s natural electric field will not be significant in fair weather and
b The longitudinal expansion rate can be shown to be small in most conditions and is therefore not considered is therefore ignored.
here.12
86 C. D. Jones
where the expression for (8R/8X)electrostatiC will depend on whether a plume or puff is being treated. For the ion plume, equations (l), (4) and ( 5 ) give
" + K dRplunie- - - d x 2 R p 1 u m e U ~ ~ ~ o
which is better written
Integration of equation (6) gives
x= Rplume- ___- Roplurne - ~ In [- L+ KRplurnc --I K K 2 L+ KR~plume (7)
where Roplurne is the original radius of the ion plume, i.e. a t x=O. Similarly, for the ion puff the result
where p i A 7 M = __
4 U H f u
is obtained. Inspection of equations (7) and (8) reveals that the first term on the right hand side expresses the
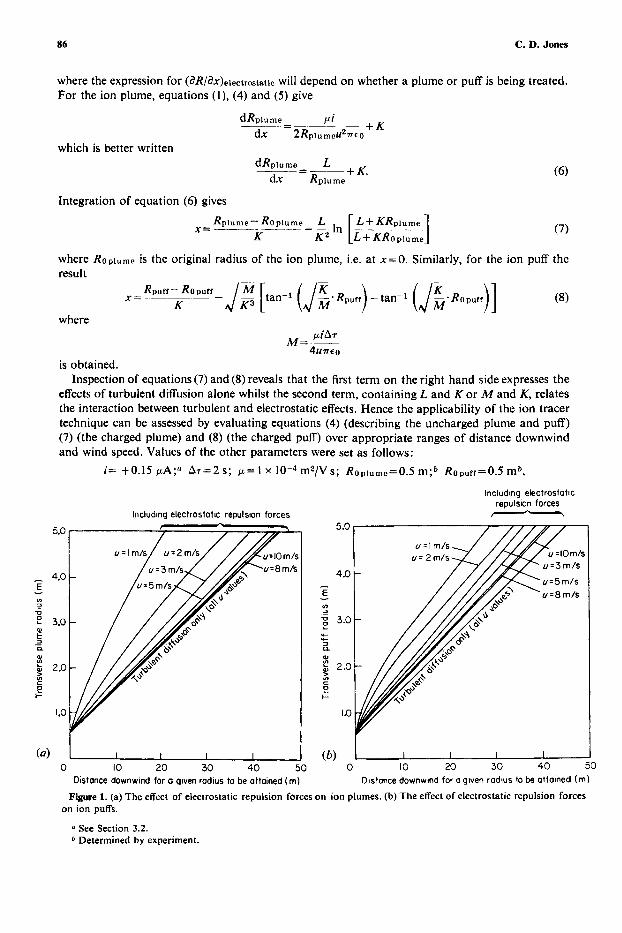
effects of turbulent diffusion alone whilst the second term, containing L and K or M and K, relates the interaction between turbulent and electrostatic effects. Hence the applicability of the ion tracer technique can be assessed by evaluating equations (4) (describing the uncharged plume and puff) (7) (the charged plume) and (8) (the charged puff) over appropriate ranges of distance downwind and wind speed. Values of the other parameters were set as follows:
i= $0.15 PA;^' A7=2 S; p= 1 x m2/Vs; Roplume=0.5 m;* Ropufr=0.5 mb.
Including electrostatic repulsion forces
5.0
4.0 E
3
- VI
U 3.0
- f (1
% 2.0
v)
e l-
0 10 20 30 40 50 Distonce downwind for o given radius to be attained (m)
Including electrostatic repulsion forces -
u = l m / s u = 2 m / s u=lOm/s
u = 3 m / s
u=5m/s - E 4-01 - ' u = 8 m / s
I I I I 0 10 20 30 40 50
Distance downwind for agiven radius to be attained (m)
Figure 1. (a) The effect of electrostatic repulsion forces on ion plumes. (b) The effect of electrostatic repulsion forces on ion puffs.
" See Section 3.2. b Determined by experiment.
Ion concentrations around point sources 87
2.4 I
.- Y) 1.2 -
1.8
E
1.4 .- II. .- Y) 1.2
f 1.0 - a 0.8
Distance downwind (rn)
2.4
r
l? 0.0
(b) Y---l 0.2 0 10 20 30 40 50
Distance downwind (rn)
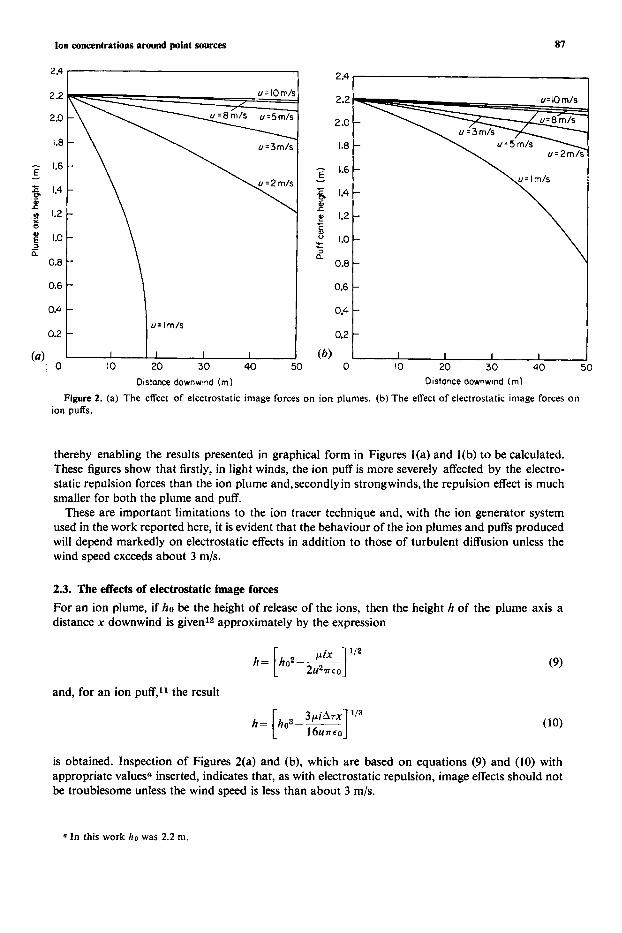
Figure 2. (a) The effect of electrostatic image forces on ion plumes. (b) The effect of electrostatic image forces on ion puffs.
thereby enabling the results presented in graphical form in Figures I(a) and I(b) to be calculated. These figures show that firstly, in light winds, the ion puff is more severely affected by the electro- static repulsion forces than the ion plume and,secondly in strongwinds, the repulsion effect is much smaller for both the plume and puff.
These are important limitations to the ion tracer technique and, with the ion generator system used in the work reported here, it is evident that the behaviour of the ion plumes and puffs produced will depend markedly on electrostatic effects in addition to those of turbulent diffusion unless the wind speed exceeds about 3 m/s.
2.3. The effects of electrostatic image forces For an ion plume, if ho be the height of release of the ions, then the height h of the plume axis a distance x downwind is given12 approximately by the expression
and, for an ion puff,'l the result
is obtained. Inspection of Figures 2(a) and (b), which are based on equations (9) and (10) with appropriate values" inserted, indicates that, as with electrostatic repulsion, image effects should not be troublesome unless the wind speed is less than about 3 m/s.
a In this work h o was 2.2 m.
88
- - - - - - - - - - - - -
-
17 -\ \ \ \ \
C. D. Jones
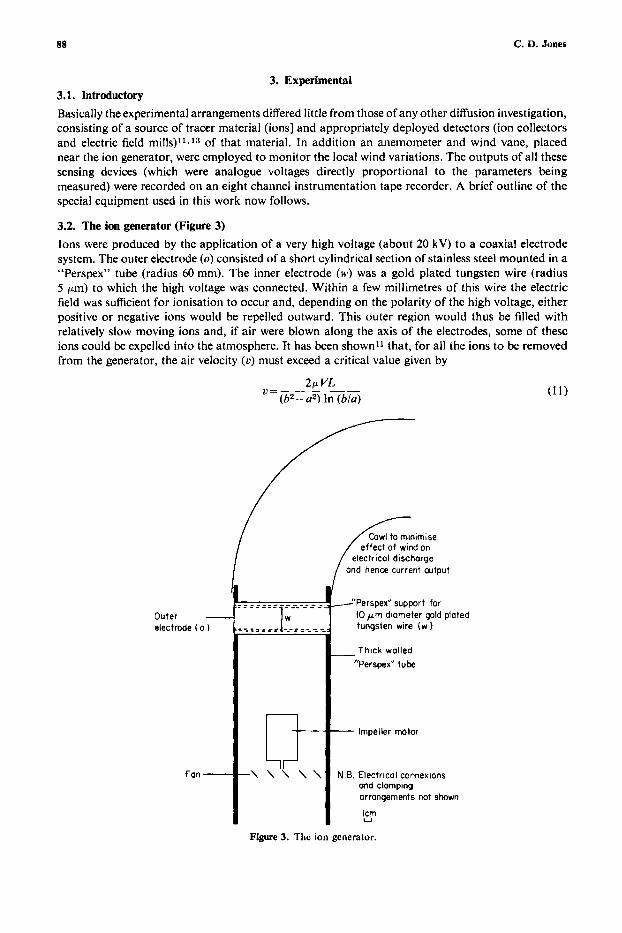
Thick walled "Perspex" tube
Impeller motor
N 8. Electrical connexions and clamping arrangements not shown
ILrn
3. Experimental 3.1. Introductory Basically the experimental arrangements differed little from those of any other diffusion investigation, consisting of a source of tracer material (ions] and appropriately deployed detectors (ion collectors and electric field mills)L1*13 of that material. In addition an anemometer and wind vane, placed near the ion generator, were employed to monitor the local wind variations. The outputs of all these sensing devices (which were analogue voltages directly proportional to the parameters being measured) were recorded on an eight channel instrumentation tape recorder. A brief outline of the special equipment used in this work now follows.
3.2. The ion generator (Figure 3) Ions were produced by the application of a very high voltage (about 20 kV) to a coaxial electrode system. The outer electrode (0) consisted of a short cylindrical section of stainless steel mounted in a "Perspex" tube (radius 60 mm). The inner electrode ( w ) was a gold plated tungsten wire (radius 5 pm) to which the high voltage was connected. Within a few millimetres of this wire the electric field was sufficient for ionisation to occur and, depending on the polarity of the high voltage, either positive or negative ions would be repelled outward. This outer region would thus be filled with relatively slow moving ions and, if air were blown along the axis of the electrodes, some of these ions could be expelled into the atmosphere. It has been shown" that, for all the ions to be removed from the generator, the air velocity ( u ) must exceed a critical value given by
Outer - electrode ( 0 1
Fan -
effect of wind on
Ion concentrations around point sources 89
in which a is the inner electrode radius, b is the outer electrode radius, L is the length of the electrode system and V the applied voltage.
Substitution of appropriate values in the above shows that the critical velocity is about 4 m/s- a figure easily realisable in practice.
The output of the ion generator was determined by collecting the emergent ions using an additional coaxial electrode system. This system, designed to fit directly on to the ion generator outlet cowl, was an appropriately scaled-up version of the ion collector described in the next section. Provided that the bias voltage was sufficient (3 kV minimum), all the ions could be collected and the current observed would be an accurate indication of the ion generator output. Positive ions were used throughout this project and, for these ions, the output was found to be +0.15 PA? 10%.
In the field the ion generator could be operated in two ways. Either it was run continuously, hence creating an ion plume, or alternatively, ions could be released in short bursts-thus producing a series of very short plume segments approximately equivalent to ion puffs. This latter mode of operation was achieved by arranging for the ions to be removed from the ion generator outlet when they were not required. This technique, which involved applying suitably timed 3 kV pulses to the additional coaxial electrodes referred to earlier, was found far more satisfactory than attempting to control the output directly, i.e. by switching the 20 kV supply to the generator itself. Ions were released in 2 s bursts at intervals of between 10 and 30 s depending on the type of experiment being conducted.
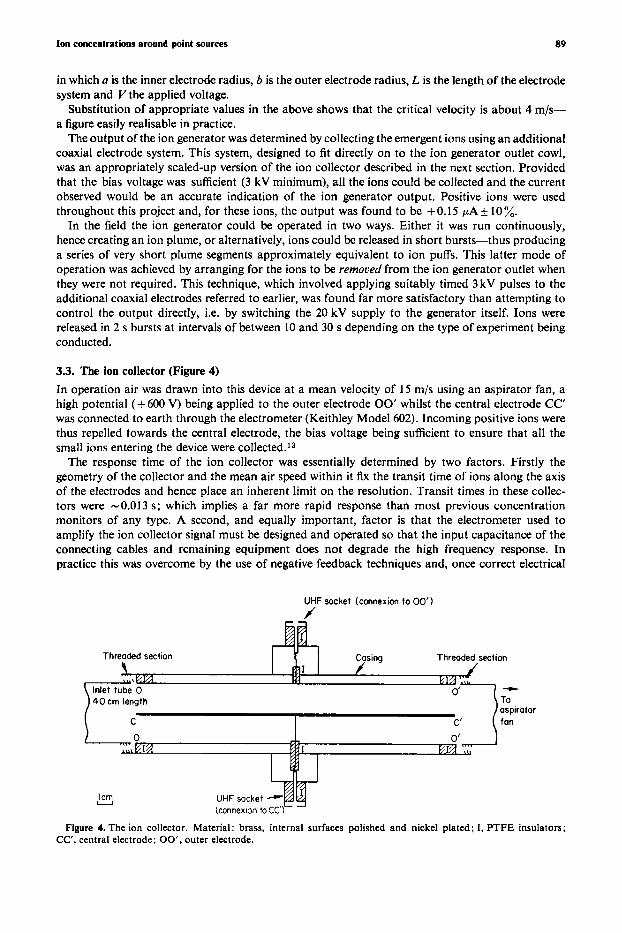
3.3. The ion collector (Figure 4) In operation air was drawn into this device at a mean velocity of 15 m/s using an aspirator fan, a high potential (f 600 V) being applied to the outer electrode 00' whilst the central electrode CC' was connected to earth through the electrometer (Keithley Model 602). Incoming positive ions were thus repelled towards the central electrode, the bias voltage being sufficient to ensure that all the small ions entering the device were collected.~3
The response time of the ion collector was essentially determined by two factors. Firstly the geometry of the collector and the mean air speed within it fh the transit time of ions along the axis of the electrodes and hence place an inherent limit on the resolution. Transit times in these collec- tors were -0.013 s; which implies a far more rapid response than most previous concentration monitors of any type. A second, and equally important, factor is that the electrometer used to amplify the ion collector signal must be designed and operated so that the input capacitance of the connecting cables and remaining equipment does not degrade the high frequency response. In practice this was overcome by the use of negative feedback techniques and, once correct electrical
UHF socket (connexion to 00') J
Threaded section Casing Threaded section
M
40crn lenath
U I crn UHF socket - Figure 4. The ion collector. Material: brass, internal surfaces polished and nickel plated; I , PTFE insulators;
CC', central electrode; 00', outer electrode.
90 C. D. Jones
0
conditions were established, electrometer limitations did not inhibit the inherently rapid ion collector response.
Because any turbulence in the air flow within the collector might produce associated irregular transverse motion of ions, it was mandatory, before ascribing observed current variations to actual ion concentrution variations, to examine the collected ion current under conditions of constant ambient ion concentration. Experiments indicated that the ion current was constant to within
3 % in these conditions: this was regarded as satisfactory. The ion concentration p is given by
p = I/Q C/m3
where I is the observed current (in amperes) and Q is the volume flow rate through the collector (in m3/s). In these collectors Q was 0.019 m3/sk 10%.
4. Results and discussion 4.1. General Experimental work was conducted over an area of short grass within 100 m of large buildings, fences and trees, thus, compared with an unobstructed site, the airflow would have been rather disturbed. However, as the object of this work was to assess the ion tracer technique rather than undertake a definitive investigation into short-range diffusioil the site was satisfactory. In all the experiments ions were released at a height of 2.2 m. Careful observation of the windvane attached to the ion generator support enabled the ion collectors and field mills to be appropriately sited at distances of up to 50 m downwind of the ion generator.
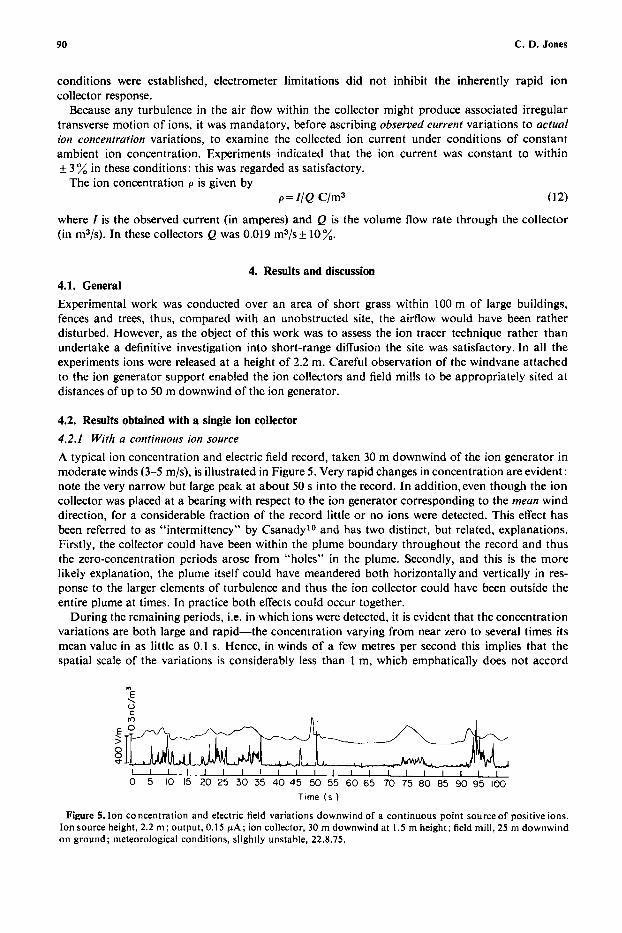
4.2. Results obtained with a single ion collector 4.2.1 With a continuous ion source A typical ion concentration and electric field record, taken 30 m downwind of the ion generator in moderate winds (3-5 m/s), is illustrated in Figure 5 . Very rapid changes in concentration are evident: note the very narrow but large peak at about 50 s into the record. In addition,even though the ion collector was placed at a bearing with respect to the ion generator corresponding to the mean wind direction, for a considerable fraction of the record little or no ions were detected. This effect has been referred to as “intermittency” by Csanadylo and has two distinct, but related, explanations. Firstly, the collector could have been within the plume boundary throughout the record and thus the zero-concentration periods arose from “holes” in the plume. Secondly, and this is the more likely explanation, the plume itself could have meandered both horizontally and vertically in res- ponse to the larger elements of turbulence and thus the ion collector could have been outside the entire plume at times. In practice both effects could occur together.
During the remaining periods, i.e. in which ions were detected, it is evident that the concentration variations are both large and rapid-the concentration varying from near zero to several times its mean value in as little as 0.1 s. Hence, in winds of a few metres per second this implies that the spatial scale of the variations is considerably less than 1 m, which emphatically does not accord
Time ( s )
Figure 5.1011 concentration and electric field variations downwind of a continuous point sourceof positive ions. Ion source height, 2.2 m: output, 0.15 PA; ion collector, 30 m downwind at 1.5 m height; field mill, 25 m downwind 011 ground; meteorological conditions, slightly unstable, 22.8.75.
Ion concentrations around point sources 91
with the much-used concept of a “Gaussian plume”. The observed concentration variations are the result of a variety of contorting and entraining processes, caused by turbulent eddies having scales ranging from a few millimetres to tens of metres, acting on the plume. Consequently Fick’s diffusion theory, with its implicit assumption of molecular scale processes, is inappropriate.
Two factors should be borne in mind when examining the electric field record in Figure 5 : note the magnitude only is shown. Firstly, the observed field is the algebraic sum of the field due to the ion plume and the Earth’s fine weather field.13 In all the experiments this latter field lay between - 100 and - 300 V/m and, since positive ions were used, the electric field below the plume would
3.0
- “E 2.0 \ V - C 0 e c - C W
C
: 1.0 0 -
3.c
- n : 2.0 Y - E 0 e
8 - s 1.0
+
f
W
C
0
n
- Time ( s I
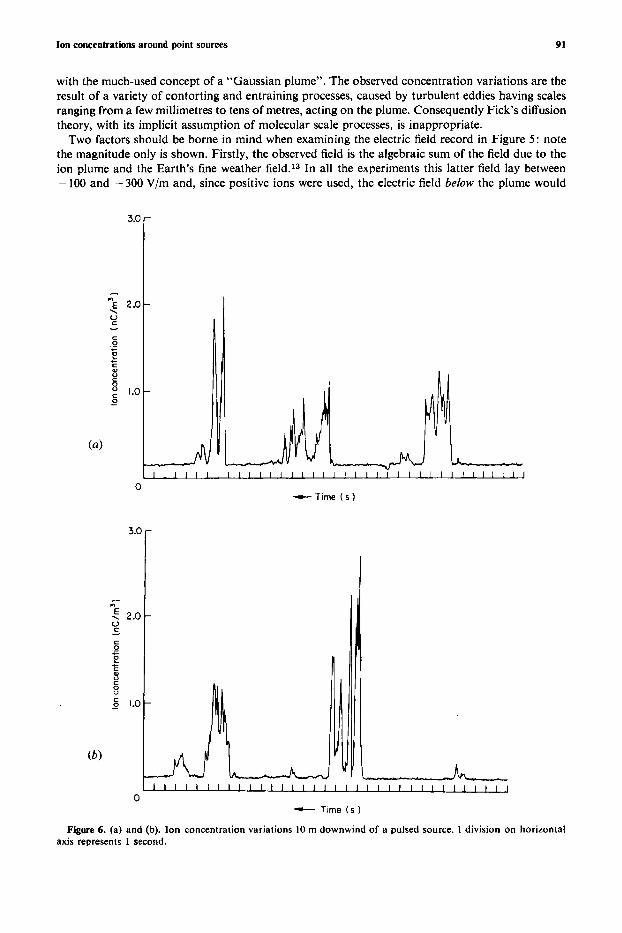
Figure 6. (a) and (b). Ion concentration variations 10 m downwind of a pulsed source. 1 division on horizontal axis represents 1 second.
92 C. D. Jones
have been negative. Hence observed values should be adjusted by having an amount corresponding to the prevailing ambient field subtracted from them (about 300 V/m in the figure). Secondly the field mill responds to the plume in its entirety rather than to discrete parts of it as does the ion collector. Hence the field changes are much slower than the ion concentration variations.12
4.2.2. With a pulsed ion source In this experiment [Figure 6(a) and 6(b)] the ion collector was sited 10 m downwind of the ion generator, which produced a 2 s burst of ions every 10 s. The winds were light, being no more than 2-3 m/s, and the meteorological conditions were unstable. The periodic nature of the concentration fluctuations is evident, as would be expected, but note two additional features. Firstly, ions were detected over intervals considerably longer than 2 s thus implying considerable longitudinal dis- tortion of the puff even at 10 m downwind. Secondly, there is a tendency for the ion concentration to be higher at the puff edges than in the central region0 although the concentration variations are so large and rapid that this assertion could be difficult to substantiate quantitatively. Both effects could have arisen as a result of turbulent processes (e.g. eddies contorting the puff) or electrostatic forces (i.e. longitudinal repulsion and image phenomena).
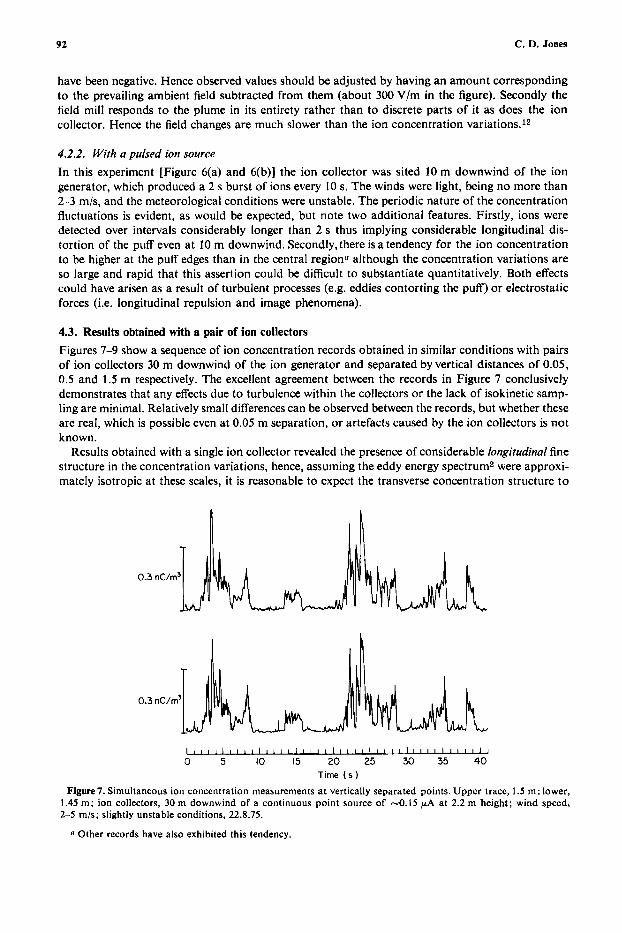
4.3. Results obtained with a pair of ion collectors Figures 7-9 show a sequence of ion concentration records obtained in similar conditions with pairs of ion collectors 30 m downwind of the ion generator and separated by vertical distances of 0.05, 0.5 and 1.5 m respectively. The excellent agreement between the records in Figure 7 conclusively demonstrates that any effects due to turbulence within the collectors or the lack of isokinetic samp- ling are minimal. Relatively small differences can be observed between the records, but whether these are real, which is possible even at 0.05 m separation, or artefacts caused by the ion collectors is not known.
Results obtained with a single ion collector revealed the presence of considerable longitudinal fine structure in the concentration variations, hence, assuming the eddy energy spectrum2 were approxi- mately isotropic at these scales, it is reasonable to expect the transverse concentration structure to
Figure 7. Simultaneous ion concentration measurements at vertically separated points. Upper trace, 1.5 m ; lower, 1.45 m ; ion collectors, 30 m downwind of a continuous point source of -0.15 pA at 2.2 m height; wind speed, 2-5 m/s; slightly unstable conditions, 22.8.75.
Other records have also exhibited this tendency.
Ion concentrations around point sources 93
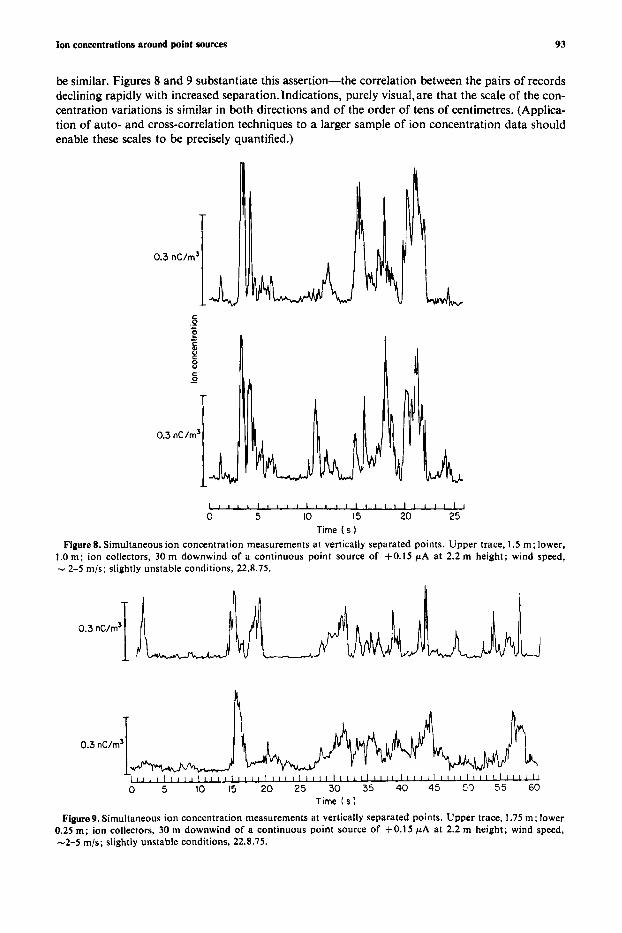
be similar. Figures 8 and 9 substantiate this assertion-the correlation between the pairs of records declining rapidly with increased separation. Indications, purely visua1,are that the scale of the con- centration variations is similar in both directions and of the order of tens of centimetres. (Applica- tion of auto- and cross-correlation techniques to a larger sample of ion concentration data should enable these scales to be precisely quantified.)
I 1 0 1 I I I 1 1 I 1 1 0 1 I I I I I I I I I I I I I 0 5 10 15 20 25
Time ( s 1 Figure 8. Simultaneous ion concentration measurements at vertically separated points. Upper trace, 1.5 m; lower,
1.0 m; ion collectors, 30 rn downwind of a continuous point source of +0.15 pA at 2.2 m height; wind speed, w 2-5 m/s; slightly unstable conditions, 22.8.75.
0.3 n ~ / m ' I
Time ( s 1
Figure 9. Simultaneous ion concentration measurements at vertically separated points. Upper trace, 1.75 m; lower 0.25 m ; ion collectors, 30 m downwind of a continuous point source of +0.15 pA at 2.2 m height; wind speed, -2-5 m/s; slightly unstable conditions, 22.8.75.
94 C. D. Jones
5. Conclusions
The results indicate that an essential feature in short range diffusion is the existence of very sharply defined boundaries in both plumes and puffs. Concentration gradients are substantial even well inside the plume or puff, reflecting that the overall spatial variability of concentration is large.a However, it is reasonable to expect the statistics of the the concentration variations to depend upon factors such as distance from the plume axis or puff centroid, release height, distance downwind, turbulence statistics, terrain type etc. Thus for a sequence of investigations carried out in quasi- stationary conditions, the data obtained could be grouped into suitable statistical ensembles, e.g. on the basis of ion collector-puff centroid distance, prior to analysis.
The existence of instantaneous values of concentration considerably in excess of the average, even for a small fraction of the time, is important particularly in cases where the response to a diffusing species may be non-linear or exhibit threshold effects. In situations where dosage rather than concentration is of concern the ion-tracer technique is also convenient because dosage data can be obtained directly by measuring the electric charge collected over the given period.
Acknowledgement Copyright Q Controller HMSO, London 1976.
Appendix Symbol
b ho h i I L Q ro' r'
ro
rpuf~
a
rpiume
R ~ p ~ u m e
ROpuff
Rp~urne
Rpuff U
U V
AT X
€0
P P
Unit m m m m A A m n?/s m m
m m m m m m m m/s m/s V m S
F/m
Definition Radius of central rod of ion collector Radius of inner cylinder of ion collector. Height of ion plume or puff above ground at release. Height of ion plume or puff above ground at a distance x downwind Current output of ion generator Ion collector current Length of electrode of ion collector Ion collector air flow rate
Used when discussing turbulent diffusion effects
Puff radius at release Puff radius at a distance x downwind Plume or puff radius at release Plume radius at a distance x downwind 1 electrostatic Puff radius at a distance x downwind
Plume radius at a distance x downwind Puff radius at a distance x downwind
Plume radius at release Puff radius at release
Mean wind speed Critical air velocity in ion generator Voltage applied to ion collector electrodes Distance downwind from ion generator Time for which ion generator is producing ions when operating in pulsed mode Permittivity of free space
Used for discussing
J repulsion effects Used when discussing the joint effects of turbulent diffusion and electrostatic repulsion
m2/V s Ionic mobility C/m3 Ion concentration
a In uncharged plumes and puffs concentration variability might be even larger due to the absence of electrostatic repulsion effects.

Ion concentrations around point sources 95
References I . Lumley, J. L. : Panofsky, H. A. The Strurture of Atmospheric Turbulence. Wiley-Interscience, London, 1964,
p. 99. 2. Lumley, J. L.; Tennekes, H. A First Course in Turbulence. MIT Press, London, 1972, p. 197, p. 262. 3. Schmidt, W. Sber. Akad. Wiss. Wien. 1918, 127, 1942. 4. Roberts, 0. F. T. Proc. R . Sac. A . 1923, 104, 640. 5. Sutton, 0. G. Mirromefeorology. McGraw-Hill, London, 1953. p. 105. 6. Pasquill, F. Atmospheric Diffusion. Ellis Horwood, Chichester, 1974, 2nd edn., p. 106. 7. Smith, F. B.; Hay, J. S. Q . Jl. R . Me t . Sac. 1961, 87, 82. 8. Gosline, C. A. Chenr. Engng Prog. 1952, 48, 165. 9. Ramsdell, J. W.: Hinds, W. T. Atmosph. Envir. 1971, 5, 483.
10. Csanady, G. T. Turbulent Diffusion in the Environment. D. Reidel, 1973, p. 222. 1 I . Jones, C. D. Ph.D. Thesis 1974, University of Durham. 12. Jones, C. D.; Hutchinson, W. C. A. J. ntmosph. terr. Phys. 1976, 38, 485. 13. Chalmers, J . A. Atniospherir Elrcfricity. Pergamon Press, London, 1967,2nd Edn., p. 119, p. 143, p. 93, p. 122. 14. Large, M. I.; Pierce, E. T. J. atmosph. terr. Phys. 1957, 10. 251. IS. Ogden, T. L. Ph.D. Thesis 1967, University of Durham. 16. Jones, C. D. Uniform Concentration Models of Diffusing Puffs suitable for use in Evaporation Studies. 1975.
Unpublished MOD Report. 17. Bleaney, B. 1.; Bleaney, B. Electricity and Magnefism, Clarendon Press, Oxford, 1965, 2nd Edn., p. 48.