
Ion Beam Figuring precision optics for...
19
Ion Beam Figuring precision optics for synchrotron radiation sources L. PEVERINI, J. J. FERME & C. du JEU Thales SESO S.A.S., Aix en Provence, 13593, France email: [email protected]
Transcript of Ion Beam Figuring precision optics for...

www.thalesgroup.com
Ion Beam Figuring precision optics for synchrotron radiation sources
L. PEVERINI, J. J. FERME & C. du JEU
Thales SESO S.A.S., Aix en Provence, 13593, France
email: [email protected]

2 / 2 / Ion beam profiling (IBP) approaches for SR optics
IBP schemes for “1D” grazing incidence X-ray mirror optics (Silicon, SiO2 and Zerodur)
L. Peverini et al., Ion beam profiling of aspherical X-ray mirrors, NIM A 616 (2010) 115–118 (technology)
V.I.T.A. de Rooij-Lohmann et al., Roughness evolution of Si surfaces upon Ar ion erosion , Applied Surface Science 256 (2010) 5011–5014 (in-situ)
Off-set scan
• Sample/spot moving
• Slow process
• High resolution
Single Blade Scan
• Sample/slit moving
• Slow process
• Interesting for coating
Gap Scan
• Sample Stationary
• very fast
• Requires Broad Beams
v=v2(x)
x
v=v1(x)
x
d(x)
v=v2(x)
x
v=v1(x)
x
d(x)
x
v=v(x)
d(x)
x
v=v(x)
d(x)
v= )
d(x)
x
v=v(x)
d(x)
x
v=v(x)
d(x)
v= )
d(x)v=v(x)
x
d(x)
x
d(x)
v=v(x)
x
d(x)
x
d(x)Removal of material by
sputtering
ion beam
Tight slope error specification along the longitudinal direction (< 500 nrad)
Non-contact polishing method possibility to use in-situ metrology
3 / 3 / Fabrication and testing
miroir Direction scan X
Source IBF
Ion beam
TOP view
X
Z
Y
L = +/- 1700 mm
UHV 10-6 mbar 10-7 mbar
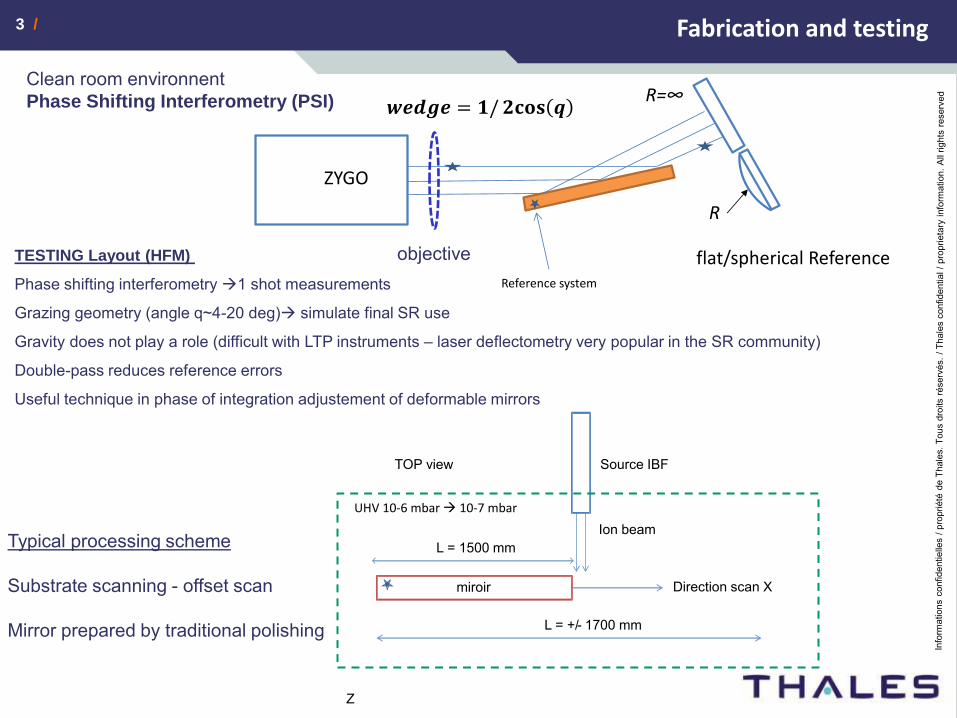
L = 1500 mmTypical processing scheme Substrate scanning - offset scan Mirror prepared by traditional polishing
Reference system
flat/spherical Reference
ZYGO
R
R=∞
TESTING Layout (HFM)
Phase shifting interferometry 1 shot measurements
Grazing geometry (angle q~4-20 deg) simulate final SR use
Gravity does not play a role (difficult with LTP instruments – laser deflectometry very popular in the SR community)
Double-pass reduces reference errors
Useful technique in phase of integration adjustement of deformable mirrors
Clean room environnent Phase Shifting Interferometry (PSI)
objective
4 / 4 / IBP convergence
0.4- 0.2- 0 0.2 0.450-
0
50
100
150
200
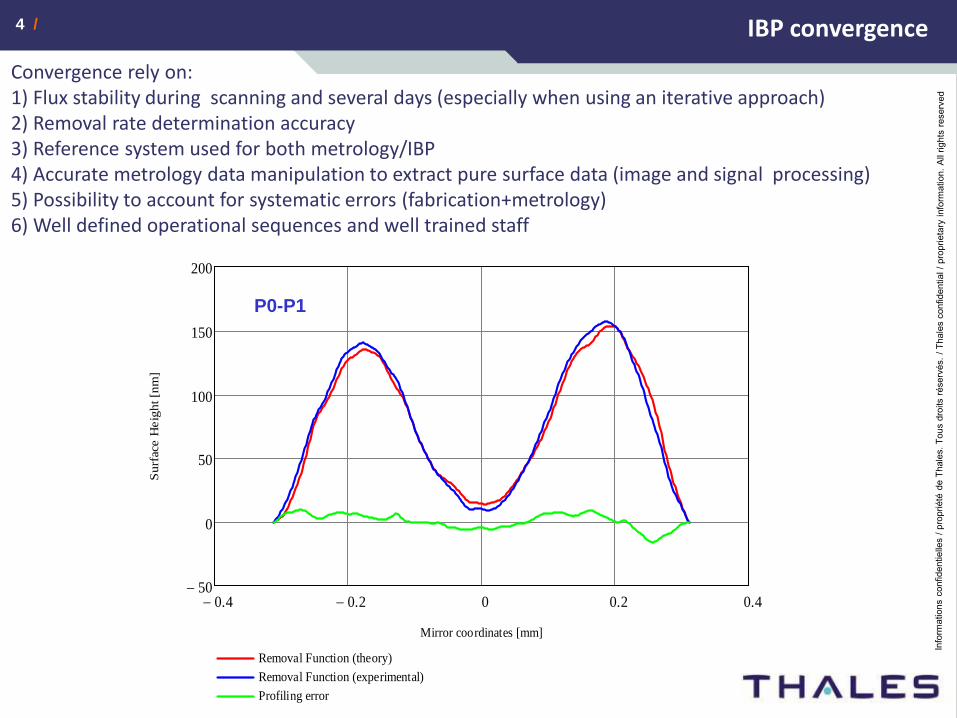
Removal Function (theory)
Removal Function (experimental)
Profiling error
Mirror coordinates [mm]
Surf
ace
Heig
ht
[nm
]
Convergence rely on: 1) Flux stability during scanning and several days (especially when using an iterative approach) 2) Removal rate determination accuracy 3) Reference system used for both metrology/IBP 4) Accurate metrology data manipulation to extract pure surface data (image and signal processing) 5) Possibility to account for systematic errors (fabrication+metrology) 6) Well defined operational sequences and well trained staff
P0-P1
5 / 5 / µ-Roughness and IBP
-3-3.5-4-4.5-5-5.5-6
7
6
5
4
3
2
1
0
-1
k[log({1/nm})]
PS
D[l
og
(nm
4)]
-3-3.5-4-4.5-5-5.5-6
8
7
6
5
4
3
2
1
0
-1
k[log({1/nm})]
PS
D[l
og
(nm
4)]
100µm 100µm
2.69
0.00
3.62
0.00
100µm 100µm
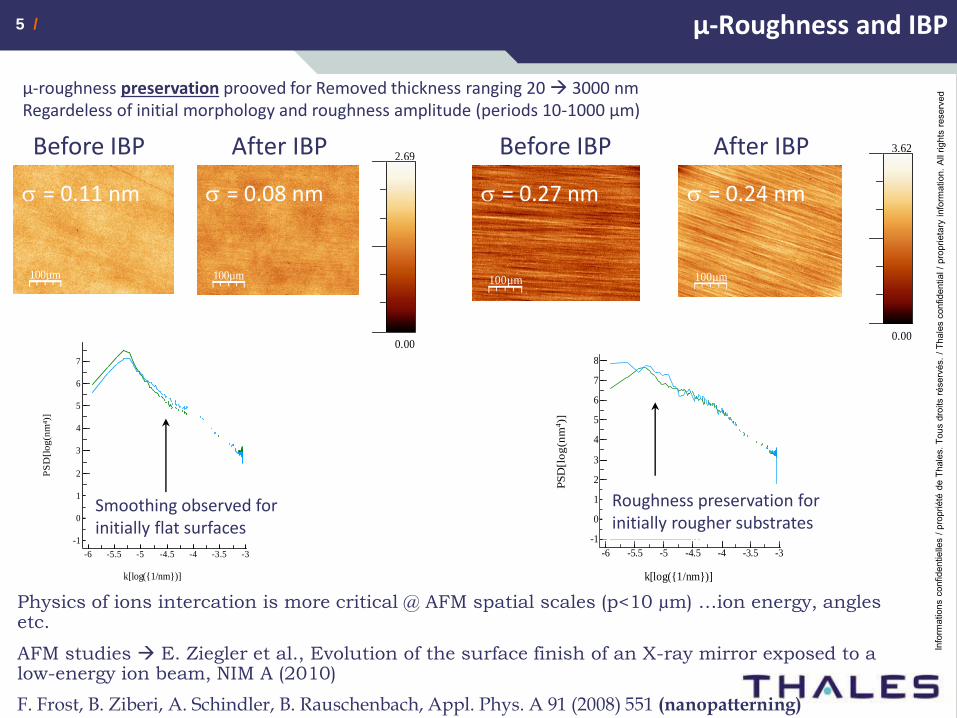
s = 0.11 nm s = 0.08 nm s = 0.27 nm s = 0.24 nm
µ-roughness preservation prooved for Removed thickness ranging 20 3000 nm Regardeless of initial morphology and roughness amplitude (periods 10-1000 µm)
After IBP After IBP Before IBP Before IBP
Smoothing observed for initially flat surfaces
Roughness preservation for initially rougher substrates
Physics of ions intercation is more critical @ AFM spatial scales (p<10 µm) …ion energy, angles etc.
AFM studies E. Ziegler et al., Evolution of the surface finish of an X-ray mirror exposed to a low-energy ion beam, NIM A (2010)
F. Frost, B. Ziberi, A. Schindler, B. Rauschenbach, Appl. Phys. A 91 (2008) 551 (nanopatterning)
6 / 6 / PSI data traitement for deterministic polishing
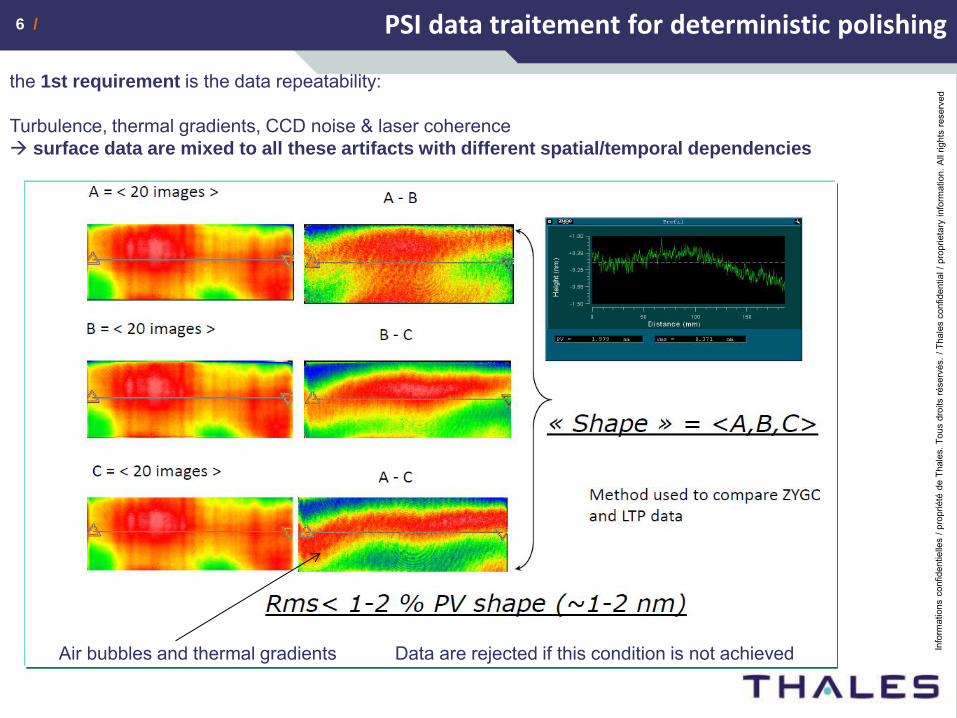
the 1st requirement is the data repeatability: Turbulence, thermal gradients, CCD noise & laser coherence surface data are mixed to all these artifacts with different spatial/temporal dependencies
Air bubbles and thermal gradients Data are rejected if this condition is not achieved
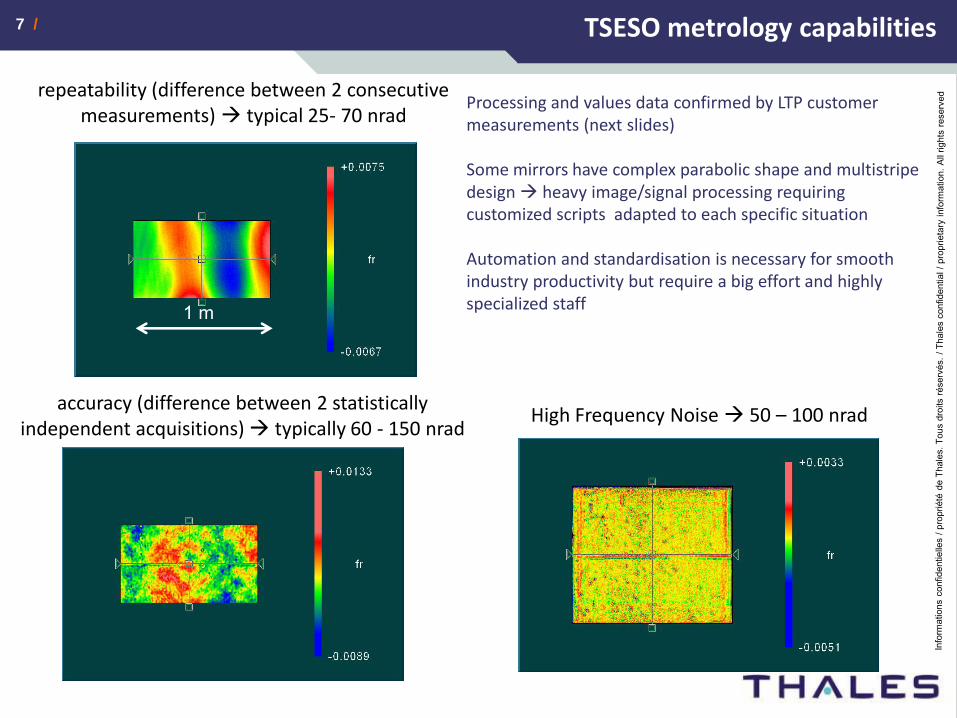
7 / 7 / TSESO metrology capabilities
accuracy (difference between 2 statistically independent acquisitions) typically 60 - 150 nrad
High Frequency Noise 50 – 100 nrad
repeatability (difference between 2 consecutive measurements) typical 25- 70 nrad
Processing and values data confirmed by LTP customer measurements (next slides) Some mirrors have complex parabolic shape and multistripe design heavy image/signal processing requiring customized scripts adapted to each specific situation Automation and standardisation is necessary for smooth industry productivity but require a big effort and highly specialized staff 1 m
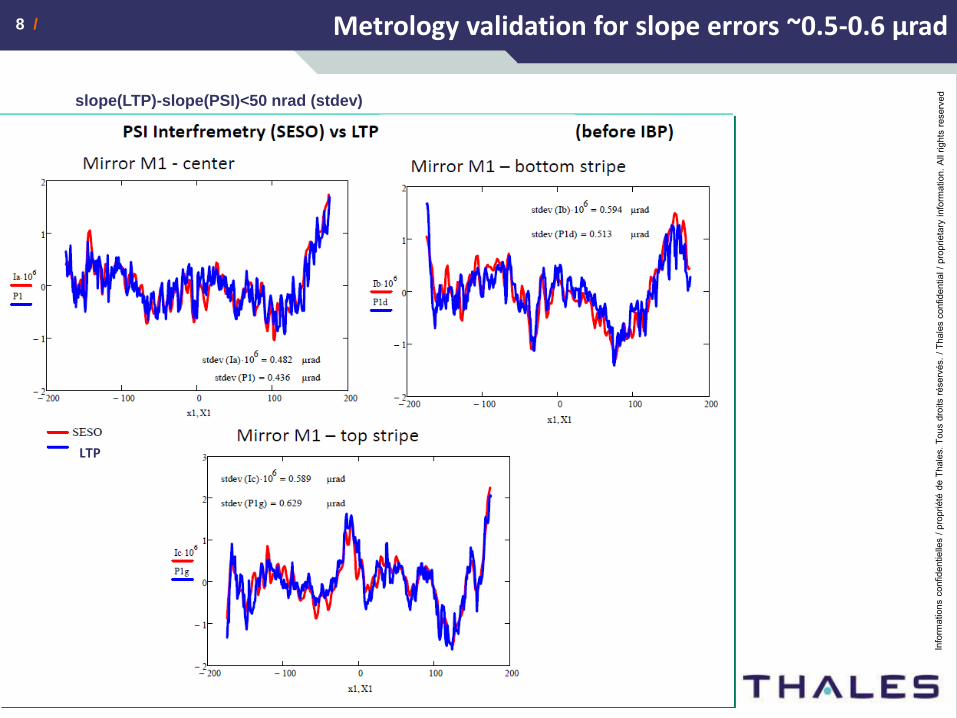
8 / 8 / Metrology validation for slope errors ~0.5-0.6 µrad
LTP
slope(LTP)-slope(PSI)<50 nrad (stdev)

9 / 9 / Metrology validation PSI vs LTP for slope error < 0.3 µrad
High Frequency introduces a factor ~2 in the slope error estimation. 1)Correlated signal in LTP data (partial laser cohérence) 2)Shape obtained from LTP is smoothened naturally by the integral operator 3)PSI need to be filtered for slope error evaluation therefore part of the surface signal might be suppressed
PSI/LTP data treatement @ high frequency…
Excellent shape agreement LTP LTP
LTP
stdev(LTP-PSI)~0.5 nm !!!
Before final correction

10 / 10 / HF noise (speckles)
a) Speckles are independent on the mirror size and the surface microtopography (in a morphological sense) b) The pattern observed is characterized by a « round » shapes regardeless of the surface morphology and PSI
geometry c) The speckle pattern is static d) The recording method can enhance this effect (especially using large statistical sampling necessary to average
environmental artifacts) e) 1D LTP data from 2 different customers presents very similar features
« Cleaned » speckle pattern obtained using a lateral shift dx>x (speckles corr. length) and low
frequency FFT filtering
Refs R. Cerbino, L. Peverini, M. A. C. Potenza, A. Robert, P. Bo¨secke, and M. Giglio, Nature Phys. 4, 238 (2008) S.Berujon, E. Ziegler, R. Cerbino, and L. Peverini1,*PRL 108, 158102 (2012)
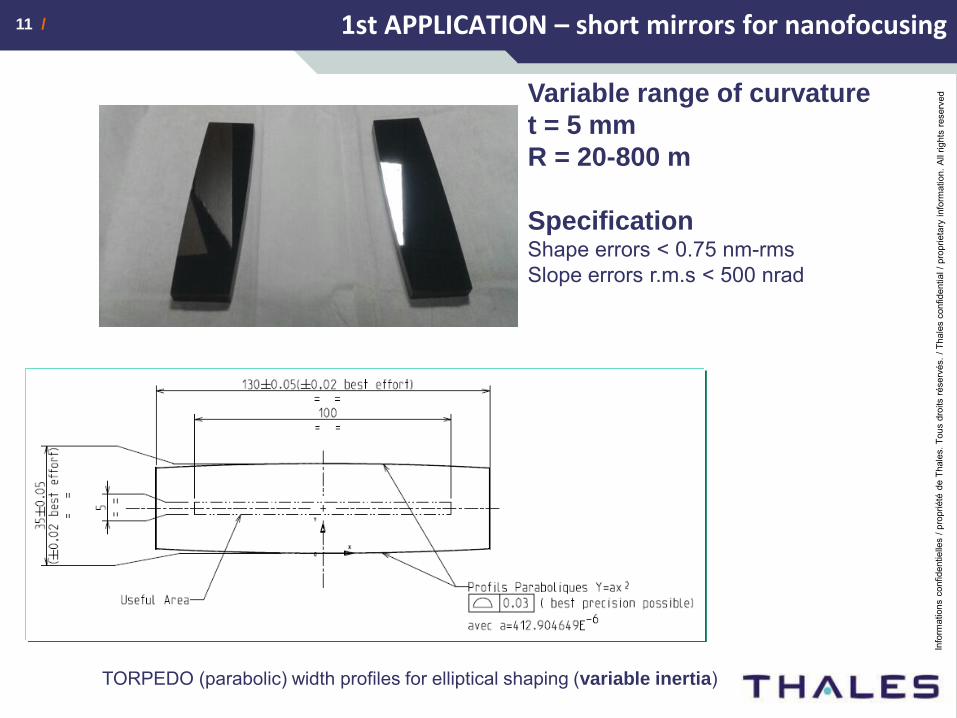
11 / 11 / 1st APPLICATION – short mirrors for nanofocusing
Variable range of curvature
t = 5 mm
R = 20-800 m
Specification Shape errors < 0.75 nm-rms Slope errors r.m.s < 500 nrad
TORPEDO (parabolic) width profiles for elliptical shaping (variable inertia)

12 / 12 / Mirror length L=130 mm
50- 40- 30- 20- 10- 0 10 20 30 40 5050-
40-
30-
20-
10-
0
10
before IBP (stripe 1)
after IBP (stripe 1)
IBF corrections - shape errors
mirror coordinate [mm]
surf
ace
heig
ht
[nm
]
PTVafter2 46.891 nm
PTVbefore2 2.54 nm
50- 40- 30- 20- 10- 0 10 20 30 40 506-
4-
2-
0
2
4
6
Slope
Sl 1 106
Sl 2 106
x1 1000 x2 1000 x3 1000 x4 1000
Before correction
stdev S l2( ) 106
1.791 µrad
After correction
stdev S l1( ) 106
0.298 µrad
PTV before = 46.891 nm PTV after = 2.54 nm Shape r.m.s = 0.5 nm (specification 0.75 nm)
slope error r.m.s (before IBP)= 1800 nrad slope error (after IBP)= 298 nrad
High accuracy data (near-normal incidence PSI) Spatial resolution 0.24 mm (LTP FWHM~ 2.5 mm spot)
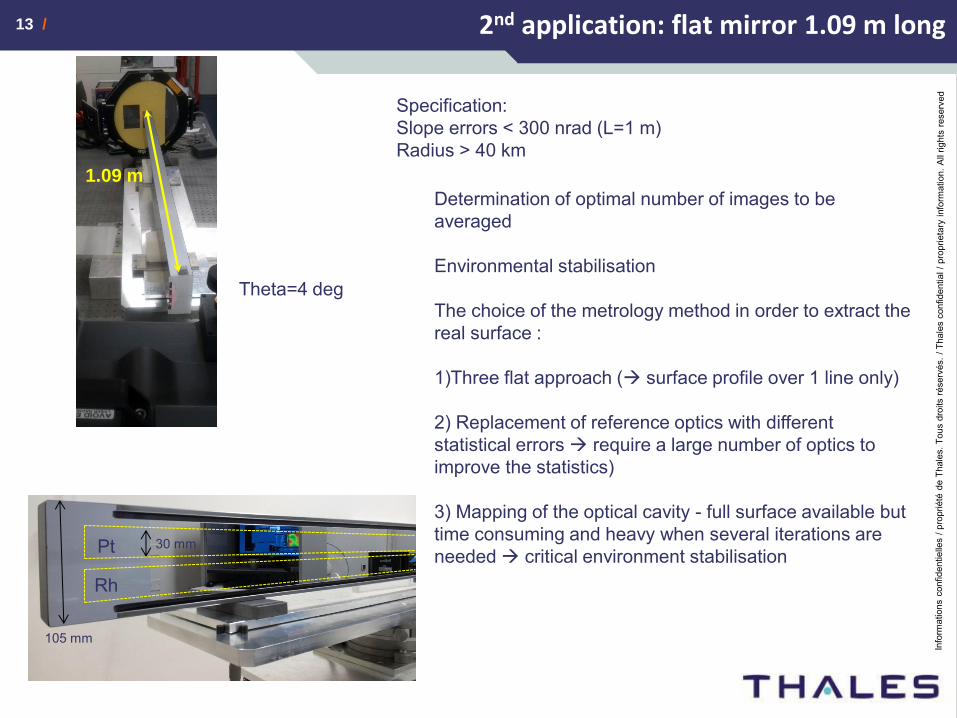
13 / 13 / 2nd application: flat mirror 1.09 m long
1.09 m
Pt
Rh
105 mm
30 mm
Determination of optimal number of images to be averaged Environmental stabilisation The choice of the metrology method in order to extract the real surface : 1)Three flat approach ( surface profile over 1 line only)
2) Replacement of reference optics with different statistical errors require a large number of optics to improve the statistics)
3) Mapping of the optical cavity - full surface available but time consuming and heavy when several iterations are needed critical environment stabilisation
Specification: Slope errors < 300 nrad (L=1 m) Radius > 40 km
Theta=4 deg
14 / 14 / Statistical methods
500- 400- 300- 200- 100- 0 100 200 300 400 50040-
20-
0
20
40
Bande - T OP - C0 - P1-P2-P3
Ias 109
Ibs 109
Ics 109
Ias Ibs Ics
310
9
IM 109
x1 1000
500- 400- 300- 200- 100- 0 100 200 300 400 50040-
20-
0
20
40
Bande - T OP - C+ - P1-P2-P3
Ids 109
Ie s 109
Ifs 109
Ids Ie s Ifs
310
9
x1 1000
500- 400- 300- 200- 100- 0 100 200 300 400 5001-
0
1
2
Slope
Sl 1 106
Sl 2 106
Sl 3 106
x1 1000
500- 400- 300- 200- 100- 0 100 200 300 400 5001-
0.5-
0
0.5
1
1.5
Slope
Sl 4 106
Sl 5 106
Sl 6 106
x1 1000
stdev S l1( ) 106
0.372 stdev S l2( ) 106
0.283 stdev S l3( ) 106
0.288stdev S l4( ) 10
6 0.321 stdev S l5( ) 10
6 0.301 stdev S l6( ) 10
6 0.307
500- 400- 300- 200- 100- 0 100 200 300 400 50040-
20-
0
20
40
Bande - T OP C- ; P1-P2-P3
Igs 109
Ih s 109
Ii s 109
Igs Ih s Ii s
310
9
x1 1000
500- 400- 300- 200- 100- 0 100 200 300 400 5001-
0
1
2
Slope
Sl 7 106
Sl 8 106
Sl 9 106
x1 1000
stdev S l4( ) 106
0.321 stdev S l5( ) 106
0.301 stdev S l6( ) 106
0.307
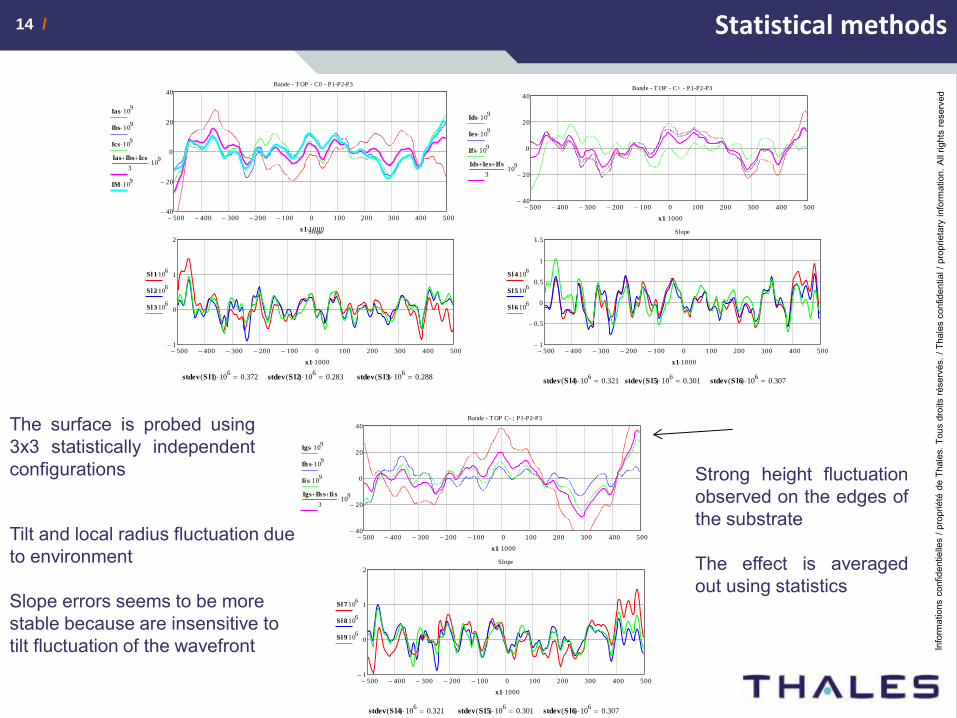
Tilt and local radius fluctuation due to environment Slope errors seems to be more stable because are insensitive to tilt fluctuation of the wavefront
Strong height fluctuation observed on the edges of the substrate The effect is averaged out using statistics
The surface is probed using 3x3 statistically independent configurations

15 / 15 / Analysis on the usefull lenght 1m
500- 400- 300- 200- 100- 0 100 200 300 400 50050-
0
50
100
150
before IBP (stripe 1)
after IBP (stripe 1)
before (s tripe 2)
after (stripe 2)
IBF corrections - shape errors
mirror coordinate [mm]
surf
ace
heig
ht
[nm
]
PTVbefore 93.033 nm
PTVafter 21.135 nm
PTVbefore2 75.92 nm
PTVafter2 24.597 nm
500- 400- 300- 200- 100- 0 100 200 300 400 5002-
0
2
4
Slope
Sl 1 106
Sl 2 106
Sl 3 106
2
Sl 4 106
2
x1 1000 x2 1000 x3 1000 x4 1000
Before correction
stdev S l1( ) 106
0.5 µrad
stdev S l3( ) 106
0.544 µrad
After correction
stdev S l2( ) 106
0.192 µrad
stdev S l4( ) 106
0.295 µrad
SLOPES
Profiles
Stripe 1
Stripe 2
Stripe 1
Stripe 2

16 / 16 / Sliding Windows – mirror length 0.1 m1 m
0.45- 0.44- 0.43- 0.42-2- 10
7-
1- 107-
0
1 107-
2 107-
Dg10
x1g10
0 166.667 333.333 500 666.667 833.333 1 103
0
1
2
3
4
5
6
7
8
9
10
sigma rms (sliding windows W=20 mm)
sigma PV (sliding windows W=20 mm)
1 nm
4 nm
Sliding windows -Mirror length=1 m
window position [mm]
hei
ght
stati
stiq
ue
rm
s [n
m]
0 166.667 333.333 500 666.667 833.333 1 103
0
0.16
0.32
0.48
0.64
0.8
0.96
1.12
1.28
1.44
1.6
slope rms (sliding windows W=20 mm)
slope PV (s liding windows W=20 mm)
Sliding windows
window position [mm]
slo
pe
stat
isti
qu
e [µ
rad
]
0.05- 0.04- 0.03- 0.02-1- 10
6-
5- 107-
0
5 107-
1 106-
Dg10
x1g10
0 13.333 26.667 40 53.333 66.667 800
0.5
1
1.5
2
2.5
3
3.5
4
4.5
5
sigma rms (sliding windows W=20 mm)
sigma PV (sliding windows W=20 mm)
4 nm
0.35 nm
Sliding windows -Mirror length=100 mm
window position [mm]
hei
gh
t st
ati
stiq
ue
rm
s [n
m]
0 13.333 26.667 40 53.333 66.667 800
0.18
0.36
0.54
0.72
0.9
1.08
1.26
1.44
1.62
1.8
slope rms (sliding windows W=20 mm)
slope PV (s liding windows W=20 mm)
Sliding windows
window position [mm]
slo
pe
stat
isti
qu
e [µ
rad
]
Mirror length = 1 m Mirror length = 0.1 m
PTV ~ 4 nm
Stdev ~ 1 nm
Sliding windows of 20 mm moved @ each pixel
PTV ~ 1.5 nm
Stdev ~ 0.35 nm
Scanning length

17 / 17 / Sliding Windows & shape error scaling
Shape error scaling; L=1 m Shape error scaling; L=0.1 m
0 20 40 60 80 1000
1
2
3
windows size [mm]
surf
ace
stat
isti
qu
e [n
m]
PTV
sigma
W
0 20 40 60 80 1003
3.5
4
4.5
5
5.5
windows size [mm]
surf
ace
stat
isti
qu
e [n
m]
PTV
sigma
W
0 200 400 600 800 1 103
0
5
10
15
20
windows size [mm]
surf
ace
stat
isti
qu
e [n
m]
PTV
sigma
W
0 200 400 600 800 1 103
3
4
5
6
windows size [mm]
surf
ace
stat
isti
qu
e [n
m]
PTV
sigma
W
<all windows>
<PTV/stdev>
<all windows>
<PTV/stdev>
The ratio PTV/stdev scale linearly regardeless of the mirror size
deviation connected with sampling

18 / 18 / Conclusion
a) The use of ion beam is prooved to preserve roughness and improve the surface
errors in a deterministic fashion (slope errors <300 nrad, L=1 m)
b) ion beam technology is today routinely used in our SR mirror production lines
c) High frequency errors (speckles) need to estabilish the possibility to suppress
this signal from PSI and LTP data to overcome the limit of PSI metrology
d) Ultimate figuring performances are today metrology limited
e) IBP requires tight operational procedures and well trained staff
f) Traditional and deterministic ion polishing remain complementary techniques
that needs to be matched
g) Increase of difficulty between short and long mirrors is mainly linked to surface metrology

19 / 19 / Acknowledgements
Agence Nationale de la Recherche (ANR) and the AXOC team for support and the R&D on nanofocusing optics
The metrology labs in BESSY, SOLEIL & ESRF for useful discussion and sharing
of LTP data
R. Cerbino (University of Milan) for usefull discussion on speckles metrology and image processing
The X-ray team and staff Thales SESO
Eric Ziegler (ESRF) and Igor Kozhevnikov (Institute of Crystallography, Russia)

![Gaussian Beam Optics [Hecht Ch. pages 594 596 … Beam Optics [Hecht Ch. 13.1 pages 594596 Notes from Melles Griot and Newport] Readings: For details on the theory of Gaussian beam](https://static.fdocuments.us/doc/165x107/5ab6c9d67f8b9a2f438e0d48/gaussian-beam-optics-hecht-ch-pages-594-596-beam-optics-hecht-ch-131-pages.jpg)