Invitations to Mathematics -...
66
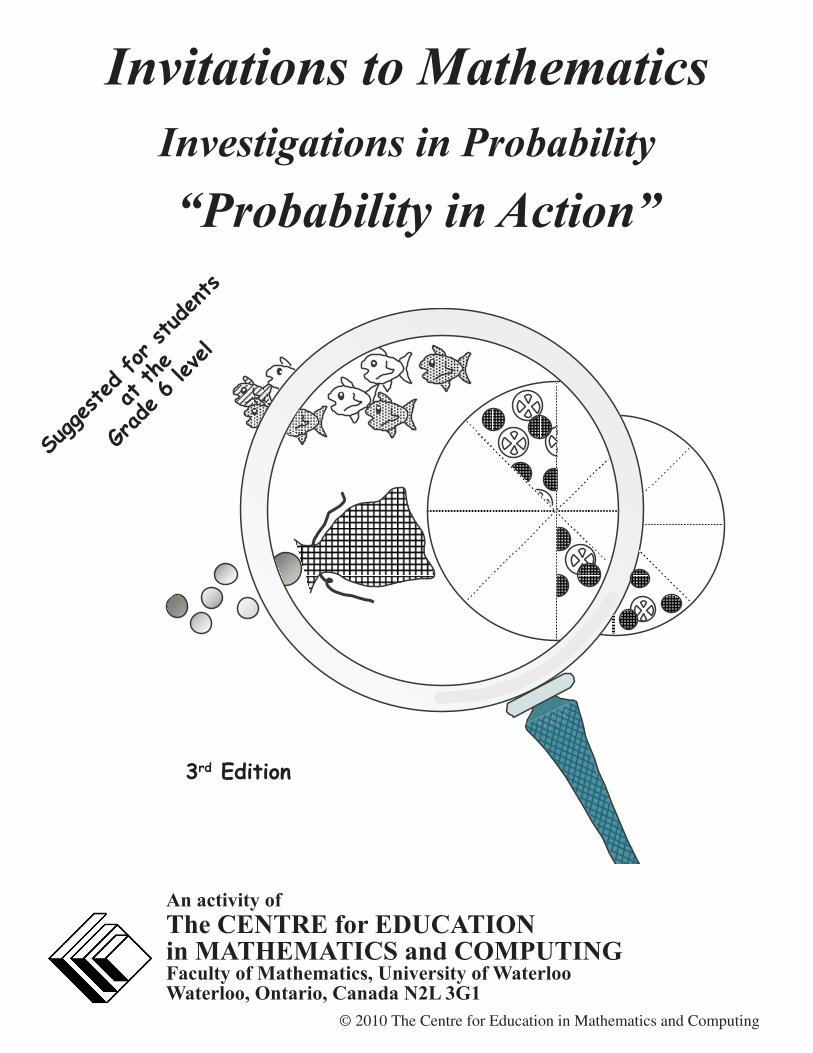
Invitations to Mathematics Investigations in Probability “Probability in Action” An activity of The CENTRE for EDUCATION in MATHEMATICS and COMPUTING Faculty of Mathematics, University of Waterloo Waterloo, Ontario, Canada N2L 3G1 Suggested for students at the Grade 6 level 3 rd Edition © 2010 The Centre for Education in Mathematics and Computing
Transcript of Invitations to Mathematics -...
Invitations to MathematicsInvestigations in Probability
“Probability in Action”
An activity ofThe CENTRE for EDUCATIONin MATHEMATICS and COMPUTINGFaculty of Mathematics, University of WaterlooWaterloo, Ontario, Canada N2L 3G1
Suggested for s
tudents
at th
e
Grade 6 lev
el
3rd Edition
© 2010 The Centre for Education in Mathematics and Computing
Copyright © 1999, 2010The Centre for Education in Mathematics and ComputingFaculty of MathematicsUniversity of WaterlooWaterloo, Ontario Canada N2L 3G1
Limited reproduction permission:
1. The Centre for Education in Mathematics and Computing grants permission to indi-vidual teachers to reproduce the Black Line Masters as needed for use with their own students.
2. The Centre for Education in Mathematics and Computing grants permission to an educator providing a professional development workshop to make up to 35 copies of the Black Line Masters for any individual activity for use once with one group.
Reproduction of text pages for an entire school or school district or for commercial use is prohibited.
i
Investigations in Probability Grade 6: Probability in Action
Preface
Preface The Centre for Education in Mathematics and Computing at the University of Waterloo is dedicated to the development of materials and workshops that promote effective learning and teaching of mathematics. This unit is part of a project designed to assist teachers of Grades 4, 5, and 6 in stimulating interest, competence, and pleasure in mathematics, among their students. While the activities are appropriate for either individual or group work, the latter is a particular focus of this effort. Students will be engaged in collaborative activities which will allow them to construct their own meanings and understanding. This emphasis, plus the extensions and related activities included with individual activities/projects, provide ample scope for all students’ interests and ability levels. Related “Family Activities” can be used to involve the students’ parents/care givers.
Each unit consists of a sequence of activities intended to occupy about one week of daily classes; however, teachers may choose to take extra time to explore the activities and extensions in more depth. The units have been designed for specific grades, but need not be so restricted. Activities are related to the Ontario Curriculum but are easily adaptable to other locales.
“Investigations in Probability” is comprised of activities which introduce students to basic concepts of probability, techniques used to determine probability, and applications of probability. Everyday encounters with probability in weather forecasting, interpretation of polls, and commercials for various products and lotteries make it imperative that students acquire some basic knowledge of probability if they are to be able to interpret and evaluate such statements, and hence make well-informed decisions.
ii
Grade 6: Probability in Action Investigations in Probability
Acknowledgements
AcknowledgementsContributing Teachers Nancy Dykstra (Waterloo County Board of Education) Kelly Lantink (Waterloo County Board of Education) Ron Sauer (Waterloo County Board of Education - retired) Mary Thompson (University of Waterloo)
Authors/Co-editors Bev Marshman (University of Waterloo) Lorna Morrow (Mathematics Consultant)
We wish to acknowledge the support of the Centre for Education in Mathematics and Computing, and in particular the efforts of Ron Scoins, Gord Nichols, and Carolyn Jackson. A special thank you goes to Bonnie Findlay for prompt, accurate type-setting and creative diagrams.
iii
Investigations in Probability Grade 6: Probability in Action
Contents
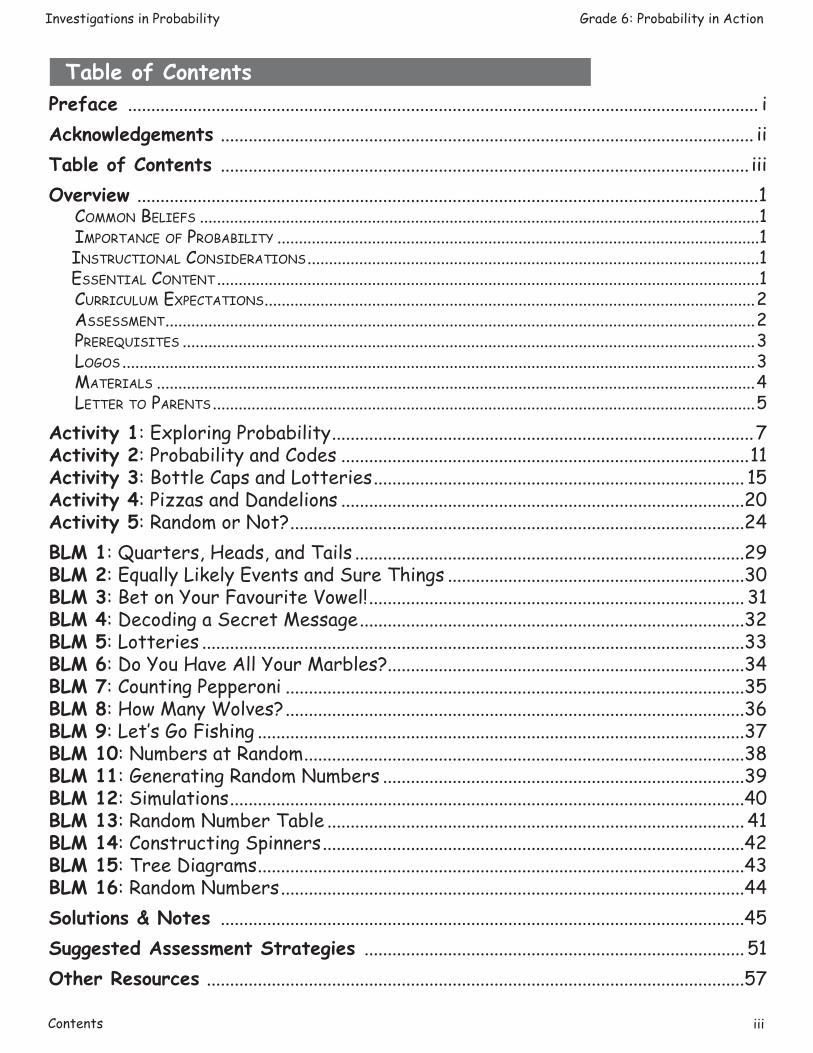
Preface ........................................................................................................................................ iAcknowledgements ................................................................................................................... iiTable of Contents .................................................................................................................. iiiOverview ......................................................................................................................................1 Common Beliefs ..................................................................................................................................1 importanCe of proBaBility ................................................................................................................1
instruCtional Considerations .........................................................................................................1 essential Content ..............................................................................................................................1
CurriCulum expeCtations ..................................................................................................................2 assessment .........................................................................................................................................2 prerequisites .....................................................................................................................................3 logos ...................................................................................................................................................3 materials ...........................................................................................................................................4 letter to parents ..............................................................................................................................5Activity 1: Exploring Probability ...........................................................................................7Activity 2: Probability and Codes ........................................................................................11Activity 3: Bottle Caps and Lotteries ................................................................................ 15Activity 4: Pizzas and Dandelions .......................................................................................20Activity 5: Random or Not? ..................................................................................................24BLM 1: Quarters, Heads, and Tails ....................................................................................29BLM 2: Equally Likely Events and Sure Things ................................................................30BLM 3: Bet on Your Favourite Vowel! ................................................................................. 31BLM 4: Decoding a Secret Message ...................................................................................32BLM 5: Lotteries .....................................................................................................................33BLM 6: Do You Have All Your Marbles?.............................................................................34BLM 7: Counting Pepperoni ...................................................................................................35BLM 8: How Many Wolves? ...................................................................................................36BLM 9: Let’s Go Fishing .........................................................................................................37BLM 10: Numbers at Random ...............................................................................................38BLM 11: Generating Random Numbers ..............................................................................39BLM 12: Simulations ...............................................................................................................40BLM 13: Random Number Table .......................................................................................... 41BLM 14: Constructing Spinners ...........................................................................................42BLM 15: Tree Diagrams .........................................................................................................43BLM 16: Random Numbers ....................................................................................................44Solutions & Notes .................................................................................................................45Suggested Assessment Strategies .................................................................................. 51Other Resources ....................................................................................................................57
Table of Contents

Overview Page 1
Investigations in Probability Grade 6: Probability in Action
Overview
�����
Common BeliefsThe activities in this booklet have been developed within the context of certain values and beliefs about mathematics generally, and about probability specifically. Some of these are described below.
ImportanCe of ProBaBilityEven a cursory glance at newspapers shows the extent to which the language of probability has become important. Individuals need a knowledge of probability to function in our society; consumer reports, cost of living indices, surveys, and samples are a part of everyday life. Nearly all endeavours in the working world require making decisions in uncertain conditions. The goal is to help students develop the critical thinking skills needed to reach sound conclusions based on appropriate data samples.
InstruCtional Considerations“Classroom experiences should build on students’ natural abilities to solve problems in everyday situations of uncertainty”
NCTM
For example, students learn to play games, and quickly develop a notion of “fairness” which is related to equally likely events. These and other activities develop essential skills for understanding probability — methods of organized counting, comparing results of experiments to theoretical probabilities, using the language of probability correctly — in the context of activities such as dice and spinner games which may be fair or unfair, decoding messages, designing a lottery, and sampling to determine population size.
essential ContentThe activities in this unit explore probability on a continuum from zero to one, relate it to experimental frequencies, and examine how it is used in sampling and lotteries. In addition, there are Extensions in Mathematics, Cross-Curricular Activities and Family Activities. These may be used prior to or during the activity as well as following the activity. They are intended to suggest topics for extending the activity, assisting integration with other subjects, and involving the family in the learning process.During this unit the student will:• identify probabilities of ‘0’ and ‘1’;• determine probabilities from simple experiments;• explore letter frequencies in different languages;• investigate the nature of lotteries;• use sampling and marking to determine the size of a population;• use random numbers to simulate experiments;• use the language of probability correctly;• justify opinions with coherent arguments;• collaborate with other members of a group.
Page 2 Overview
Grade 6: Probability in Action Investigations in Probability
Overview
�����
CurriCulum expeCtationsThe material in this unit is directly related to Ontario curriculum expectations for Mathematics outlined below. By the end of Grade 6, students will:• connect the possible events and the probability of a particular event;• compare experimental results with predicted theoretical results;• use tree diagrams to record the results of systematic counting;• show an understanding of probability in making relevant decisions;• use a knowledge of probability to pose and solve problems.
assessmentAssessment may be described as the process of gathering evidence about a student’s knowledge, skills, and values, and of making inferences based on that evidence for a variety of purposes. These purposes include making instructional decisions, monitoring student progress, evaluating student achievement in terms of defined criteria, and evaluating programs.
To meet these aims, it is necessary to use a variety of assessment techniques in order to:• assess what students know and how they think and feel about mathematics;• focus on a broad range of mathematical tasks and taking a holistic view of
mathematics;• assess student performance in a variety of ways, including written and oral,
and demonstrations;• assess the process as well as the product.
Tests are one way of determining what students have learned, but mathematical competence involves such characteristics as communicative ability, problem-solving ability, higher-order thinking ability, creativity, persistence, and curiosity. Because of the nature of the activities it is suggested that a variety of assessment strategies be used. Suggestions include:
• observing students as they work to see if they are applying various concepts; to see if they are working cooperatively; to observe their committment to the tasks;
• assessing the completed project to see if instructions have been followed; to see if concepts have been applied correctly; to see if the language of mathematics has been used correctly;
• assessing the students’ descriptions of their completed work to see if mathematical language is used correctly; to see if students understand the concepts used;
• providing opportunities for student self-assessment (Have students write explanations of their understanding, opinion, or feelings about an activity. One technique is to have them write under the headings What I Did, What I Learned, and How I Felt About It. Students could be asked to write a review of one day’s activities or of the whole unit’s work.);
• selecting an exemplary piece of work to be included in a portfolio for assessment purposes or for sharing with parents.
On the inside of the back cover of this booklet, you will find a chart connecting each activity to Ontario’s curriculum expectations.
Overview Page 3
Investigations in Probability Grade 6: Probability in Action
Overview
�����
prerequisitesIt would be helpful, but not essential, if students begin this unit with the following:• familiarity with simple fractions (e.g., ‘1/4’ means ‘1 out of 4’);• ability to write equivalent fractions or ratios (e.g., ‘1 out of 4’ is equivalent
to ‘2 out of 8’);• ability to identify prime and composite numbers less than 10;• some familiarity with simple percent concepts (e.g., 100% = 1; 3 out of 10
= 30%) and the ability to calculate 100% when a lesser percent is known (e.g., If 3 turtles are 10% of the population in a pond, calculate the total
number of turtles.)
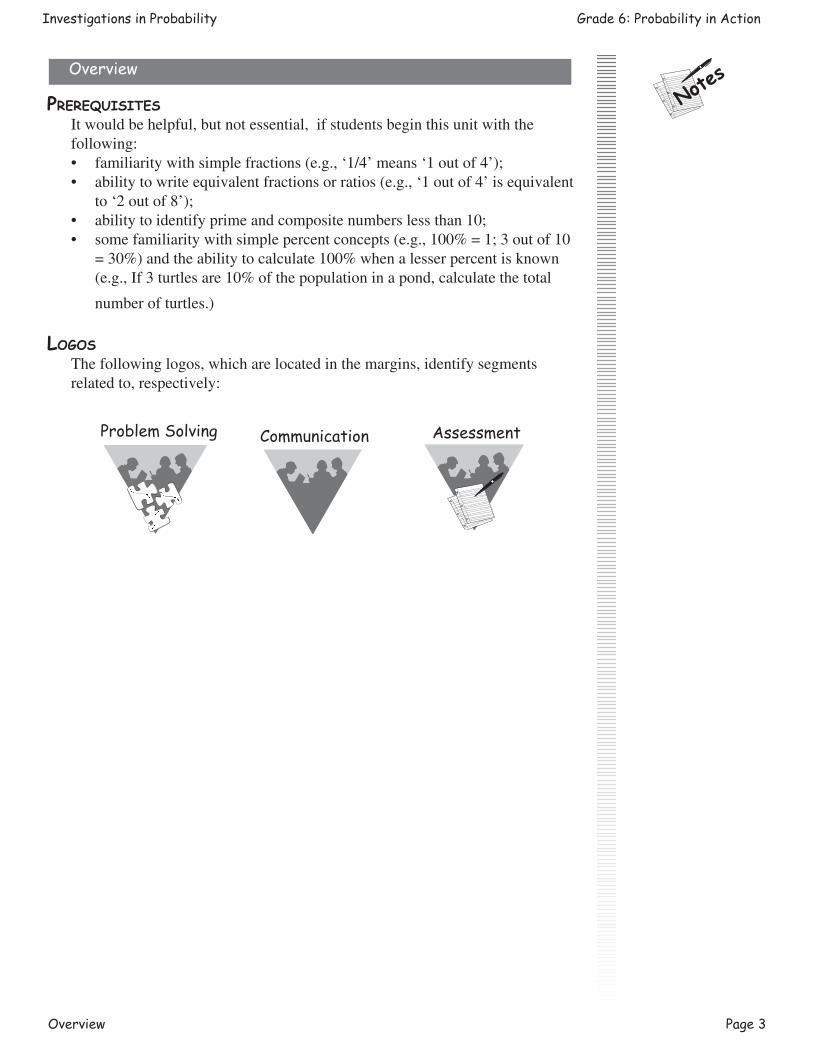
logosThe following logos, which are located in the margins, identify segments related to, respectively:
Problem Solving Communication Assessment
Page 4 Overview
Grade 6: Probability in Action Investigations in Probability
Overview
�����
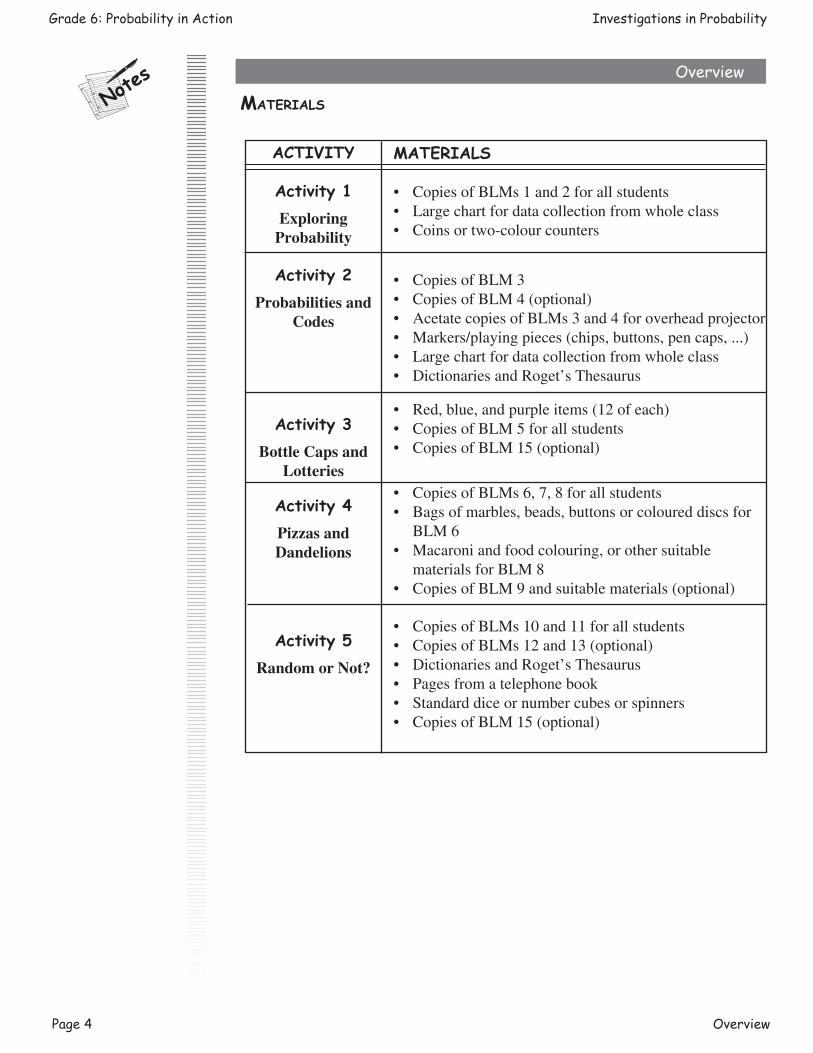
ACTIVITY
Activity 1Exploring
Probability
Activity 2Probabilities and
Codes
Activity 3Bottle Caps and
Lotteries
Activity 4Pizzas and Dandelions
Activity 5Random or Not?
MATERIALS
• Copies of BLMs 1 and 2 for all students• Large chart for data collection from whole class• Coins or two-colour counters
• Copies of BLM 3 • Copies of BLM 4 (optional)• Acetate copies of BLMs 3 and 4 for overhead projector• Markers/playing pieces (chips, buttons, pen caps, ...)• Large chart for data collection from whole class• Dictionaries and Roget’s Thesaurus
• Red, blue, and purple items (12 of each)• Copies of BLM 5 for all students• Copies of BLM 15 (optional)
• Copies of BLMs 6, 7, 8 for all students• Bags of marbles, beads, buttons or coloured discs for
BLM 6• Macaroni and food colouring, or other suitable
materials for BLM 8• Copies of BLM 9 and suitable materials (optional)
• Copies of BLMs 10 and 11 for all students• Copies of BLMs 12 and 13 (optional)• Dictionaries and Roget’s Thesaurus• Pages from a telephone book• Standard dice or number cubes or spinners • Copies of BLM 15 (optional)
materials
Overview Page 5
Investigations in Probability Grade 6: Probability in Action
Overview
�����
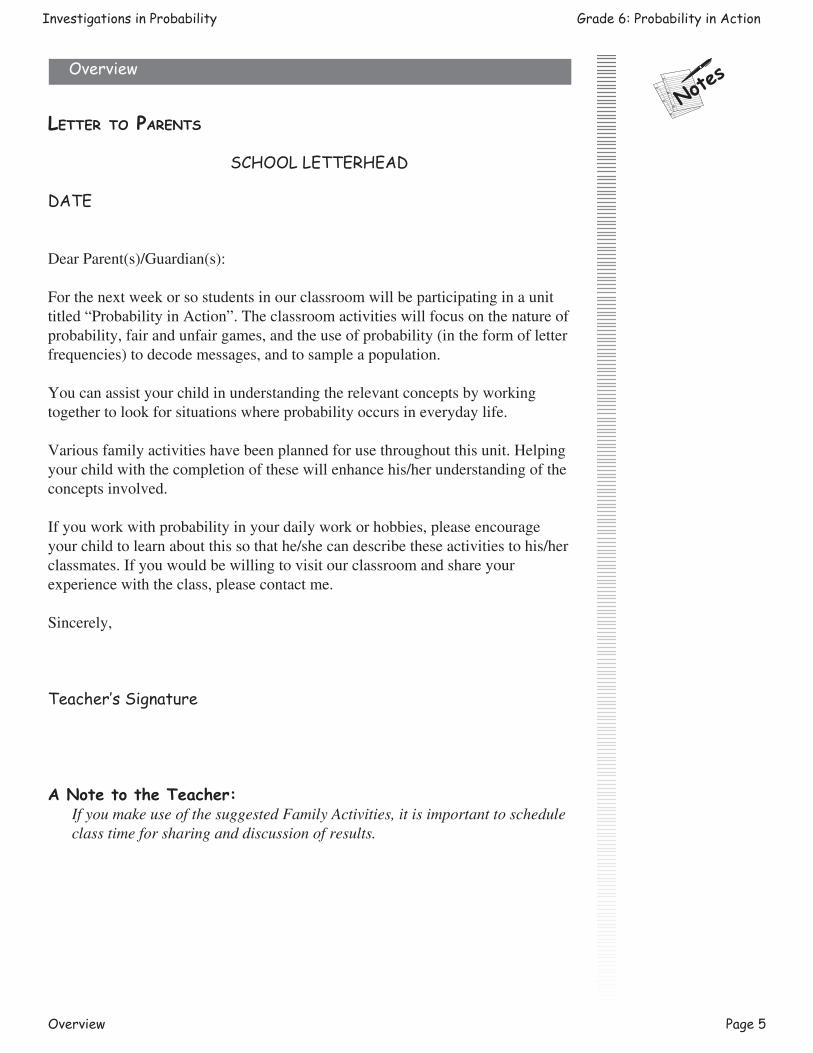
letter to parents
SCHOOL LETTERHEAD
DATE
Dear Parent(s)/Guardian(s):
For the next week or so students in our classroom will be participating in a unit titled “Probability in Action”. The classroom activities will focus on the nature of probability, fair and unfair games, and the use of probability (in the form of letter frequencies) to decode messages, and to sample a population.
You can assist your child in understanding the relevant concepts by workingtogether to look for situations where probability occurs in everyday life.
Various family activities have been planned for use throughout this unit. Helping your child with the completion of these will enhance his/her understanding of the concepts involved.
If you work with probability in your daily work or hobbies, please encourage your child to learn about this so that he/she can describe these activities to his/her classmates. If you would be willing to visit our classroom and share your experience with the class, please contact me.
Sincerely,
Teacher’s Signature
A Note to the Teacher:If you make use of the suggested Family Activities, it is important to schedule class time for sharing and discussion of results.

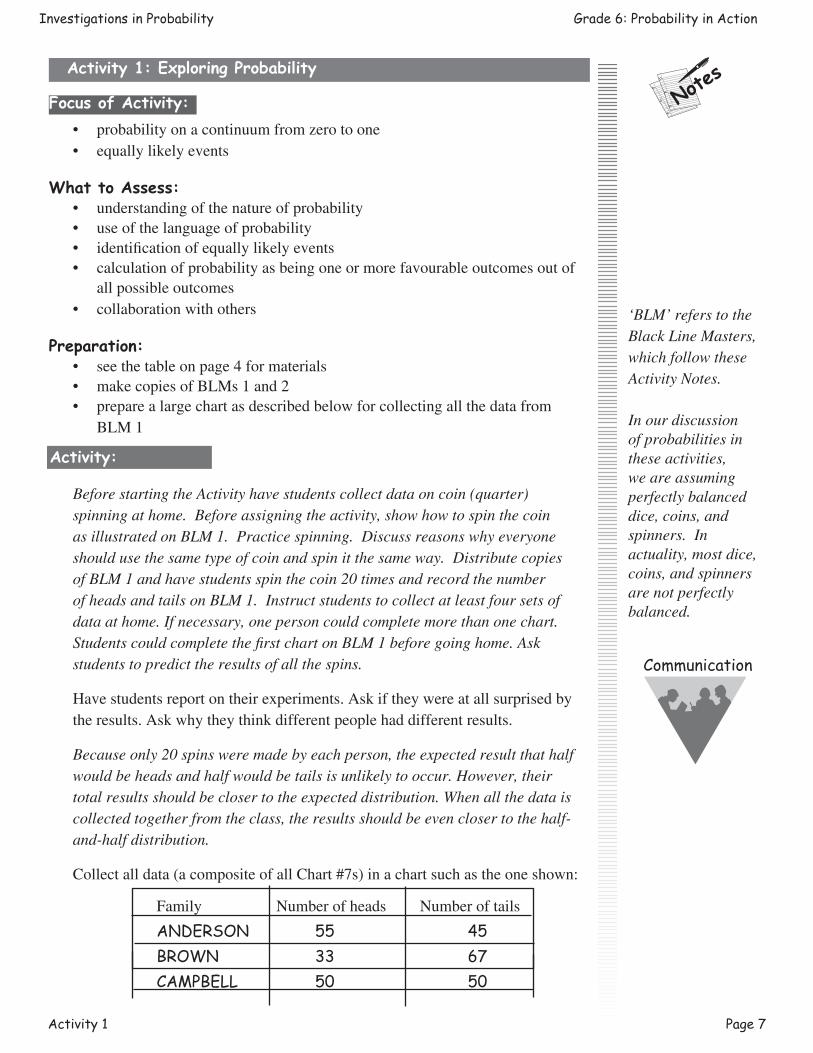
Activity 1 Page 7
Investigations in Probability Grade 6: Probability in Action
Activity 1: Exploring Probability
�����
Focus of Activity:• probabilityonacontinuumfromzerotoone• equallylikelyevents
What to Assess:• understandingofthenatureofprobability• useofthelanguageofprobability• identificationofequallylikelyevents• calculationofprobabilityasbeingoneormorefavourableoutcomesoutof
allpossibleoutcomes• collaborationwithothers
Preparation: • seethetableonpage4formaterials• makecopiesofBLMs1and2• preparealargechartasdescribedbelowforcollectingallthedatafrom
BLM1
Before starting the Activity have students collect data on coin (quarter) spinning at home. Before assigning the activity, show how to spin the coin as illustrated on BLM 1. Practice spinning. Discuss reasons why everyone should use the same type of coin and spin it the same way. Distribute copies of BLM 1 and have students spin the coin 20 times and record the number of heads and tails on BLM 1. Instruct students to collect at least four sets of data at home. If necessary, one person could complete more than one chart. Students could complete the first chart on BLM 1 before going home. Ask students to predict the results of all the spins.
Havestudentsreportontheirexperiments.Askiftheywereatallsurprisedbytheresults.Askwhytheythinkdifferentpeoplehaddifferentresults.
Because only 20 spins were made by each person, the expected result that half would be heads and half would be tails is unlikely to occur. However, their total results should be closer to the expected distribution. When all the data is collected together from the class, the results should be even closer to the half-and-half distribution.
Collectalldata(acompositeofallChart#7s)inachartsuchastheoneshown:
Family Numberofheads Numberoftails ANDERSON 55 45 BROWN 33 67 CAMPBELL 50 50
Activity:
Communication
In our discussion of probabilities in these activities, we are assuming perfectly balanced dice, coins, and spinners. In actuality, most dice, coins, and spinners are not perfectly balanced.
‘BLM’ refers to theBlack Line Masters,which follow theseActivity Notes.
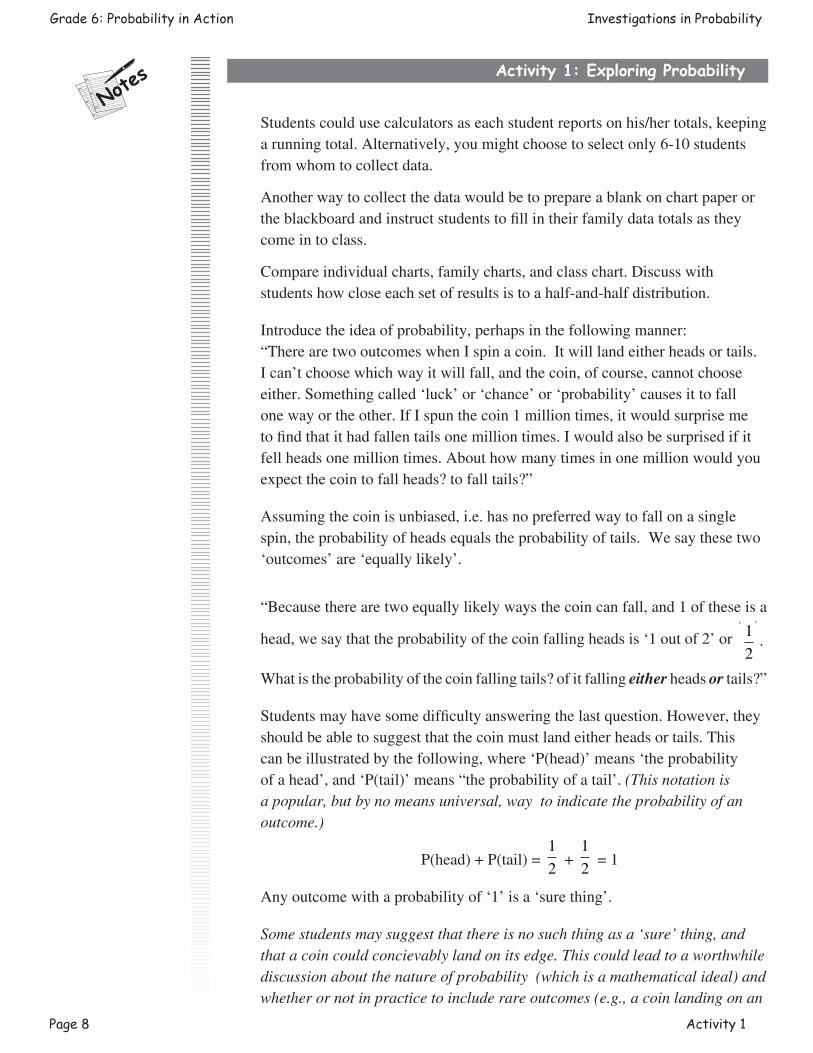
Page 8 Activity 1
Grade 6: Probability in Action Investigations in Probability
Activity 1: Exploring Probability
�����
Studentscouldusecalculatorsaseachstudentreportsonhis/hertotals,keepingarunningtotal.Alternatively,youmightchoosetoselectonly6-10studentsfromwhomtocollectdata.
Anotherwaytocollectthedatawouldbetoprepareablankonchartpaperortheblackboardandinstructstudentstofillintheirfamilydatatotalsastheycomeintoclass.
Compareindividualcharts,familycharts,andclasschart.Discusswithstudentshowcloseeachsetofresultsistoahalf-and-halfdistribution.
Introducetheideaofprobability,perhapsinthefollowingmanner:“TherearetwooutcomeswhenIspinacoin.Itwilllandeitherheadsortails.Ican’tchoosewhichwayitwillfall,andthecoin,ofcourse,cannotchooseeither.Somethingcalled‘luck’or‘chance’or‘probability’causesittofallonewayortheother.IfIspunthecoin1milliontimes,itwouldsurprisemetofindthatithadfallentailsonemilliontimes.Iwouldalsobesurprisedifitfellheadsonemilliontimes.Abouthowmanytimesinonemillionwouldyouexpectthecointofallheads?tofalltails?”
Assumingthecoinisunbiased,i.e.hasnopreferredwaytofallonasinglespin,theprobabilityofheadsequalstheprobabilityoftails.Wesaythesetwo‘outcomes’are‘equallylikely’.
“Becausetherearetwoequallylikelywaysthecoincanfall,and1oftheseisa
head,wesaythattheprobabilityofthecoinfallingheadsis‘1outof2’or‘ ’12
.
Whatistheprobabilityofthecoinfallingtails?ofitfallingeitherheadsortails?”
Studentsmayhavesomedifficultyansweringthelastquestion.However,theyshouldbeabletosuggestthatthecoinmustlandeitherheadsortails.Thiscanbeillustratedbythefollowing,where‘P(head)’means‘theprobabilityofahead’,and‘P(tail)’means“theprobabilityofatail’.(This notation is a popular, but by no means universal, way to indicate the probability of an outcome.)
P(head)+P(tail)=12+
12 =1
Anyoutcomewithaprobabilityof‘1’isa‘surething’.
Some students may suggest that there is no such thing as a ‘sure’ thing, and that a coin could concievably land on its edge. This could lead to a worthwhile discussion about the nature of probability (which is a mathematical ideal) and whether or not in practice to include rare outcomes (e.g., a coin landing on an
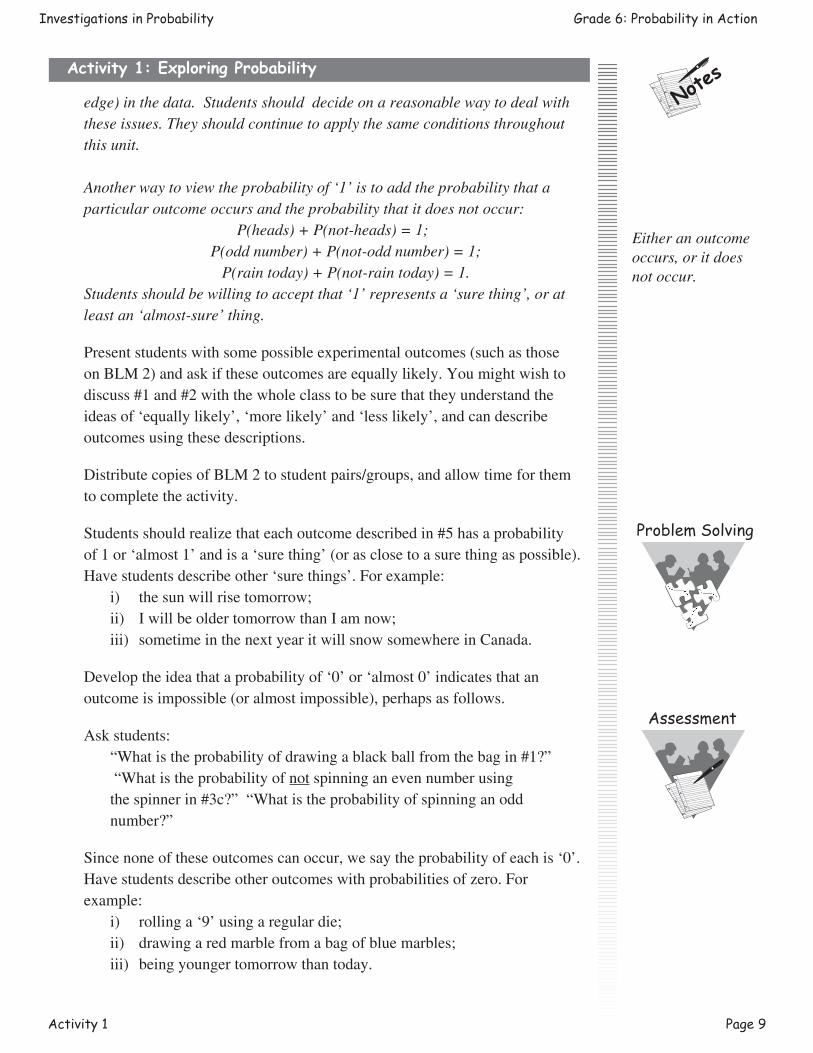
Activity 1 Page 9
Investigations in Probability Grade 6: Probability in Action
Activity 1: Exploring Probability
�����
edge) in the data. Students should decide on a reasonable way to deal with these issues. They should continue to apply the same conditions throughout this unit.
Another way to view the probability of ‘1’ is to add the probability that a particular outcome occurs and the probability that it does not occur:
P(heads) + P(not-heads) = 1; P(odd number) + P(not-odd number) = 1;
P(rain today) + P(not-rain today) = 1.Students should be willing to accept that ‘1’ represents a ‘sure thing’, or at least an ‘almost-sure’ thing.
Presentstudentswithsomepossibleexperimentaloutcomes(suchasthoseonBLM2)andaskiftheseoutcomesareequallylikely.Youmightwishtodiscuss#1and#2withthewholeclasstobesurethattheyunderstandtheideasof‘equallylikely’,‘morelikely’and‘lesslikely’,andcandescribeoutcomesusingthesedescriptions.
DistributecopiesofBLM2tostudentpairs/groups,andallowtimeforthemtocompletetheactivity.
Studentsshouldrealizethateachoutcomedescribedin#5hasaprobabilityof1or‘almost1’andisa‘surething’(orasclosetoasurethingaspossible).Havestudentsdescribeother‘surethings’.Forexample: i) thesunwillrisetomorrow; ii) IwillbeoldertomorrowthanIamnow; iii) sometimeinthenextyearitwillsnowsomewhereinCanada.Developtheideathataprobabilityof‘0’or‘almost0’indicatesthatanoutcomeisimpossible(oralmostimpossible),perhapsasfollows.
Askstudents:“Whatistheprobabilityofdrawingablackballfromthebagin#1?”“Whatistheprobabilityofnotspinninganevennumberusingthespinnerin#3c?”“Whatistheprobabilityofspinninganoddnumber?”
Sincenoneoftheseoutcomescanoccur,wesaytheprobabilityofeachis‘0’.Havestudentsdescribeotheroutcomeswithprobabilitiesofzero.Forexample: i) rollinga‘9’usingaregulardie; ii) drawingaredmarblefromabagofbluemarbles; iii) beingyoungertomorrowthantoday.
Problem Solving
Assessment
Either an outcome occurs, or it does not occur.
Page 10 Activity 1
Grade 6: Probability in Action Investigations in Probability
Activity 1: Exploring Probability
�����
Towrapuptheactivity,havestudentswriteaboutwhattheyhavelearned:“Supposeyouaretryingtoexplaintoday’sactivitiestoanabsentclassmate.Whatwouldyousay/write?”
Extensions in Mathematics:1. Explorewaysthatoutcomesdependonconditions.Forexample: (a) Stickabitofclay/plasticineononesideofacoinandspinitseveraltimes.
Doheadsandtailsappeartobeequallylikely? (b)Flipacoinratherthanspinningit.Whetherthecoinisshowingheadsortails
beforetheflipmayhavesomebearingonthewayitfalls.
2. SpinaCanadianpennyandanAmericanpenny.Spinseveraltimes.Arebothcoinsequallylikelytofallheadsandtails?Experimentwithcoinsfromothercountries.
Cross-curricular Activities:1. Exploretheuseofprobabilityinweatherforecasts.Whatismeantby‘a20%
chanceofrain’?Whereintheworldwouldtheprobabilityofrainbeclosetozero?closeto1?
Family Activities:1. Usetiddly-winksorbingochipsortwocoins.Fliponewiththeothertheway
youdoforplayingTiddly-Winks.Marka10-cmdiametercircleonapieceofpaper.Drawastartingline30cmfromthecircle.Trytoflipachip/coinintothecirclefrombehindthestartingline.Eachsuccessfulattemptgetsascoreofone.Alloweachperson30triesandrecordhis/herscore.
Usethescorestoanswerthefollowing: (a)Who,inyourfamily,ismostlikelytogetahighscore? (b)Whoismorelikelytogetalowscorethanahighscore? Givereasonsforyouranswers.
Other ResourcesForadditionalideas,seeannotated“OtherResources”listonpage57,numberedasbelow.
10.“DealingwithDataandChance:AddendaSeries,Grades5-8”,JudithS.Zawojewskietal.
12.“WhatAreMyChances?”,CreativePublications21.“OrganizingDataandDealingwithUncertainty”,NCTM
Communication
Activity 2 Page 11
Investigations in Probability Grade 6: Probability in Action
Activity 2: Probability and Codes
�����
• exploringletterfrequencies
What to Assess:• accuracyoflettercounts• reasonablenessofpredictions• applicationofletterfrequenciestodecoding• collaborationwithothers
Preparation: • makecopiesofBLM3• makecopiesofBLM4(optional)• providemarkersfortheracegame(amarkercanbeaplayingpiecefrom
anothergame,thecapofapen,abitoferaser,etc.)• prepareachartforalltheclassdata(seebelow)onblackboardorchart
paper;asimilarchartforthefivemostcommonconsonantswillalsobeneeded.
• haveavailabledictionaries,booksofvarioussorts,andcopiesofRoget’sThesaurus
EveryprinterandsignmakerknowsthatsomelettersareusedfarmorefrequentlyinEnglishthanothersare.Thesameistruewithotherlanguagesbutdifferentlettersarecommon.Ifyourclassincludesstudentswithotherlanguagesorwithotherlanguagesinthehome,youmaywishtoincorporateotherlanguagesinthisActivity.
Letterfrequenciescanbedeterminedbysimplecounting(ofawiderangeofsources)buttheuseoftheracegameaddsinterestforstudentsandensurescarefulcountingsincetherewillbeafeelingofcompetition.
DistributecopiesofBLM3tostudentgroups.Ifgroupsof5arenotsuitable,fewerstudentscouldbeineachgroupandsomecouldchoosemorethanonevoweltotrack.
Youmaywishtodiscusswaysofmakingthetaskmoremanageable.Forexample,onestudentcouldberesponsiblefor‘reading’thevowelsinthechosenselection.He/shewouldsimplynameeachvowelasitappearsandtheotherstudentswouldmovetheirmarkersaroundtheracetrack.
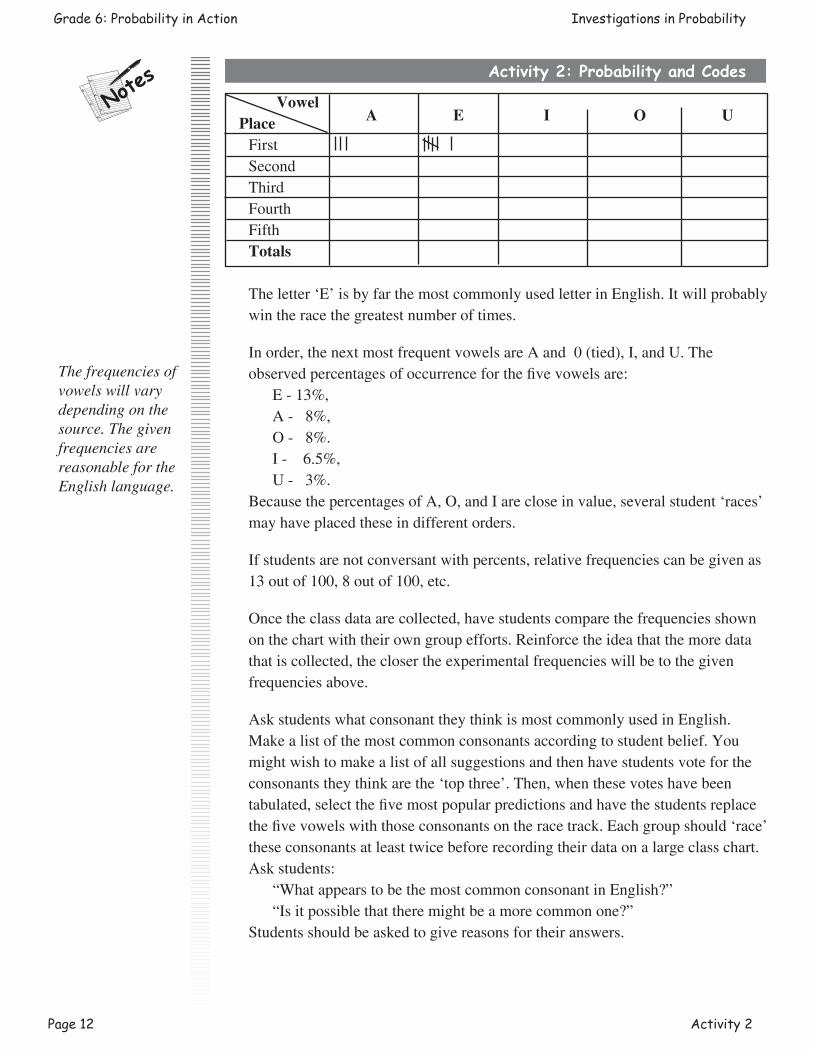
Onceallgroupshave‘raced’thevowelstwoorthreetimes,collectallthedatainachartsuchastheonebelow.Studentscouldusetallymarkstorecordtheirownwinnersastheyfinishthesecondorthirdrace,whicheveryouselect.Inthispartiallycompletedchart,sixgroupshad‘E’comingfirstandthreegroupshad‘A’comingfirst.
Activity:
‘BLM’ refers to theBlack Line Masters,which follow theseActivity Notes.
Focus of Activity:
Page 12 Activity 2
Grade 6: Probability in Action Investigations in Probability
Activity 2: Probability and Codes
�����
Vowel PlaceFirstSecondThirdFourthFifthTotals
Theletter‘E’isbyfarthemostcommonlyusedletterinEnglish.Itwillprobablywintheracethegreatestnumberoftimes.
Inorder,thenextmostfrequentvowelsareAand0(tied),I,andU.Theobservedpercentagesofoccurrenceforthefivevowelsare:
E-13%, A-8%, O-8%. I-6.5%, U-3%.
BecausethepercentagesofA,O,andIarecloseinvalue,severalstudent‘races’mayhaveplacedtheseindifferentorders.
Ifstudentsarenotconversantwithpercents,relativefrequenciescanbegivenas13outof100,8outof100,etc.
Oncetheclassdataarecollected,havestudentscomparethefrequenciesshownonthechartwiththeirowngroupefforts.Reinforcetheideathatthemoredatathatiscollected,theclosertheexperimentalfrequencieswillbetothegivenfrequenciesabove.
AskstudentswhatconsonanttheythinkismostcommonlyusedinEnglish.Makealistofthemostcommonconsonantsaccordingtostudentbelief.Youmightwishtomakealistofallsuggestionsandthenhavestudentsvotefortheconsonantstheythinkarethe‘topthree’.Then,whenthesevoteshavebeentabulated,selectthefivemostpopularpredictionsandhavethestudentsreplacethefivevowelswiththoseconsonantsontheracetrack.Eachgroupshould‘race’theseconsonantsatleasttwicebeforerecordingtheirdataonalargeclasschart.Askstudents:
“WhatappearstobethemostcommonconsonantinEnglish?”“Isitpossiblethattheremightbeamorecommonone?”
Studentsshouldbeaskedtogivereasonsfortheiranswers.
A E I O U
The frequencies of vowels will vary depending on the source. The given frequencies are reasonable for the English language.
Activity 2 Page 13
Investigations in Probability Grade 6: Probability in Action
Activity 2: Probability and Codes
�����
Somestudentsmayhavesuggested‘S’asthemostcommonletter,sincemostdictionarieshavemorewordsbeginningwith‘S’thanwithanyotherletter.Thisideamightalsogivestudentsreasonsforlabellingsuchlettersas‘X’and‘Z’aslettersthatarenotcommon,sincetherearerelativelyfewwordsinthedictionarybeginningwith‘X’or‘Z’.
The‘topfive’consonantsinEnglishareT,N,R,S,andH.Theirobservedpercentagesare T-9% N-7% R-6.5% S-6% H-5.5%
Activity 2 can be terminated here, or you may wish to continue with the following optional activity.
Optional
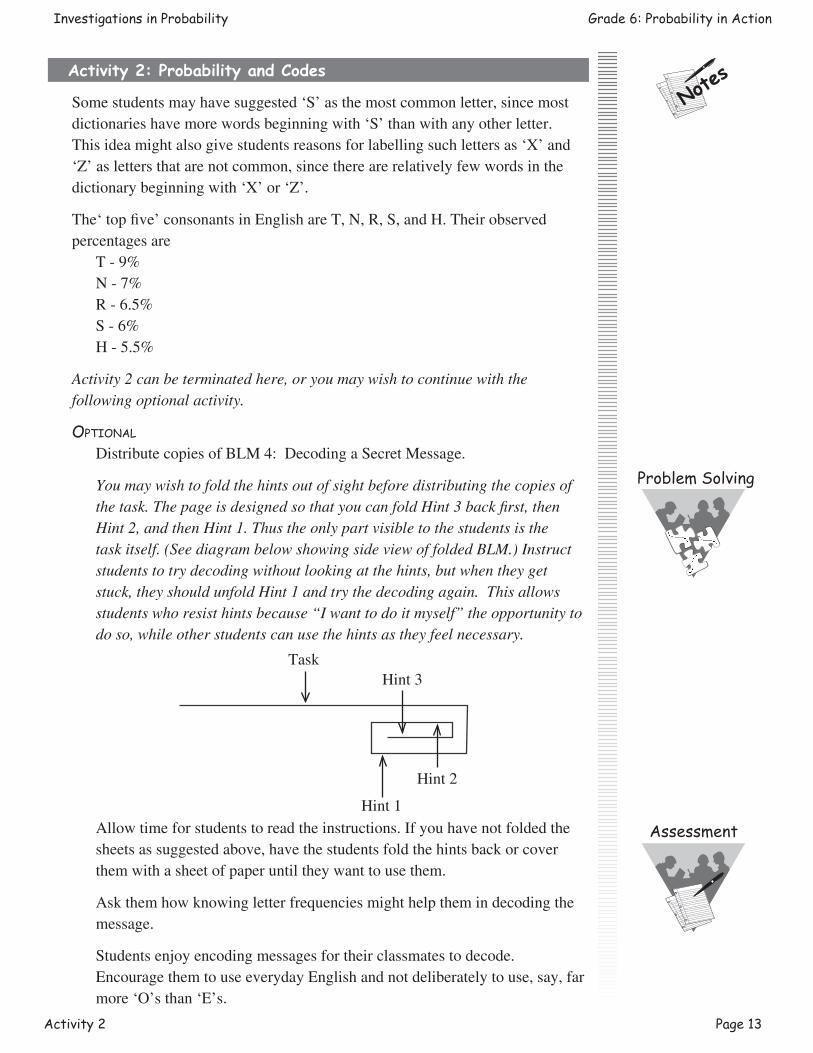
DistributecopiesofBLM4:DecodingaSecretMessage.
You may wish to fold the hints out of sight before distributing the copies of the task. The page is designed so that you can fold Hint 3 back first, then Hint 2, and then Hint 1. Thus the only part visible to the students is the task itself. (See diagram below showing side view of folded BLM.) Instruct students to try decoding without looking at the hints, but when they get stuck, they should unfold Hint 1 and try the decoding again. This allows students who resist hints because “I want to do it myself” the opportunity to do so, while other students can use the hints as they feel necessary.
Allowtimeforstudentstoreadtheinstructions.Ifyouhavenotfoldedthesheetsassuggestedabove,havethestudentsfoldthehintsbackorcoverthemwithasheetofpaperuntiltheywanttousethem.
Askthemhowknowingletterfrequenciesmighthelpthemindecodingthemessage.
Studentsenjoyencodingmessagesfortheirclassmatestodecode.EncouragethemtouseeverydayEnglishandnotdeliberatelytouse,say,farmore‘O’sthan‘E’s.
Problem Solving
Assessment
Task
Hint1
Hint2
Hint3
Page 14 Activity 2
Grade 6: Probability in Action Investigations in Probability
Activity 2: Probability and Codes
�����
Studentscouldalsobeaskedtowriteoneortwohintstohelpothersdecodetheirmessages.Thinkingaboutthehintscausesstudentstothinkabouthowthedecodingwillbedone,andmayencouragethemtowritemorerealisticmessages.
Extensions in Mathematics:1. Recordletterfrequenciesongraphs.Forexample, (a) graphthenumberoftimeseachvoweloccursinagivenparagraph; (b) graphthenumberoftimeseachvowel‘won’therace,usingclassresults; (c) giveeachvowelascore(e.g.,5forfirst,4forsecond,...1forfifth)and
graphthetotalscoreofeachofthevowels.
2. ExplorethefrequenciesofconsonantcombinationssuchasTH,SH,ST,orvowelcombinations(diphthongs)suchasEA,AI,OU.
3. Studentscouldcalculatewhohasthe“mostfrequent”initials,orname.See“SolutionsandNotes”forsomedataonsomefamousmathematicians’initials.
Cross-curricular Activities:1. Askstudentsforsomelettercombinationstheythinkarerare,andsomethatare
common.Havethemselectoneofeachandwriteasmanywordsastheycancontainingthatcombinationofletters.Checkwithadictionary.
2. TrytowriteanEnglishsentenceatleast10wordslong (i) withno‘E’s; (ii) withno‘T’s; (iii) withno‘E’sor‘T’s. Useadictionaryorthesaurustofindwords.
3. Studentsworkinpairsorsmallgroupstowriteascriptforabriefdialoguewithoutusingparticularlettersorparticularwords(e.g.,the,these,those,and).
Family Activities:1. Exploreletterfrequenciesinadifferentlanguage.Forexample,is‘E’themost
commonlyusedletterinFrench?inGreek?
2. Studentsandtheirfamiliesmightliketoexplorewhetherornotknowingletterfrequenciescouldhelpthemwinonthepopulartelevisionshow“WheelofFortune”.
Other ResourcesForadditionalideas,seeannotated“OtherResources”listonpage57,numberedasbelow.
19.“ModeCode”DavidB.Spangler
Communication
Problem Solving
For different types of graphs, see “Investigations in Data Management: TV - Vice or Virtue?” See order form at the end of this booklet.
Activity 3 Page 15
Investigations in Probability Grade 6: Probability in Action
Activity 3: Bottle Caps and Lotteries
�����
Focus of Activity:• theuseoftreediagramstolistpossibleoutcomes
What to Assess:• useoftreediagramstodetermineallpossibleoutcomes• logicalstatementsinsolvingtheproblems• collaborationwithothers
Preparation: • provideitemsinred,blue,andpurpletorepresenttheboltsintheproblem• makecopiesofBLM5• makecopiesofBLM15ifyouwishthestudentstohavenotesontree
diagrams
Refertocontestssuchasthoseinvolvinglettersorpicturesinthelidsofsoftdrinkbottlesorprintedonboxtops.Askstudentsiftheyhaveeverrunacrosssuchacontestoriftheyhavetriedcollectingallthenecessaryelements.TellthemthatthisActivitywillexploretheprobabilitiesofwinningsuchevents.
Presentthefollowingscenario:“Supposearobot,RTD3,needsapairofboltseverydaytoreplacewornpieces.Hismanagerlikestouse2boltsofthesamecoloureachday.Allthebolts,redandblue,areinaboxonahighshelf.Themanagerreachesineachday,hopingtogettwomatchingbolts.Whatistheleastnumberofboltshemustpulloutinordertobesureofhaving2ofthesamecolour?Couldhedothisbytakingout2?Whyorwhynot?”
Youmaywishtomodelthisforstudentsusingblocksorscrapsofpaperofdifferentcoloursinanenvelope.Haveastudentsdrawa‘bolt’withoutlookingintotheenvelope.Haveanotherstudentdrawasecond‘bolt’.Ifthecoloursdonotmatch,haveathirdstudentdrawa‘bolt’.
Repeatseveraltimesandrecordthenumberofdrawsneeded.Studentsmayatfirstbesurprisedtofindthattheyneverneedafourthdraw.
Eventually,theyshouldbeabletoreasonasfollows:“Supposethefirstboltisred.Supposethesecondboltisblue.Sincethethirdbolthastobeeitherredorblueitwillalwaysmatchoneofthefirsttwoandonlythreedrawsareneeded.”
Activity:
Problem Solving
Assessment
‘BLM’ refers to theBlack Line Masters,which follow theseActivity Notes.
Page 16 Activity 3
Grade 6: Probability in Action Investigations in Probability
Activity 3: Bottle Caps and Lotteries
�����
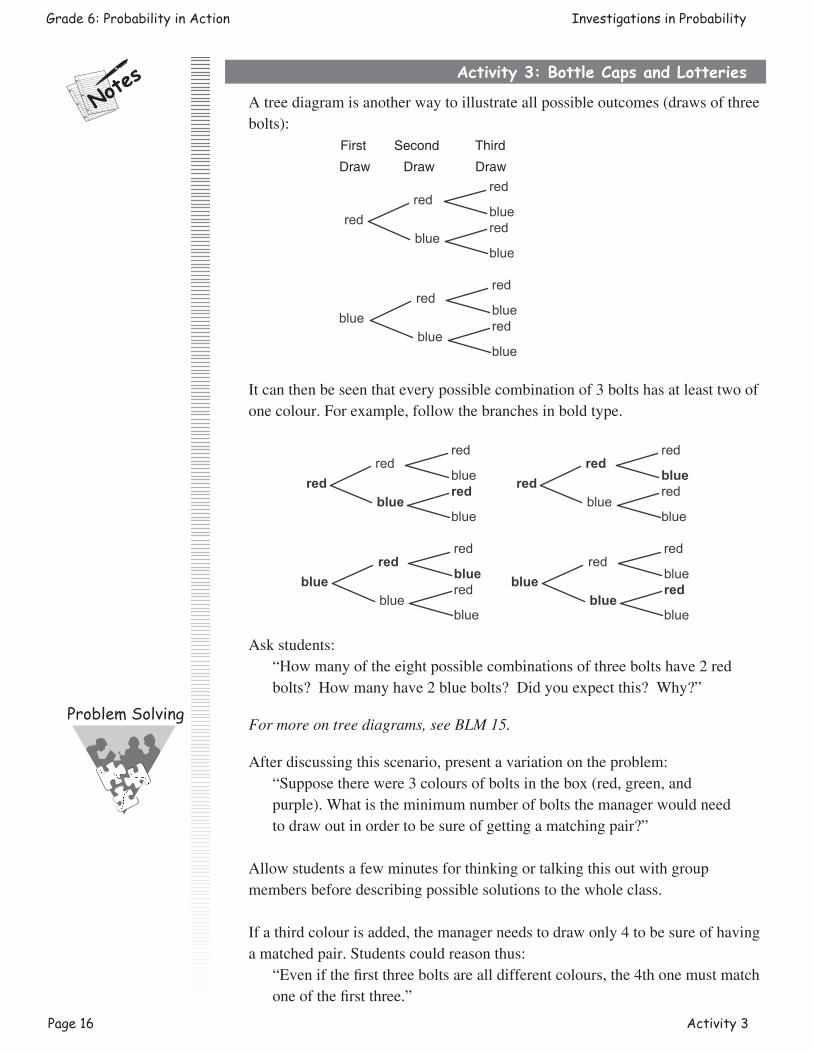
Atreediagramisanotherwaytoillustrateallpossibleoutcomes(drawsofthreebolts):
First Second Third
Draw Draw Draw
Itcanthenbeseenthateverypossiblecombinationof3boltshasatleasttwoofonecolour.Forexample,followthebranchesinboldtype.
Askstudents:
“Howmanyoftheeightpossiblecombinationsofthreeboltshave2redbolts?Howmanyhave2bluebolts?Didyouexpectthis?Why?”
For more on tree diagrams, see BLM 15.
Afterdiscussingthisscenario,presentavariationontheproblem:“Supposetherewere3coloursofboltsinthebox(red,green,andpurple).Whatistheminimumnumberofboltsthemanagerwouldneedtodrawoutinordertobesureofgettingamatchingpair?”
Allowstudentsafewminutesforthinkingortalkingthisoutwithgroupmembersbeforedescribingpossiblesolutionstothewholeclass.
Ifathirdcolourisadded,themanagerneedstodrawonly4tobesureofhavingamatchedpair.Studentscouldreasonthus:
“Evenifthefirstthreeboltsarealldifferentcolours,the4thonemustmatchoneofthefirstthree.”
Problem Solving
redred
blue
red
bluered
blue
bluered
blue
red
bluered
blue
redred
blue
red
bluered
blue
bluered
blue
red
bluered
blue
redred
blue
red
bluered
blue
bluered
blue
red
bluered
blue
Activity 3 Page 17
Investigations in Probability Grade 6: Probability in Action
Activity 3: Bottle Caps and Lotteries
�����
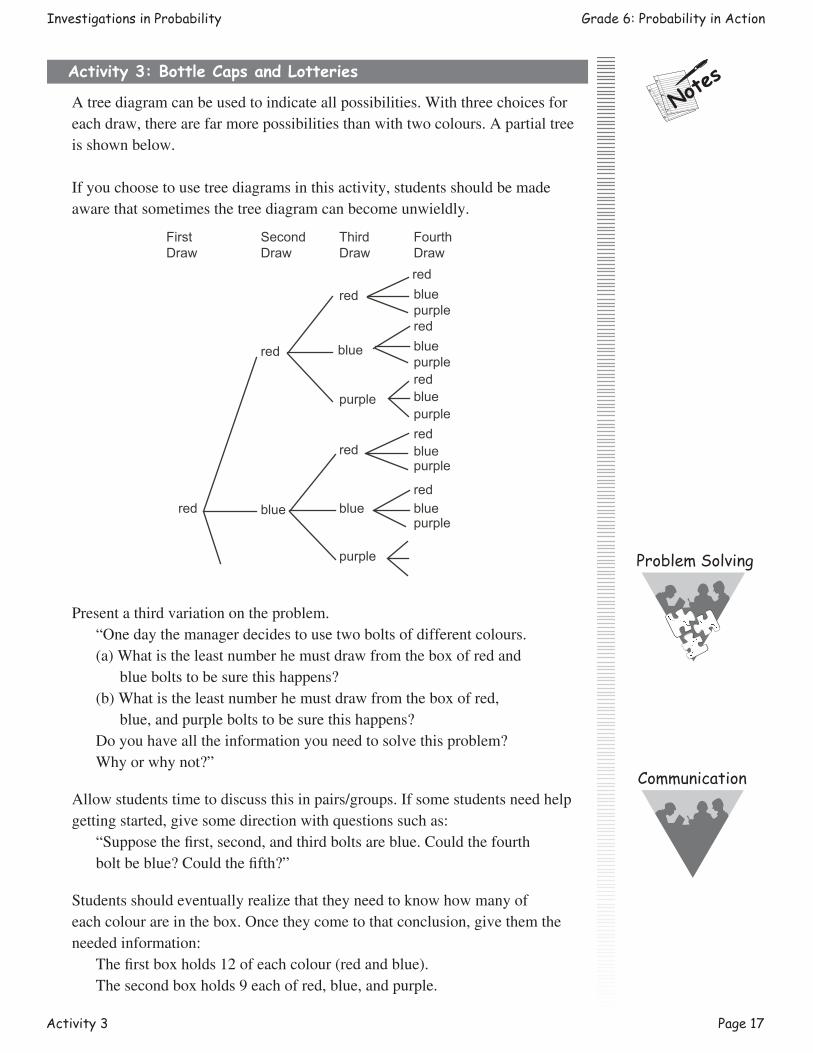
Atreediagramcanbeusedtoindicateallpossibilities.Withthreechoicesforeachdraw,therearefarmorepossibilitiesthanwithtwocolours.Apartialtreeisshownbelow.
Ifyouchoosetousetreediagramsinthisactivity,studentsshouldbemadeawarethatsometimesthetreediagramcanbecomeunwieldly.
Presentathirdvariationontheproblem.
“Onedaythemanagerdecidestousetwoboltsofdifferentcolours.(a)Whatistheleastnumberhemustdrawfromtheboxofredand
blueboltstobesurethishappens?(b)Whatistheleastnumberhemustdrawfromtheboxofred,
blue,andpurpleboltstobesurethishappens?Doyouhavealltheinformationyouneedtosolvethisproblem?Whyorwhynot?”
Allowstudentstimetodiscussthisinpairs/groups.Ifsomestudentsneedhelpgettingstarted,givesomedirectionwithquestionssuchas:
“Supposethefirst,second,andthirdboltsareblue.Couldthefourthboltbeblue?Couldthefifth?”
Studentsshouldeventuallyrealizethattheyneedtoknowhowmanyofeachcolourareinthebox.Oncetheycometothatconclusion,givethemtheneededinformation: Thefirstboxholds12ofeachcolour(redandblue). Thesecondboxholds9eachofred,blue,andpurple.
Problem Solving
Communication
red
red
blue
red
blue
purple
redbluepurpleredbluepurpleredblue
redpurple
bluepurple
red
blue
purple
redbluepurple
First Draw
Second Draw
Third Draw
FourthDraw
Page 18 Activity 3
Grade 6: Probability in Action Investigations in Probability
Activity 3: Bottle Caps and Lotteries
�����
Althoughitisunlikelytohappen,themanagercouldpulloutall12blueboltsinarowbeforegettingaredone.Thus,theminimumnumberofboltsheneedstodrawfromthefirstboxis13.
Forthesecondbox,heneedstodraw10tobesureofgettingtwodifferentcolours.Askwhatminimumnumbermustbedrawnifthemanagerwantsthreeboltsofdifferentcolours.Theansweris19bolts.Thatis,hecoulddrawallthered(9bolts)andalltheblue(9boltsmore)beforedrawingapurpletogivethreedifferentcolours.Thus19istheminimumnumberthatmustbedrawntobecertainthathewillhaveoneofeachcolour.)
Note that solutions given above are for the first draw only. For subsequent draws, one must take into account that some bolts have been removed from the box. For the first problem, the manager is using one of each colour, so there will be 11 of each colour left for the next draw, if the manager returns unused bolts to the box after obtaining one of each colour. Thus, the minimum number the manager needs to draw on the second day to be certain of getting at least one of each colour is 12. Students could follow this problem to its logical end when there will be only 1 red and 1 blue bolt left in the box.Theboltproblemsmaynotberealisticsituations,buttheybuildafoundationforexploringotherproblemssuchasthoseonBLM5andinExtension1.Studentsshouldworkinpairsorsmallgroupsforthese.
These three problems have been carefully structured so that solving each helps to solve the next, starting with number 1 on BLM 5.
Ifstudentsdonotfinishduringtheclassperiod,thiswouldbeagoodopportunitytoinvolveotherfamilymembers.Studentscouldasktheirfamiliesfortheirsuggestionsandreportbacktotheirgroupsthenextday.
Whenstudentsfinish,havethemreporttotheclass.Eachgroupshouldbepreparedtojustifytheirsolutions.See“SolutionsandNotes”,forpossibleresponses.
Studentscouldbeaskedtowritetheirsolutions,alongwiththeirreasons.Suchasolutionwouldbeagooditemforaportfolio.
Extensions in Mathematics:1. TheSuperSaverStorehadacontest.Eachcustomerwasallowedtodraw
threelettersfromalargedrumcontainingthelettersofthestore’sname:S,U,P,E,R,A,V,T,andO.Ifthecustomerdrewthree‘S’s(thestore’sinitials),thatcustomerwouldgeta50%discountonanypurchasesjustmade.
Problem Solving
Communication
Since Extension 1 is fairly lengthy, you may wish to make a copy for each student or group.
Activity 3 Page 19
Investigations in Probability Grade 6: Probability in Action
Activity 3: Bottle Caps and Lotteries
�����
(a) Thedrumwillhold900letters.Ifyouwereaskedbytheownertodesignacontestthatwouldbeneitherveryeasynorverydifficulttowin,howwouldyoudothis?
(b) Ifthecontestweretobeveryeasytowin,howwouldyoudothis?
(c) Howcouldyourunanhonestcontestbutstillmakeitverydifficulttowin?
(d) Wouldyouranswersto(a),(b),and(c)changeiftheletterswerereturnedtothedrumaftereverydraw?Explain.
This is not a trivial problem and students will need some careful reasoning. Since “easy to win” and “hard to win” are value judgements, expect student answers to vary.
Family Activities:1. Examinetheprobabilitiesofwinningalocallottery.Determinehowmanyprize-
winningpossibilitiesthereare.
2. Investigateavarietyoflotteries.Whyaresomeveryexpensive(i.e.,$100)andsomeinexpensive(i.e.,$2)?
Other ResourcesForadditionalideas,seeannotated“OtherResources”listonpage57,numberedasbelow.
10.“DealingwithDataandChance:AddendaSeries,Grades5-8”,JudithS.Zawojewskietal.
13.“TruthorCoincidence?”,DanielJ.Brohier20.“CatandMouse”,DavidLannen22.“CalendarMathematics”,LornaJ.Morrow
Page 20 Activity 4
Grade 6: Probability in Action Investigations in Probability
Activity 4: Pizzas and Dandelions
�����
• samplingtodetermine/predictcharacteristicsofapopulation
What to Assess:• accuraterecordkeeping• logicalreasonsgivenforpredictions
Preparation: • makecopiesofBLMs6,7andacopyofBLM6forusewiththeoverhead• makecopiesofBLM8• makecopiesofBLM9(optional)• preparebagsofmarbles/beads/coloureddisksforBLM6.Eachbagshould
containthesamecollectionofitems.Solutionsaregivenforbagscontaining5red,3green,and1blueitem.
• preparematerialsforusewithBLM8.Forexample,acontainerofpiecesofmacaroniwithafewpiecescolouredwithfoodcolouring;severalwhitebreadtiesandafewcolouredones;severalbuttonswithholes,andafewwithshanks;severalplainanimalcrackersandafewmarkedwithfoodcolouring.
• preparematerialsforusewithBLM9(optional)(SeeExtensions.)
Tellstudentsthateachgroupisgoingtobegivenabagofmarblesand,withoutlookingintothebag,willbeexpectedtopredictthecontentsofthebag.
Studentgroupswillbeaskedtoshareresultswithoneothergroup.Thiswillworkwelliftheclassisdividedintoanevennumberofgroups.
ShowBLM6ontheoverhead,directingstudentstothe9statementsbelowthechart.Explainthattheyaretotake3marblesatatimefromthebag,recordthecolours,andtellifeachofstatementsAtoIistrueforthatsample.
Displaythreemarbles,2redand1blue.ThesecoloursarealreadyrecordedasRRBinthesquarelabelled“Sample(i)”onthechart.AskifstatementAistrue(no;itisfalsebecausethemarblesinthesamplearenotallthesame).Repeatfortheotherstatements,recordingTorFunder“Sample(i)”.Studentsshouldgivereasonswhyastatementistrueorfalseforaparticularsample.Forthesamplesuggestedabove(RRB),statementsC,D,E,andIaretrue.Theothersarefalse.
Some of statements A to I are open to interpretation. For example, statement C could be taken to mean “There is exactly 1 red marble” or “There is at least one red marble”. Similarly, for statements E, H, and I. This is worth discussing if students raise the question. The class should then decide on the interpretation that will be used for this activity. The second interpretation is the one used for given solutions.
Activity:
Communication
The general rubric in “Suggested Assessment Strategies” (following Solutions and Notes) has been adapted for this problem, as a sample to assist you in assessing your students.
‘BLM’ refers to theBlack Line Masters,which follow theseActivity Notes.
Focus of Activity:
Activity 4 Page 21
Investigations in Probability Grade 6: Probability in Action
Activity 4: Pizzas and Dandelions
�����
Youmaywishtodrawasecondsampleandlabeleachstatementastrueorfalse(recordas“Sample(ii)”),ifstudentsarehavingdifficultydeterminingthetruthorfalsityoftheindividualstatements.Oncetheyarecomfortablewiththeprocess,distributecopiesofBLM6andtellstudentstocompletesixtrials.Foreachtrial,theyshoulddraw3marbleswithoutlooking,recordthecoloursofthisdrawasoneofthetrials,markeachstatementastrueorfalseforthatsample,andthenreturnthemarblestothebag.
Oncestudentshavecompletedthe6trials,askthemtousetheirrecordedresultstopredict(intheirgroups)themakeupandnumberofthemarblesinthebag.Somestudentsmayneedsomehelpwiththis.Directthemtopiecesofdatatheyshouldbeusingbyaskingsuchquestionsas: “Howmanycoloursdoyouthinkthereare?Why?” “Aretheremoreofonecolourthanofanother?Whatmakesyouthinkso?”Studentsshouldbeabletomakesuchstatementsas:“Wethinktherearethreecoloursbecausewedrewthreedifferentcoloursinalloursamples.”“Wedrewonlyredandgreensowethinkthereareonlytwocoloursinthebag.”“Wethinktherearethreecolours,butweneverhadmorethan1blue,sowethinkthereisonly1blueinthebag.”
Tellthestudentsthatthereare9marblesinthebag,andaskiftheywanttochangetheirpredictions.
Oncethestudentshavewrittentheirpredictionsandreasons,havethegroupspairup.Eachpairofgroupsshouldexchangetheirpredictionsandreasons,thenconsideralltheirdatatogetherandadjusttheirpredictionsifnecessary.
Groupsshouldpresenttheirconclusionstotheclass.Usingallthedata,theclassshouldmakefinalpredictionsaboutthecontentsofthebag,andthenopenthebagstocheck.Ifpredictionsarenotaccurate,studentsshouldsuggestwhy.
Thistypeofsamplingissimilartothetypeusedbyscientistswhowanttodeterminethemakeupofapopulation.Givestudentsexamples,suchas:
“Abiologistmightwishtoknowhowmanyredsquirrelsandhowmanygreysquirrelsthereareinaforest”“Apersonplanningtoopenatoystoremightwanttoknowhowmany5-6yearolds,howmany7-10yearolds,andhowmany11-14yearoldsthereareintheneighborhoodnearhisplannedstore.”
Askstudentstosuggestotherexamples.
Asimplertypeofsamplingisusedtodeterminethesizeofapopulation.Forexample,abiologistmightwanttoknowhowmanytroutthereareinalake;astatisticianmightwanttoknowhowmanyadultsliveinaparticularcity;aninsuranceagentmightwanttoknowhowmanypeopleover60liveinhersalesarea.
Problem Solving
Communication
Page 22 Activity 4
Grade 6: Probability in Action Investigations in Probability
Activity 4: Pizzas and Dandelions
�����
BLM7presentssomesimplesamplingproblems.DistributeBLM7topairs/groupsandallowthemtimetothinkaboutanddiscusstheproblem.Iftheyseemtobehavingdifficulty,youmaywanttocomplete#1a)together.Studentsshouldseethattheyshould (i) countthenumberofpiecesineach‘sample’,and (ii) calculatetheaverage.Sincethereare8slicesofpizza,thenumberofpiecesonthewholepizzashouldbeabouteighttimesasmuchastheaveragenumberofpiecesononeslice.In#1a),theaverageisabout5piecesperslice.Studentsshouldrealizethatthisassumesthepepperonislicestobeevenlydistributed.
Notethatin#1c),itispossiblethatbothpizzasin#1a)andb)hadthesamenumberofpepperonislicessince (i) wedonotknowifthepepperonisliceswereevenlydistributed,and (ii) pizzamakerstrytoputthesamenumberofslicesoneachpizza.
Allowstudentstimetocalculate/estimatethetotalnumberofdandelionsin#2a)andb).
Askthemtosuggestothersituationsinwhichthistypeofsamplingmightbeused.
Ifstudentssuggestsuchthingsasestimatingthenumberofbearsinaforest,pointoutthatsituationsliketheseinvolvethingsthatmove(e.g.,bears,unlikepiecesofpepperonianddandelions,donottendtostayinonespot)andthatthesamplingtechniqueneedstobedifferent.
BLM8showsadifferentwayofsamplingthatisoftenusedinstudyingwildlife,ifyouwanttodeterminethesizeofapopulation.Drawagroup,countthenumberofitemsinthegroup,tagtheminsomeway,andreplacethem.Thistaggingisnecessarybecausetheanimalsbeingstudieddon’tstayputthewaypepperonislicesdo.Thenextstepistowaitforyourtaggedanimalstomixinwiththenon-taggedanimals.Thendrawasamplewhichwehopewillhavebothtaggedanduntaggedanimals.Theratiooftaggedtountaggedanimalsinthesampleisassumedtobeclosetotheratiooftaggedtountaggedanimalsinthewholepopulation.Sinceweknowthetotalnumberoftaggedanimals,wecanestimatethetotalnumberofanimals.
Forexample,supposewetag10animalsandreleasethem.Afterasuitablewaitforthemtomixwiththewholepopulation,wetakeasampleof10,anddiscoverthat2ofthese10aretagged.Thissuggeststhat2outof10animalsinthetotalpopulationaretagged.Sinceweinitiallytaggedatotalof10animals,
weconcludethat210
or15or20%ofthepopulationis10animals.Thereforewe
estimatethatthewholepopulationcontainsabout50animals,asfollows:
Problem Solving
tagged in sample
sample size
= total tagged
total population
Ideally, these ratios should be the same:
Activity 4 Page 23
Investigations in Probability Grade 6: Probability in Action
Activity 4: Pizzas and Dandelions
�����
20%ofthepopulationis10animals,so 100%is5 20× % or5 10× or50animals
DistributeBLM8andreadthroughitwithstudents.Workthrough#1-5asanexample,usingoneofthecontainersof‘wolves’.Thenhavepairsorgroupsofstudentscompletetheactivity.Oncestudentshavemadeafinalestimate(#8)theyshouldcountthetotalnumberofitemsinthecontainertoseehowclosetheir‘estimated’totalwas.
Askwhybiologistsmightwanttotakemorethanonesample,asthestudentsdid.Elicittheideathatmoresamplesshouldgiveestimatesclosertotheactualnumber.
Askstudentstodescribeothersituationsinwhichthistypeofsamplingwouldbeuseful.
Cross-Curricular Activities:1. Adifferenttypeofsamplingisusedwhentryingtodeterminethemakeupof
apopulation,forexample,todeterminethenumberofred,grey,andblacksquirrelsinacertainarea.
DistributecopiesofBLM9andhavestudentsworkinpairs/groupstocompletetheActivity.
2. Thisactivityusesaninflatableorlight-weightglobe.Ifyoudonothaveone,sketchthecontinentsandothermajorlandmassesonabeachball.
Studentstosstheballtoeachother.Wheneversomeonecatchestheballhe/shelookstoseeifhis/herrightthumbisonlandorwater.
Recordthenumberoftimesathumbisfoundonlandandthenumberoftimesthethumbisonwater.
Askstudentswhatconclusionstheycandrawfromthis.(e.g.,“Thereismorewaterthanlandonearth.”“Theprobabilityoflandingonwaterisgreaterthantheprobabilityoflandingonland.”)
Studentscouldinvestigatethepercentoflandandwateronearthorthepercentoflandandwaterforindividualcontinentsorcountriesusingencyclopediasorgeographybooks.
Studentscouldtrytofindphotosofearthtakenfromspacebyastronautsorsatellites.Thentheycouldcomparetheirfindingswiththepercentageof“thumb-landings”onlandversuswaterintheactivity.
Other Resources:Foradditionalideas,seeannotated“OtherResources”listonpage57,numberedasbelow.
12.“WhatAreMyChances?”CreativePublications18.“DataandChance”,NCTM
Communication
Page 24 Activity 5
Grade 6: Probability in Action Investigations in Probability
Activity 5: Random or Not?
�����
Activity:
• randomnumbersandthemeaningofrandomness
What to Assess:• accuracyofdatacollection• understandingoftheconceptofrandomness• collaborationwithothers
Preparation: • makecopiesofBLMs10and11.• makecopiesofBLMs12and13(optional)• haveavailabledictionaries,andcopiesofRoget’sThesaurus• providepagesfromatelephonebook• provideastandarddieforeachstudentpair/group.Ifdicearenotavailable,
providecopiesofBLM14andhavestudentsconstructspinners.• makecopiesofBLM16ifyouwishstudentstohavenotesonrandom
numbers
Tellstudentsthatpreviousactivitieshaveinvolvedselectingitems“atrandom”.Askwhattheythinkisthemeaningoftheword“random”.Havestudentsinvestigatethewordindictionariesorathesaurus.(SeeBLM16)Havestudentsdescribeeventsthatmightbecalled‘random’ifthedictionarymeaningisused.
Mathematiciansusethewordinapreciseway.Sometimesasetofrandomnumbersisusedtoselectitemstobesurethattheyarenotchoseninanydeliberateway.Inasetofrandomnumberseverynumberstandsanequalchanceofoccurringandtheoccurrenceofanynumberisnotdependentontheoccurrenceofanyothernumber.
Forexample,inalistof200randomone-digitnumbers,wewouldexpecttofindapproximatelytwentyofeachdigitfrom0to9,andthesewouldbescatteredthroughoutthelistof200digitswithnoapparentpattern.
Inordertoexploretheideaofrandomnessfurther,distributeBLM10tostudentsandinstructthemtocompletethefirstsetofnumbersbywriting“0”or“1”ineachbox,startingatthetopleftandworkingacrosstherowsoneatatime.Theyshouldtrytowritethenumbersatrandom(i.e.withoutanypattern).Youmaywishtogiveatimelimitsothatstudentsdonothavetimetocountthedigitsastheyarewritingortoplantheirplacement.
‘BLM’ refers to theBlack Line Masters,which follow theseActivity Notes.
Focus of Activity:
Activity 5 Page 25
Investigations in Probability Grade 6: Probability in Action
Activity 5: Random or Not?
�����
Whenstudentshavecompletedthetaskhavethemcountthenumberofeachdigit(#2onBLM10).Ifthelistisrandom,‘0’shouldoccurapproximatelyasoftenas‘1’.Havestudentswriterepliesto#3onthebackofBLM10.
Askstudentshowmanyofthemhadapproximatelythesamenumberofzerosandones.Ifthedigitswereequallydistributedtherewouldbe24ofeach.Inpractice,a23to25splitor22to26oreven21to27shouldbeconsideredas“approximatelythesamenumberofeach”.
Youmaywishtocollectdatafromallpairs/groupsonthechalkboard,andcomparethetotalnumberofzerostothetotalnumberofones.Ifoneoftheseappearsmoreoftenthantheother,askstudentswhythismighthavehappened.Whatweretheythinkingastheywrotethedigits?Wassomethingmakingthemthinkofonenumbermoreoftenthantheother?
Countingthenumbersofzerosandonesisonetestofrandomness,i.e.testingforanequaldistributionofitems(thezeroandone).
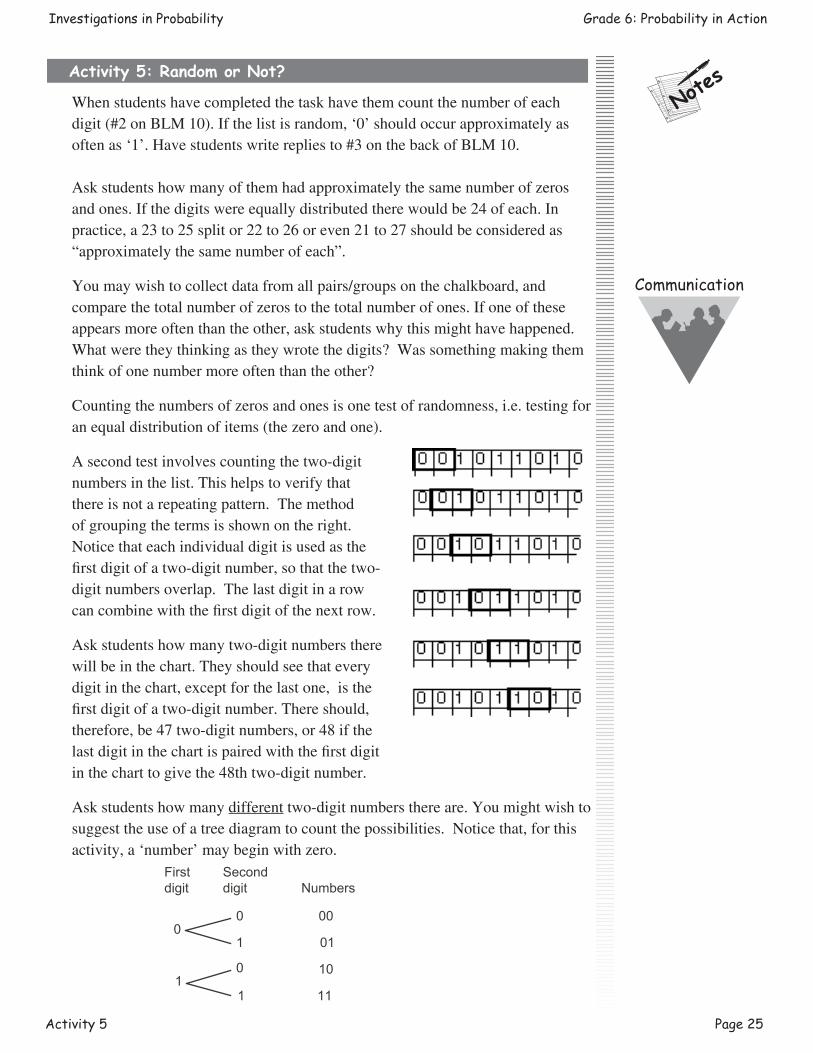
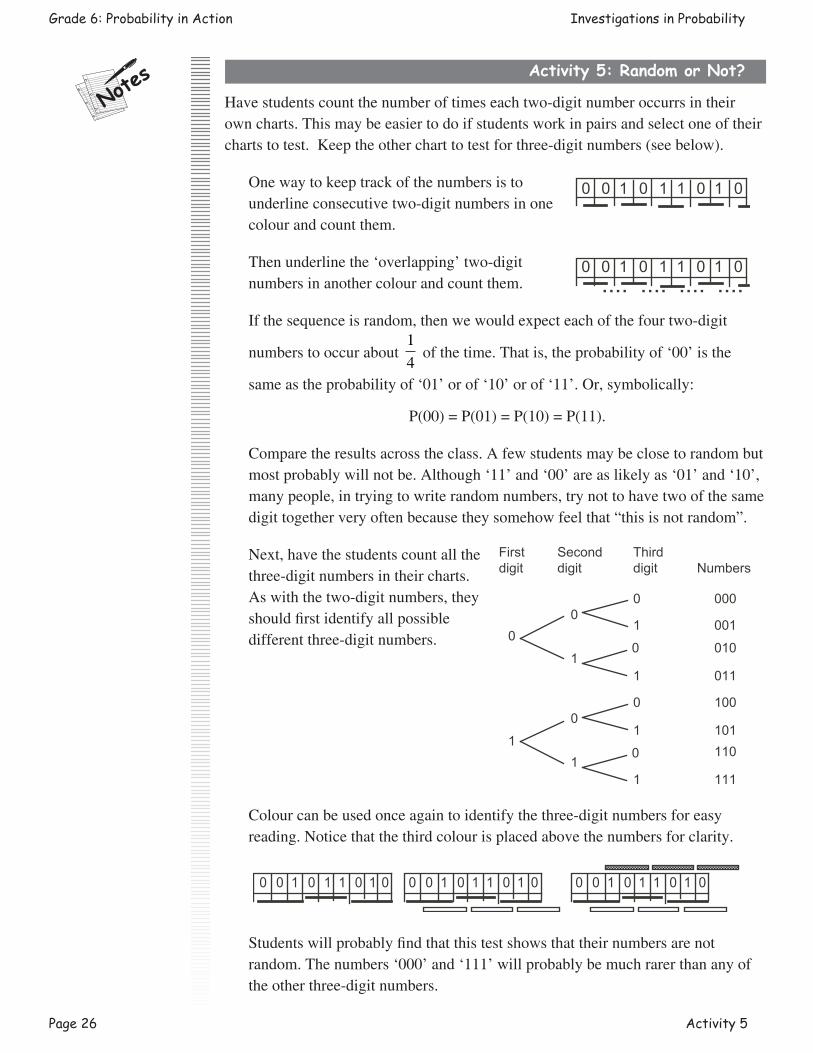
Asecondtestinvolvescountingthetwo-digitnumbersinthelist.Thishelpstoverifythatthereisnotarepeatingpattern.Themethodofgroupingthetermsisshownontheright.Noticethateachindividualdigitisusedasthefirstdigitofatwo-digitnumber,sothatthetwo-digitnumbersoverlap.Thelastdigitinarowcancombinewiththefirstdigitofthenextrow.
Askstudentshowmanytwo-digitnumberstherewillbeinthechart.Theyshouldseethateverydigitinthechart,exceptforthelastone,isthefirstdigitofatwo-digitnumber.Thereshould,therefore,be47two-digitnumbers,or48ifthelastdigitinthechartispairedwiththefirstdigitinthecharttogivethe48thtwo-digitnumber.
Askstudentshowmanydifferenttwo-digitnumbersthereare.Youmightwishtosuggesttheuseofatreediagramtocountthepossibilities.Noticethat,forthisactivity,a‘number’maybeginwithzero.
00
1
First digit
Second digit Numbers
00
10
1
01
10
11
Communication
Page 26 Activity 5
Grade 6: Probability in Action Investigations in Probability
Activity 5: Random or Not?
�����
Havestudentscountthenumberoftimeseachtwo-digitnumberoccurrsintheirowncharts.Thismaybeeasiertodoifstudentsworkinpairsandselectoneoftheirchartstotest.Keeptheothercharttotestforthree-digitnumbers(seebelow).
Onewaytokeeptrackofthenumbersistounderlineconsecutivetwo-digitnumbersinonecolourandcountthem.
Thenunderlinethe‘overlapping’two-digitnumbersinanothercolourandcountthem.
Ifthesequenceisrandom,thenwewouldexpecteachofthefourtwo-digit
numberstooccurabout14ofthetime.Thatis,theprobabilityof‘00’isthe
sameastheprobabilityof‘01’orof‘10’orof‘11’.Or,symbolically:
P(00)=P(01)=P(10)=P(11).
Comparetheresultsacrosstheclass.Afewstudentsmaybeclosetorandombutmostprobablywillnotbe.Although‘11’and‘00’areaslikelyas‘01’and‘10’,manypeople,intryingtowriterandomnumbers,trynottohavetwoofthesamedigittogetherveryoftenbecausetheysomehowfeelthat“thisisnotrandom”.
Next,havethestudentscountallthethree-digitnumbersintheircharts.Aswiththetwo-digitnumbers,theyshouldfirstidentifyallpossibledifferentthree-digitnumbers.
Colourcanbeusedonceagaintoidentifythethree-digitnumbersforeasyreading.Noticethatthethirdcolourisplacedabovethenumbersforclarity.
Studentswillprobablyfindthatthistestshowsthattheirnumbersarenotrandom.Thenumbers‘000’and‘111’willprobablybemuchrarerthananyoftheotherthree-digitnumbers.
0 0 1 0 1 1 0 1 0.... .... .... ....
00
1
First digit
Second digit Numbers
000
001
010
011
Third digit
0
1
0
1
1
0
1
100
101110
111
0
1
0
1
0 0 1 0 1 1 0 1 0
0 0 1 0 1 1 0 1 0 0 0 1 0 1 1 0 1 0 0 0 1 0 1 1 0 1 0
Activity 5 Page 27
Investigations in Probability Grade 6: Probability in Action
Activity 5: Random or Not?
�����
DistributecopiesofBLM11.Studentsshouldworkinpairsorgroupstocompleteit.BLM11illustratestwopossiblemethodsofgeneratingrandomnumbers.Studentsshouldtestbothtechniquesbycountingthesingledigitsandthetwo-digitnumbersinthecharts.Thedieshouldgeneratenumbersthatprovetoberandom.Manytelephonepageswill,aswell,butsomemayshowabias.
Optional
Randomnumberscanbeusedtosimulateexperiments.SeeCross-curricularActivities.
Extensions in Mathematics:1. StudentsshouldconstructachartsimilartotheoneonBLM11inwhichto
recordtherollsofthedie.Sincetheywillberecordingsixdifferentdigits,ratherthanjust0and1,thechartshouldhavespaceformorethan48digits.Alternatively,eachgroupcanrecord48digitsandthentwogroupsorthewholeclasscancombinetheirresultsbeforetestingforrandomness.
2. Generateasetofrandomnumbersusingaprogrammablecalculatororacomputer.See“OtherResources”(#16)foranactivityusingLogosoftware.
3. Describehowyoucoulduseacointogenerateasetofrandomnumbers.
Cross-curricular Activities:1. AsimulationexerciseusingrandomnumbertablesisoutlinedonBLM12.This
simulationinvolvesanalyzingalotterybasedon#1,BLM5,fromActivity3.AnextensiverandomnumbertableisgivenonBLM13.
2. Apoliticianwantstopollhisconstituents.Howcouldhe/sheusearandomnumbertabletoassistinselectingthesampletowhomthequestionnairewillbesent?Hint:Thepoliticianwillhavealistofnamesandaddressesofpeopleinhis/herriding.
3. Explainhowarandomnumbertablecouldbeusedforeachofthefollowing: (a) choosingnumbersforalotteryticket; (b) selectingpeopleononestreettoreceivefreesamplesofanewproduct; (c) choosingstudentsinyourschooltoansweraquestionnaureabouthome
work.
Family Activities:1. Studentscouldhavefamilymemberstrytowriterandomzeroesandonesas
onBLM10.Theycouldhavea“contest”toseewhichfamilymembercameclosesttowritingrandomnumbers.
Page 28 Activity 5
Grade 6: Probability in Action Investigations in Probability
Activity 5: Random or Not?
�����
Other Resources:Foradditionalideas,seeannotated“OtherResources”listonpage57,numberedasbelow.
8. “MakingSenseofData:AddendaSeries,GradesK-6”,MaryLindquistetal.14.“ExploringRandomNumbers”,WilliamR.Speer16.“LookingatRandomEventswithLogoSoftware”,ThorCharischakand RobertBerkman
Black Line Masters Page 29
Investigations in Probability Grade 6: Probability in Action
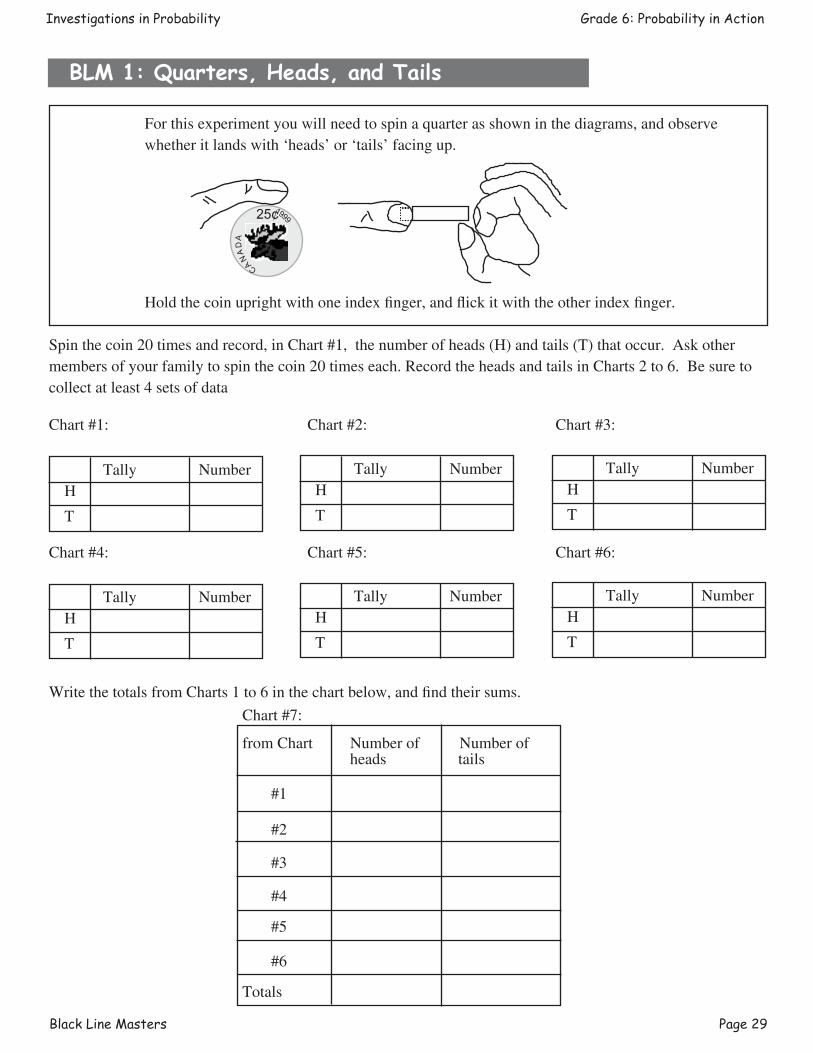
Chart #7:
from Chart Number of Number of heads tails
#1
#2
#3
#4
#5 #6
Totals
For this experiment you will need to spin a quarter as shown in the diagrams, and observe
whether it lands with ‘heads’ or ‘tails’ facing up.
Hold the coin upright with one index finger, and flick it with the other index finger.
Spin the coin 20 times and record, in Chart #1, the number of heads (H) and tails (T) that occur. Ask other members of your family to spin the coin 20 times each. Record the heads and tails in Charts 2 to 6. Be sure to collect at least 4 sets of data
Chart #1: Chart #2: Chart #3:
Chart #4: Chart #5: Chart #6:
BLM 1: Quarters, Heads, and Tails
Tally Number H
T
Tally Number H
T
Tally Number H
T
Tally Number H
T
Tally Number H
T
Tally Number H
T
Write the totals from Charts 1 to 6 in the chart below, and find their sums.
25
C A
NA
DA
1999
Page 30 Black Line Masters
Grade 6: Probability in Action Investigations in Probability
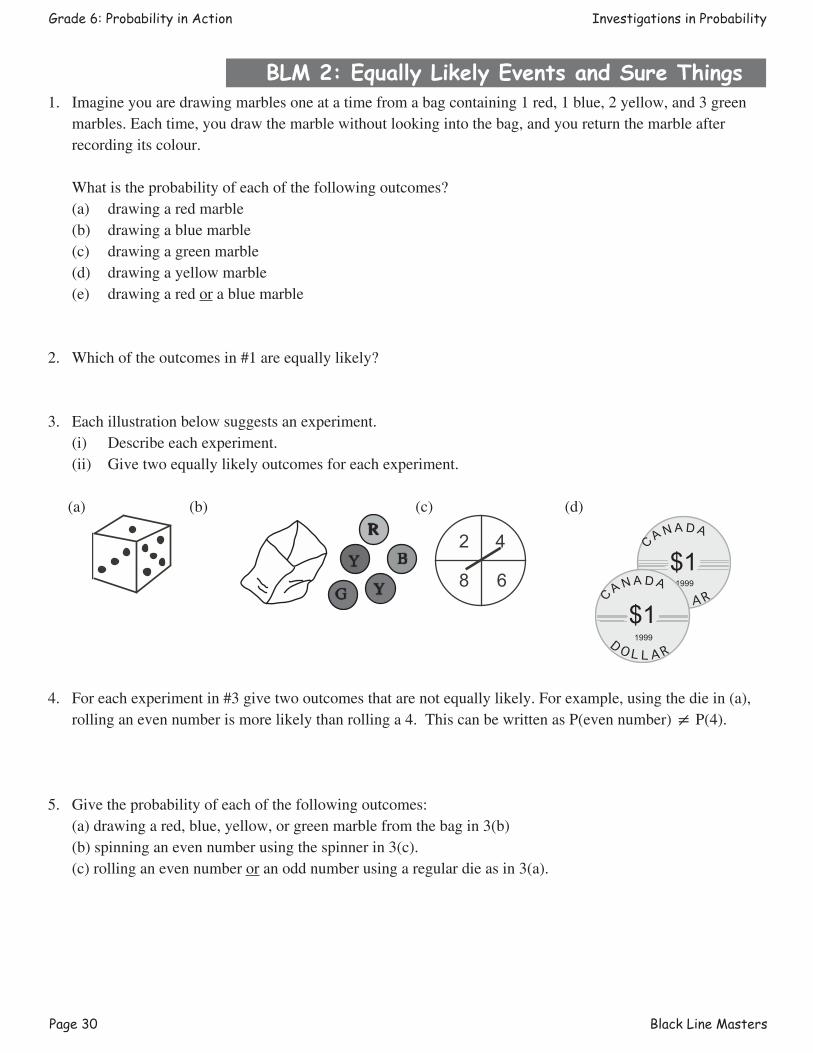
1. Imagine you are drawing marbles one at a time from a bag containing 1 red, 1 blue, 2 yellow, and 3 green marbles. Each time, you draw the marble without looking into the bag, and you return the marble after recording its colour.
What is the probability of each of the following outcomes? (a) drawing a red marble (b) drawing a blue marble (c) drawing a green marble (d) drawing a yellow marble (e) drawing a red or a blue marble
2. Which of the outcomes in #1 are equally likely?
3. Each illustration below suggests an experiment. (i) Describe each experiment. (ii) Give two equally likely outcomes for each experiment.
(a) (b) (c) (d)
4. For each experiment in #3 give two outcomes that are not equally likely. For example, using the die in (a), rolling an even number is more likely than rolling a 4. This can be written as P(even number) ≠ P(4).
5. Give the probability of each of the following outcomes: (a) drawing a red, blue, yellow, or green marble from the bag in 3(b) (b) spinning an even number using the spinner in 3(c). (c) rolling an even number or an odd number using a regular die as in 3(a).
BLM 2: Equally Likely Events and Sure Things
����������������������
$11999
C A N A D A
�������������������
$11999
C A N A D A
42
8 6
Black Line Masters Page 31
Investigations in Probability Grade 6: Probability in Action
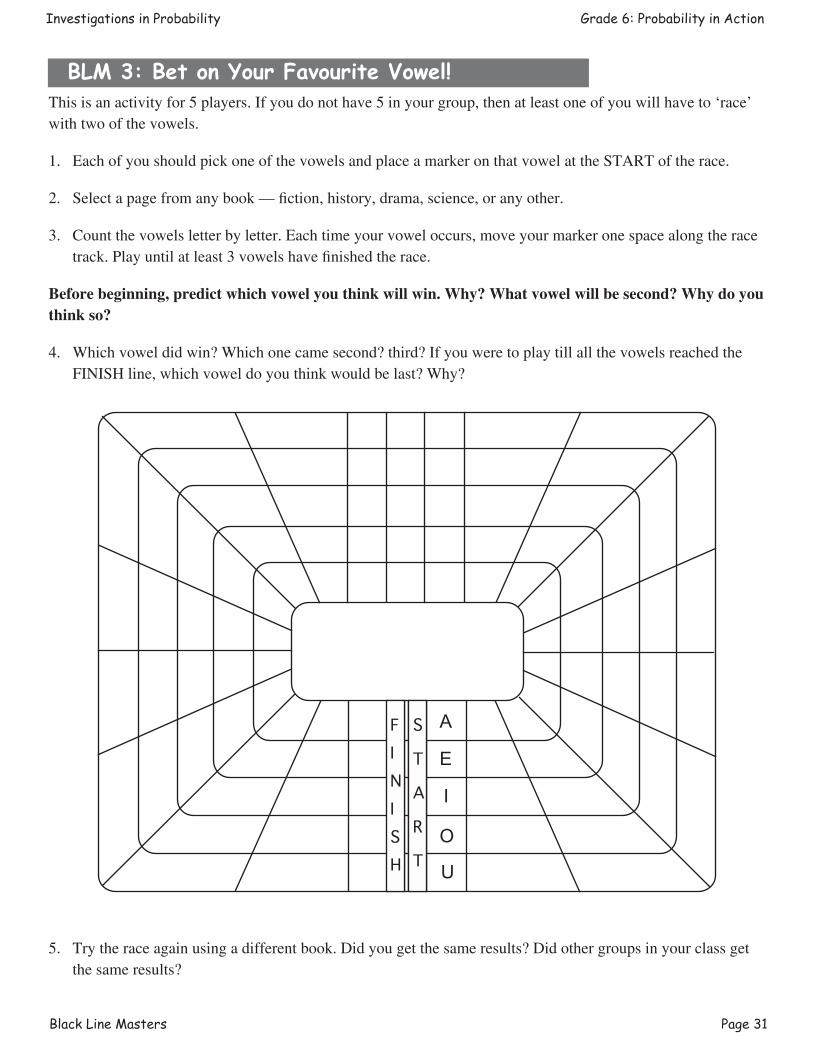
BLM 3: Bet on Your Favourite Vowel!This is an activity for 5 players. If you do not have 5 in your group, then at least one of you will have to ‘race’ with two of the vowels.
1. Each of you should pick one of the vowels and place a marker on that vowel at the START of the race.
2. Select a page from any book — fiction, history, drama, science, or any other.
3. Count the vowels letter by letter. Each time your vowel occurs, move your marker one space along the race track. Play until at least 3 vowels have finished the race.
Before beginning, predict which vowel you think will win. Why? What vowel will be second? Why do you think so?
4. Which vowel did win? Which one came second? third? If you were to play till all the vowels reached the FINISH line, which vowel do you think would be last? Why?
5. Try the race again using a different book. Did you get the same results? Did other groups in your class get the same results?
���������������������
������������������
A
E
I
O
U
Page 32 Black Line Masters
Grade 6: Probability in Action Investigations in Probability
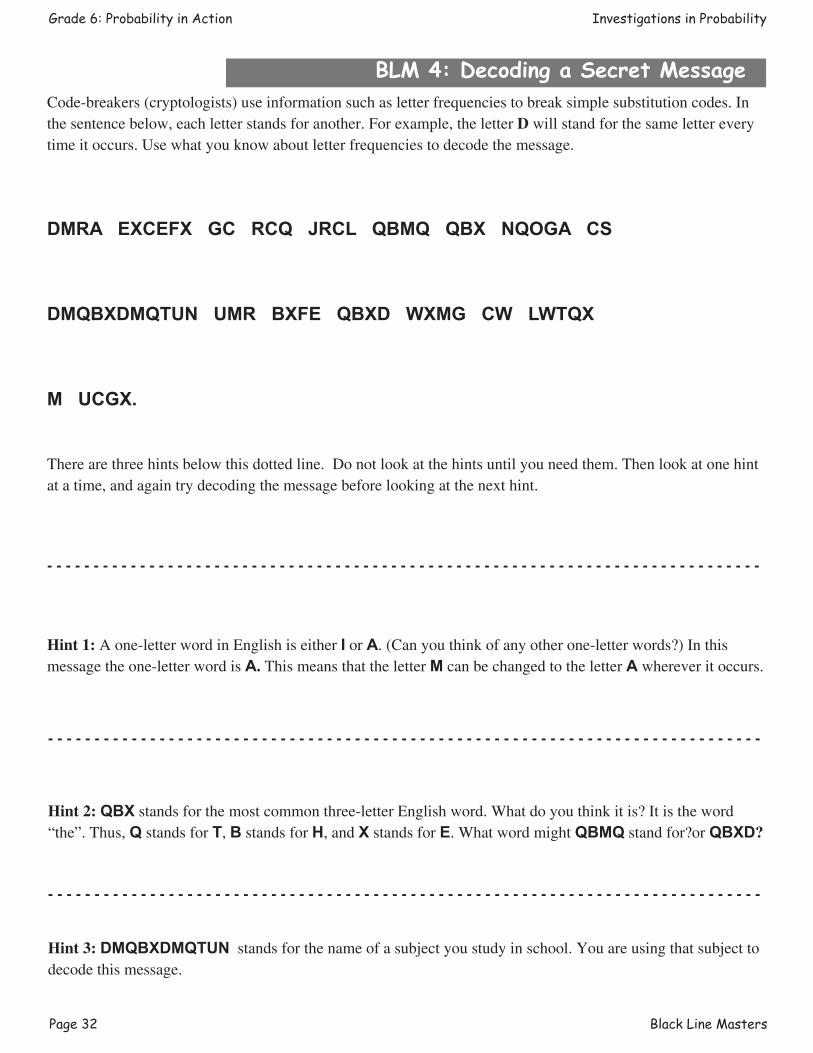
BLM 4: Decoding a Secret MessageCode-breakers (cryptologists) use information such as letter frequencies to break simple substitution codes. In the sentence below, each letter stands for another. For example, the letter D will stand for the same letter every time it occurs. Use what you know about letter frequencies to decode the message.
DMRA EXCEFX GC RCQ JRCL QBMQ QBX NQOGA CS
DMQBXDMQTUN UMR BXFE QBXD WXMG CW LWTQX
M UCGX.
There are three hints below this dotted line. Do not look at the hints until you need them. Then look at one hint at a time, and again try decoding the message before looking at the next hint.
- - - - - - - - - - - - - - - - - - - - - - - - - - - - - - - - - - - - - - - - - - - - - - - - - - - - - - - - - - - - - - - - - - - - - - - - - - - - -
Hint 1: A one-letter word in English is either I or A. (Can you think of any other one-letter words?) In this message the one-letter word is A. This means that the letter M can be changed to the letter A wherever it occurs.
- - - - - - - - - - - - - - - - - - - - - - - - - - - - - - - - - - - - - - - - - - - - - - - - - - - - - - - - - - - - - - - - - - - - - - - - - - - - -
Hint 2: QBX stands for the most common three-letter English word. What do you think it is? It is the word “the”. Thus, Q stands for T, B stands for H, and X stands for E. What word might QBMQ stand for?or QBXD?
- - - - - - - - - - - - - - - - - - - - - - - - - - - - - - - - - - - - - - - - - - - - - - - - - - - - - - - - - - - - - - - - - - - - - - - - - - - - -
Hint 3: DMQBXDMQTUN stands for the name of a subject you study in school. You are using that subject to decode this message.
Black Line Masters Page 33
Investigations in Probability Grade 6: Probability in Action
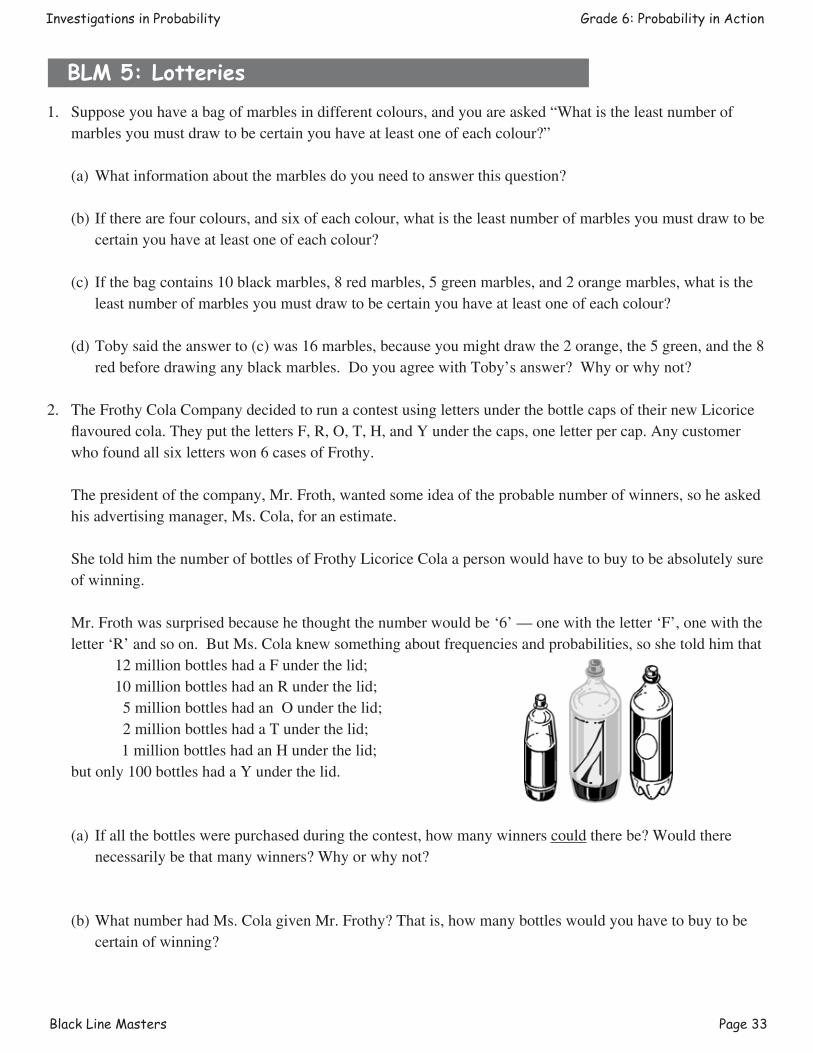
BLM 5: Lotteries
1. Suppose you have a bag of marbles in different colours, and you are asked “What is the least number of marbles you must draw to be certain you have at least one of each colour?”
(a) What information about the marbles do you need to answer this question?
(b) If there are four colours, and six of each colour, what is the least number of marbles you must draw to be certain you have at least one of each colour?
(c) If the bag contains 10 black marbles, 8 red marbles, 5 green marbles, and 2 orange marbles, what is the least number of marbles you must draw to be certain you have at least one of each colour?
(d) Toby said the answer to (c) was 16 marbles, because you might draw the 2 orange, the 5 green, and the 8 red before drawing any black marbles. Do you agree with Toby’s answer? Why or why not?
2. The Frothy Cola Company decided to run a contest using letters under the bottle caps of their new Licorice flavoured cola. They put the letters F, R, O, T, H, and Y under the caps, one letter per cap. Any customer who found all six letters won 6 cases of Frothy.
The president of the company, Mr. Froth, wanted some idea of the probable number of winners, so he asked his advertising manager, Ms. Cola, for an estimate.
She told him the number of bottles of Frothy Licorice Cola a person would have to buy to be absolutely sure of winning.
Mr. Froth was surprised because he thought the number would be ‘6’ — one with the letter ‘F’, one with the letter ‘R’ and so on. But Ms. Cola knew something about frequencies and probabilities, so she told him that
12 million bottles had a F under the lid; 10 million bottles had an R under the lid; 5 million bottles had an O under the lid; 2 million bottles had a T under the lid; 1 million bottles had an H under the lid; but only 100 bottles had a Y under the lid.
(a) If all the bottles were purchased during the contest, how many winners could there be? Would there necessarily be that many winners? Why or why not?
(b) What number had Ms. Cola given Mr. Frothy? That is, how many bottles would you have to buy to be certain of winning?
Page 34 Black Line Masters
Grade 6: Probability in Action Investigations in Probability
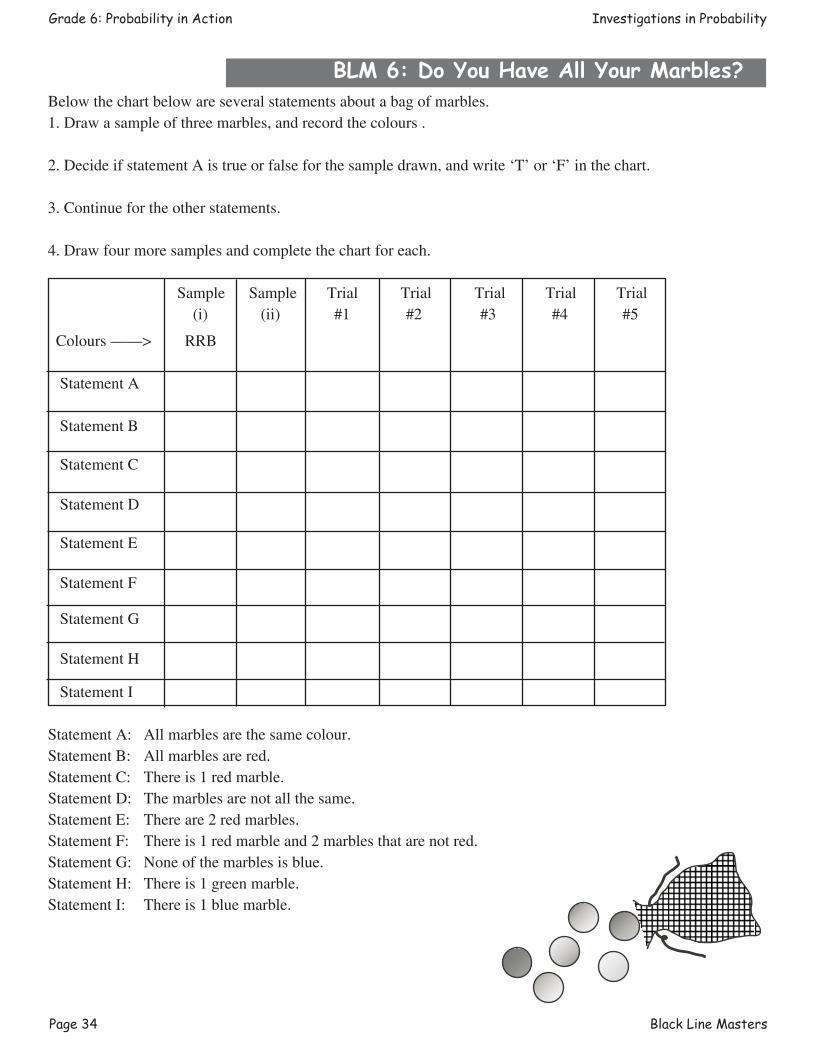
BLM 6: Do You Have All Your Marbles?Below the chart below are several statements about a bag of marbles. 1. Draw a sample of three marbles, and record the colours .
2. Decide if statement A is true or false for the sample drawn, and write ‘T’ or ‘F’ in the chart.
3. Continue for the other statements.
4. Draw four more samples and complete the chart for each.
Sample Sample Trial Trial Trial Trial Trial (i) (ii) #1 #2 #3 #4 #5 Colours ——> RRB
Statement A
Statement B
Statement C
Statement D
Statement E
Statement F
Statement G
Statement H
Statement I
Statement A: All marbles are the same colour.Statement B: All marbles are red.Statement C: There is 1 red marble.Statement D: The marbles are not all the same.Statement E: There are 2 red marbles.Statement F: There is 1 red marble and 2 marbles that are not red.Statement G: None of the marbles is blue.Statement H: There is 1 green marble.Statement I: There is 1 blue marble.
Black Line Masters Page 35
Investigations in Probability Grade 6: Probability in Action
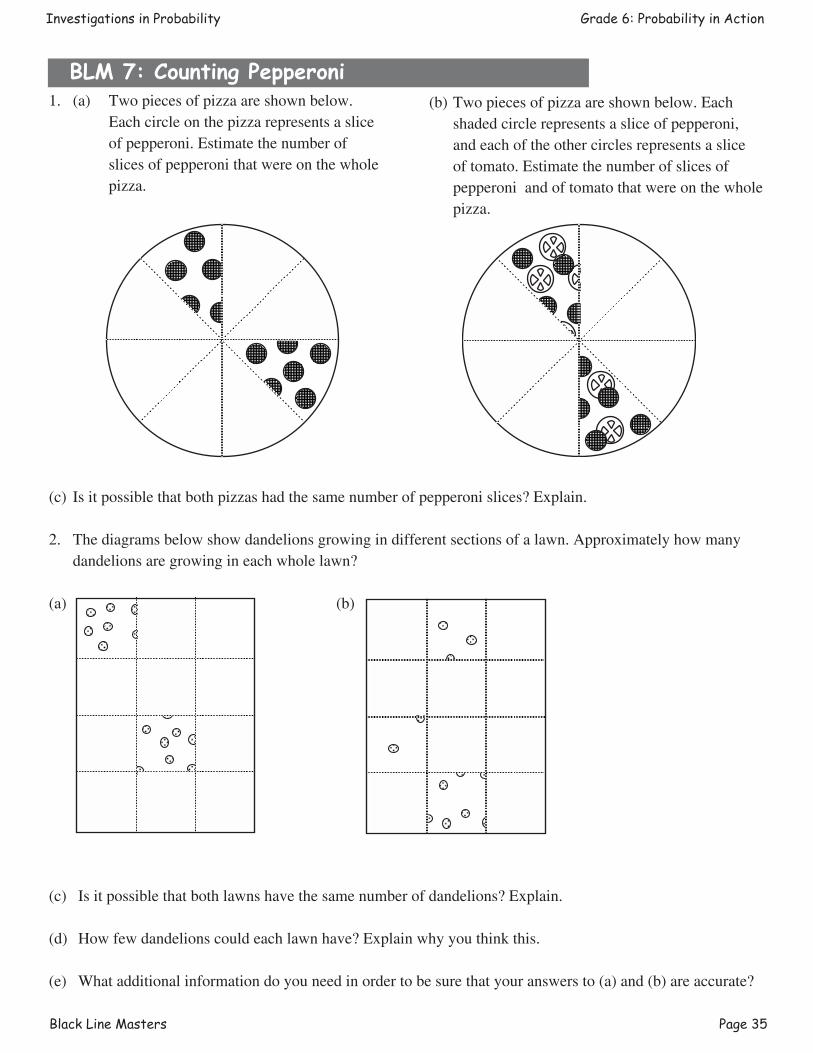
BLM 7: Counting Pepperoni1. (a) Two pieces of pizza are shown below.
Each circle on the pizza represents a slice of pepperoni. Estimate the number of slices of pepperoni that were on the whole pizza.
(c) Is it possible that both pizzas had the same number of pepperoni slices? Explain.
2. The diagrams below show dandelions growing in different sections of a lawn. Approximately how many dandelions are growing in each whole lawn?
(a) (b)
(c) Is it possible that both lawns have the same number of dandelions? Explain.
(d) How few dandelions could each lawn have? Explain why you think this.
(e) What additional information do you need in order to be sure that your answers to (a) and (b) are accurate?
(b) Two pieces of pizza are shown below. Each shaded circle represents a slice of pepperoni, and each of the other circles represents a slice of tomato. Estimate the number of slices of pepperoni and of tomato that were on the whole pizza.
Page 36 Black Line Masters
Grade 6: Probability in Action Investigations in Probability
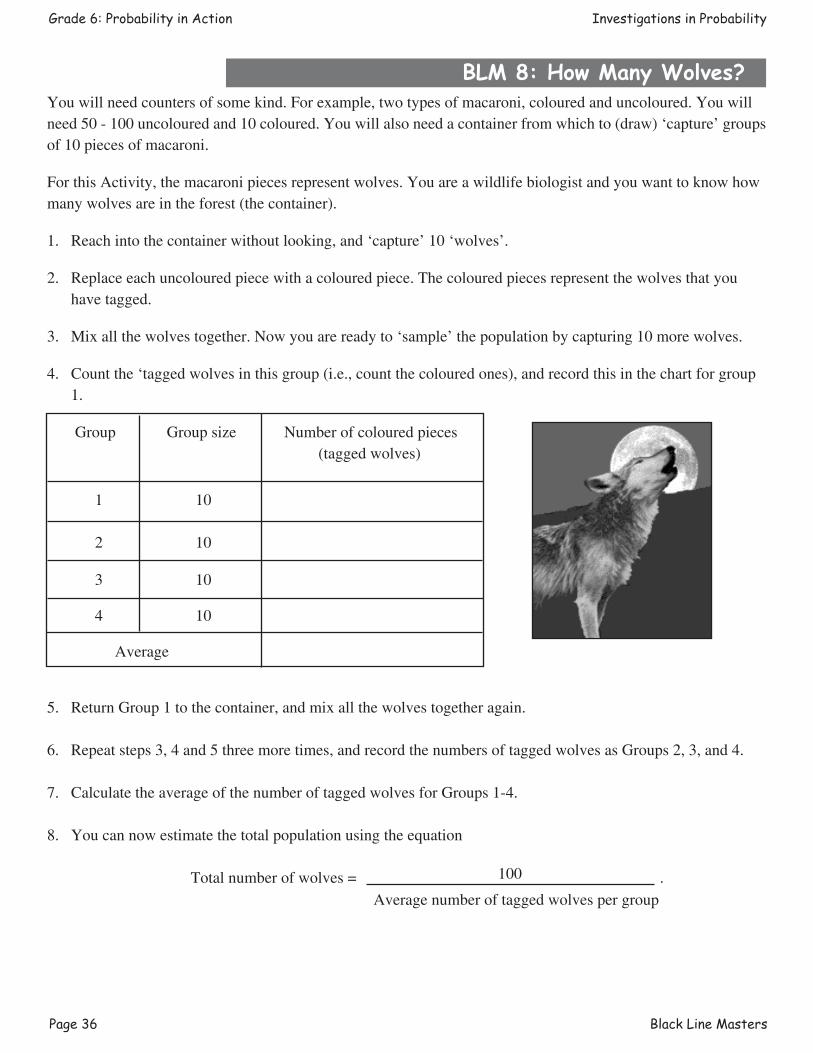
BLM 8: How Many Wolves?You will need counters of some kind. For example, two types of macaroni, coloured and uncoloured. You will need 50 - 100 uncoloured and 10 coloured. You will also need a container from which to (draw) ‘capture’ groups of 10 pieces of macaroni.
For this Activity, the macaroni pieces represent wolves. You are a wildlife biologist and you want to know how many wolves are in the forest (the container).
1. Reach into the container without looking, and ‘capture’ 10 ‘wolves’.
2. Replace each uncoloured piece with a coloured piece. The coloured pieces represent the wolves that you have tagged.
3. Mix all the wolves together. Now you are ready to ‘sample’ the population by capturing 10 more wolves.
4. Count the ‘tagged wolves in this group (i.e., count the coloured ones), and record this in the chart for group 1.
Group Group size Number of coloured pieces (tagged wolves)
1 10
2 10
3 10
4 10
Average
5. Return Group 1 to the container, and mix all the wolves together again. 6. Repeat steps 3, 4 and 5 three more times, and record the numbers of tagged wolves as Groups 2, 3, and 4.
7. Calculate the average of the number of tagged wolves for Groups 1-4.
8. You can now estimate the total population using the equation
Total number of wolves = .100
Average number of tagged wolves per group
Black Line Masters Page 37
Investigations in Probability Grade 6: Probability in Action
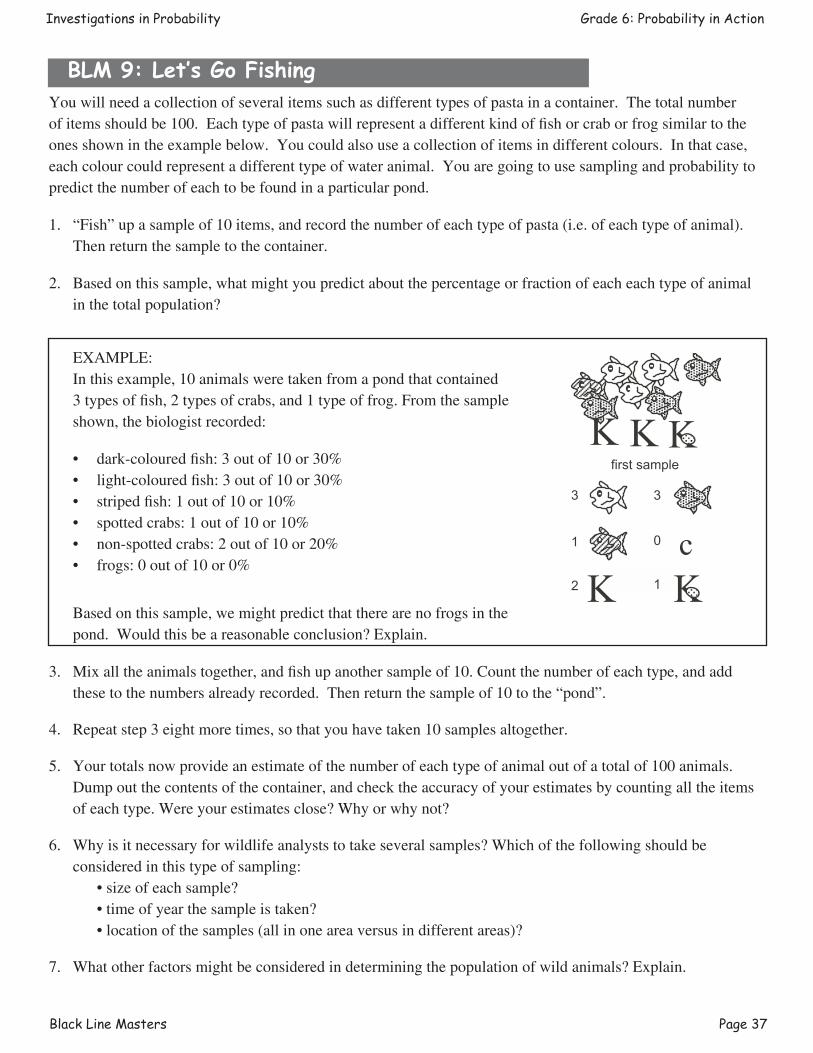
You will need a collection of several items such as different types of pasta in a container. The total number of items should be 100. Each type of pasta will represent a different kind of fish or crab or frog similar to the ones shown in the example below. You could also use a collection of items in different colours. In that case, each colour could represent a different type of water animal. You are going to use sampling and probability to predict the number of each to be found in a particular pond.
1. “Fish” up a sample of 10 items, and record the number of each type of pasta (i.e. of each type of animal). Then return the sample to the container.
2. Based on this sample, what might you predict about the percentage or fraction of each each type of animal in the total population?
EXAMPLE: In this example, 10 animals were taken from a pond that contained
3 types of fish, 2 types of crabs, and 1 type of frog. From the sample shown, the biologist recorded:
• dark-coloured fish: 3 out of 10 or 30% • light-coloured fish: 3 out of 10 or 30% • striped fish: 1 out of 10 or 10% • spotted crabs: 1 out of 10 or 10% • non-spotted crabs: 2 out of 10 or 20% • frogs: 0 out of 10 or 0%
Based on this sample, we might predict that there are no frogs in the pond. Would this be a reasonable conclusion? Explain.
3. Mix all the animals together, and fish up another sample of 10. Count the number of each type, and add these to the numbers already recorded. Then return the sample of 10 to the “pond”.
4. Repeat step 3 eight more times, so that you have taken 10 samples altogether.
5. Your totals now provide an estimate of the number of each type of animal out of a total of 100 animals. Dump out the contents of the container, and check the accuracy of your estimates by counting all the items of each type. Were your estimates close? Why or why not?
6. Why is it necessary for wildlife analysts to take several samples? Which of the following should be considered in this type of sampling:
• size of each sample? • time of year the sample is taken? • location of the samples (all in one area versus in different areas)?
7. What other factors might be considered in determining the population of wild animals? Explain.
BLM 9: Let’s Go Fishing
first sample
c
K K K3 3
1 0
2 1K K
Page 38 Black Line Masters
Grade 6: Probability in Action Investigations in Probability
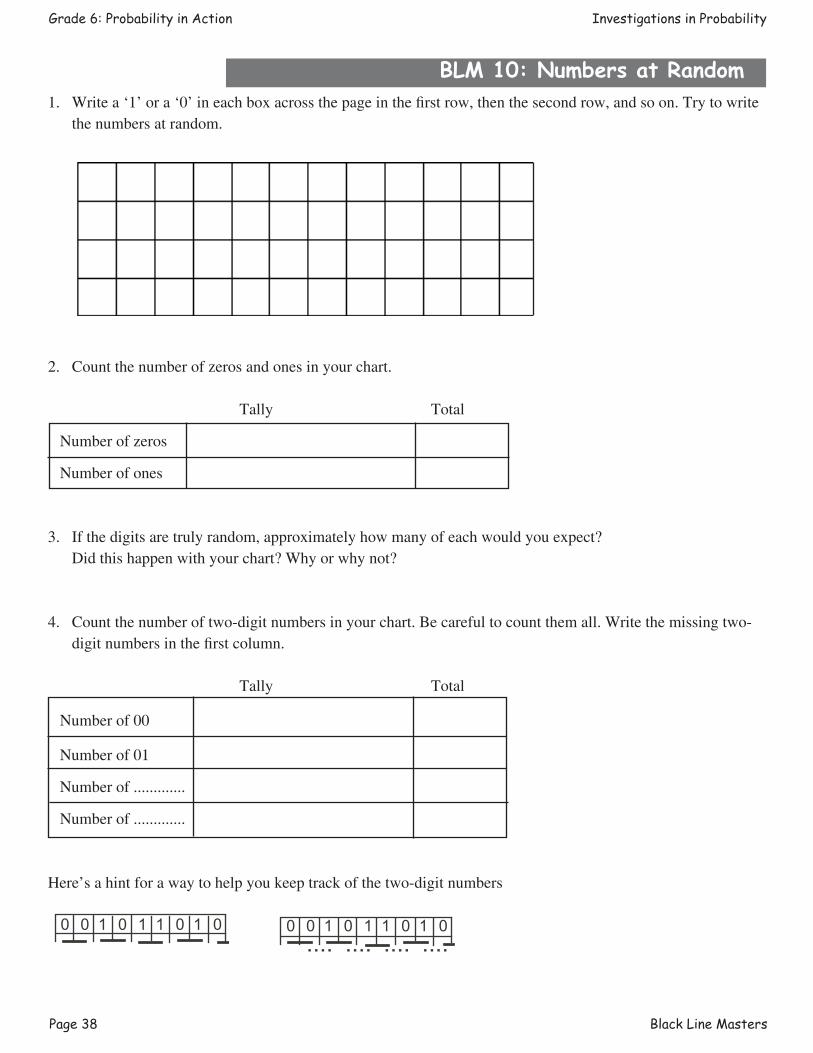
BLM 10: Numbers at Random1. Write a ‘1’ or a ‘0’ in each box across the page in the first row, then the second row, and so on. Try to write
the numbers at random.
2. Count the number of zeros and ones in your chart.
Tally Total
Number of zeros
Number of ones
3. If the digits are truly random, approximately how many of each would you expect? Did this happen with your chart? Why or why not?
4. Count the number of two-digit numbers in your chart. Be careful to count them all. Write the missing two-digit numbers in the first column.
Tally Total
Number of 00
Number of 01
Number of .............
Number of .............
Here’s a hint for a way to help you keep track of the two-digit numbers
0 0 1 0 1 1 0 1 0 0 0 1 0 1 1 0 1 0.... .... .... ....
Black Line Masters Page 39
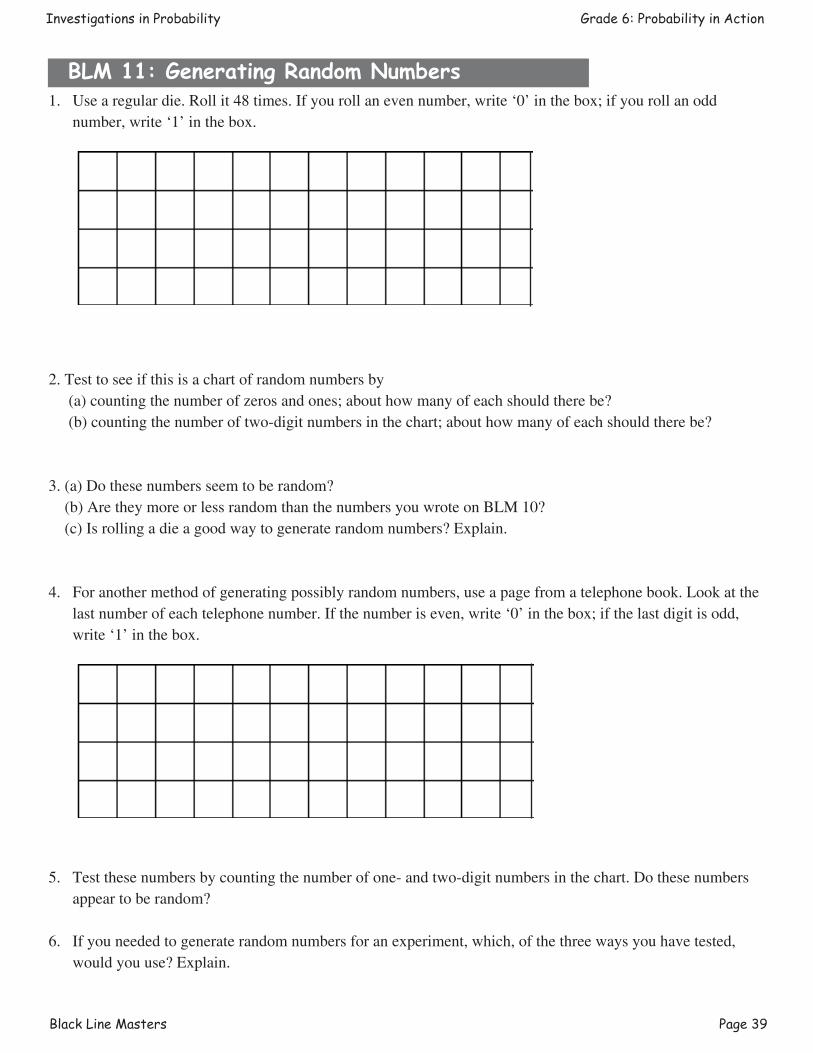
Investigations in Probability Grade 6: Probability in Action
1. Use a regular die. Roll it 48 times. If you roll an even number, write ‘0’ in the box; if you roll an odd number, write ‘1’ in the box.
2. Test to see if this is a chart of random numbers by (a) counting the number of zeros and ones; about how many of each should there be? (b) counting the number of two-digit numbers in the chart; about how many of each should there be?
3. (a) Do these numbers seem to be random? (b) Are they more or less random than the numbers you wrote on BLM 10? (c) Is rolling a die a good way to generate random numbers? Explain.
4. For another method of generating possibly random numbers, use a page from a telephone book. Look at the last number of each telephone number. If the number is even, write ‘0’ in the box; if the last digit is odd, write ‘1’ in the box.
5. Test these numbers by counting the number of one- and two-digit numbers in the chart. Do these numbers appear to be random?
6. If you needed to generate random numbers for an experiment, which, of the three ways you have tested, would you use? Explain.
BLM 11: Generating Random Numbers
Page 40 Black Line Masters
Grade 6: Probability in Action Investigations in Probability
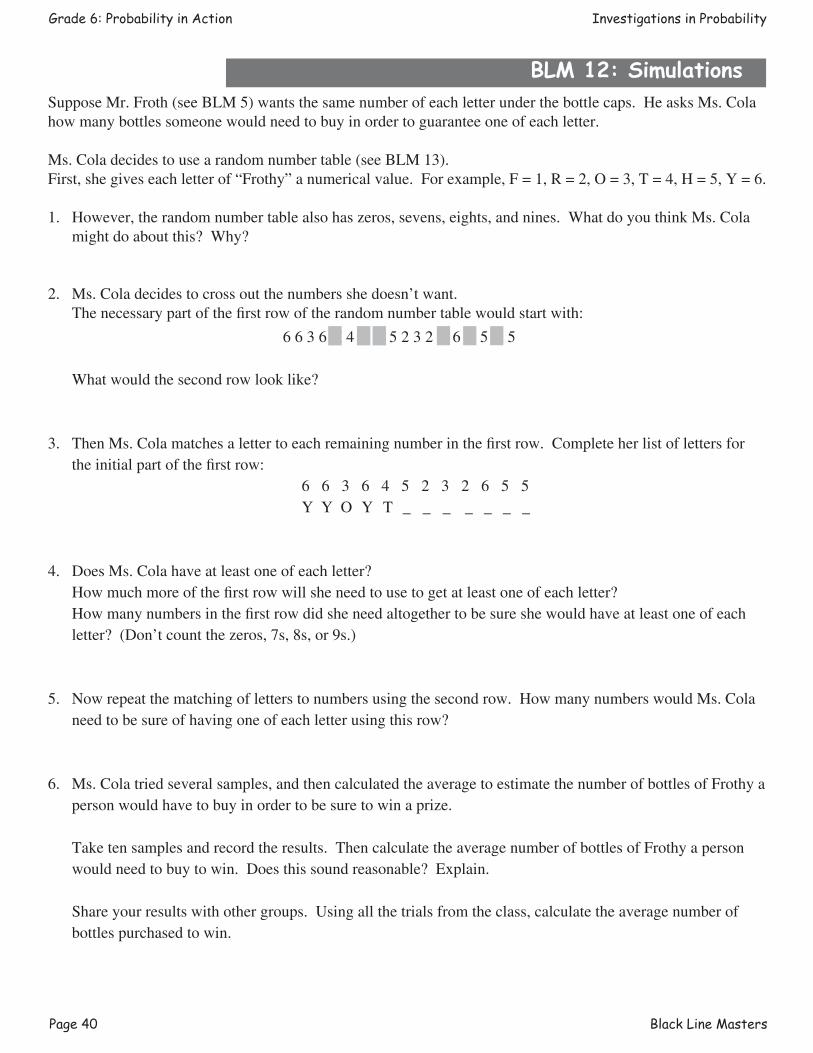
BLM 12: SimulationsSuppose Mr. Froth (see BLM 5) wants the same number of each letter under the bottle caps. He asks Ms. Cola how many bottles someone would need to buy in order to guarantee one of each letter.
Ms. Cola decides to use a random number table (see BLM 13).First, she gives each letter of “Frothy” a numerical value. For example, F = 1, R = 2, O = 3, T = 4, H = 5, Y = 6.
1. However, the random number table also has zeros, sevens, eights, and nines. What do you think Ms. Cola might do about this? Why?
2. Ms. Cola decides to cross out the numbers she doesn’t want. The necessary part of the first row of the random number table would start with:
6 6 3 6 X 4 X X 5 2 3 2 X 6 X 5 X 5 X What would the second row look like?
3. Then Ms. Cola matches a letter to each remaining number in the first row. Complete her list of letters for the initial part of the first row:
6 6 3 6 4 5 2 3 2 6 5 5 Y Y O Y T _ _ _ _ _ _ _
4. Does Ms. Cola have at least one of each letter? How much more of the first row will she need to use to get at least one of each letter? How many numbers in the first row did she need altogether to be sure she would have at least one of each
letter? (Don’t count the zeros, 7s, 8s, or 9s.)
5. Now repeat the matching of letters to numbers using the second row. How many numbers would Ms. Cola need to be sure of having one of each letter using this row?
6. Ms. Cola tried several samples, and then calculated the average to estimate the number of bottles of Frothy a person would have to buy in order to be sure to win a prize.
Take ten samples and record the results. Then calculate the average number of bottles of Frothy a person would need to buy to win. Does this sound reasonable? Explain.
Share your results with other groups. Using all the trials from the class, calculate the average number of bottles purchased to win.
Black Line Masters Page 41
Investigations in Probability Grade 6: Probability in Action
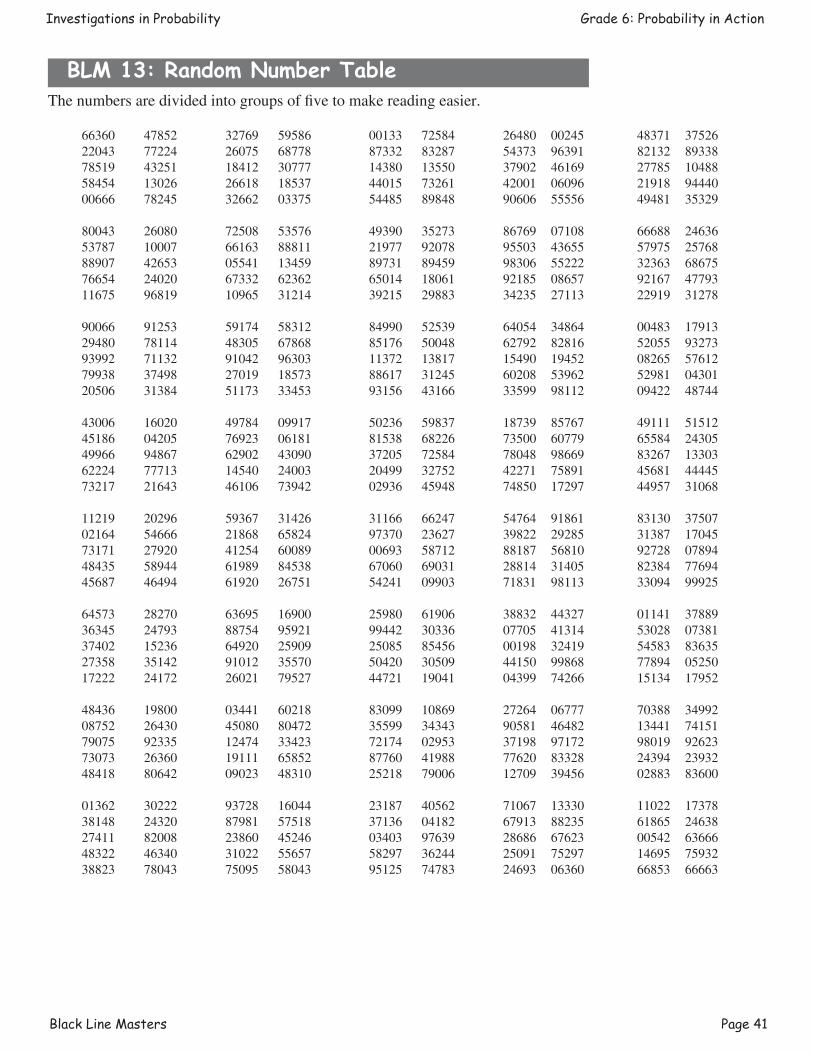
BLM 13: Random Number Table
66360 47852 32769 59586 00133 72584 26480 00245 48371 37526 22043 77224 26075 68778 87332 83287 54373 96391 82132 89338 78519 43251 18412 30777 14380 13550 37902 46169 27785 10488 58454 13026 26618 18537 44015 73261 42001 06096 21918 94440 00666 78245 32662 03375 54485 89848 90606 55556 49481 35329 80043 26080 72508 53576 49390 35273 86769 07108 66688 24636 53787 10007 66163 88811 21977 92078 95503 43655 57975 25768 88907 42653 05541 13459 89731 89459 98306 55222 32363 68675 76654 24020 67332 62362 65014 18061 92185 08657 92167 47793 11675 96819 10965 31214 39215 29883 34235 27113 22919 31278
90066 91253 59174 58312 84990 52539 64054 34864 00483 17913 29480 78114 48305 67868 85176 50048 62792 82816 52055 93273 93992 71132 91042 96303 11372 13817 15490 19452 08265 57612 79938 37498 27019 18573 88617 31245 60208 53962 52981 04301 20506 31384 51173 33453 93156 43166 33599 98112 09422 48744
43006 16020 49784 09917 50236 59837 18739 85767 49111 51512 45186 04205 76923 06181 81538 68226 73500 60779 65584 24305 49966 94867 62902 43090 37205 72584 78048 98669 83267 13303 62224 77713 14540 24003 20499 32752 42271 75891 45681 44445 73217 21643 46106 73942 02936 45948 74850 17297 44957 31068
11219 20296 59367 31426 31166 66247 54764 91861 83130 37507 02164 54666 21868 65824 97370 23627 39822 29285 31387 17045 73171 27920 41254 60089 00693 58712 88187 56810 92728 07894 48435 58944 61989 84538 67060 69031 28814 31405 82384 77694 45687 46494 61920 26751 54241 09903 71831 98113 33094 99925
64573 28270 63695 16900 25980 61906 38832 44327 01141 37889 36345 24793 88754 95921 99442 30336 07705 41314 53028 07381 37402 15236 64920 25909 25085 85456 00198 32419 54583 83635 27358 35142 91012 35570 50420 30509 44150 99868 77894 05250 17222 24172 26021 79527 44721 19041 04399 74266 15134 17952
48436 19800 03441 60218 83099 10869 27264 06777 70388 34992 08752 26430 45080 80472 35599 34343 90581 46482 13441 74151 79075 92335 12474 33423 72174 02953 37198 97172 98019 92623 73073 26360 19111 65852 87760 41988 77620 83328 24394 23932 48418 80642 09023 48310 25218 79006 12709 39456 02883 83600
01362 30222 93728 16044 23187 40562 71067 13330 11022 17378 38148 24320 87981 57518 37136 04182 67913 88235 61865 24638 27411 82008 23860 45246 03403 97639 28686 67623 00542 63666 48322 46340 31022 55657 58297 36244 25091 75297 14695 75932 38823 78043 75095 58043 95125 74783 24693 06360 66853 66663
The numbers are divided into groups of five to make reading easier.
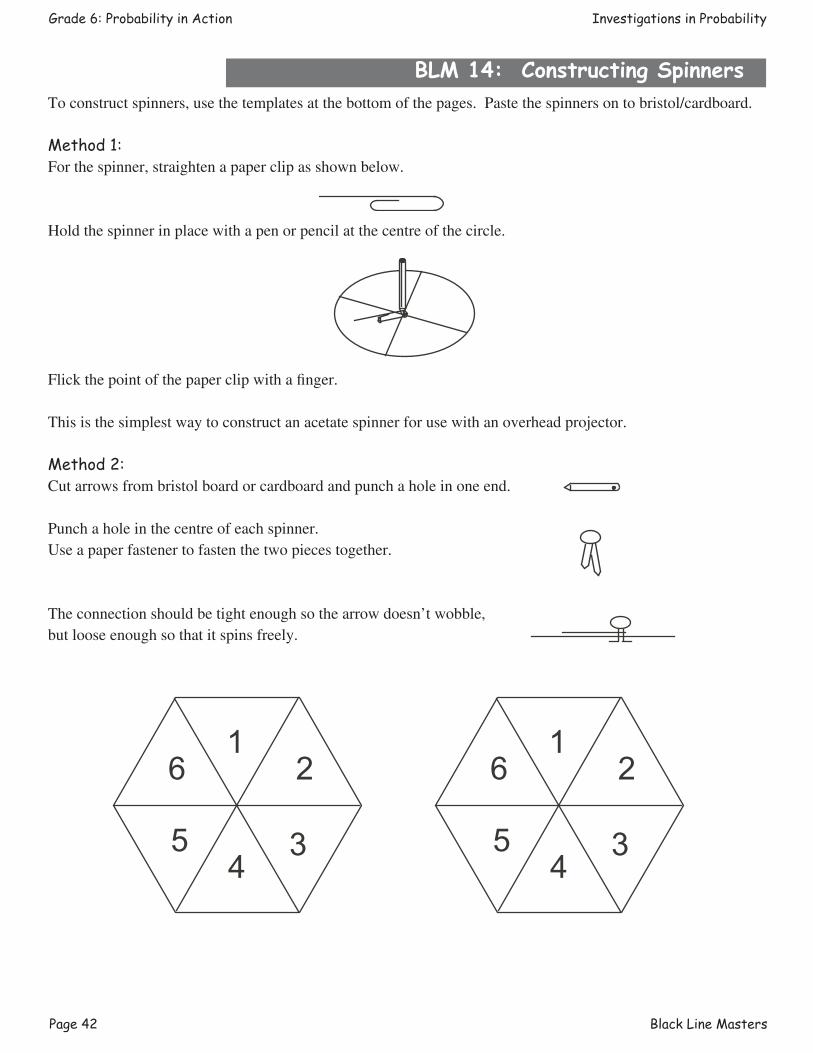
Page 42 Black Line Masters
Grade 6: Probability in Action Investigations in Probability
BLM 14: Constructing SpinnersTo construct spinners, use the templates at the bottom of the pages. Paste the spinners on to bristol/cardboard.
Method 1:For the spinner, straighten a paper clip as shown below.
Hold the spinner in place with a pen or pencil at the centre of the circle.
Flick the point of the paper clip with a finger.
This is the simplest way to construct an acetate spinner for use with an overhead projector.
Method 2:Cut arrows from bristol board or cardboard and punch a hole in one end.
Punch a hole in the centre of each spinner.Use a paper fastener to fasten the two pieces together.
The connection should be tight enough so the arrow doesn’t wobble, but loose enough so that it spins freely.
126
54
3
126
54
3
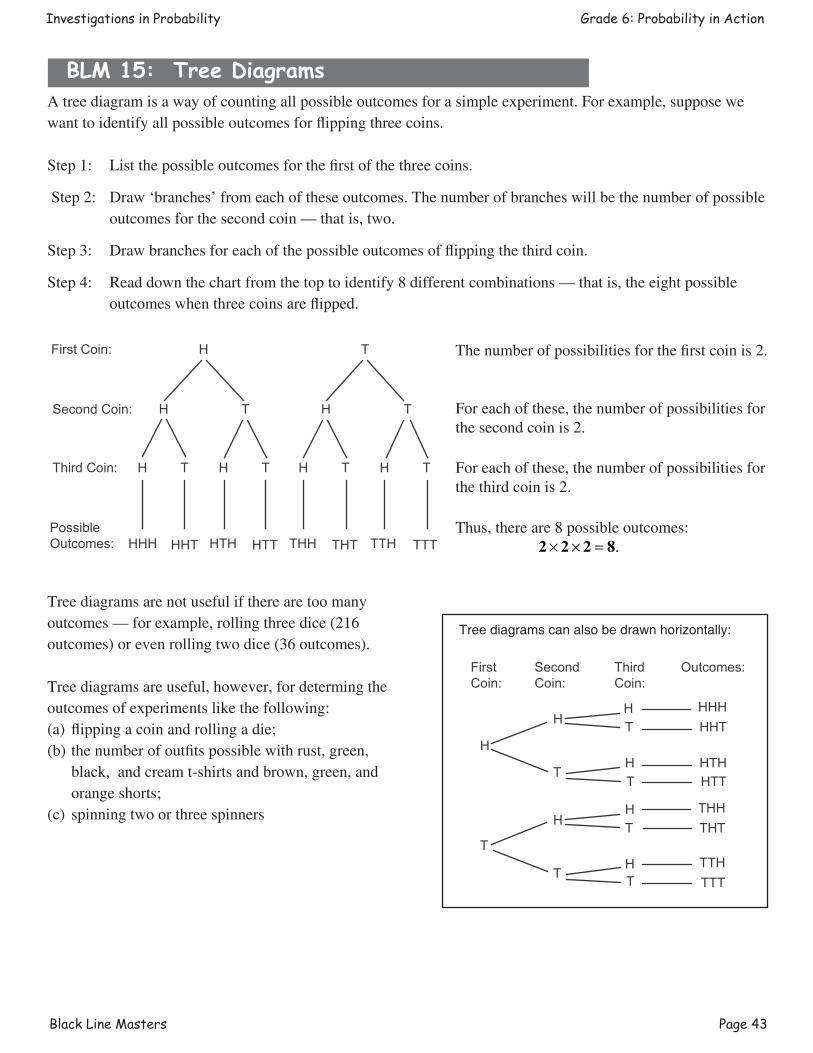
Black Line Masters Page 43
Investigations in Probability Grade 6: Probability in Action
BLM 15: Tree Diagrams A tree diagram is a way of counting all possible outcomes for a simple experiment. For example, suppose we want to identify all possible outcomes for flipping three coins.
Step 1: List the possible outcomes for the first of the three coins.
Step 2: Draw ‘branches’ from each of these outcomes. The number of branches will be the number of possible outcomes for the second coin — that is, two.
Step 3: Draw branches for each of the possible outcomes of flipping the third coin.
Step 4: Read down the chart from the top to identify 8 different combinations — that is, the eight possible outcomes when three coins are flipped.
Tree diagrams are not useful if there are too many outcomes — for example, rolling three dice (216 outcomes) or even rolling two dice (36 outcomes).
Tree diagrams are useful, however, for determing the outcomes of experiments like the following:(a) flipping a coin and rolling a die;(b) the number of outfits possible with rust, green,
black, and cream t-shirts and brown, green, and orange shorts;
(c) spinning two or three spinners
H
H
T
HHHHHT
HTHHTT
HT
HT
First Coin:
Second Coin:
Third Coin:
Outcomes:
T
H
T
THHTHT
TTHTTT
HT
HT
The number of possibilities for the first coin is 2.
For each of these, the number of possibilities for the second coin is 2.
For each of these, the number of possibilities for the third coin is 2.
Thus, there are 8 possible outcomes:
Tree diagrams can also be drawn horizontally:
First Coin:
Third Coin:
H
H T
H T
HHH HHT
H T
HTH HTT
Second Coin:
Possible Outcomes:
T
H T
H T
THH THT
H T
TTH TTT 2 2 2 8× × = .
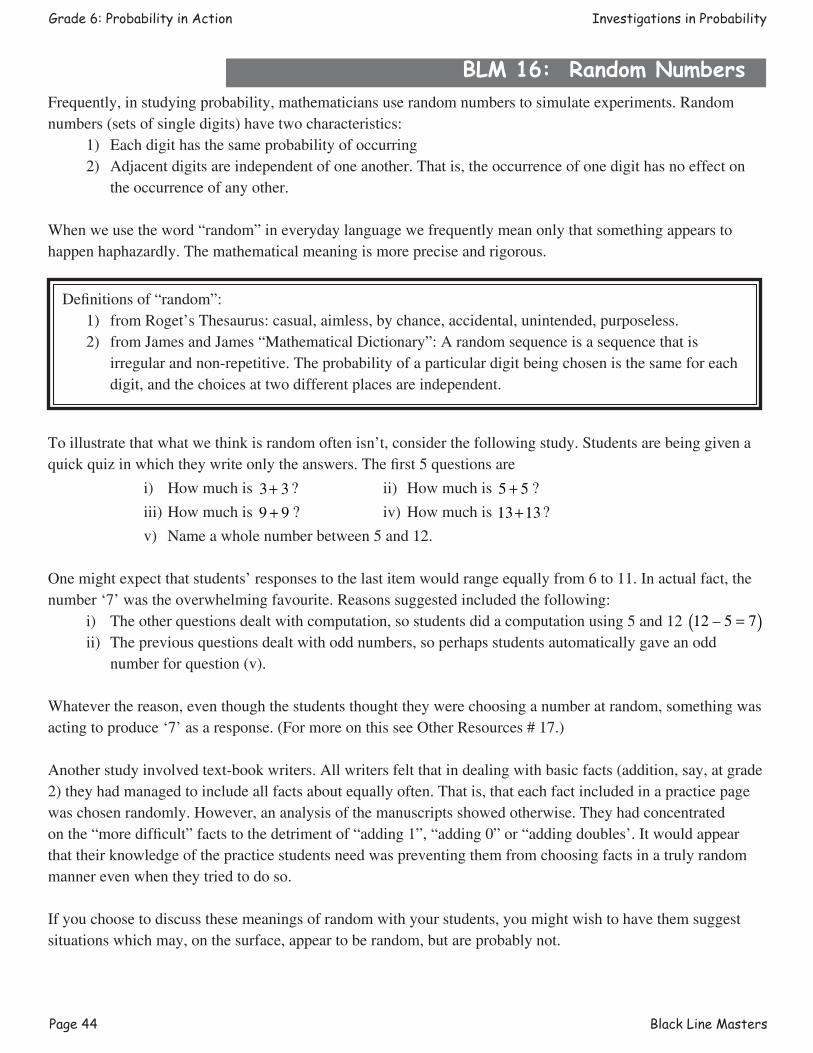
Page 44 Black Line Masters
Grade 6: Probability in Action Investigations in Probability
BLM 16: Random NumbersFrequently, in studying probability, mathematicians use random numbers to simulate experiments. Random numbers (sets of single digits) have two characteristics: 1) Each digit has the same probability of occurring 2) Adjacent digits are independent of one another. That is, the occurrence of one digit has no effect on
the occurrence of any other.
When we use the word “random” in everyday language we frequently mean only that something appears to happen haphazardly. The mathematical meaning is more precise and rigorous.
Definitions of “random”: 1) from Roget’s Thesaurus: casual, aimless, by chance, accidental, unintended, purposeless. 2) from James and James “Mathematical Dictionary”: A random sequence is a sequence that is
irregular and non-repetitive. The probability of a particular digit being chosen is the same for each digit, and the choices at two different places are independent.
To illustrate that what we think is random often isn’t, consider the following study. Students are being given a quick quiz in which they write only the answers. The first 5 questions are
i) How much is 3 3+ ? ii) How much is 5 5+ ?
iii) How much is 9 9+ ? iv) How much is 13 13+ ?
v) Name a whole number between 5 and 12.
One might expect that students’ responses to the last item would range equally from 6 to 11. In actual fact, the number ‘7’ was the overwhelming favourite. Reasons suggested included the following: i) The other questions dealt with computation, so students did a computation using 5 and 12 12 5 7– =( ) ii) The previous questions dealt with odd numbers, so perhaps students automatically gave an odd
number for question (v).
Whatever the reason, even though the students thought they were choosing a number at random, something was acting to produce ‘7’ as a response. (For more on this see Other Resources # 17.)
Another study involved text-book writers. All writers felt that in dealing with basic facts (addition, say, at grade 2) they had managed to include all facts about equally often. That is, that each fact included in a practice page was chosen randomly. However, an analysis of the manuscripts showed otherwise. They had concentrated on the “more difficult” facts to the detriment of “adding 1”, “adding 0” or “adding doubles’. It would appear that their knowledge of the practice students need was preventing them from choosing facts in a truly random manner even when they tried to do so.
If you choose to discuss these meanings of random with your students, you might wish to have them suggest situations which may, on the surface, appear to be random, but are probably not.
Solutions/Notes Page 45
Investigations in Probability Grade 6: Probability in Action
Solutions & Notes
Activity 1: Fair Spinners
BLM 2:
1. (a) Since there are 7 marbles, the probability of drawing the 1 red marble is ‘1 out of 7’ or ‘17
’.
Symbollically, we can write P(red) = 17
.
(b) The probability of drawing the 1 blue marble is ‘1 out of 7’ or ‘17
’. P(blue) = 17 .
(c) There are 3 green marbles. Thus a green marble can be drawn in three ways (that is, there are 3
favourable outcomes: green #1, green #2, or green #3) and the probability of drawing a green marble
is ‘3 out of 7’ or ‘37
’. P(green) = 37
.
(d) Since there are 2 yellow marbles, the probability of drawing a yellow marble is ‘2 out of 7’ or ‘27
’.
P(yellow) = 27
.
(e) There are two favourable outcomes here - a red or a blue. Thus, the probability of drawing either a red
or a blue is ‘2 out of 7’ or ‘27
’. P(red or blue) = 27
.
2. Parts (a) and (b) describe equally likely outcomes. The probability of drawing a red marble, or ‘P(red)’
equals the probability of drawing a blue marble, or ‘P(blue)’.
or
Parts (d) and (e) describe equally likely outcomes. P(yellow) = P(red or blue)
3. Answers will vary. Possible responses are given below
(a) (i) The experiment is the rolling of the die.
(ii) Two equally likely outcomes are rolling a 1 and rolling a 2. That is, P(1) = P(2) = 16
.
(b) (i) The experiment could be drawing marbles from a bag.
(ii) P(red or blue) = P(yellow) = 25
.
(c) (i) The experiment could be spinning the spinner.
(ii) P(2) = P(6) = 14
.
(d) (i) Theexperimentcouldbeflippingthetwocoins
(ii) P(2 heads) = P(2 tails) = 14
.
Page 46 Solutions/Notes
Grade 6: Probability in Action Investigations in Probability
Solutions & Notes
4. (a) Two outcomes that are not equally likely are the probability of rolling an odd number and the
probabilityofrollinga2.P(oddnumber)≠P(2).P(oddnumber)is3outof6,andP(2)is1outof6.
(b) P(red)≠P(yellow).P(red)=15
and P(yellow) = 25
.
(c) P(evennumber)≠P(8).P(evennumber)=44or1andP(8)=
14
.
(d) P(2heads)≠P(oneheadandonetail).Thepossibleoutcomesareheadsonbothcoins,tailsonboth
coins,headsonthefirstandtailsonthesecond,ortailsonthefirstandheadsonthesecond.
Thus there are four outcomes, so P(2 heads) = 1 out of 4
P(1 head and 1 tail) = 2 out of 4.
5. (a) Since red, blue, yellow, and green are the only possible colours, drawing one of them from the bag would be a ‘sure thing’ with a probability of 5 out of 5 or 1.
(b) Since all the numbers on the spinner are even, the probability of spinning an even number is 4 out of 4 or 1.
(c) Similarly, all the numbers on a standard die are either odd or even, so the probability of rolling either odd or even is 6 out of 6 or 1.
Extensions in Mathematics
1. (a) Whether or not the modelling clay makes a difference may depend on where it is placed, how the coin
is spun and how much clay is used. For example, in testing this suggestion, the authors found that if
the clay was on the tail surface of the coin, and held so that it was facing the experimenter and had the
clay at the top, the coin was slightly more likely to fall showing a head. The result of 100 unprejudiced
spins was 45 heads and 55 tails with the clay on the tail surface.
This situation reminds one of the belief that when a slice of buttered bread falls, it always lands
butteredsidedown.Believeitornot,thissituationwasactuallythefocusofascientificstudyafew
years ago. It was discovered that things that are dropped tend to turn, and, if they are dropped from a
particular height, they will turn through 360° and land right side up. Unfortunately, for those of us who
may be a bit clumsy, the height from which bread is usually dropped (counter - or table-height) is just
enoughtoallowthebreadtorotatethrough180°andlandbutteredsidedown.Ofcoursethisassumes
a simple drop. As we try to catch the bread we may impede its steady turning.
Family Activities
Studentsshouldrealizethattheprobabilityofsomeonewinningagameofskillcannotbegivenaspecificvalue
but can only be described as ‘more likely’ or ‘less likely’ than the probability of someone else winning.
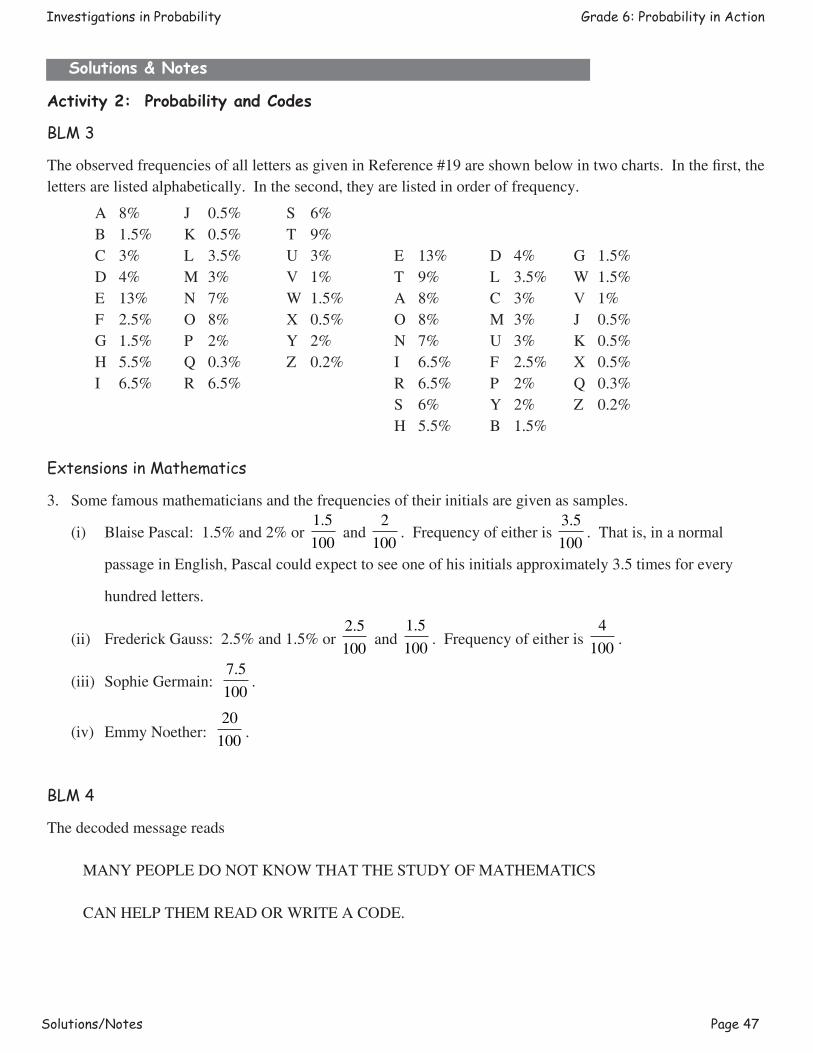
Solutions/Notes Page 47
Investigations in Probability Grade 6: Probability in Action
Solutions & Notes
Activity 2: Probability and Codes
BLM 3
TheobservedfrequenciesofalllettersasgiveninReference#19areshownbelowintwocharts.Inthefirst,theletters are listed alphabetically. In the second, they are listed in order of frequency.
A 8% J 0.5% S 6% B 1.5% K 0.5% T 9% C 3% L 3.5% U 3% E 13% D 4% G 1.5% D 4% M 3% V 1% T 9% L 3.5% W 1.5% E 13% N 7% W 1.5% A 8% C 3% V 1% F 2.5% O 8% X 0.5% O 8% M 3% J 0.5% G 1.5% P 2% Y 2% N 7% U 3% K 0.5% H 5.5% Q 0.3% Z 0.2% I 6.5% F 2.5% X 0.5% I 6.5% R 6.5% R 6.5% P 2% Q 0.3% S 6% Y 2% Z 0.2% H 5.5% B 1.5%
Extensions in Mathematics
3. Some famous mathematicians and the frequencies of their initials are given as samples.
(i) BlaisePascal:1.5%and2%or1 5100.
and 2
100. Frequency of either is
3 5100
.. That is, in a normal
passageinEnglish,Pascalcouldexpecttoseeoneofhisinitialsapproximately3.5timesforevery
hundred letters.
(ii) FrederickGauss:2.5%and1.5%or2 5100
. and
1 5100.
. Frequency of either is 4
100.
(iii) SophieGermain:7 5100
..
(iv) EmmyNoether:20100 .
BLM 4
The decoded message reads
MANYPEOPLEDONOTKNOWTHATTHESTUDYOFMATHEMATICS
CANHELPTHEMREADORWRITEACODE.
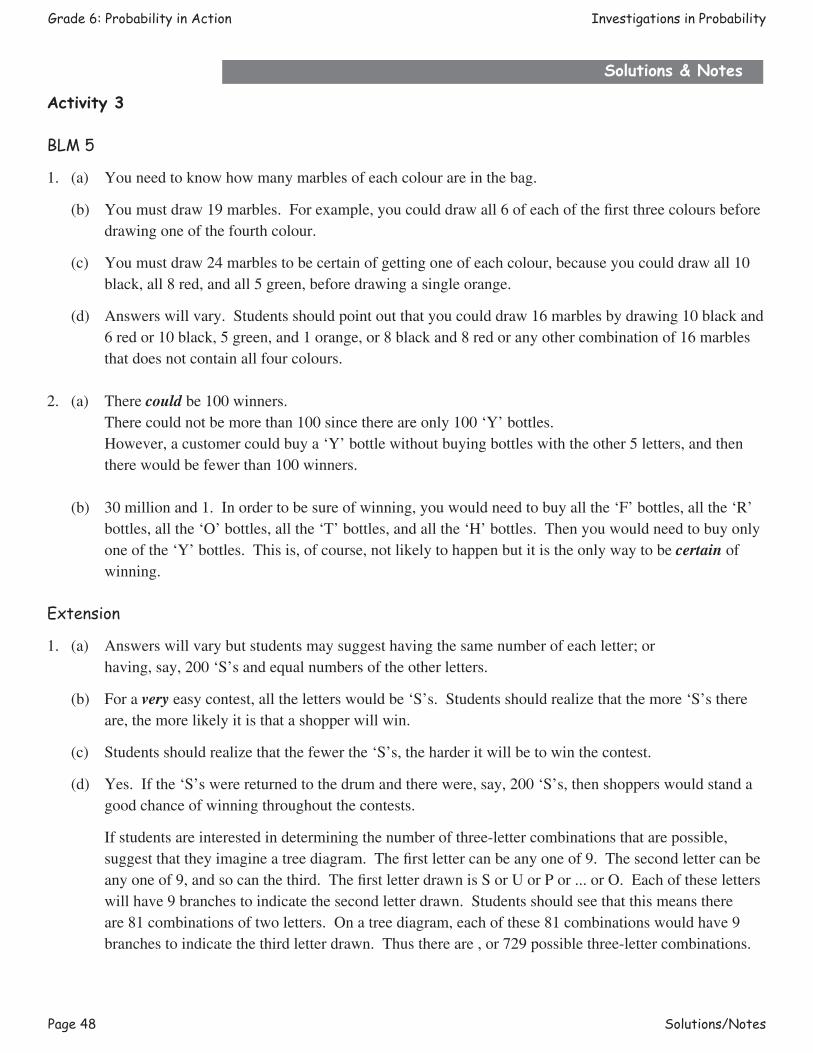
Page 48 Solutions/Notes
Grade 6: Probability in Action Investigations in Probability
Solutions & Notes
Activity 3
BLM 5
1. (a) Youneedtoknowhowmanymarblesofeachcolourareinthebag.
(b) Youmustdraw19marbles.Forexample,youcoulddrawall6ofeachofthefirstthreecoloursbeforedrawing one of the fourth colour.
(c) Youmustdraw24marblestobecertainofgettingoneofeachcolour,becauseyoucoulddrawall10black,all8red,andall5green,beforedrawingasingleorange.
(d) Answers will vary. Students should point out that you could draw 16 marbles by drawing 10 black and 6redor10black,5green,and1orange,or8blackand8redoranyothercombinationof16marblesthat does not contain all four colours.
2. (a) There could be 100 winners. Therecouldnotbemorethan100sincethereareonly100‘Y’bottles. However,acustomercouldbuya‘Y’bottlewithoutbuyingbottleswiththeother5letters,andthen
there would be fewer than 100 winners. (b) 30 million and 1. In order to be sure of winning, you would need to buy all the ‘F’ bottles, all the ‘R’
bottles,allthe‘O’bottles,allthe‘T’bottles,andallthe‘H’bottles.Thenyouwouldneedtobuyonlyoneofthe‘Y’bottles.Thisis,ofcourse,notlikelytohappenbutitistheonlywaytobecertain of winning.
Extension
1. (a) Answers will vary but students may suggest having the same number of each letter; or having, say, 200 ‘S’s and equal numbers of the other letters.
(b) For a very easy contest, all the letters would be ‘S’s. Students should realize that the more ‘S’s there are, the more likely it is that a shopper will win.
(c) Students should realize that the fewer the ‘S’s, the harder it will be to win the contest.
(d) Yes.Ifthe‘S’swerereturnedtothedrumandtherewere,say,200‘S’s,thenshopperswouldstandagood chance of winning throughout the contests.
If students are interested in determining the number of three-letter combinations that are possible, suggestthattheyimagineatreediagram.Thefirstlettercanbeanyoneof9.Thesecondlettercanbeanyoneof9,andsocanthethird.ThefirstletterdrawnisSorUorPor...orO.Eachoftheseletterswill have 9 branches to indicate the second letter drawn. Students should see that this means there are81combinationsoftwoletters.Onatreediagram,eachofthese81combinationswouldhave9branches to indicate the third letter drawn. Thus there are , or 729 possible three-letter combinations.
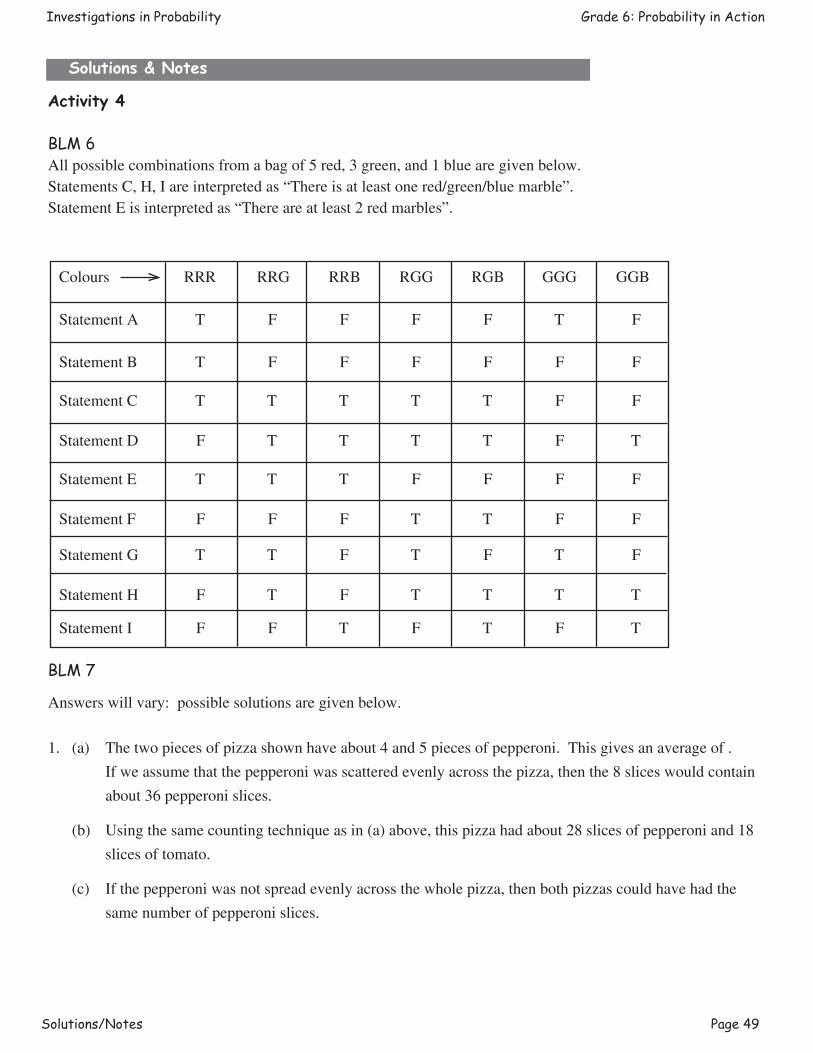
Solutions/Notes Page 49
Investigations in Probability Grade 6: Probability in Action
Solutions & Notes
Activity 4
BLM 6All possible combinations from a bag of 5 red, 3 green, and 1 blue are given below.Statements C, H, I are interpreted as “There is at least one red/green/blue marble”.StatementEisinterpretedas“Thereareatleast2redmarbles”.
BLM 7
Answers will vary: possible solutions are given below.
1. (a) The two pieces of pizza shown have about 4 and 5 pieces of pepperoni. This gives an average of .
Ifweassumethatthepepperoniwasscatteredevenlyacrossthepizza,thenthe8sliceswouldcontain
about 36 pepperoni slices.
(b) Usingthesamecountingtechniqueasin(a)above,thispizzahadabout28slicesofpepperoniand18
slices of tomato.
(c) If the pepperoni was not spread evenly across the whole pizza, then both pizzas could have had the
same number of pepperoni slices.
Colours RRR RRG RRB RGG RGB GGG GGB
Statement A T F F F F T F
Statement B T F F F F F F
Statement C T T T T T F F
StatementD F T T T T F T
StatementE T T T F F F F
Statement F F F F T T F F
StatementG T T F T F T F
Statement H F T F T T T T
Statement I F F T F T F T
Page 50 Solutions/Notes
Grade 6: Probability in Action Investigations in Probability
Solutions & Notes
2. (a) About64-74dandelions (b) About30-38dandelions
(c) The estimates in (a) and (b) assume that the dandelions are scattered evenly over the whole lawn. However, this doesn’t usually happen, so it is possible that both lawns have the same number of dandelions.
(d) If each lawn has on it only the dandelions showing, then (a) would have 15 and (b) would have 12.
(e) Weneedtoknowifthedandelionsarescatteredevenly(ornearlyevenly)tohaveanyconfidenceinour answers to (a) and (b).
BLM 8
Answers will vary.
BLM 9
Answers will vary.
Activity 5
BLMs 10 and 11
Answers will vary.
BLM 12
1. Answers will vary. Any logical suggestion should be accepted. The simplest is to cross out the unwanted numbers as stated in #2.
2. Thefirstpartofthesecondrowwillbe
3. TheletterswillbeYYOYTHRORYHH
4. Ms.Colastillhasno‘1’andthereforenoletter‘F’.Sheneedstocontinueinthefirstrowuntilshereachesan ‘1’. Altogether, she will use 14 numbers. This is comparable to buying 14 bottles of Frothy to win.
5. Usingrowtwo,Ms.Colaneeds23numbers.Thisislikebuying23bottlesofFrothytowin.
6. Answers will vary. Check to see that students are crossing out (or otherwise eliminating) the unwanted numbers. Ask students to devise a soft drink name that will make use of all the different digits in the random number table, and to estimate (by sampling) the average number of bottles purchased in order to win.
22X43XX22426XX56XXXXXX332
Assessment Page 51
Investigations in Probability Grade 6: Probability in Action
InvestigationsInvestigations involve explorations of mathematical questions that may be related to other subject areas. Investigations deal with problem posing as well as problem solving. Investigations give information about a student’s ability to:
• identify and define a problem;• make a plan;• create and interpret strategies;• collect and record needed information;• organize information and look for patterns;• persist, looking for more information if needed;• discuss, review, revise, and explain results.
JournalsA journal is a personal, written expression of thoughts. Students express ideas and feelings, ask questions, draw diagrams and graphs, explain processes used in solving problems, report on investigations, and respond to open-ended questions. When students record their ideas in math journals, they often:
• formulate, organize, internalize, and evaluate concepts about mathematics;• clarify their thinking about mathematical concepts, processes, or questions;• identify their own strengths, weaknesses, and interests in mathematics;• reflect on new learning about mathematics;• use the language of mathematics to describe their learning.
ObservationsResearch has consistently shown that the most reliable method of evaluation is the ongoing, in-class observation of students by teachers. Students should be observed as they work individually and in groups. Systematic, ongoing observation gives information about students’:
• attitudes towards mathematics;• feelings about themselves as learners of mathematics;• specific areas of strength and weakness;• preferred learning styles;• areas of interest;• work habits — individual and collaborative;• social development;• development of mathematics language and concepts.
In order to ensure that the observations are focused and systematic, a teacher may use checklists, a set of questions, and/or a journal as a guide. Teachers should develop a realistic plan for observing students. Such a plan might include opportunities to:
• observe a small number of students each day;• focus on one or two aspects of development at a time.
Suggested Assessment Strategies
Page 52 Assessment
Grade 6: Probability in Action Investigations in Probability
Student Self-AssessmentStudent self-assessment promotes the development of metacognitive ability (the ability to reflect critically on one’s own reasoning). It also assists students to take ownership of their learning, and become independent thinkers. Self-assessment can be done following a co-operative activity or project using a questionnaire which asks how well the group worked together. Students can evaluate comments about their work samples or daily journal writing. Teachers can use student self-assessments to determine whether:
• there is change and growth in the student’s attitudes, mathematics understanding, and achievement;• a student’s beliefs about his or her performance correspond to his/her actual performance;• the student and the teacher have similar expectations and criteria for evaluation.
Resources for Assessment“For additional ideas, see annotated Other Resources list on page 59, numbered as below.”
1. The Ontario Curriculum, Grades 1-8: Mathematics.
2. Assessment Standards for School Mathematics, NCTM, 1995.
3. Linking Assessment and Instruction in Mathematics: Junior Years, Ontario Association of Mathematics Educators/OMCA/OAJE, Moore et al., 1996.
4. Mathematics Assessment: Myths, Models, Good Questions, and Practical Suggestions, by Jean Kerr Stenmark (Ed.), NCTM, 1991.
5. “Assessment”, Arithmetic Teacher Focus Issue, February 1992, NCTM. 6. How to Evaluate Progress in Problem Solving, by Randall Charles et al., NCTM, 1987.
7. Assessment in the Mathematics Classroom, Yearbook, NCTM, 1993.
Suggested Assessment Strategies
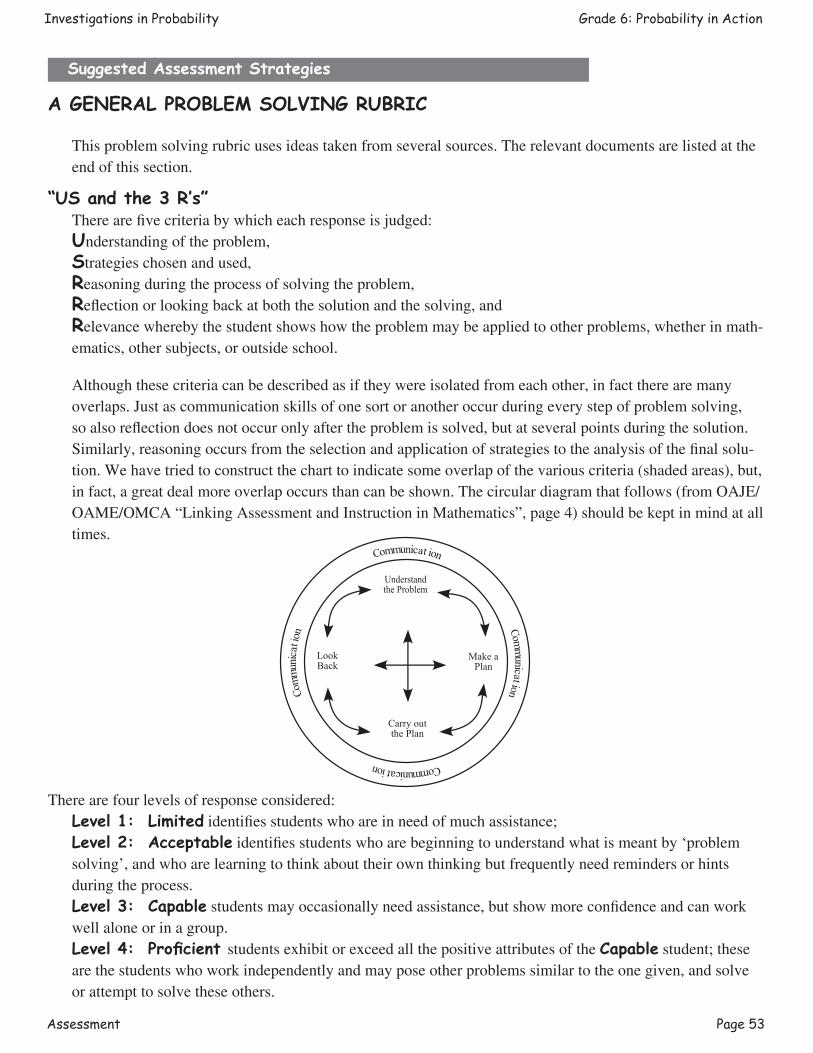
Assessment Page 53
Investigations in Probability Grade 6: Probability in Action
Suggested Assessment Strategies
A GENERAL PROBLEM SOLVING RUBRIC
This problem solving rubric uses ideas taken from several sources. The relevant documents are listed at the end of this section.
“US and the 3 R’s”There are five criteria by which each response is judged:Understanding of the problem,Strategies chosen and used,Reasoning during the process of solving the problem,Reflection or looking back at both the solution and the solving, andRelevance whereby the student shows how the problem may be applied to other problems, whether in math-ematics, other subjects, or outside school.
Although these criteria can be described as if they were isolated from each other, in fact there are many overlaps. Just as communication skills of one sort or another occur during every step of problem solving, so also reflection does not occur only after the problem is solved, but at several points during the solution. Similarly, reasoning occurs from the selection and application of strategies to the analysis of the final solu-tion. We have tried to construct the chart to indicate some overlap of the various criteria (shaded areas), but, in fact, a great deal more overlap occurs than can be shown. The circular diagram that follows (from OAJE/OAME/OMCA “Linking Assessment and Instruction in Mathematics”, page 4) should be kept in mind at all times.
There are four levels of response considered: Level 1: Limited identifies students who are in need of much assistance; Level 2: Acceptable identifies students who are beginning to understand what is meant by ‘problem
solving’, and who are learning to think about their own thinking but frequently need reminders or hints during the process.
Level 3: Capable students may occasionally need assistance, but show more confidence and can work well alone or in a group.
Level 4: Proficient students exhibit or exceed all the positive attributes of the Capable student; these are the students who work independently and may pose other problems similar to the one given, and solve or attempt to solve these others.
Communicat ion
Understand the Problem
Look Back
Make a Plan
Carry out the Plan
Comm
unicationCommunication
Comm
unic
ation
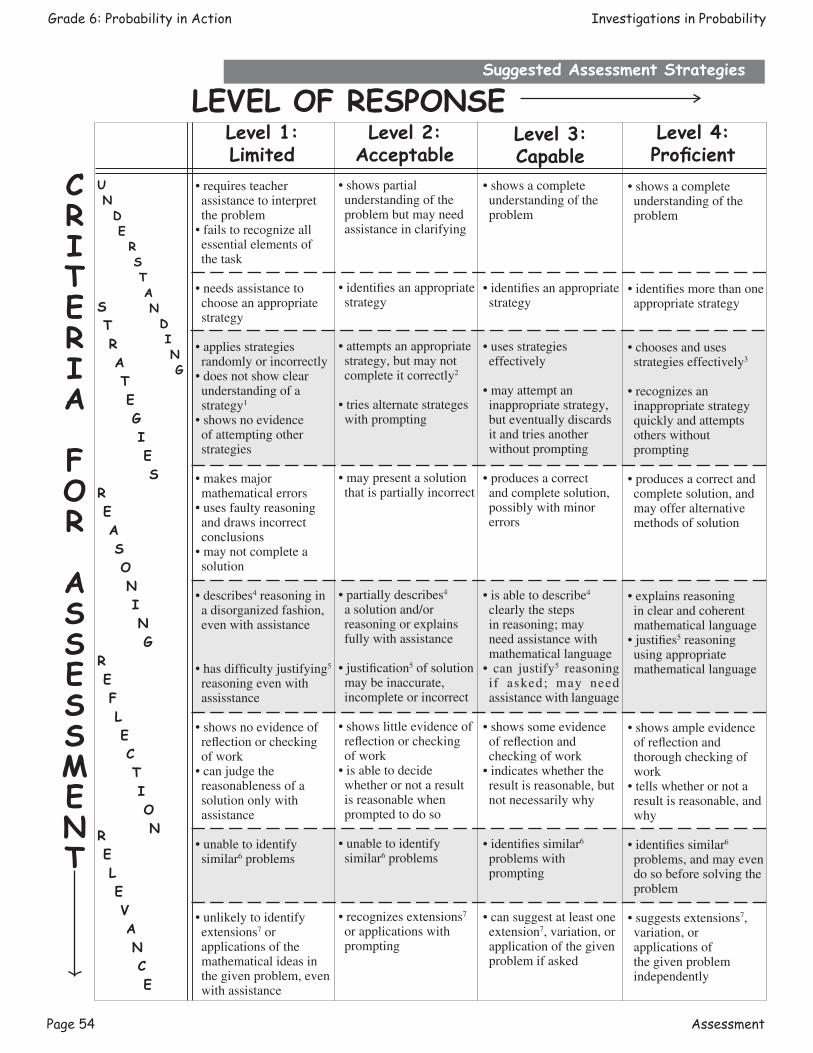
Page 54 Assessment
Grade 6: Probability in Action Investigations in Probability
Suggested Assessment Strategies
Level 1:Limited
Level 3:Capable
• requires teacher assistance to interpret the problem
• fails to recognize all essential elements of the task
• needs assistance to choose an appropriate strategy
• applies strategies randomly or incorrectly
• does not show clear understanding of a strategy1
• shows no evidence of attempting other strategies
• makes major mathematical errors
• uses faulty reasoning and draws incorrect conclusions
• may not complete a solution
• describes4 reasoning in a disorganized fashion, even with assistance
• has difficulty justifying5 reasoning even with assisstance
• shows no evidence of reflection or checking of work
• can judge the reasonableness of a solution only with assistance
• unable to identify similar6 problems
• unlikely to identify extensions7 or applications of the mathematical ideas in the given problem, even with assistance
• shows partial understanding of the problem but may need assistance in clarifying
• identifies an appropriate strategy
• attempts an appropriate strategy, but may not complete it correctly2
• tries alternate strateges with prompting
• may present a solution that is partially incorrect
• partially describes4 a solution and/or reasoning or explains fully with assistance
• justification5 of solution may be inaccurate, incomplete or incorrect
• shows little evidence of reflection or checking of work
• is able to decide whether or not a result is reasonable when prompted to do so
• unable to identify similar6 problems
• recognizes extensions7 or applications with prompting
• shows a complete understanding of the problem
• identifies an appropriate strategy
• uses strategies effectively
• may attempt an inappropriate strategy, but eventually discards it and tries another without prompting
• produces a correct and complete solution, possibly with minor errors
• is able to describe4 clearly the steps in reasoning; may need assistance with mathematical language
• can justify5 reasoning i f asked; may need assistance with language
• shows some evidence of reflection and checking of work
• indicates whether the result is reasonable, but not necessarily why
• identifies similar6 problems with prompting
• can suggest at least one extension7, variation, or application of the given problem if asked
Level 2:Acceptable
Level 4:Proficient
• shows a complete understanding of the problem
• identifies more than one appropriate strategy
• chooses and uses strategies effectively3
• recognizes an inappropriate strategy quickly and attempts others without prompting
• produces a correct and complete solution, and may offer alternative methods of solution
• explains reasoning in clear and coherent mathematical language
• justifies5 reasoning using appropriate mathematical language
• shows ample evidence of reflection and thorough checking of work
• tells whether or not a result is reasonable, and why
• identifies similar6 problems, and may even do so before solving the problem
• suggests extensions7, variation, or applications of the given problem independently
LEVEL OF RESPONSE
CRITERIA
FOR
ASSESSMENT
U N D E R S T A N D I N G
S T R A T E G I E SR E A S O N I N GR E F L E C T I O NR E L E V A N C E
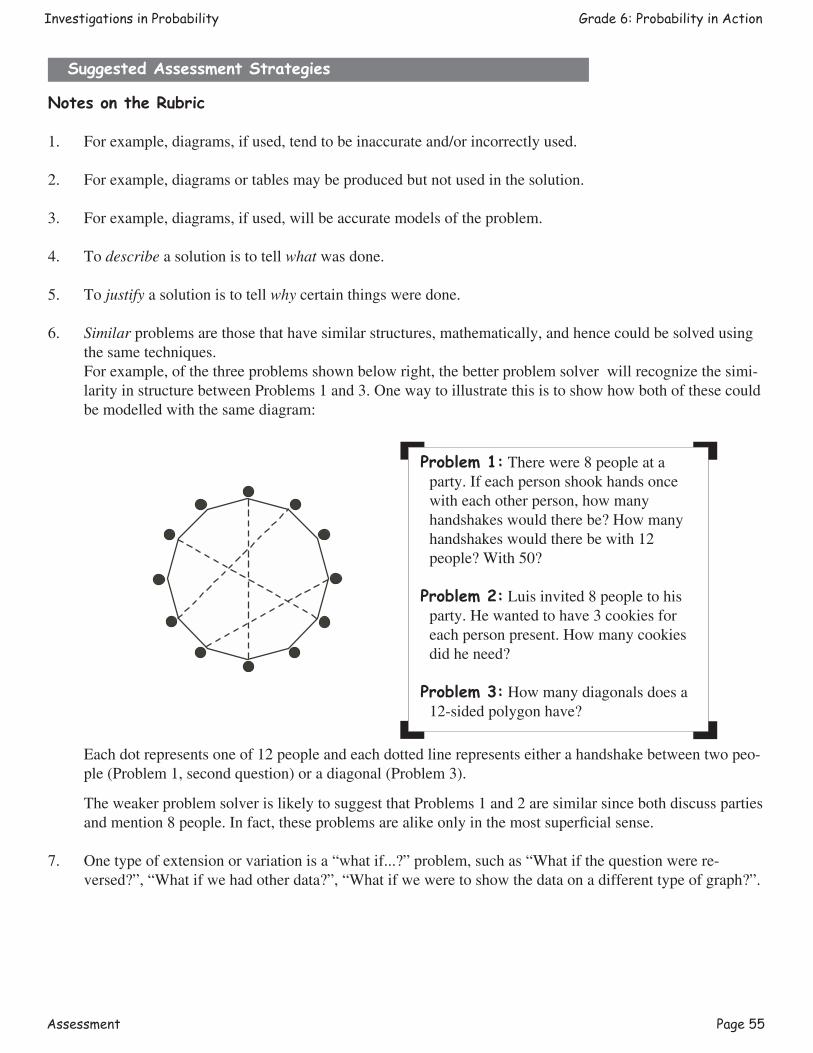
Assessment Page 55
Investigations in Probability Grade 6: Probability in Action
Suggested Assessment Strategies
Notes on the Rubric
1. For example, diagrams, if used, tend to be inaccurate and/or incorrectly used.
2. For example, diagrams or tables may be produced but not used in the solution.
3. For example, diagrams, if used, will be accurate models of the problem.
4. To describe a solution is to tell what was done.
5. To justify a solution is to tell why certain things were done.
6. Similar problems are those that have similar structures, mathematically, and hence could be solved using the same techniques.
For example, of the three problems shown below right, the better problem solver will recognize the simi-larity in structure between Problems 1 and 3. One way to illustrate this is to show how both of these could be modelled with the same diagram:
Each dot represents one of 12 people and each dotted line represents either a handshake between two peo-ple (Problem 1, second question) or a diagonal (Problem 3).
The weaker problem solver is likely to suggest that Problems 1 and 2 are similar since both discuss parties and mention 8 people. In fact, these problems are alike only in the most superficial sense.
7. One type of extension or variation is a “what if...?” problem, such as “What if the question were re-versed?”, “What if we had other data?”, “What if we were to show the data on a different type of graph?”.
Problem 1: There were 8 people at a party. If each person shook hands once with each other person, how many handshakes would there be? How many handshakes would there be with 12 people? With 50?
Problem 2: Luis invited 8 people to his party. He wanted to have 3 cookies for each person present. How many cookies did he need?
Problem 3: How many diagonals does a 12-sided polygon have?
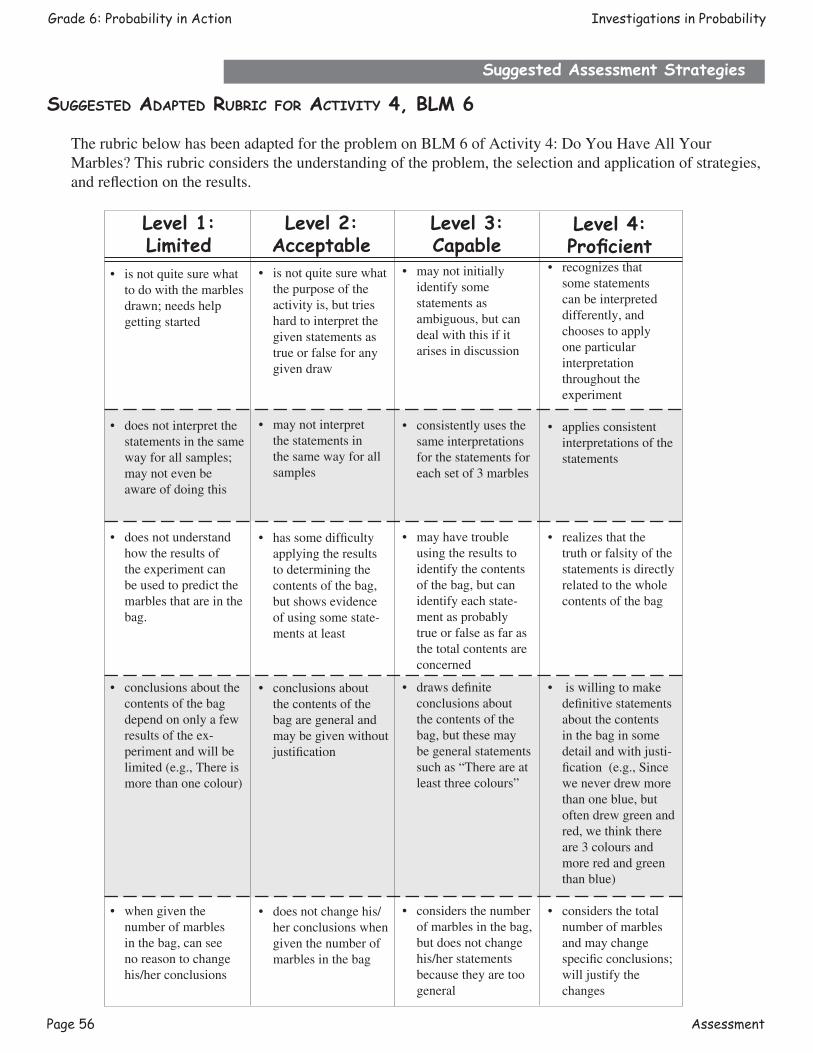
Page 56 Assessment
Grade 6: Probability in Action Investigations in Probability
Suggested Assessment Strategies
SuggeSted AdApted RubRic foR Activity 4, bLM 6
The rubric below has been adapted for the problem on BLM 6 of Activity 4: Do You Have All Your Marbles? This rubric considers the understanding of the problem, the selection and application of strategies, and reflection on the results.
Level 1:Limited
Level 3:Capable
Level 2:Acceptable
Level 4:Proficient
• is not quite sure what to do with the marbles drawn; needs help getting started
• does not interpret the statements in the same way for all samples; may not even be aware of doing this
• does not understand how the results of the experiment can be used to predict the marbles that are in the bag.
• conclusions about the contents of the bag depend on only a few results of the ex-periment and will be limited (e.g., There is more than one colour)
• when given the number of marbles in the bag, can see no reason to change his/her conclusions
• is not quite sure what the purpose of the activity is, but tries hard to interpret the given statements as true or false for any given draw
• may not interpret the statements in the same way for all samples
• has some difficulty applying the results to determining the contents of the bag, but shows evidence of using some state-ments at least
• conclusions about the contents of the bag are general and may be given without justification
• does not change his/
her conclusions when given the number of marbles in the bag
• may not initially identify some statements as ambiguous, but can deal with this if it arises in discussion
• consistently uses the same interpretations for the statements for each set of 3 marbles
• may have trouble using the results to identify the contents of the bag, but can identify each state-ment as probably true or false as far as the total contents are concerned
• draws definite conclusions about the contents of the bag, but these may be general statements such as “There are at least three colours”
• considers the number of marbles in the bag, but does not change his/her statements because they are too general
• recognizes that some statements can be interpreted differently, and chooses to apply one particular interpretation throughout the experiment
• applies consistent interpretations of the statements
• realizes that the truth or falsity of the statements is directly related to the whole contents of the bag
• is willing to make definitive statements about the contents in the bag in some detail and with justi-fication (e.g., Since we never drew more than one blue, but often drew green and red, we think there are 3 colours and more red and green than blue)
• considers the total
number of marbles and may change specific conclusions; will justify the changes
Other Resources Page 57
Investigations in Probability Grade 6: Probability in Action
Other Resources
1. The Ontario Curriculum, Grades 1-8: Mathematics.
2. Assessment Standards for School Mathematics, NCTM, 1995. This comprehensive document examines the purposes of assessment and the nature of various types
of assessment. Actual experiences in the classroom are used to clarify and augment suggestions made.
3. Linking Assessment and Instruction in Mathematics: Junior Years, Ontario Association of Mathematics Educators/OMCA/OAJE, Moore et al., 1996.
The document provides a selection of open-ended problems (including Fair Games activities) tested at the Junior Years (grades 4 to 6) level. Performance Rubrics are used to assess student responses (which are included) at four different levels.
4. Mathematics Assessment: Myths, Models, Good Questions, and Practical Suggestions, by Jean Kerr Stenmark (Ed.), NCTM, 1991.
Included are notes on observation techniques, interviews, conferences, portfolios. Sample student work is included with assessment to show how to apply the suggestions in the book. Includes an annotated bibliography.
5. “Assessment”, Arithmetic Teacher Focus Issue, February 1992, NCTM. This issue contains articles on linking assessment with instruction, alternative forms of assessment,
self-evaluation, using manipulatives on tests, and suggestions for assessing cooperative problem solving.
6. How to Evaluate Progress in Problem Solving, by Randall Charles et al., NCTM, 1987. Chapter headings include “What are you trying to evaluate?”, “What are some evaluation
techniques?” and “How do you organize and manage an evaluation program?” Sample ‘test’ items are included that show how to assess students’ understanding; holistic scoring scales and student opinion surveys suggest ways of assessing progress and affective domain.
7. Assessment in the Mathematics Classroom, Yearbook, NCTM, 1993. The chapters in this book deal with a wide range of forms of assessment, techniques for
implementing different forms, and examples from the classroom showing how observation, interview, journal writing, and tests, among others, can be used to make a meaningful assessment of a student and his/her work.
8. Making Sense of Data: Addenda Series, Grades K-6, Mary Lindquist et al., NCTM, 1992 Students explore different spinners in Grade 3 and determine which outcomes are more likely
than others. Older students could design spinners to give specified outcomes. A grade 5 activity uses a “Random walk” to explore the nature of random numbers:: Logo is used to explore this idea further with a computer.
Page 58 Other Resources
Grade 6: Probability in Action Investigations in Probability
Other Resources
9. “Roll the Dice — an introduction to Probability”, Andrew Freda, in Mathematics Teaching in the Middle School, NCTM, October, 1998, pp. 85-89.
This describes how the introduction of an unfair game that appears, at first, to be fair, is used to intersect students in exploring how probabilities depend on relative frequencies of outcomes. Computer simulation leads to the conclusion that, the greater the sample, the closer the experimental probability is to theoretical probability. Suitable for Grades 5 or 6.
10. Dealing with Data and Chance: Addenda Series, Grades 5-8, Judith S. Zawojewski et al, NCTM, 1991. One activity deals with determining the fairness or “unfairness” of games, another with determining
how many purchases you must make to collect all the enclosed cards necessary to “win” a prize. The game of “Montana Red Dog” (p. 41) involves students in predicting probabilities.
11. Measuring Up: Prototypes for Mathematics Assessment, Mathematical Sciences Education Board and National Research Council, Washington, DC.
Performance assessment activities are given that deal with a number of mathematics topics. The “Hog” Game uses dice to encourage students to determine winning strategies while dealing with simple probability.
12. What Are My Chances?, Book A, and What Are My Chances?, Book B, Creative Publications, 1977. These books provide a number of activities (black line masters) suitable for a wide range of
activities. Students flip coins or two-colour chips, roll number cubes, draw marbles from closed containers (with and without replacement) and explore simple probability activities dealing with the weather and ice-cream flavour combinations. Book B also explores dependence and independence of events.
13. “Truth or Coincidence?”, Daniel J. Brohier, Teaching Children Mathematics, December 1996, pp. 180-183, NCTM.
This activity for grades 3 to 6 involves children using heads and tails of coins to write “answer keys” for True-False tests. For example, if the test has 6 questions, how many possible combinations of True and False are possible? Applications to sports, social studies, and science are suggested.
14. “Exploring Random Numbers”, William R. Speer, Teaching Children Mathematics, January 1997, pp. 242-245, NCTM.
Students are introduced to the idea of randomness by trying to write random numbers. Other simple activities reinforce the idea that randomness is not easily achieved.
15. “Choice and Chance in Life: The Game of ‘Skunk’”, Dan Brutlag, Mathematics Teaching in the Middle School, April, 1994, pp. 28-33, NCTM.
The game of “Skunk” uses “good” and “bad” rolls of the dice to create or eliminate a player’s score. Analysis of the rules leads to a discussion of ways that “chance” enters our lives.
Other Resources Page 59
Investigations in Probability Grade 6: Probability in Action
Other Resources
16. “Looking at Random Events with Logo Software”, Thor Charischak and Robert Berkman, Mathematics Teaching in the Middle School, January-March 1995, pp. 318-322, NCTM.
Students learn how to use Logo to simulate the rolling of up to 3 dice, and discuss the probabilities of different outcomes.
17. “Racing to Understand Probability”, Laura R. Van Zoest and Rebecca K. Walker, Mathematics Teaching in the Middle School, October 1997, pp. 162-170, NCTM.
Students play a game of racing sailboats that appears to be fair, but turns out to be skewed in favour of certain boats. Students make a chart of possible outcomes for 2 dice to try to explain why the game is unfair.
18. Mathematics Teaching in the Middle School, March 99, Focus Issue on “Data & Chance”, NCTM. The entire journal is devoted to articles dealing with Data Management & Probability. One article
explores probability through an even-odd game with dice of different shapes. Another uses animal crackers to simulate wild-life tagging and releasing to count animals in the wild.
19. “Mode Code”, David Spangler, Mathematics Teaching in the Middle School, April, 1999, pp. 464-466, NCTM.
Students explore the frequencies of letters of the alphabet in English. They apply this to decoding a message based on these frequencies, which are given as percents.
20. “Cat and Mouse”, Brian Lannen. Mathematics Teaching in the Middle School, April 1999, pp. 456-459, NCTM.
Students play a cooperative game to see whether or not the mouse finds the cheese. Aspects of probability include fairness or unfairness and tree diagrams to list outcomes. This activity is suitable for many different grades.
21. Organizing Data & Dealing with Uncertainty, NCTM, 1979 The first section of the book deals with collecting and interpreting data. The second part explores
probability through dice, license plates, paper cups, tacks, and beads. Black line masters are provided.
22. “Calendar Mathematics”, Lorna J. Morrow, Arithmetic Teacher, March 1993, pp. 390-391. Problems with dice, or t-shirt and shorts combinations involve organized counting. Children must
determine the number of outcomes and show how they are certain that they have all outcomes.
23. DIME Probability Packs A and B, available from Spectrum Educational Publishing, Aurora, ON 1988 Each pack contains materials and activity cards for four different experiments. There are sufficient
materials for 6 groups or pairs of students to work on the same experiment. The focus is on analyzing games as fair or unfair, and involves determining the probabilities of the outcomes in order to do so.
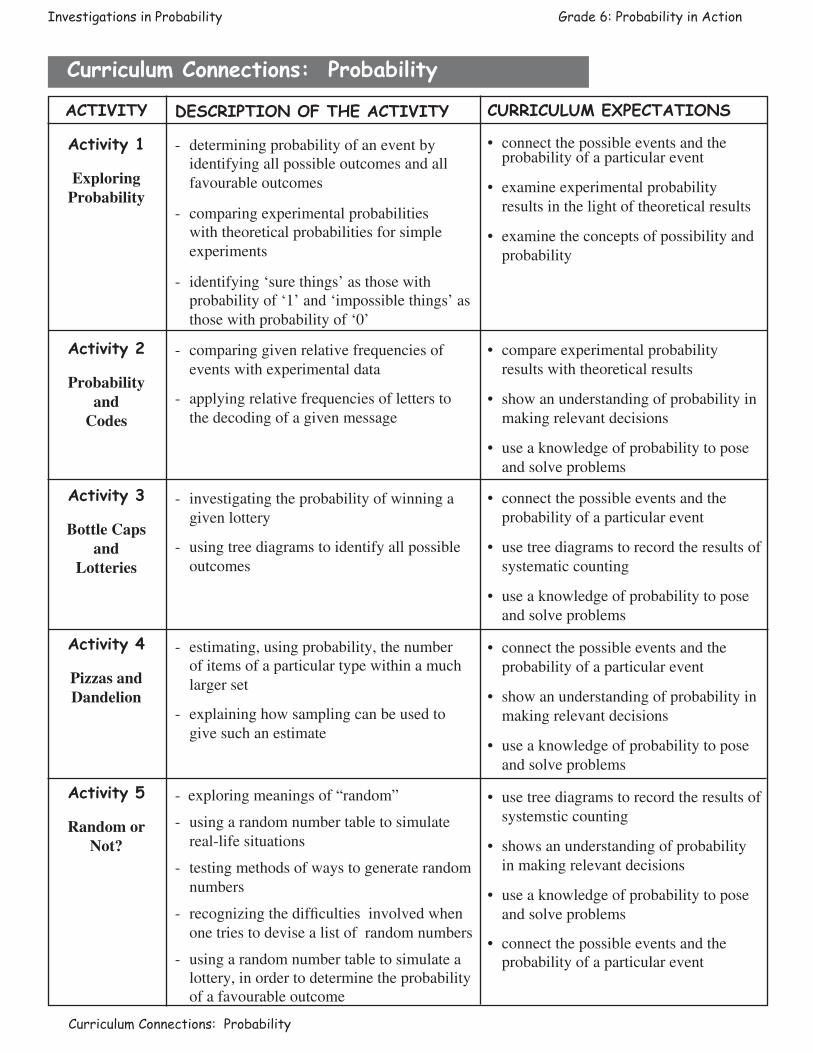
Curriculum Connections: Probability
Investigations in Probability Grade 6: Probability in Action
ACTIVITY
Activity 1
Exploring Probability
Activity 2
Probability and
Codes
Activity 3
Bottle Caps and
Lotteries
Activity 4
Pizzas and Dandelion
Activity 5
Random or Not?
Curriculum Connections: Probability
DESCRIPTION OF THE ACTIVITY
- determining probability of an event by identifying all possible outcomes and all favourable outcomes
- comparing experimental probabilities with theoretical probabilities for simple experiments
- identifying ‘sure things’ as those with probability of ‘1’ and ‘impossible things’ as those with probability of ‘0’
- comparing given relative frequencies of events with experimental data
- applying relative frequencies of letters to the decoding of a given message
- investigating the probability of winning a given lottery
- using tree diagrams to identify all possible outcomes
- estimating, using probability, the number of items of a particular type within a much larger set
- explaining how sampling can be used to give such an estimate
- exploring meanings of “random”
- using a random number table to simulate real-life situations
- testing methods of ways to generate random numbers
- recognizingthedifficultiesinvolvedwhenone tries to devise a list of random numbers
- using a random number table to simulate a lottery, in order to determine the probability of a favourable outcome
CURRICULUM EXPECTATIONS
• connect the possible events and the probability of a particular event
• examineexperimentalprobabilityresults in the light of theoretical results
• examinetheconceptsofpossibilityandprobability
• compareexperimentalprobability results with theoretical results
• showanunderstandingofprobabilityinmaking relevant decisions
• useaknowledgeofprobabilitytoposeand solve problems
• connectthepossibleeventsandtheprobability of a particular event
• usetreediagramstorecordtheresultsofsystematic counting
• useaknowledgeofprobabilitytoposeand solve problems
• connectthepossibleeventsandtheprobability of a particular event
• showanunderstandingofprobabilityinmaking relevant decisions
• useaknowledgeofprobabilitytoposeand solve problems
• usetreediagramstorecordtheresultsofsystemstic counting
• showsanunderstandingofprobabilityin making relevant decisions
• useaknowledgeofprobabilitytoposeand solve problems
• connectthepossibleeventsandtheprobability of a particular event