Investors Presentation February 2017 · 2017-07-15 · Strictly Private and confidential Express...
30
Strictly Private and confidential Investors Presentation February 2017
Transcript of Investors Presentation February 2017 · 2017-07-15 · Strictly Private and confidential Express...

Strictly Private and confidential
Investors PresentationFebruary 2017

Strictly Private and confidential
Mission Statement

Vision and Quality Statement
Vision and Quality Statement
Strictly Private and confidential

Strictly Private and confidential
Year of Commencement 1996
Locations Serviced 40000
Countries Serviced 202
Containerized Vehicles 3000
Air Gateways 24
Company Branch Setup 550
Workforce 2000 +
Sorting Centres 28
B2B and B2C on multi model Distribution
State of the Art Technology with GPS enabled vehicles, CCTV surveillance across all
Sorting Centers
Over 20 + years of industry expertise
“Leader in Express” for our Customers,Shareholders, Employees and Vendors.
An Independent company listed with stockexchanges of India with effective from 1st April,2016 having credit rating of A1+ (ICRA) and A+(CRISIL) with robust numbers backing ourstatement.

CORPORATE GOVERNANCE
LISTED ENTITY
IATA CERTIFICATE
ISO CERTIFIED RATED BY
Business Superbrand Of 2016-17
The Economic Times Iconic Brands Of India - 2017

Strictly Private and confidential
Express Industry- An Outlook
Market Size
The Indian Logistics industry size is estimated at USD 200 billion in 2016-17.
As a premium segment, the express industry is a small but significant segment of the logistics industry.
It is one of the fastest growing segments of the industry.
Market Growth:
The industry is expected to grow at 17% per annum in the next three years.
Express industry is also expected to receive a fillip from the higher level of consumption demand in the country.
The consumption demand in India is expected to grow at 10% over the next 10 years fuelled by higher economic growth, and
this will in turn push the demand for items like electronics, garments, etc, in turn creating additional demand for express
industry.
The growth in express industry, is closely linked to the level of economic activity in the country.
Logistics Spend of GDP:
United States and the European Union, the share of logistics industry in GDP is estimated to be approximately 8% and 7%,
respectively.
Japan, logistics spends form approximately 11% of its GDP.
China, the figure is as high as 18%.
India, various sources have indicated the share of logistics in GDP to be 11%-13%. While the estimates on the size of the
industry vary, it is widely accepted that the logistics industry forms a significant part of any economy and grows in tandem
with the economy.

Strictly Private and confidential
Indian Logistics Sector has come a long way to its current growth. Sharing info on where we stand as a country vis-à-vis US, China.
Planning Commission, Govt. of India has proposed a lot for the infrastructural development which is favourable for the Express Sector
Future : Express Industry
Strictly Private and confidential
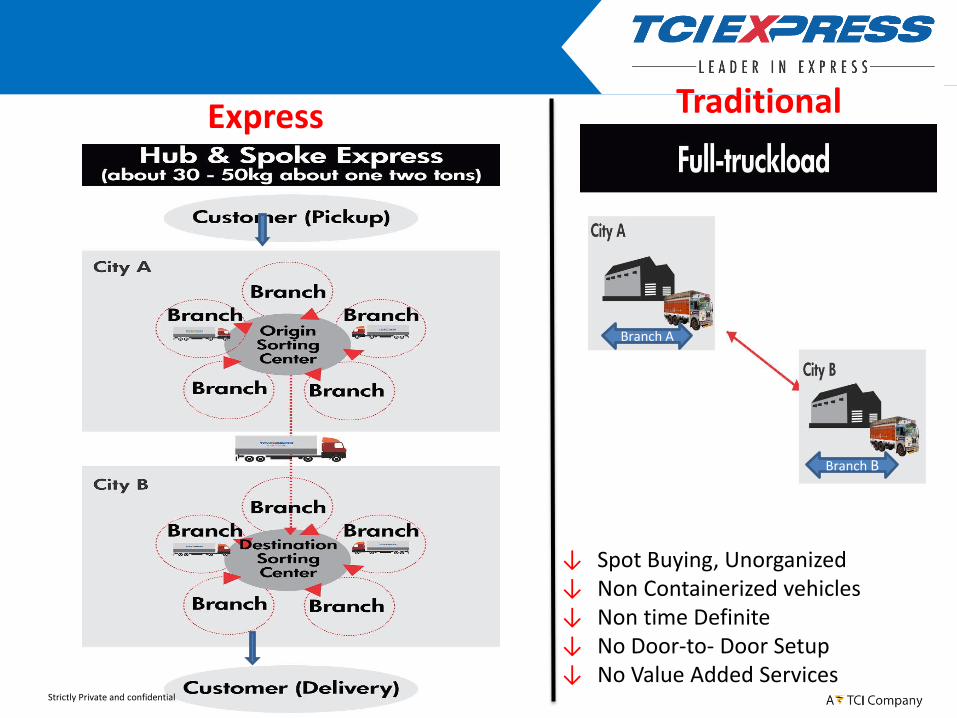
↓ Spot Buying, Unorganized↓ Non Containerized vehicles↓ Non time Definite↓ No Door-to- Door Setup↓ No Value Added Services
Traditional Express
Branch A
Branch B

Strictly Private and confidential
Offers express solutions with over 40000pick-up and delivery locations with itsfully containerized fleet of vehicles. Itoffers customized value added servicesto meet customer’s requirements.
Provides round the clock services andtime sensitive express deliveries. It deliverin all major metros in 24hrs and MiniMetros and A class cities in 48hrs.
Provides services to around 202 Countriesacross the globe(Commercial/Non Commercial).
Offers reverse logistics in effective and costeffective manner. It transports goods fromlocation of the end user to the location ofthe manufacturer.
Service Offerings
Priority service in assured door to door daydefinite delivery services for commercialand non commercial shipments to metroand non metro to selective locations backedby money back guarantee* at no extra cost.
B2C and B2B on Multi Model Distributionfor optimum on time delivery with valueadded features of COD(Cash on delivery).

Strictly Private and confidential
Value Added Services

Strictly Private and confidential
Business Update

Strictly Private and confidential
Express Network
• 28Sorting Centres
• 550Company Owned
Branches
• 400Express Routes
• 2500Feeder Routes
Sorting Centres
Branch Offices

Strictly Private and confidential
New Age Sorting Centers

VENDOR MANAGEMENT (FLEET)
• Inter-state Vehicles
1400
• Intra-state Vehicles
900
• Intra-City Vehicles1700
Better Fleet Control, Back up vehicles available without adding per Lane Cost.
Performance monitoring, Lanes wise Analysis
Fixed Cost Model, only fluctuation is Diesel Prices.
Always New Fleet, Change vehicle after 7 years of service
Control on scheduled Arrival & Departure.
Working well from last 20 years

Strictly Private and confidential
Organization Setup
Zonal Offices
550 Branches
44 Zonal Offices
9 Regional Offices
Corporate Office
Branch offices

Key Technological Implementation
Onsite Booking, Delivery, In/Out Scan Updation.
Dynamic routing & Misroute Alert System
Barcoded Labels printing for Accuracy.
Barcode Scanning of packets on movement of packet for exact position.
GPS in all vehicles for real time packet status.
Provides 24X7 visibility
Barcoding & RFID Hand Held Terminals (HHT) GPS: Ground TechnicalSupport
Accurate dispatch & billing Scanning for speed and accuracy Real-time Vehicle & shipment visibility
CCTV surveillance in All Warehouses and Main Pickup and Delivery Locations.
Operation Control Centre Monitoring for Real Time Corrective Action.
Mobile App for Pickup and Delivery Update at Customer point
Instant POD Uploading.
Customer Pickup Request
Services and Business Locations Enquiry.
Freight Calculator
Strictly Private and confidential

Technology – The Express way
Network Tools for Customers
Network Tools for Internal Applications
Strictly Private and confidential
Shipment Trackingon Website
Shipment Tracking by E-mail
Shipment Tracking On Mobile Phone
Pickup Request forAppointment
Booking
SMS Alert: AutoSMS On Pickup &
Dispatch
Allows Customers to Track Orders
Delivery InvoicingOnline
Auto MIS : Pre-Alert Of Shipment status
DWB/Label Printing At Customer Site forspeedy & accurate
operation.
Customer Portal : Consignment Status,COD Modify, ePOD
Auto eBillingwith ePOD
Online FeedbackSystem For Continuous
Improvement
EDIS : In house Robust ERP having Operations,
Sales & Financial Modules
Vehicle & LoadForecast for Pre-
Planning of Vehicles &Load Mgmt
CRM System for Customer Service
Security Investigation
System
Sales Leads Capture Mobile
System
CCTV Surveillanceat all Warehouses and
Main BKG/DLY Locations
BusinessIntelligence for
DynamicMIS Reports
PeopleSoft for HRMS& Payroll System

Key Metrics of last 5 Years
Strictly Private and confidential
49510
5559559994
65871 66296
0
10000
20000
30000
40000
50000
60000
70000
80000
90000
100000
FY 11-12 FY 12-13 FY 13-14 FY 14-15 FY 15-16
Am
t in
Lac
s
Revenue
3184
3,541
3,874
4,015
4,353
2500
2700
2900
3100
3300
3500
3700
3900
4100
4300
4500
FY 11-12 FY 12-13 FY 13-14 FY 14-15 FY 15-16
Am
t. in
Lac
s
PBT

Key Balance Sheet Items
Figs In Lacs
Particulars 2011-12 2012-13 2013-14 2014-15 2015-16 2016-17*
Net Worth8,564 9,346 10,197 11,543 12,298 15144
Non-Current Liabilities230 53 32 30 294 276
Current Liabilities1,538 2,268 2,215 2,857 7,258 9184
Total10,332 11,667 12,444 14,430 19,850 24,604
Fixed Assets2,190 1,945 1,695 1,460 7,282 9388
Non-Current Assets21 339 278 335 284 422
Current Assets8,121 9,383 10,471 12,635 12,284 14794
Total10,332 11,667 12,444 14,430 19,850 24,604
Strictly Private and confidential
* Figs of F Y 16-17 pertaining to Nine months upto Dec, 2016
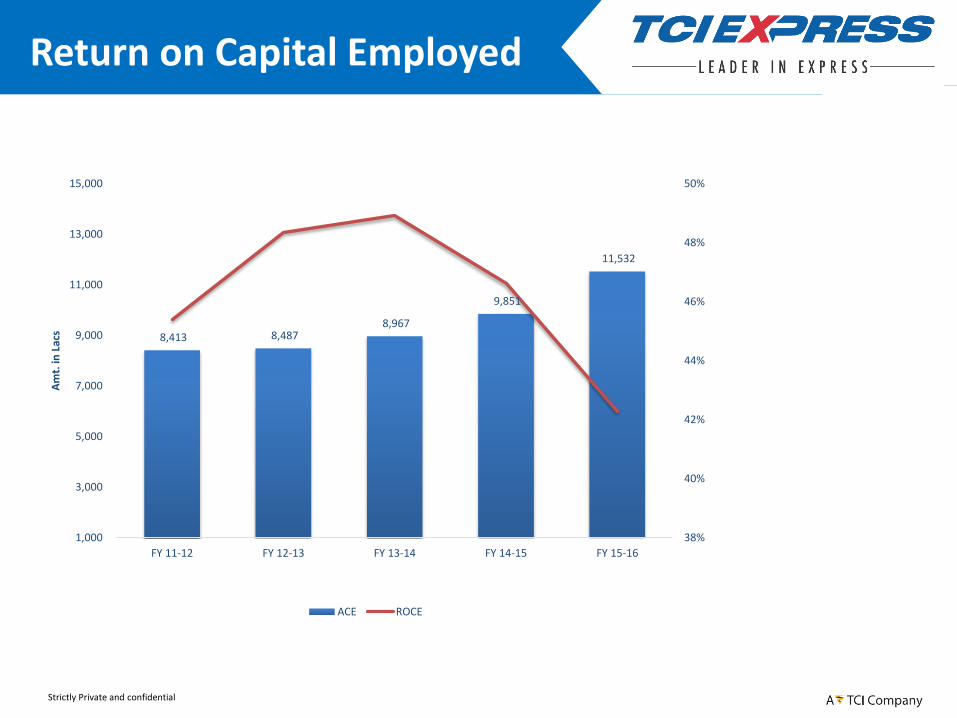
Return on Capital Employed
Strictly Private and confidential
8,413 8,487 8,967
9,851
11,532
38%
40%
42%
44%
46%
48%
50%
1,000
3,000
5,000
7,000
9,000
11,000
13,000
15,000
FY 11-12 FY 12-13 FY 13-14 FY 14-15 FY 15-16
Am
t. in
Lac
s
ACE ROCE

Financial Position: FY 16
Figs In Lacs
Particulars (Rs in lacs.) 2014-15 2015-16
Revenue 65863 66319
Other Income 28 14
Total Income 65891 66333
Revenue growth % 9.80 0.70
Operating expenses 51307 50763
Other expenses 9393 10115
Total Expenses 60700 60878
EBITDA 5191 5455
EBITDA Margin % 7.88 8.22
Interest Expense 576 525
Depreciation 600 579
Exceptional Item 0 0
PBT 4015 4353
PBT Margin % 6.09 6.56
Taxes 1390 1480
PAT 2625 2873
PAT Margin % 3.98 4.33
Particulars (Rs in lacs.) 2014-15 2015-16
1. Shareholders Funds
Share Capital 0 761
Reserves & Surplus 11543 11537
2. Non Current Liabilities
Long term Borrowings 30 58
Deferred tax Liabilities (net) 0 235
Other long term liabilities & Provisions 0 0
3. Current Liabilities
Short term borrowings 25 3975
Trade payables 2267 2316
Other current liabilities 397 769
Short term provisions 168 199
TOTAL 14430 19850
1. Non current Assets
Fixed Assets 1461 7282
Non current Investments 0 0
Long term loans and advances 335 284
2. Current Assets
Inventories 0 0
Trade Receivables 10150 10539
Cash & cash equivalents 714 1091
Short term loans and advances 1771 654
Other current assets 0 0
TOTAL 14430 19850
Strictly Private and confidential

Financial Position: FY 17
Figs In Lacs
Particulars (Rs in lacs.) Q3 ( FY16-17) Q3 ( FY15-16) 9 M (FY 16-17) 9 M (FY 15-16)
Revenue 18758 16521 55105 48290
Other Income 32 (1) 92 (4)
Total Income 18790 16520 55197 48286
Revenue growth % 13.53 4.16 14.31 0.00
Operating expenses 14304 12559 42381 36913
Other expenses 2787 2606 7986 7406
Total Expenses 17091 15165 50367 44319
EBITDA 1699 1355 4830 3967
EBITDA Margin % 9.04 8.20 8.75 8.22
Interest Expense 53 126 148 368
Depreciation 106 142 308 423
PBT 1540 1087 4374 3176
PBT Margin % 8.20 6.58 7.92 6.58
Taxes 537 376 1528 1099
PAT 1003 711 2846 2077
PAT Margin % 5.34 4.30 5.16 4.30
Particulars (Rs in lacs.)As on 31st
Dec 16As on 31st
Dec 15
1. Shareholders Funds
Share Capital 766 0
Reserves & Surplus 14378 11006
2. Non Current Liabilities
Long term Borrowings 23 53
Deferred tax Liabilities (net) 253 200
Other long term liabilities & Provisions 0 0
3. Current Liabilities
Short term borrowings 2013 3353
Trade payables 4710 3285
Other current liabilities 1684 1235
Short term provisions 891 220
TOTAL 24718 19352
1. Non current Assets
Fixed Assets 9388 5628
Non current Investments 0 0
Long term loans and advances 422 226
2. Current Assets
Inventories 0 0
Trade Receivables 12338 11150
Cash & cash equivalents 1077 851
Short term loans and advances 1493 1497
Other current assets 0 0
TOTAL 24718 19352
Strictly Private and confidential

Capital Expenditure Plan
Existing Assets as on
31st March, 2016
Proposed
FY 2016-17
Sorting Centers
5917 4000
Cars214 100
Plant & Machinery539 100
IT (Hardware & Software) Equip.
400 800
Office Equip.144 50
Furniture & Fixtures231 50
Total7448 5000
Strictly Private and confidential

Impact on Macro economic changes In India
DFC/Diamond
Quadrilateral
• Creation of additional dedicated rail freight capacity.• Will reduce unit cost of Transportation since movement would be from road to Rail.• Increased bulk multi modal movement for improved productivity & efficiency• Will result in development of logistic Warehouses in the vicinity of Freight Corridor.• No impact on tci
GST
• Rationalizing the impact of taxes on Production, Distribution and Inventory management• Would lead to faster movement of goods, increase consumption. • Consolidation of warehouses and emergence of point to point model• Increase in Manufacturing hubs.• TCIExpress would beenfir
• With increased per capita disposable income, consumption driven sectors will grow• Sectors like Fashion, Lifestyle, Telecom and consumable durables etc. will get a boost .• positiuve
E-commerce driven growth in
consumption
• Growth in trend towards outsourcing of logistics in non traditional industries • Bringing in more focus from Industry perspective• Postive
Increased outsourcing of
Logistics
Strictly Private and confidential

Strictly Private and confidential
Key Challenges
• Diesel Price Fluctuation: Diesel price fluctuation is the most uncertain cost of operation and has been sporadic in last 4 years.
• Delay in State Check Posts: The inter-state movement of goods in India is subject to multiple taxes and clearances
• Lack of infrastructure has remained a concern for Express Industry, be it Cargo terminals at Airports or Road conditions.
• Unorganized local players has always been a threat to the Industry.
Key Challenges
• To mitigate the impact we have added DFS(Diesel fuel surcharge) in our Contracts both with Vendors and Customers.
• Implementation of GST is expected to streamline the processes and reduce a lot of these delays.
• However Govt. Of India has taken multiple initiatives so as reduce the gaps.
• Post GST we might see some consolidation to happen.
How we See It

Our Esteemed Clientele – Vertical wise
Automobile Pharma Electrical /
Energy Retails Telecom &
Engineering E com
Strictly Private and confidential

BOARD OF DIRECTORS
Welcome all Board Members of
TCI EXPRESS LIMITED
Mr. Phool Chand Sharma Whole Time Director
Mr. D. P. AgarwalChairman & Director
Mr. Chander AgarwalManaging Director
Mr. Vineet AgarwalDirector
Mr. Ashok Kumar LadhaDirector
Mr. Murali Krishna ChevuturiDirector
Mr. Prashant JainDirector
Ms. Taruna SinghiDirector

Shareholding Pattern
66%
16%
5%
3%7%
3%
Shareholding Pattern as on 31st December 2016 Promoters
Indian Public
Foregin Holdings
Body Corporate
Mutual Fund
Others
Company announced its first interim dividend @ 40% (Re 0.80per share on face value of Rs. 2 per share) as on 31 January 2017

Key Associate Company & other group Compaines
Transport Corporation of India Limited
FTL/FCL, LTL & Over-dimensional cargo services through Road, Rail & Sea.
A Single-window solutions enabler from Conceptualization to Implementation
Leading player in Coastal Shipping , NVOCC & Project Cargo
JV with CONCOR to provideend to end multi modal solutions.
SBUs and services
Other group companies
TDL undertakes development of the commercial properties of TCI. It also develops large scale Warehouses, Logistics Parks etc.
JV with Mitsui & Co for Auto logistics (Toyota India project)
TCI Transportation Company Nigeria Ltd.
A JV between Indorama Eleme Petrochemicals Ltd. and TCI GlobalEngaged in areas of education, women & child
health, disability alleviation and rural sports growth.
Strictly Private and confidential

The Beginning
Strictly Private and confidential