Investor's Guide to the New Zealand Beverages Industry 2017 · THE INVESTOR’S GUIDE TO THE NEW...
98
THE INVESTOR’S GUIDE TO THE NEW ZEALAND BEVERAGES INDUSTRY 2017 Part of the New Zealand Food & Beverage Information Project FINAL REPORT; v1.02; June 2017
Transcript of Investor's Guide to the New Zealand Beverages Industry 2017 · THE INVESTOR’S GUIDE TO THE NEW...

THE INVESTOR’S GUIDE TO THE NEW ZEALAND BEVERAGES INDUSTRY 2017 Part of the New Zealand Food & Beverage Information Project
FINAL REPORT; v1.02; June 2017

STEERING & GUIDANCE
This project would not have been possible without the strong guidance of ourSteering Committee. In particular, we would like to thank Andrew McCallumof MBIE for his tireless energy in keeping this project on track, while at thesame time pushing us forward.
Draft versions of parts of this document were distributed to key firms forcomment, addition or correction. This was done in the form of emails andphone calls. We thank those who helped us in this process for their time andeffort. We also thank those who provided their photos.
We are grateful for all of the input we have received, but the report is oursand any errors are our own.
Finally, we acknowledge the support of the Ministry of Business, Innovationand Employment (MBIE), New Zealand Trade and Enterprise (NZTE) and theMinistry of Primary Industries (MPI). It is their funding that has made thisreport possible.
CONSTRAINTS & INHERENT LIMITATIONS
This work was commissioned by the Ministry of Business, Innovation andEmployment (MBIE) and prepared by Coriolis. This work is based onsecondary market research, analysis of information available or provided toCoriolis by our client, and a range of interviews with industry participants andindustry experts. Coriolis have not independently verified this informationand make no representation or warranty, express or implied, that suchinformation is accurate or complete.
The report is dated June 2017 and Coriolis accepts no liability for, and has notundertaken work in respect of, any event subsequent to that date, which mayaffect the report.
Key global trade data analysed in all sections of the F&B Information projectare calculated and displayed in US$. This is done for a range of reasons:
- It is the currency most used in international trade- It allows for cross country comparisons (e.g. vs. Denmark)- It removes the impact of NZD exchange rate variability- It is more comprehensible to non-NZ audiences (e.g. foreign investors)- It is the currency in which the United Nations collects and tabulates
global trade data
Anyone should feel free to call the authors if any of the material cannot beunderstood or accessed. We always welcome opportunities to discuss ourresearch with our readers and users.
Projected market information, analyses and conclusions contained herein arebased (unless sourced otherwise) on the information described above and onCoriolis’ judgment, and should not be construed as definitive forecasts orguarantees of future performance or results. Neither Coriolis nor its officers,directors, shareholders, employees or agents accept any responsibility orliability with respect to this document.
Coriolis wishes to draw your attention to the following limitations of theCoriolis report “New Zealand Beverages Industry 2017“ (the Coriolis Report)including any accompanying presentation, appendices and commentary (theCoriolis Commentary):
a. Coriolis has not been asked to independently verify or audit theinformation or material provided to it by, or on behalf of the Client, or any ofthe parties involved in the project;
b. the information contained in the Coriolis Report and any CoriolisCommentary has been compiled from information and material supplied bythird party sources and publicly available information which may (in part) beinaccurate or incomplete;
c. Coriolis makes no representation, warranty or guarantee, whether expressor implied, as to the quality, accuracy, reliability, currency or completeness ofthe information provided in the Coriolis Report and any Coriolis Commentary,or that reasonable care has been taken in compiling or preparing them;
d. the analysis contained in the Coriolis Report and any Coriolis Commentaryare subject to the key assumptions, further qualifications and limitationsincluded in the Coriolis Report and Coriolis Commentary, and are subject tosignificant uncertainties and contingencies, some of which, if not all, areoutside the control of Coriolis; and
e. any Coriolis Commentary accompanying the Coriolis Report is an integralpart of interpreting the Coriolis Report. Consideration of the Coriolis Reportwill be incomplete if it is reviewed in the absence of the Coriolis Commentaryand Coriolis conclusions may be misinterpreted if the Coriolis Report isreviewed in absence of the Coriolis Commentary.
Coriolis is not responsible or liable in any way for any loss or damageincurred by any person or entity relying on the information in, and theRecipient unconditionally and irrevocably releases Coriolis from liability forloss or damage of any kind whatsoever arising from, the Coriolis Report orCoriolis Commentary including without limitation judgments, opinions,hypothesis, views, forecasts or any other outputs therein and anyinterpretation, opinion or conclusion that the Recipient may form as a resultof examining the Coriolis Report or Coriolis Commentary.
The Coriolis Report and any Coriolis Commentary may not be relied upon bythe Recipient, and any use of, or reliance on that material is entirely at theirown risk. Coriolis shall have no liability for any loss or damage arising out ofany such use.
Unless otherwise noted, all photos used in this discussion document wereprovided by the New Zealand Story resource (www.nzstory.govt.nz),purchased by Coriolis from a range of stock photography providers (asdocumented where required), or are low resolution, complete product/brandfor illustrative purposes used under fair dealing/fair use for both “researchand study” and “review and criticism”. Our usage of them complies with NewZealand law or their various license agreements.
Cover image: Shutterstock (XiXinXing)
Where appropriate, this document is Copyright © 2017 Coriolis and MBIE.However, please feel welcome to use, refer to and cite this research.

Market Overview
Context & Conclusions
Production Categories Growth & Innovation
01 02 03 04INTRO
TABLE OF CONTENTS
Firms Performance
05
Pages 3-10 Pages 11-24 Pages 25-39 Pages 40-49 Pages 50-64 Pages 65+
+ Purpose
+ Situation summary
+ Drivers of success
+ Investment opportunities
+ SWOT
+ Supply chain
+ Global situation
+ Consumption
+ Import demand
+ Export supply
+ Key markets
+ Market growth
+ Wine
+ Beer
+ Juice
+ Alcoholic Spirits
+ Water
+ Production
+ Regional activity
+ Key inputs
+ Growth upside
+ Overview
+ Category Segmentation
+ Exports by product
+ Horizons for growth
+ Emerging export stars
+ Mega-trends driving change
+ Innovation & new products
+ Enterprises
+ Employment
+ Turnover
+ Ownership
+ Foreign investors
+ Acquisitions
+ Investment
+ Rebranding
+ Leadership
+ Firm Profiles
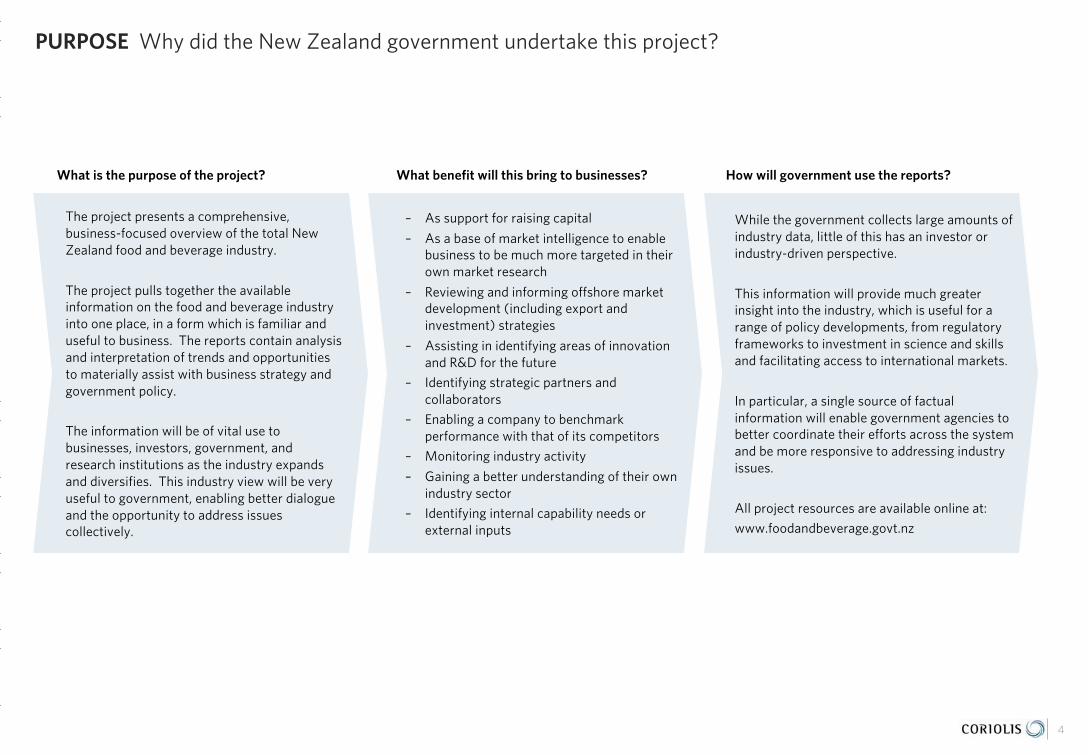
PURPOSE Why did the New Zealand government undertake this project?
4
The project presents a comprehensive, business-focused overview of the total New Zealand food and beverage industry.
The project pulls together the available information on the food and beverage industry into one place, in a form which is familiar and useful to business. The reports contain analysis and interpretation of trends and opportunities to materially assist with business strategy and government policy.
The information will be of vital use to businesses, investors, government, and research institutions as the industry expands and diversifies. This industry view will be very useful to government, enabling better dialogue and the opportunity to address issues collectively.
– As support for raising capital
– As a base of market intelligence to enable business to be much more targeted in their own market research
– Reviewing and informing offshore market development (including export and investment) strategies
– Assisting in identifying areas of innovation and R&D for the future
– Identifying strategic partners and collaborators
– Enabling a company to benchmark performance with that of its competitors
– Monitoring industry activity
– Gaining a better understanding of their own industry sector
– Identifying internal capability needs or external inputs
While the government collects large amounts of industry data, little of this has an investor or industry-driven perspective.
This information will provide much greater insight into the industry, which is useful for a range of policy developments, from regulatory frameworks to investment in science and skills and facilitating access to international markets.
In particular, a single source of factual information will enable government agencies to better coordinate their efforts across the system and be more responsive to addressing industry issues.
All project resources are available online at:
www.foodandbeverage.govt.nz
What is the purpose of the project? What benefit will this bring to businesses? How will government use the reports?

SITUATION SUMMARY: WINE The New Zealand wine industry has shown rapid growth driven by Marlborough Sauvignon Blanc; some diversification into new varieties and new regions is occurring
5
NEW ZEALAND WINE
The New Zealand wine industry has achievedspectacular growth over the last 40 years, going fromNZ£51 in exports in 1960 to NZ$1.6b in 2016. TodayNew Zealand competes successfully with major wineproducers, both old world (e.g. France, Germany) andnew (e.g. Australia). New Zealand has achieved anoverall premium price position in–market on par withFrance (which has been producing wine for ~2,000years).
International success to date has been built almostexclusively on Marlborough Sauvignon Blanc whichhas become a “must-have” wine for major wineplayers. However good Marlborough wine area isnow almost all used. This may be a good thing asMarlborough now has almost as much area in grapesas Burgundy.
Emergent secondary regions are 20 years behindMarlborough in terms of development. Hawkes Bay,Waipara and Central Otago stand out as the next bestprospects. However, other than HawkesBay/Gimblett Gravels Syrah and Central Otago PinotNoir most regions have yet to find “their” wine andthe experience of Europe suggest this could takesome time.
Wine production is a fast growing industry for NewZealand, with a number of firms, ranging from verylarge to very small. Many large wineries are now
foreign owned and on-going acquisitions areoccurring. As a result foreign ownership now plays abig part in the wine industry, and these global firmswith their global sales resources and reach, provide apath-to-market for introducing global consumers toNew Zealand wines.
That being said, there is a substantial group ofsuccessful medium sized New Zealand ownedwineries that, in many ways, are the key force drivingindustry quality and innovation forward (e.g. lightwine development).
COMPETITORS
New Zealand wine competes directly with that fromother premium temperate climate countries,particularly France, Germany, cooler parts of the US(e.g. Oregon) and Chile.
CONSUMERS/MARKETS
Global oversupply has been ongoing, pushing downprices. These falling prices have impacted NewZealand wines.
At the same time wine consumption is declining inmany EU markets (France, Italy, Spain) for social,lifestyle and economic reasons. These twin forces,
falling consumption and falling prices, have in turntriggered a decrease in global wine area andproduction, particularly in the three largest wineproducers (France, Italy & Spain). On-going changesto EU subsidy systems have accelerated the process.
New Zealand’s success to date in wine has beenprimarily in the Anglo-Saxon four (USA, Canada, UK& AU). Luckily these markets have had stable-to-increasing consumption. However, it would be in theinterest of New Zealand producers to develop newmarkets to reduce this concentrated reliance on thesemarkets.
China is a rapidly emerging growth market for globalwine and is now the fourth largest wine importingcountry in the world by value. China is now NewZealand’s sixth wine export destination and growing.
Available in-market data suggests - at a high level -that the growth of New Zealand wine is at theexpense of French wines (i.e. the two are closesubstitutes for consumers).
Source: Coriolis; interviews

SITUATION SUMMARY: OTHER BEVERAGES Outside wine, the New Zealand beverage sector is primarily focused on production for domestic consumption; however, exports are growing strongly for many products
6
SPIRITS
Prior to 2000 there is a wide range of small spiritventures, producing small scale niche spirits for thedomestic market. At the same time IndependentLiquor launched RTD2 spirit beverages primarily fordomestic consumption and export to Australia.
Everything changed with the launch, rapid growth andfinancial success of 42 Below which created globalawareness of New Zealand as a super-premiumspirits provider. In the wake of 42 Below a largenumber of new firms have entered the industry with awide range of products and brands.
Independent Liquor, recently purchased by Asahi, isthe largest player in spirits. Independent initiallydeveloped its business around flavoured RTD drinks,however it is diversifying into other alcoholicbeverages. The two main brewers also produce andpack spirits, as well as distribute imported productsand brands.
There are a range of other smaller firms in spiritsachieving strong growth and the sector is wellpositioned for further growth (see related project2012 Spirits Opportunity report).
BEER
Globally, mainstream beer brewing has beendominated by large companies mainly leveraging
scale, point-of-purchase control and distributioneconomics. New Zealand’s three mainstreambrewers focused on domestic consumption are: DBBreweries (Heineken), Lion (Kirin) and Independent(Asahi).
This situation is changing rapidly with the emergenceof a burgeoning craft brewing scene. New Zealandnow has a range of smaller/micro breweries, risingwith the growth of craft beer. Leaders in this spaceinclude Moa Brewing, McCashin’s, Harrington’s andmany other smaller, innovative firms.
New Zealand is a currently a minor beer exporter1,and imports more beer than it exports. However, beerexports have surged in the last few years. Thecountry is known for its specialty hops and both usesthese domestically and exports them.
SOFT-DRINKS/FLAVOURED BEVERAGES
Non-alcoholic beverages are relatively consolidatedacross two international companies that primarilymanufacture for domestic consumption:
− Coca-Cola Amatil, Australian-listed Asia-Pacificlicensee of Coca-Cola;
− Frucor, former Apple & Pear Marketing Board juicebusiness, now a division of Suntory (Japan); makerof V energy drink and the Pepsi licensee in NewZealand.
Smaller innovators emerging outside core soft-drinks.Organic-producer Phoenix (Charlie’s/TBDC) ownedby Asahi.
A large range of premium adult beverages are gainingtraction across multiple channels.
JUICE
New Zealand exports apple and kiwifruit juice,primarily as a secondary product of the fresh fruitindustry. However New Zealand imports +20% morejuice than it exports and domestic fruit productioncost structures suggest a premium/niche strategy.
WATER
New Zealand has excellent theoretical potential toproduce and export premium bottled water. Anumber of brands and companies have moved intothis premium space (e.g. One, Antipodes and Palaeo).However, to date, little of this potential has beenrealised.
1. RTD = ready-to-drink; 2. Mexico, for example, exports 80x as much beer as New Zealand; NZ currently exports about as much beer as the Dominican Republic

DRIVERS OF SUCCESS New Zealand’s success in beverages has three key drivers
Source: photo credit (NZStory and images under license from shutterstock.com) 7
- Temperate climate similar to Italy or France
- Temperature extremes moderated by surrounding ocean
- Isolated location protected by natural barriers
Low production cost
IDEAL CLIMATE & SOILS EFFICIENT PEOPLE & SYSTEMS LOCATION & MARKETS
Trusted byconsumers
High share in key products
- Innovative New World wine producer that burst onto the global wine scene in the 1980’s
- Industry highly focused on export success
- Large pool of skilled people
- Strong systems and support networks
- Well-organised, cohesive industry
- Excellent proximity to East & South-East Asian markets
- CER agreement with Australia
- NZ was the first developed country to sign a free trade deal with China (2008)
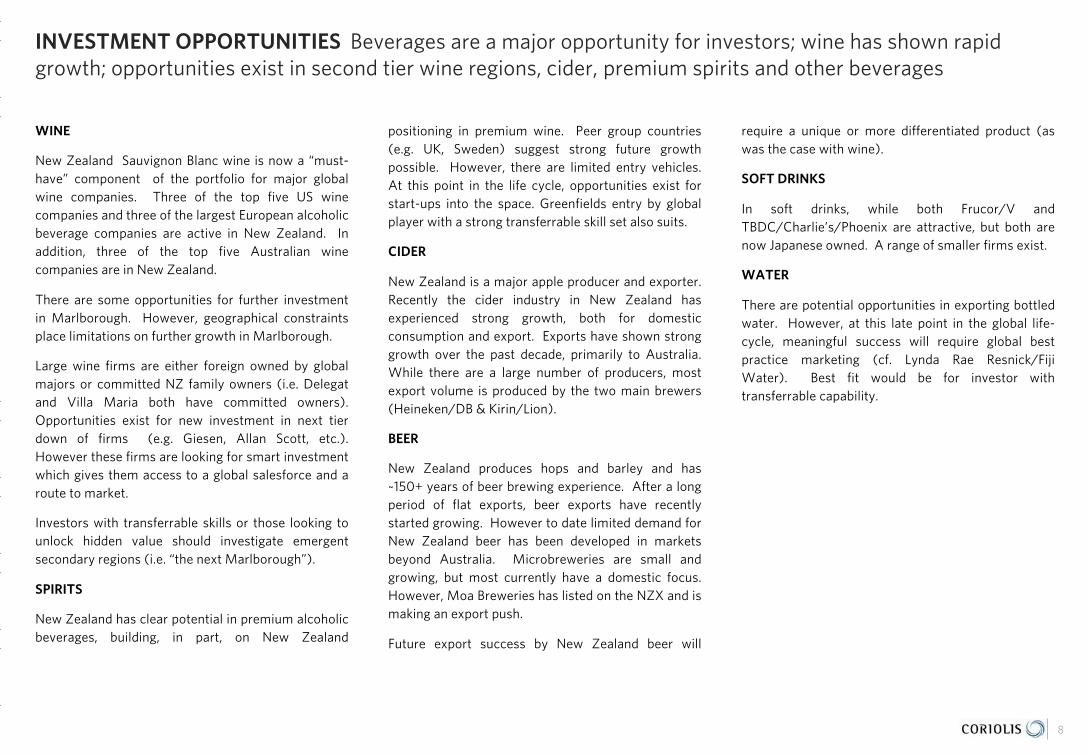
INVESTMENT OPPORTUNITIES Beverages are a major opportunity for investors; wine has shown rapid growth; opportunities exist in second tier wine regions, cider, premium spirits and other beverages
8
WINE
New Zealand Sauvignon Blanc wine is now a “must-have” component of the portfolio for major globalwine companies. Three of the top five US winecompanies and three of the largest European alcoholicbeverage companies are active in New Zealand. Inaddition, three of the top five Australian winecompanies are in New Zealand.
There are some opportunities for further investmentin Marlborough. However, geographical constraintsplace limitations on further growth in Marlborough.
Large wine firms are either foreign owned by globalmajors or committed NZ family owners (i.e. Delegatand Villa Maria both have committed owners).Opportunities exist for new investment in next tierdown of firms (e.g. Giesen, Allan Scott, etc.).However these firms are looking for smart investmentwhich gives them access to a global salesforce and aroute to market.
Investors with transferrable skills or those looking tounlock hidden value should investigate emergentsecondary regions (i.e. “the next Marlborough”).
SPIRITS
New Zealand has clear potential in premium alcoholicbeverages, building, in part, on New Zealand
positioning in premium wine. Peer group countries(e.g. UK, Sweden) suggest strong future growthpossible. However, there are limited entry vehicles.At this point in the life cycle, opportunities exist forstart-ups into the space. Greenfields entry by globalplayer with a strong transferrable skill set also suits.
CIDER
New Zealand is a major apple producer and exporter.Recently the cider industry in New Zealand hasexperienced strong growth, both for domesticconsumption and export. Exports have shown stronggrowth over the past decade, primarily to Australia.While there are a large number of producers, mostexport volume is produced by the two main brewers(Heineken/DB & Kirin/Lion).
BEER
New Zealand produces hops and barley and has~150+ years of beer brewing experience. After a longperiod of flat exports, beer exports have recentlystarted growing. However to date limited demand forNew Zealand beer has been developed in marketsbeyond Australia. Microbreweries are small andgrowing, but most currently have a domestic focus.However, Moa Breweries has listed on the NZX and ismaking an export push.
Future export success by New Zealand beer will
require a unique or more differentiated product (aswas the case with wine).
SOFT DRINKS
In soft drinks, while both Frucor/V andTBDC/Charlie’s/Phoenix are attractive, but both arenow Japanese owned. A range of smaller firms exist.
WATER
There are potential opportunities in exporting bottledwater. However, at this late point in the global life-cycle, meaningful success will require global bestpractice marketing (cf. Lynda Rae Resnick/FijiWater). Best fit would be for investor withtransferrable capability.
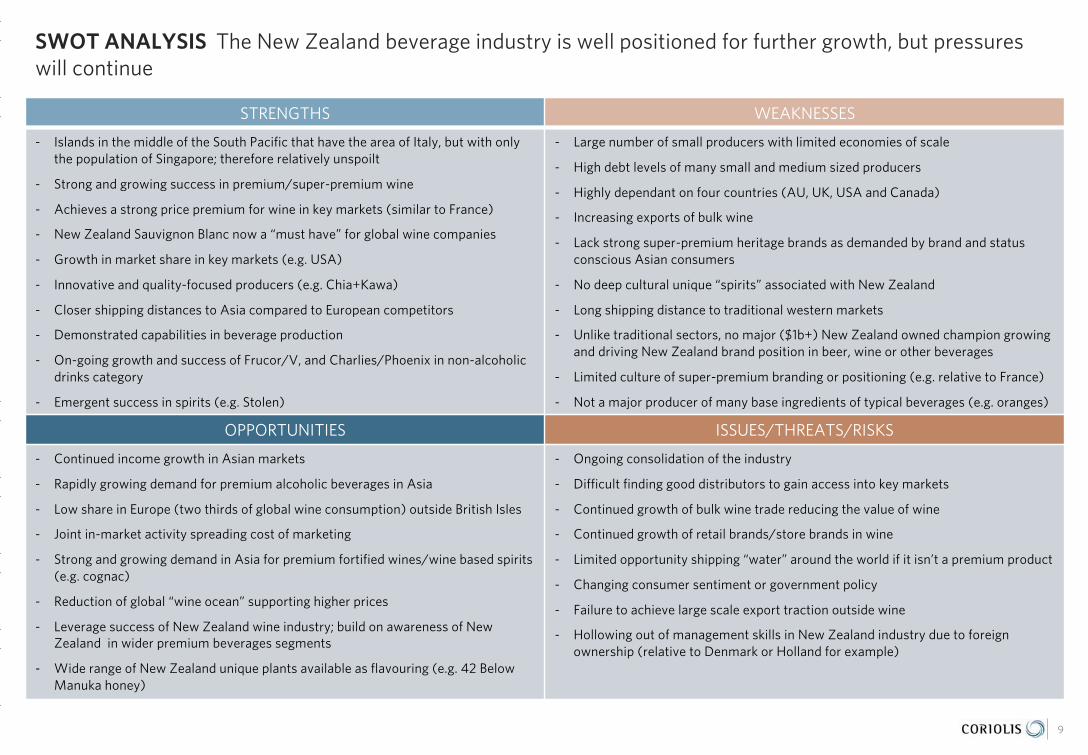
SWOT ANALYSIS The New Zealand beverage industry is well positioned for further growth, but pressures will continue
STRENGTHS WEAKNESSES
- Islands in the middle of the South Pacific that have the area of Italy, but with only the population of Singapore; therefore relatively unspoilt
- Strong and growing success in premium/super-premium wine
- Achieves a strong price premium for wine in key markets (similar to France)
- New Zealand Sauvignon Blanc now a “must have” for global wine companies
- Growth in market share in key markets (e.g. USA)
- Innovative and quality-focused producers (e.g. Chia+Kawa)
- Closer shipping distances to Asia compared to European competitors
- Demonstrated capabilities in beverage production
- On-going growth and success of Frucor/V, and Charlies/Phoenix in non-alcoholic drinks category
- Emergent success in spirits (e.g. Stolen)
- Large number of small producers with limited economies of scale
- High debt levels of many small and medium sized producers
- Highly dependant on four countries (AU, UK, USA and Canada)
- Increasing exports of bulk wine
- Lack strong super-premium heritage brands as demanded by brand and status conscious Asian consumers
- No deep cultural unique “spirits” associated with New Zealand
- Long shipping distance to traditional western markets
- Unlike traditional sectors, no major ($1b+) New Zealand owned champion growing and driving New Zealand brand position in beer, wine or other beverages
- Limited culture of super-premium branding or positioning (e.g. relative to France)
- Not a major producer of many base ingredients of typical beverages (e.g. oranges)
OPPORTUNITIES ISSUES/THREATS/RISKS
- Continued income growth in Asian markets
- Rapidly growing demand for premium alcoholic beverages in Asia
- Low share in Europe (two thirds of global wine consumption) outside British Isles
- Joint in-market activity spreading cost of marketing
- Strong and growing demand in Asia for premium fortified wines/wine based spirits (e.g. cognac)
- Reduction of global “wine ocean” supporting higher prices
- Leverage success of New Zealand wine industry; build on awareness of New Zealand in wider premium beverages segments
- Wide range of New Zealand unique plants available as flavouring (e.g. 42 Below Manuka honey)
- Ongoing consolidation of the industry
- Difficult finding good distributors to gain access into key markets
- Continued growth of bulk wine trade reducing the value of wine
- Continued growth of retail brands/store brands in wine
- Limited opportunity shipping “water” around the world if it isn’t a premium product
- Changing consumer sentiment or government policy
- Failure to achieve large scale export traction outside wine
- Hollowing out of management skills in New Zealand industry due to foreign ownership (relative to Denmark or Holland for example)
9
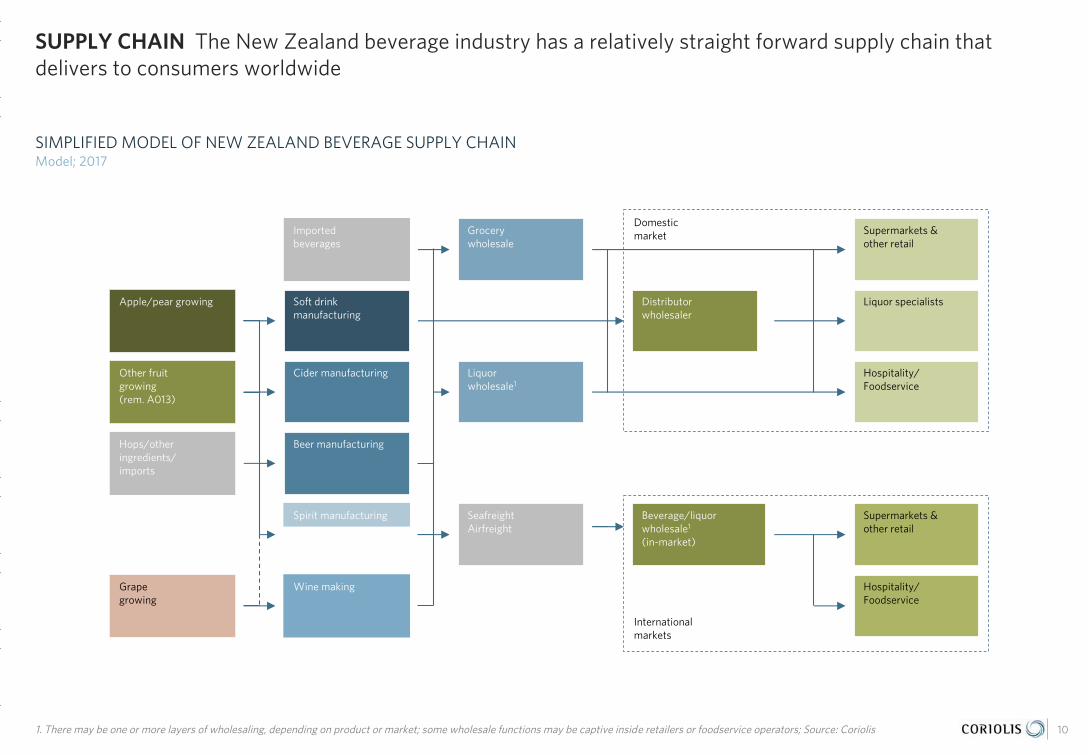
SUPPLY CHAIN The New Zealand beverage industry has a relatively straight forward supply chain that delivers to consumers worldwide
1. There may be one or more layers of wholesaling, depending on product or market; some wholesale functions may be captive inside retailers or foodservice operators; Source: Coriolis
SIMPLIFIED MODEL OF NEW ZEALAND BEVERAGE SUPPLY CHAINModel; 2017
10
Soft drink manufacturing
Liquor wholesale1
SeafreightAirfreight
Liquor specialists
Hospitality/ Foodservice
Beverage/liquorwholesale1
(in-market)
Supermarkets & other retail
Internationalmarkets
Domesticmarket
Distributorwholesaler
Other fruit growing(rem. A013)
Apple/pear growing
Grape growing
Wine making
Beer manufacturing
Hospitality/ Foodservice
Supermarkets & other retail
Spirit manufacturing
Hops/other ingredients/ imports
Grocerywholesale
Imported beverages
Cider manufacturing

Global Market Overview
+ Consumption
+ Global trade
+ Import demand
+ Export supply
+ Key markets
+ Market growth
01

New Zealand has a strong position in the growing global beverages trade
PRODUCTION
- Beverages are a huge global market spread across a wide range of products
- In terms of final litres consumed, the key products are tap water, tea, packaged water, beer and carbonated soft drinks
GLOBAL TRADE
- Global cross-border beverage trade volumes are growing (5.6% CAGR) with moderate price gains across the cycle leading to export value growth
DEMAND: PRODUCT CATEGORIES
- Total global cross-border beverage trade is spread across a wide range of products, though bottled wine ($22.7b), beer ($12.7b), Whiskeys ($10.9b) and wider soft drinks ($17.5) stand out for size
- “Other flavoured beverages,” gin, “other alcoholic spirits,” soft drinks, beer and mineral water stand out for global growth over the past five years
- Imports vary in their average beverage price paid per litre, with sparking wine, spirits and bottled wine standing out for achieving high average prices
DEMAND: IMPORT MARKETS
- Total global cross-border demand for beverages was US$116b in 2015; Europe (including inter-EU) is the single largest market, followed by E/SE Asia ($20.5b) and the US ($20.3b)
- China, various other E/SE Asian countries and the USA stand out for beverage import market growth
- Markets vary in average beverage import price, with Japan, China, much of E/SE Asia and the USA standing out as high value markets
SUPPLY: EXPORTERS
- On the supply side, Europe (including inter-EU) dominates the global beverage trade followed by the US; overall New Zealand is a strong second-tier supplier
- New Zealand in “on a roll” in beverages and has gained global export share in the past decade; the country appears to be closing in on Ireland and Australia
- New Zealand achieved a solid growth performance in beverage exports over the past five years, beating Europe and Australia in rate of growth
- The average export price received for beverages varies among countries, with New Zealand outperforming almost all competitors, including France
12
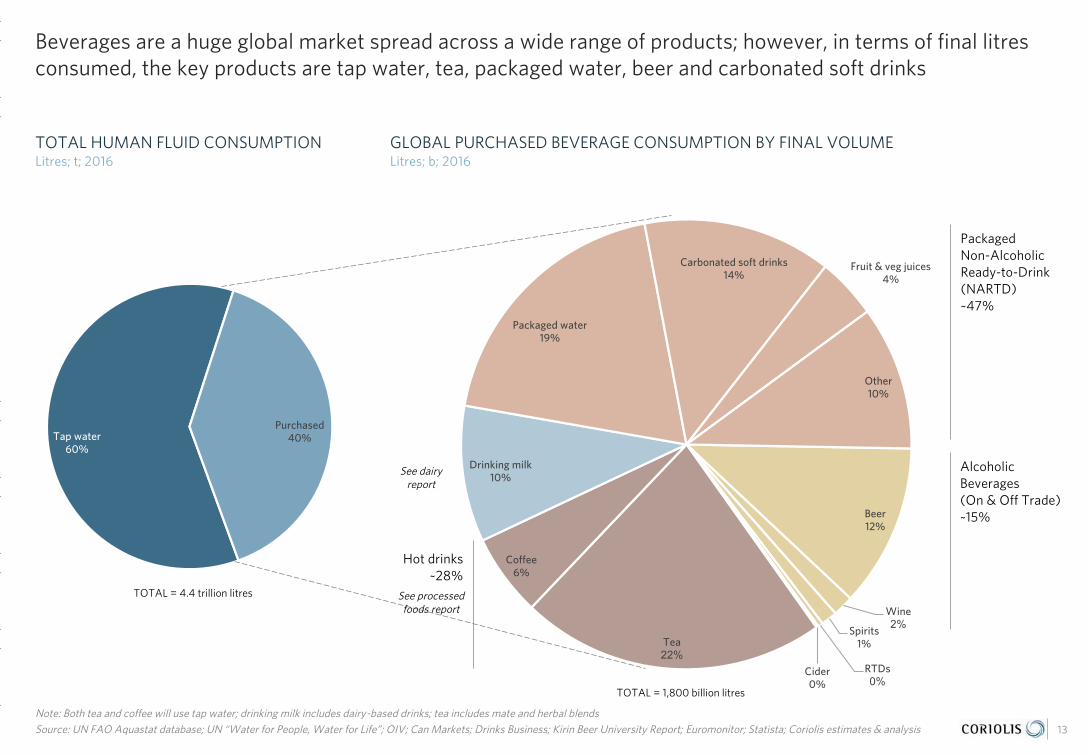
Beverages are a huge global market spread across a wide range of products; however, in terms of final litres consumed, the key products are tap water, tea, packaged water, beer and carbonated soft drinks
Tap water60%
Purchased40%
Beer12%
Wine2%
Spirits1%
RTDs0%
Cider0%
Tea22%
Coffee6%
Drinking milk10%
Packaged water19%
Carbonated soft drinks14%
Fruit & veg juices4%
Other10%
13
Note: Both tea and coffee will use tap water; drinking milk includes dairy-based drinks; tea includes mate and herbal blendsSource: UN FAO Aquastat database; UN “Water for People, Water for Life”; OIV; Can Markets; Drinks Business; Kirin Beer University Report; Euromonitor; Statista; Coriolis estimates & analysis
TOTAL HUMAN FLUID CONSUMPTIONLitres; t; 2016
GLOBAL PURCHASED BEVERAGE CONSUMPTION BY FINAL VOLUMELitres; b; 2016
TOTAL = 4.4 trillion litres
TOTAL = 1,800 billion litres
PackagedNon-AlcoholicReady-to-Drink (NARTD)~47%
AlcoholicBeverages(On & Off Trade)~15%
See dairy report
See processed foods report
Hot drinks~28%

Global cross-border beverage trade volumes are growing (5.6% CAGR) with moderate price gains across the cycle leading to export value growth
-
10.0
20.0
30.0
40.0
50.0
60.0
70.0
80.0
90.0
200
5
200
6
200
7
200
8
200
9
2010
2011
2012
2013
2014
2015
14Note: data excludes “other [bulk] water” is as reported sender FOB; Source: UN FAO database; Coriolis classification and analysis
GLOBAL EXPORT VOLUMEL; b; 2005-2015
AVERAGE GLOBAL EXPORT PRICEUS$/l; actual; 2005-2015
$0.00
$0.20
$0.40
$0.60
$0.80
$1.00
$1.20
$1.40
$1.60
$1.80
200
5
200
6
200
7
200
8
200
9
2010
2011
2012
2013
2014
2015
GLOBAL EXPORT VALUEUS$; b; 2005-2015
$0
$20
$40
$60
$80
$100
$120
$140
200
5
200
6
200
7
200
8
200
9
2010
2011
2012
2013
2014
2015
X =
10y CAGR4.2% 10y CAGR
1.3%10y CAGR
5.6%

Total global cross-border beverage trade is spread across a wide range of products, though bottled wine ($22.7b), beer ($12.7b), Whiskeys ($10.9b) and wider soft drinks ($17.5) stand out for size
Note: 2015 is latest available globally; data is as reported sender FOB; Source: UN Comtrade database; Coriolis analysis
TOTAL GLOBAL BEVERAGE IMPORT VALUE BY PRODUCT OR PRODUCT CATEGORYUS$; b; FOB; 2015
15
Total = $116.2
Wine SpiritsBeer
Juices
Vinegar
Water
Soft Drinks
Ethyl Alcohol$7.0
$14.7$14.1 $35.2 $17.5$31.8
$0.6
$2.4
Apple juice$1.7
Orange juice not-frozen unsweetened$1.9
Wine, bulk$3.2
Vodka$2.2
Grape must$0.1
Beer$12.7
Wine, bottle$22.7
Other juices$7.4
Orange juice not-frozen sweetened$1.7
Cider; other fermented$1.4
Apple juice, unsweetened$0.4
Soft drinks$7.2
Frozen orange juice$1.7
Brandy/Cognac$6.1
Rum$1.0
Other flavoured beverages$10.3
Mineral w
ater$2.4
Liqueurs$2.9
Sparkling wine$5.8
Other alc. Spirits$4.3
Whiskeys$10.9
Gin$0.9

Bubble size is proportional to beverage import value in 2015; a bubble this size is US$3b
“Other flavoured beverages,” gin, “other alcoholic spirits,” soft drinks, beer and mineral water stand out for global import growth over the past five years
Note: 2015 is latest available globally; data is as reported sender FOB; Source: UN Comtrade database; Coriolis analysis
5Y IMPORT GROWTH MATRIX: 5Y VOLUME VS. 5Y CAGR VALUE VS. VALUE 2015 BY PRODUCT L; b; % of US$; US$b; FOB; 2010 vs. 2015
16
5%
10%
2.501.501.000.50 2.00 3.00
0%
4.00-4%
-0.50-1.00 3.500.00
Other flavoured beverages
$3
Vinegar
Mineral water
Whiskeys
Brandy/Cognac
Rum
Vodka
Liqueurs
Grape must
Wine, bottle
Cider; other fermented
Beer
Sparkling wine
Wine, bulk
Frozen orange juice
Orange juice not-frozen unsweetened
Orange juice not-frozen sweetened
Soft drinks
Other juices Ethyl Alcohol
Gin
Other alc. Spirits
Apple juice, unsweetened
Apple juice
5Y Change in volume (l; b) of beverages imported; 10-15
5Y CAGR value
US$; 10-15
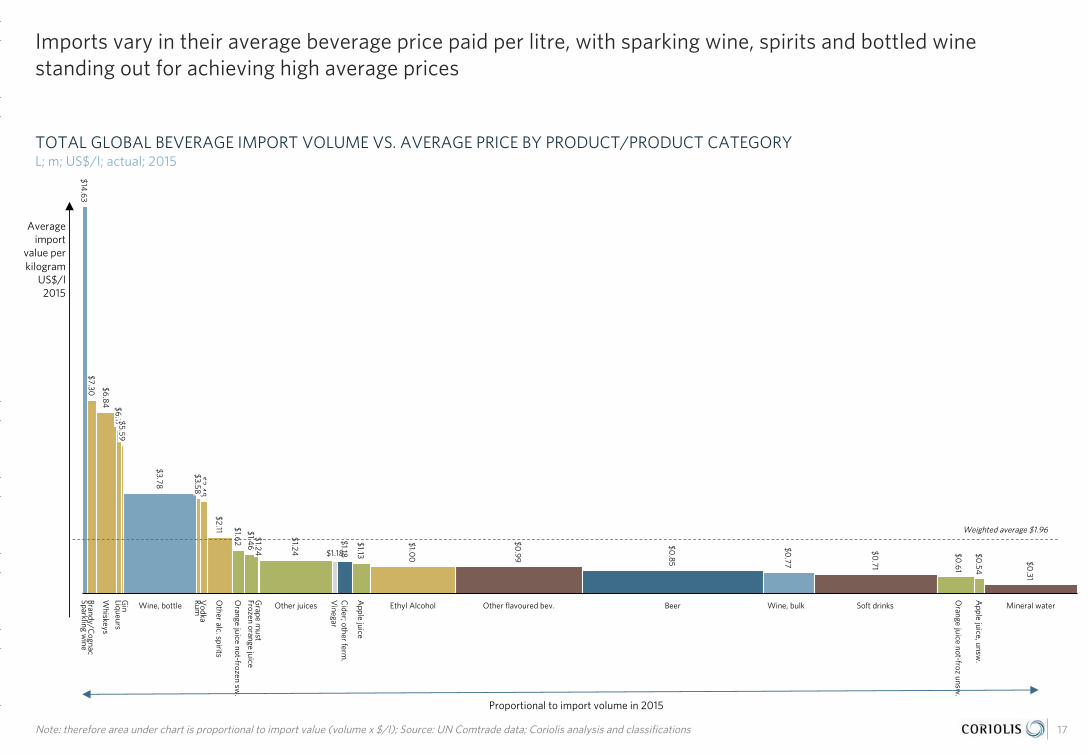
Imports vary in their average beverage price paid per litre, with sparking wine, spirits and bottled wine standing out for achieving high average prices
Note: therefore area under chart is proportional to import value (volume x $/l); Source: UN Comtrade data; Coriolis analysis and classifications
TOTAL GLOBAL BEVERAGE IMPORT VOLUME VS. AVERAGE PRICE BY PRODUCT/PRODUCT CATEGORYL; m; US$/l; actual; 2015
17
Wine, bottle Wine, bulk
Apple juice, unsw
.
Orange juice not-frozen sw
.
Rum
Grape m
ust
Sparkling wine
Cider; other ferm
.
Whiskeys
Ethyl Alcohol
Brandy/Cognac
Soft drinks
Vinegar
Liqueurs
Mineral waterBeer
Other alc. spirits
Gin Other flavoured bev.
Apple juice
Orange juice not-froz unsw
.
Vodka
Frozen orange juice
Other juices
$0.71
$14.63
$0.61
$1.46
$3.48
$1.00
$6.17
$0.31
$1.18
$0.85
$1.13
$1.18
$3.58
$7.30
$0.54
$1.62 $1.24 $0.77
$5.59
$0.99
$2.11
$3.78
$1.24
$6.84
Proportional to import volume in 2015
Average import
value per kilogram
US$/l2015
Weighted average $1.96

Total global cross-border demand for beverages was US$116b in 2015; Europe (including inter-EU) is the single largest market, followed by E/SE Asia ($20.5b) and the USA ($20.3b)
Note: 2015 is latest available globally; data is as reported sender FOB; Source: UN Comtrade database; Coriolis analysis
GLOBAL BEVERAGE IMPORT VALUE BY RECEIVING COUNTRY/REGIONUS$; b; FOB; 2015
18
Total = $116.2
EuropeAmericasAustralasia
NA
/ME/C
A
E/SE AsiaS Asia
SS Africa
$31.0
SS Africa
$3.2
$53.0
Germany$8.0
Other E Asia$1.6
$2.5
Belgium$3.9
Other Europe$19.5
France$4.9
United Kingdom$8.7
$20.5
Russia$1.5
Belarus$0.2
Panama$0.5
United A
rab Emirates
$1.1
$4.4$3.2 $1.6
Other Americas$2.9
Mexico$1.1
India$0
.5
South Korea$1.4
Japan$3.2
Canada$5.3
Singapore$2.2
Other N
A/M
E/CA
$3.3
Thailand$0.6
Malaysia$0.7
Brazil$0.8
Other S A
sia$1.1
Netherlands$5.8
USA$20.3
Vietnam$1.8
Other SE Asia$2.0
Other Pacific
$0.3
Hong Kong SAR$2.6
Australia$1.9
Turkey$0.5
China$4.4
NZ
$0.3

Bubble size is proportional to beverage import value in 2015; a bubble this size is US$3b
China, various other E/SE Asian countries and the United States stand out for beverage import market growth
Note: 2015 is latest available globally; data is as reported sender FOB; Source: UN Comtrade database; Coriolis analysis
5Y IMPORT GROWTH MATRIX: 5Y VOLUME VS. 5Y CAGR VALUE VS. VALUE 2015 BY RECEIVING COUNTRY/REGIONL; b; % of US$; US$b; FOB; 2010 vs. 2015
19
2.5 3.0-0.5 1.51.00.50.0 2.0
5%
0%
10%
18%
15%
-5%
Japan
South Korea
Other SE Asia
Other E Asia
$3
Hong Kong SAR
China
Other Americas
UK
Panama
FranceGermany
Netherlands
Other Pacific
Australia
NZ
USA
Mexico
Brazil
Canada
Belgium
Vietnam
Other NA/ME/CA
India
Other S Asia
SingaporeMalaysia
Thailand
Belarus
Russia
Other Europe
United Arab EmiratesTurkey
SS Africa
5Y Change in import volume (l;b) of beverages imported; 10-15
5Y CAGR import
value US$; 10-
15

Markets vary in average beverage import price paid, with Japan, China, much of E/SE Asia and the USA standing out as high value markets
Note: therefore area under chart is proportional to import value (volume x $/l); Source: UN Comtrade data; Coriolis analysis and classifications
GLOBAL BEVERAGE IMPORT VOLUME VS. AVERAGE IMPORT PRICE BY KEY MARKETL; b; US$/l; actual; 2015
20
Panama
Mexico
UK
NZ
Other A
mericas
SS Africa
Belgium
Other SE A
sia
Australia
Other Pacific
South Korea
Netherlands
India
Other N
A/M
E/CA
Singapore
Other Europe
Japan
Thailand
China
Turkey
Other E A
siaM
alaysia
France
Vietnam
UA
E
Russia
Canada
Germany
Other S A
sia
Brazil
USA
Hong K
ong SAR
Belarus
$1.16
$1.19
$1.17
$1.94
$1.08
$2.12
$1.50
$2.63
$4.03
$3.59
$4.40
$1.65
$1.22
$2.48$2.29
$1.18$1.10
$1.64
$1.17
$0.87
$0.58
$2.22
$1.05
$0.99
$1.16
$1.98$1.87
$2.83
$2.07
$0.81
$1.50
$1.84$1.68
Proportional to import volume in 2015
Average import
value per kilogram
US$/l; 2015
Weighted average $1.42

On the supply side, Europe (including inter-EU) dominates the global beverage trade followed by the United States; overall New Zealand is a strong second-tier supplier
Note: 2015 is latest available globally; data is as reported sender FOB; Source: UN Comtrade database; Coriolis analysis
TOTAL GLOBAL BEVERAGE EXPORT VALUE BY SENDING COUNTRY/REGIONUS$; b; FOB; 2015
21
Total = $116.2
EuropeAmericasAustralasia
NA
/ME/C
A
E/SE Asia
S Asia
SS Africa
Other Americas$1.3
Argentina$1.3
$74.2$3.3
Hong Kong SAR$1.3
$22.2
France$16.5
$2.0
Netherlands$6.6
Guatemala$0.3
Russia$0.5
Chile$2.1
$12.1
$1.8
Belarus$0.1
$0.8
United Kingdom$10.0
Other S A
sia$0
.4
China$2.1
Canada$0.9
USA$8.6
Brazil$3.1
Thailand$2.0
Singapore$2.8
Turkey$0.5
Other E Asia$3.8
Other Pacific
$0.1
Germany$6.6
Other Europe$24.6
India$0
.3
Italy$8.9
Australia$1.9
Mexico$4.7
New
Zealand
$1.3
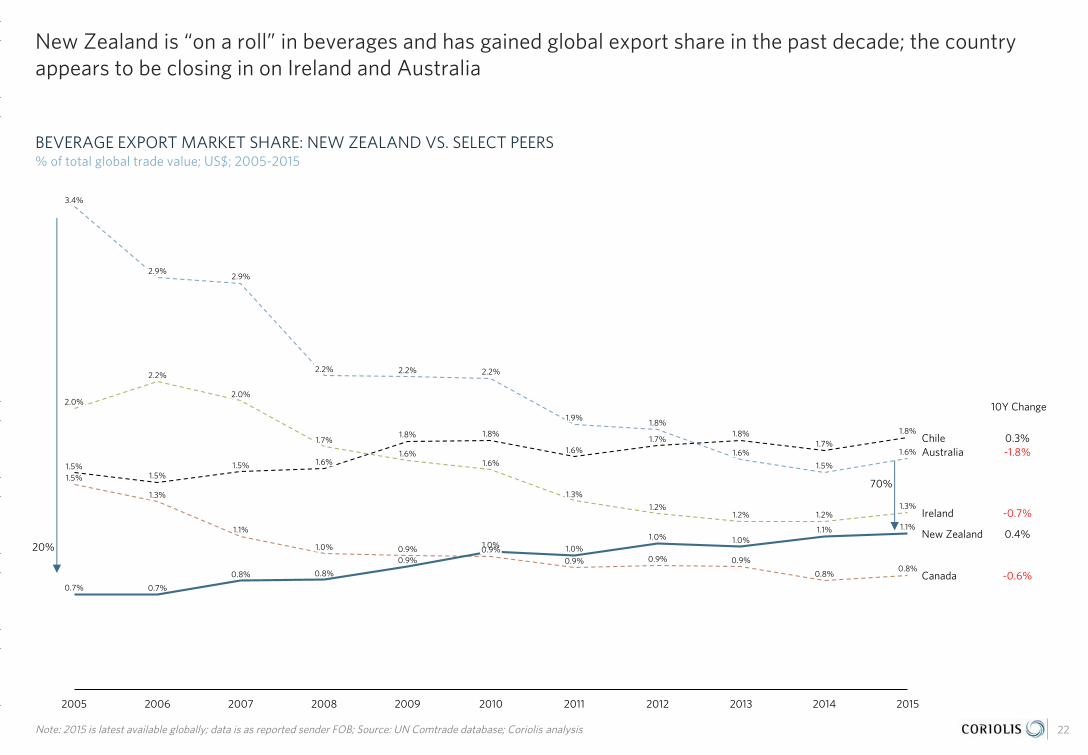
New Zealand is “on a roll” in beverages and has gained global export share in the past decade; the country appears to be closing in on Ireland and Australia
Note: 2015 is latest available globally; data is as reported sender FOB; Source: UN Comtrade database; Coriolis analysis
BEVERAGE EXPORT MARKET SHARE: NEW ZEALAND VS. SELECT PEERS% of total global trade value; US$; 2005-2015
22
2013
Australia
20152014
New Zealand
2005 2006 2007
10Y Change
Ireland
Chile
2008 2011 20122010
Canada
2009
2.2%
2.0%2.0%
-1.8%
0.4%
1.3%
0.3%
-0.6%
-0.7%1.2%
1.6%1.6%
1.7%
1.2%1.2%
1.3%
1.0% 0.9%
1.1%
1.5%
1.3%
0.9%
0.8%0.8%
0.9%0.9% 0.9%
0.8%
0.9%
0.8%
0.7% 0.7%
1.0%
1.1% 1.1%
1.0%1.0%
1.0%
2.2% 2.2%
2.9%
3.4%
2.9%
2.2%
1.5%
1.6%1.6%
1.9%1.8%
1.6%
1.8%
1.5%1.5%1.5%
1.8%1.7%
1.8%1.8%
1.6%1.7%
20%
70%

Bubble size is proportional to beverage export value in 2015; a bubble this size is US$3b
New Zealand achieved a solid growth performance in beverage exports over the past five years, beating both Europe and Australia in rate of growth
Note: 2015 is latest available globally; data is as reported sender FOB; Source: UN Comtrade database; Coriolis analysis
5Y EXPORT GROWTH MATRIX: 5Y VOLUME VS. 5Y CAGR VALUE VS. VALUE 2015 BY EXPORTING COUNTRY/REGIONL; b; % of US$; US$b; FOB; 2010 vs. 2015
23
-2%
3.0-0.5 0.0 4.02.5
-4%
3.5
10%
1.5
8%
12%
16%
1.0
14%
2.0
4%
0%
2%
0.5
6%
$3
SS Africa
France
Germany
Other Americas
Other Europe
Netherlands
United Kingdom
USA
Australia
New Zealand
Brazil
Argentina
Guatemala
Chile
Hong Kong SAR
China
Singapore
Mexico
Canada
Italy
NA/ME/CA
Russia
Turkey
India
Other E Asia
Thailand
Other S Asia
5Y Change in export volume (l; b) of beverages imported; 10-15
5Y CAGR export
value US$; 10-15

The average export price received for beverages varies among countries, with New Zealand outperforming almost all competitors, including France
Note: therefore area under chart is proportional to import value (volume x $/l); Source: UN Comtrade data; Coriolis analysis and classifications
TOTAL GLOBAL BEVERAGE EXPORT VOLUME VS. AVERAGE EXPORT PRICE BY KEY MARKETL; m; US$/l; actual; 2015
24
France
China
Singapore
Other Pacific
Brazil
Australia
Other A
mericas
Belarus
Canada
Chile
Netherlands
Turkey
India
Argentina
Other S A
sia
Thailand
Other Europe
Guatem
ala
Hong K
ong SAR
Other E A
sia
Germ
any
United K
ingdom
Russia
New
Zealand
Mexico
SS Africa
NA
/ME/C
A
Italy
USA
$0.96
$6.29
$0.4
6
$1.57
$1.24
$0.82
$2.03
$0.71
$2.85
$0.53
$1.13
$1.08
$1.35
$2.06
$1.33
$0.65
$0.81
$1.60
$1.54
$0.97
$0.4
7
$6.07
$1.11
$0.4
3
$1.74 $1.55
$2.24
$3.55
Proportional to export volume in 2015
Average export
value per kilogram
US$/l2015
Weighted average $1.96
High valuere-export
Whisky & Spirits

New Zealand Production
+ Wine
+ Beer
+ Juice
+ Alcoholic Spirits
+ Water
+ Production
+ Regional activity
+ Key inputs
+ Growth upside 02

New Zealand can continue to to grow beverage production for the foreseeable future
WINE PRODUCTIONNew Zealand is a rapidly emerging New World wine region with significant capacity for future growth and no major production challenges
- Wine is New Zealand’s largest beverage export- New Zealand grape area and wine production has grown
dramatically over the past twenty years in response to growing global demand for New Zealand wine
- Absolute area growth is coming from Sauvignon Blanc; of other varietals, Pinot Gris and Pinot Noir are achieving traction
- New Zealand has wineries spread across the country; however, about two-thirds of grape area is in Marlborough
- As the largest, most mature region, Marlborough leads in terms of both (1) tonnes per winery and (2) tonnes per hectare
- While Marlborough is clearly the leading region, a number of the smaller regions are growing, particularly recognised red producers Hawke’s Bay (Syrah), Canterbury/Waipara (Pinot Noir), and Central Otago (Pinot Noir)
- Peer group performance suggests New Zealand has significant potential capacity to increase wine area over the mid-to-long run
OTHER BEVERAGE PRODUCTIONNew Zealand can and does produce a range of other beverages beyond wine, again with few limitations on potential production volumes
- New Zealand produces significant volumes of both key beer ingredients (hops and barley); beer production trending down in recent years reflecting the market movement to “less but better quality”
- New Zealand is a major global producer and exporter of apples and kiwifruit, as well as developing and pioneering a wide range of new varieties and species
- New Zealand has significant quantities of raw materials available to produce alcoholic spirits
- New Zealand has an abundant supply of quality natural water and thousands of springs; natural springs are located primarily in two zones (Taupo Volcanic Zone and the Southern Alps Zone)
- Due to its unique history, New Zealand has a range of unique or signature ingredients and flavours suitable for use in beverages
26
New Zealand is a rapidly emerging New World wine region with significant capacity for future growth with no major impediments or capacity constraints
27
WINEOTHER
BEVERAGES

WINE PRODUCTION New Zealand grape area and wine production has grown dramatically over the past twenty years in response to growing global demand for New Zealand wine
0
5,000
10,000
15,000
20,000
25,000
30,000
35,000
40,000
1961196319651967196919711973197519771979198119831985198719891991199319951997199920
01
200
320
05
200
720
09
2011
2013
2015
0
50,000
100,000
150,000
200,000
250,000
300,000
350,000
1961196319651967196919711973197519771979198119831985198719891991199319951997199920
01
200
320
05
200
720
09
2011
2013
2015
28
NEW ZEALAND GRAPE AREAHectares; 1977-2016
NEW ZEALAND WINE PRODUCTIONL; m; 1977-2016
NEW ZEALAND GRAPE PRODUCTIONTonnes crushed; 1977-2016
Source: MAF/MPI; NZWine Annual Report ; UN FAO FAOSTAT database; Coriolis analysis
0
50,000
100,000
150,000
200,000
250,000
300,000
350,000
400,000
450,000
500,000
1961196319651967196919711973197519771979198119831985198719891991199319951997199920
01
200
320
05
200
720
09
2011
2013
2015
Low year
Bubble size is proportional to total grape production; a bubble this size is 10,000t
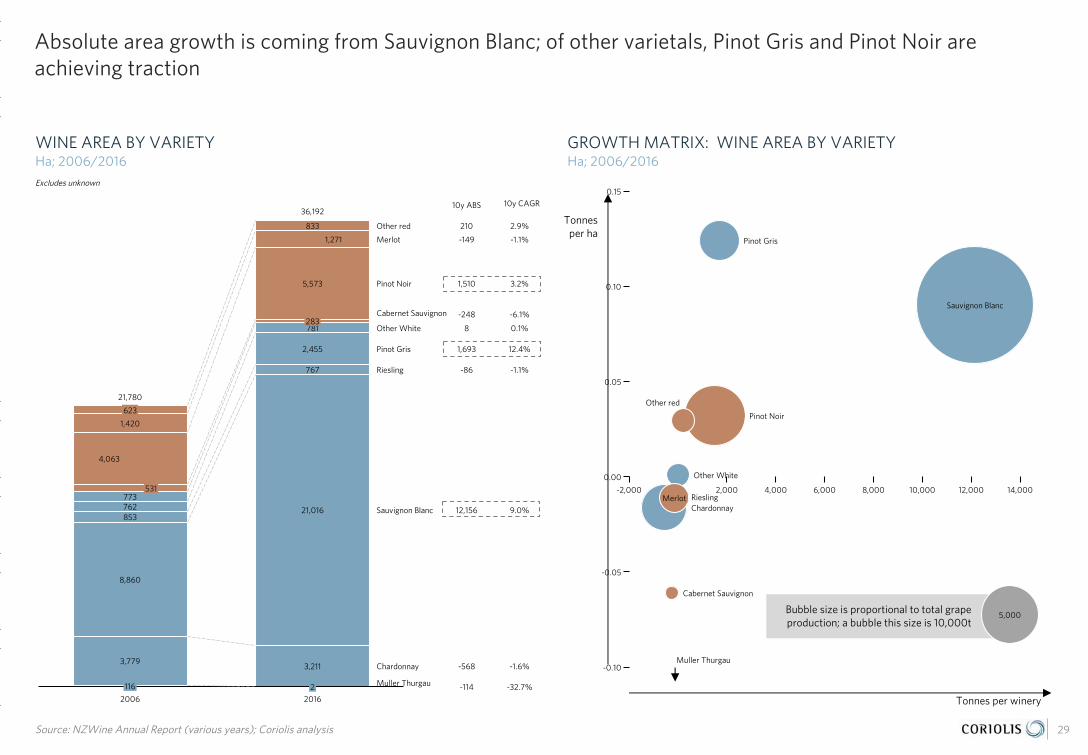
Absolute area growth is coming from Sauvignon Blanc; of other varietals, Pinot Gris and Pinot Noir are achieving traction
29Source: NZWine Annual Report (various years); Coriolis analysis
WINE AREA BY VARIETYHa; 2006/2016
GROWTH MATRIX: WINE AREA BY VARIETYHa; 2006/2016
2,000 4,000
0.05
-2,000
0.15
0
0.10
12,000
-0.05
-0.10
14,000
0.00
6,000 10,0008,000Riesling
5,000
Muller Thurgau
Chardonnay
Pinot Gris
Merlot
Pinot Noir
Other red
Sauvignon Blanc
Cabernet Sauvignon
Other White
Tonnes per ha
Tonnes per winery
Chardonnay
Riesling
10y ABS
Muller Thurgau
Other red
2006
Pinot Noir
Pinot Gris
Cabernet Sauvignon
Other White
Merlot
Sauvignon Blanc
2016
10y CAGR
-1.1%
12.4%
-1.6%
-32.7%
9.0%
0.1%
2.9%
21,780
36,192
-6.1%
3.2%
-1.1%
210
781
773
2,455
531
5,573
4,063
283
3,779
2116
3,211
762 21,016
8,860
1,420
1,693
-86
12,156
8
-149
1,510
-248
767
853
1,271
623
-568
-114
833
Excludes unknown
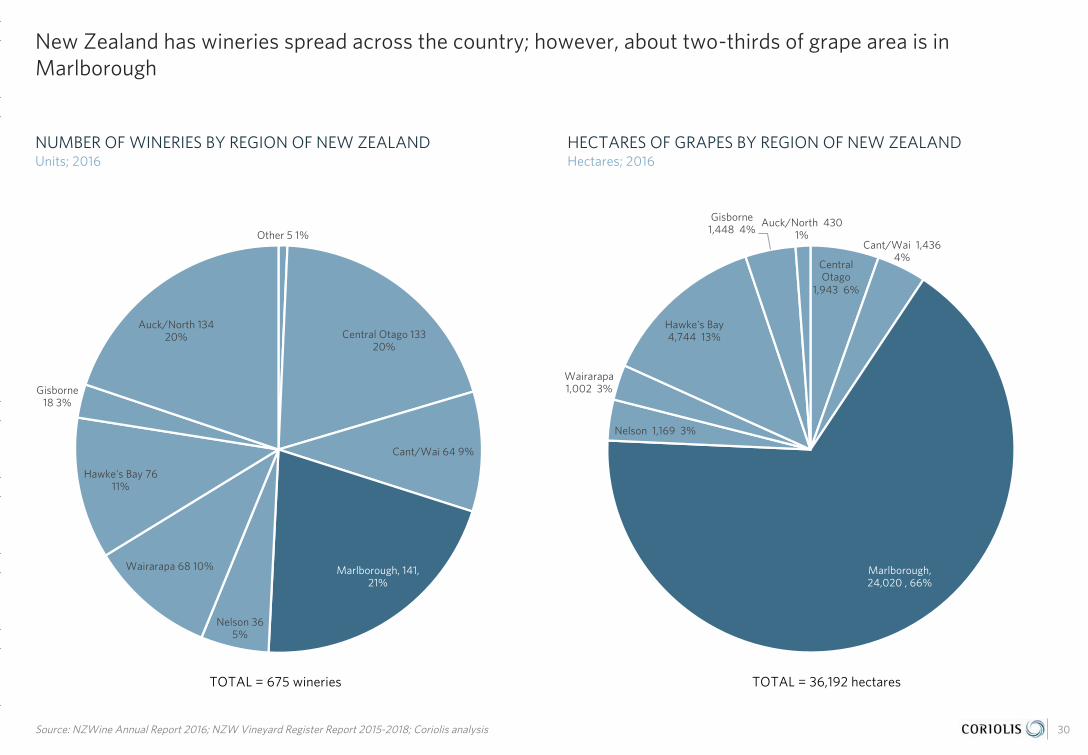
New Zealand has wineries spread across the country; however, about two-thirds of grape area is in Marlborough
Other 5 1%
Central Otago 13320%
Cant/Wai 64 9%
Marlborough, 141, 21%
Nelson 365%
Wairarapa 68 10%
Hawke's Bay 7611%
Gisborne18 3%
Auck/North 13420%
30Source: NZWine Annual Report 2016; NZW Vineyard Register Report 2015-2018; Coriolis analysis
NUMBER OF WINERIES BY REGION OF NEW ZEALANDUnits; 2016
HECTARES OF GRAPES BY REGION OF NEW ZEALANDHectares; 2016
Central Otago
1,943 6%
Cant/Wai 1,436 4%
Marlborough, 24,020 , 66%
Nelson 1,169 3%
Wairarapa1,002 3%
Hawke's Bay4,744 13%
Gisborne 1,448 4%
Auck/North 430 1%
TOTAL = 675 wineries TOTAL = 36,192 hectares

As the largest, most mature region, Marlborough leads in terms of both (1) tonnes per winery and (2) tonnes per hectare
31Source: NZWine Annual Report 2016; NZW Vineyard Register Report 2015-2018; Coriolis analysis
NZ: NUMBER OF WINERIES VS. TONNES PER WINERYUnits; t/unit; 2016
NZ: REGIONAL AREA VS. TONNES PER HECTAREHectares; tonnes/hectare; 2016
Canterbury
Gisborne
Haw
kes Bay
Nelson
Auckland
Waikato
Northland
Wairarapa
Otago
Marlborough
12 6 269
279
565
2,293
88
6
74
190
Canterbury
Gisborne
Haw
kes Bay
Nelson
Wairarapa
Waikato
Auckland
Otago
Northland
Marlborough
5.0
3.61.1
1.4
8.6
9.1
13.5
11.0
4.7
8.5
# of wineries
Tonnes/winery
Area in grapes
Tonnes/hectare

Bubble size is proportional to total grape production; a bubble this size is 10,000t
While Marlborough is clearly the leading region, a number of the smaller regions are growing, particularly those recognised red producers Hawke’s Bay (Syrah), Canterbury/Waipara (Pinot Noir), and Central Otago (Pinot Noir)
32Source: NZW Annual Reports various years; NZW Vineyard Register Report various years; Coriolis analysis
GRAPES CRUSHED IN VINTAGE BY REGIONT; 2006/2011/2016
PRODUCTION MATRIX: T/WINERY VS. T/HA VS. TOTALT; 2015/16
500
10
0
15
0 1,000 2,000 2,500
5
1,500
Auck/North
Nelson
Gisborne
Marlborough
10,000
Hawkes Bay
Wairarapa
Canterbury
Otago
Tonnes per ha
Tonnes per winery
Central OtagoOther
10y CAGR
Wairarapa
GisborneAuck/North
Hawke's Bay
10y ABS
2011
Nelson
2016
Marlborough
2006
Cant/Waipara
9,671
-2,105
2,041
4,565
4,405
9,119
209,854
357 50.7%
7.1%
14.8%
420,356
324,592
182,886
2.6%
-1.2%-2.7%
11.0%
6.0%5.3%
323,290
244,893
15,944
14,450
18,049
9,4853,051
5,623
42,958
35,533
33,287
113,436
10,028
7,854
1,814
36349
3,008
-437
5,049
3,598
7,1044,612
12,170
1,377
1,626
69,177

Peer group performance suggests New Zealand has significant potential capacity to increase wine area over the mid-to-long run
Source: OIV; NZ Winegrowers; CIA World Fact Book; Coriolis analysis
GROWTH MATRIX OF WINE AREA: % TOTAL AREA VS. M2/PERSON VS. TOTAL WINE AREA% of hectares; hectares/person; hectares; 2015 or 2016
33
1.5%
250
2.0%
200
0.0% 2.5%1.0%
100
50
150
0.5%0
Portugal
Romania
Italy
Spain
100,000
France
Greece
Austria
New Zealand
Bulgaria
Germany
Hungary
Wine area/person
m2
2015
Wine area as a percent of total land area; % of km2; 2015
Bubble size is proportional to total wine areaA bubble this size is 100,000 hectares

New Zealand can and does produce a wide range of other beverages beyond wine with few limitations on potential production volumes
34
WINEOTHER
BEVERAGES

BEER PRODUCTION New Zealand produces significant volumes of both key beer ingredients (hops and barley); beer production trending down in recent years reflecting the market movement to “less but better quality”
0
100
200
300
400
500
600
700
800
900
1,000
1977
1979
1981
1983
1985
1987
1989
1991
1993
1995
1997
1999
200
1
200
3
200
5
200
7
200
9
2011
2013
0
50,000
100,000
150,000
200,000
250,000
300,000
350,000
400,000
450,000
1961196319651967196919711973197519771979198119831985198719891991199319951997199920
01
200
320
05
200
720
09
2011
2013
35
NEW ZEALAND HOP PRODUCTIONTonnes; 1977-2014
NEW ZEALAND BEER PRODUCTIONTonnes; 1961-2014
NEW ZEALAND BARLEY PRODUCTIONTonnes; 1961-2015
Source: MAF/MPI; UN FAO FAOSTAT database; Coriolis analysis
0
100,000
200,000
300,000
400,000
500,000
600,000
700,000
1961196319651967196919711973197519771979198119831985198719891991199319951997199920
01
200
320
05
200
720
09
2011
2013
Ongoing shift to “less but better quality”

FRUIT FOR JUICE & CIDER New Zealand is a major global producer and exporter of apples and kiwifruit, as well as developing and pioneering a range of new varieties and species
0
200,000
400,000
600,000
800,000
1,000,000
1,200,000
1,400,000
1961196319651967196919711973197519771979198119831985198719891991199319951997199920
01
200
320
05
200
720
09
2011
2013
AAPPPPLLEESS KKIIWWIIFFRRUUIITT OOTTHHEERR FFRRUUIITT
Granny Smith*
Splendour
Gala
Royal Gala
Braeburn
Jazz
Envy
Pacific Rose
Pacific Beauty
Pacific Queen
Smitten
Maxie
Sweetie
Hayward
(dominant global)
Bruno
Alison
EnzaGreen
EnzaGold
Zespri Gold
Zespri Sungold
Zespri SweetGreen
KiwiKiss
Feijoa
Tamarillo
Passionfruit
Kiwiberries
Kiwano
Blueberries
(various cultivars)
Blackcurrants
(various cultivars)
36* Appeared in Australia but was developed/improved in New Zealand; Source: MAF/MPI; UN FAO FAOSTAT database; Coriolis analysis
NEW ZEALAND FRUIT PRODUCTIONTonnes; 1961-2014
EXAMPLES OF FRUIT DEVELOPED OR PIONEERED IN NZSelect examples; 2017
Apples
Kiwifruit
Other fruit
Wine grapes

ALCOHOLIC SPIRITS INPUTS New Zealand has significant quantities of raw materials available to produce alcoholic spirits
0
5,000
10,000
15,000
20,000
25,000
1961
1963
1965
1967
1969
1971
1973
1975
1977
1979
1981
1983
1985
1987
1989
1991
1993
1995
1997
1999
200
1
200
3
200
5
200
7
200
9
2011
2013
0
200,000
400,000
600,000
800,000
1,000,000
1,200,000
1961
1964
1967
1970
1973
1976
1979
1982
1985
1988
1991
1994
1997
200
0
200
3
200
6
200
9
2012
2015
37
NEW ZEALAND WHEY PRODUCTIONTonnes; 1977-2014
NEW ZEALAND GRAIN PRODUCTIONTonnes; 1961-2016
NEW ZEALAND SUGAR REFINING PRODUCTION & IMPORTSTonnes; 1961-2014
Source: MAF/MPI; Statistics NZ; UN FAO FAOSTAT database; Coriolis analysis
0
50,000
100,000
150,000
200,000
250,000
300,000
1961196319651967196919711973197519771979198119831985198719891991199319951997199920
01
200
320
05
200
720
09
2011
2013
Total whey, including whey processed into alcohol
NZ Refined
Imported
Wheat
Corn
Barley
Other grains
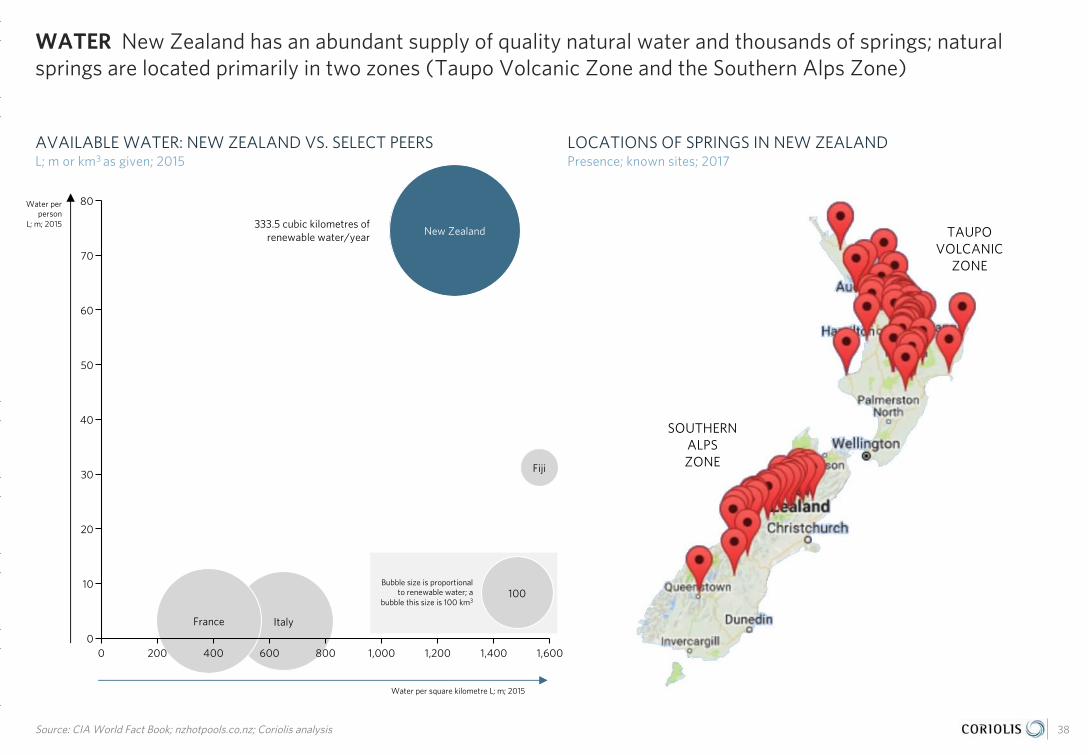
WATER New Zealand has an abundant supply of quality natural water and thousands of springs; natural springs are located primarily in two zones (Taupo Volcanic Zone and the Southern Alps Zone)
38Source: CIA World Fact Book; nzhotpools.co.nz; Coriolis analysis
AVAILABLE WATER: NEW ZEALAND VS. SELECT PEERSL; m or km3 as given; 2015
LOCATIONS OF SPRINGS IN NEW ZEALANDPresence; known sites; 2017
20
30
1,6000
10
70
80
60
40
50
800 1,000 1,2000 200 400 600 1,400
New Zealand
Fiji
100
France Italy
Bubble size is proportional to renewable water; a
bubble this size is 100 km3
Water per person
L; m; 2015
Water per square kilometre L; m; 2015
TAUPOVOLCANIC
ZONE
SOUTHERN ALPSZONE
333.5 cubic kilometres of renewable water/year

UNIQUE FLAVOURS Due to its unique history, New Zealand has a range of unique or signature ingredients and flavours suitable for use in beverages
39
ManukaHoney
Kawakawa(Unique native
plant)
Feijoa
Kiwifruit
GoldKiwifruit
Titoki

New ZealandCategory Performance
+ Overview
+ Category Segmentation
+ Exports by product
03

New Zealand has a strong position in wine and is emerging across a wide range of other beverages
41
- New Zealand has a strong beverages platform and produces all six major categories of beverages; New Zealand has real strength in wine and is growing and emerging in other categories
- Wine currently accounts for 83% of New Zealand beverage exports, followed by soft drinks (7%) and a range of other minor beverages
- Average export price varies by category, with wine standing out for high prices; wine is maintaining, but not growing pricing, across greater volumes; most other products shifting to quality
- New Zealand is growing its share of the global wine trade, but only maintaining share across most other beverages; cider appears to have stalled after solid growth (needs to transition beyond Australia)
- New Zealand has rapidly growing wine exports on the back of Marlborough Sauvignon Blanc, which is now a “must have” varietal across most major markets; Pinot Noir also achieving growing recognition
- New Zealand has had growing volumes of beer and cider exports, driven by increased interest in authentic, craft & premium; cider, in particular, appears well positioned for growth beyond Australia
- New Zealand has a fast evolving alcoholic spirits industry that is seeking its “signature” spirit in a large and growing global market
- New Zealand non-alcoholic beverages growing well, driven by juices and other flavoured beverages; Australia still the largest market, but E/SE Asia emerging (particularly Japan and China)
OVERVIEW BY CATEGORY

New Zealand has a strong beverages platform and produces all six major categories of beverages; New Zealand has real strength in wine and is growing and emerging in other categories
42
- New Zealand Sauvignon Blanc “owns” the category and is now a “must have”
- Refreshing/summer afternoon positioning to females (vs. reds)
- Emerging in Pinot Noir and other reds
- Strong growth for 30+ years
- Strong and growing market share across Anglo markets
- Growing rapidly in Asia
- Attracting global brand leaders (e.g. LVMH Moët Hennessy Louis Vuitton)
- Well regarded globally for the quality of its hops
- Benefiting from global shift to craft/specialty
- Leveraging long-term NZ strength in hops and apples
- Growth coming from global multinationals (e.g. Kirin, Heineken, Asahi) and local innovators
- Cider, in particular, stands out as having clear leverage and good long term growth prospects
- Sector in early stages of growth curve
- Emerging sector driven by strong marketing and unique products
- Rapid innovation underway
- Still seeking “unique” position beyond “me-too” spirits
- Huge hypothetical potential for growth
- Strong fundamentals
- Wide range of pioneers
- Second generation firms with strong products presentation and marketing (e.g. Antipodes) doing well
- Premium new comers Palaeo and OnePure
#1 Global Sauvignon Blanc
Focused on Australia
Focused on Australia
Emerging rapidly
- Building on New Zealand’s strength in export fruit, particularly in apples and kiwifruit
- Pioneer of a range of new fruits and fruit varieties
- No real leverage to date of existing strong fruit brands (e.g. Zespri, Jazz, Pacific Rose)
- Early pioneer in energy drinks (“V”)
- Growing strongly in a “post-CSD” environment [Carbonated Soft Drinks]
- Good fit with “Brand NZ” and existing strengths in select fruits
- Strong traction in “natural” positioned carbonated juices
Regionally strong in specific products
Focused on Australia
HIGH-LEVEL CATEGORIES
- Wine, bottles- Sparkling wine- Bulk wine
- Beer - Whisky/Whiskey- Vodka- Gin
- Bottled water- Other water (e.g. bulk)
- Apple juice- Kiwifruit/other juices
- Soft drinks- Other flavoured beverages
EXAMPLE PRODUCTS UNDER THESE CATEGORIES
WINE SOFT DRINKS WATERBEER/CIDER SPIRITS JUICES
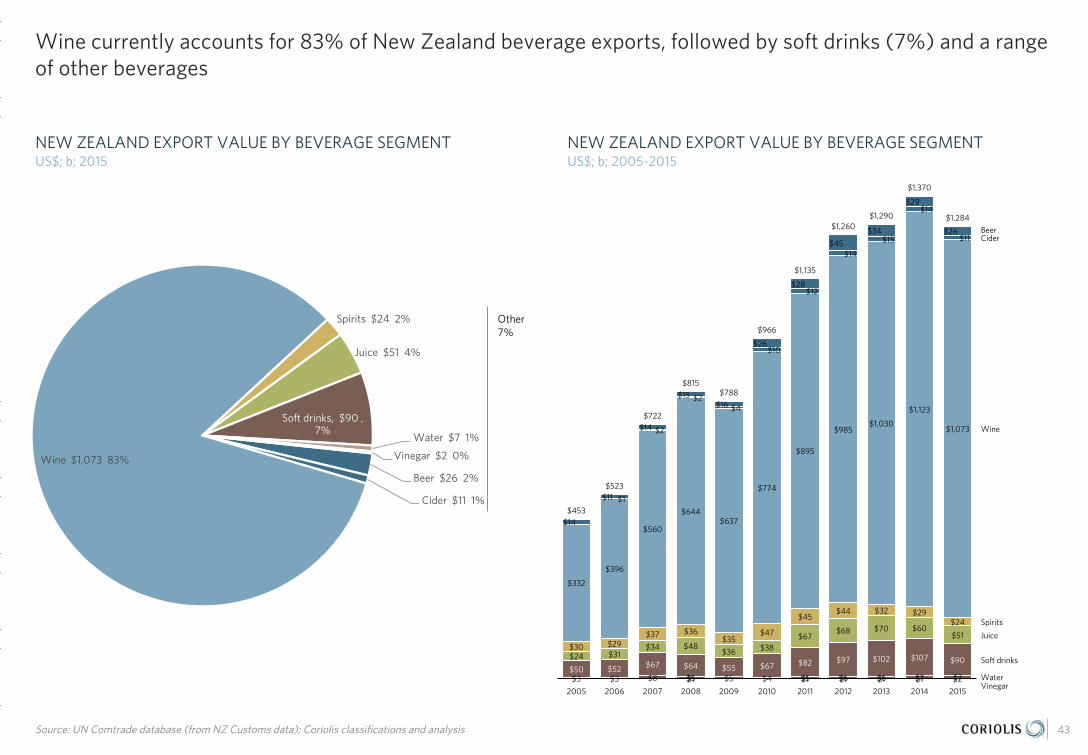
Wine currently accounts for 83% of New Zealand beverage exports, followed by soft drinks (7%) and a range of other beverages
43Source: UN Comtrade database (from NZ Customs data); Coriolis classifications and analysis
NEW ZEALAND EXPORT VALUE BY BEVERAGE SEGMENTUS$; b; 2015
NEW ZEALAND EXPORT VALUE BY BEVERAGE SEGMENTUS$; b; 2005-2015
Beer $26 2%
Cider $11 1%
Wine $1,073 83%
Spirits $24 2%
Juice $51 4%
Soft drinks, $90 , 7%
Water $7 1%
Vinegar $2 0%
Cider
20132007 2012
Spirits
Beer
2008
Soft drinks
2014 20152006
Water
2010
Wine
Juice
20112005 2009Vinegar
$8
$1,370
$1$3
$453
$2
$90
$3
$1,284
$7
$722
$966
$1 $6
$815
$1 $1
$788
$7
$1,290
$523
$5$5 $1$6
$1,135
$5$4
$1,260
$24
$11
$34$31
$14
$12
$14
$15
$70$68 $51$60
$36$48
$67$38
$26
$16
$45
$28
$11
$14
$15
$14
$2
$2
$10
$4
$29
$34
$1
$26
$1,073
$1,123
$52$50
$895
$774
$1,030$985
$97$82$107$102
$64$67 $67$55
$47$35
$44$45
$29$30
$36$37
$560
$396
$637$644
$29$32
$332
$24
Other7%
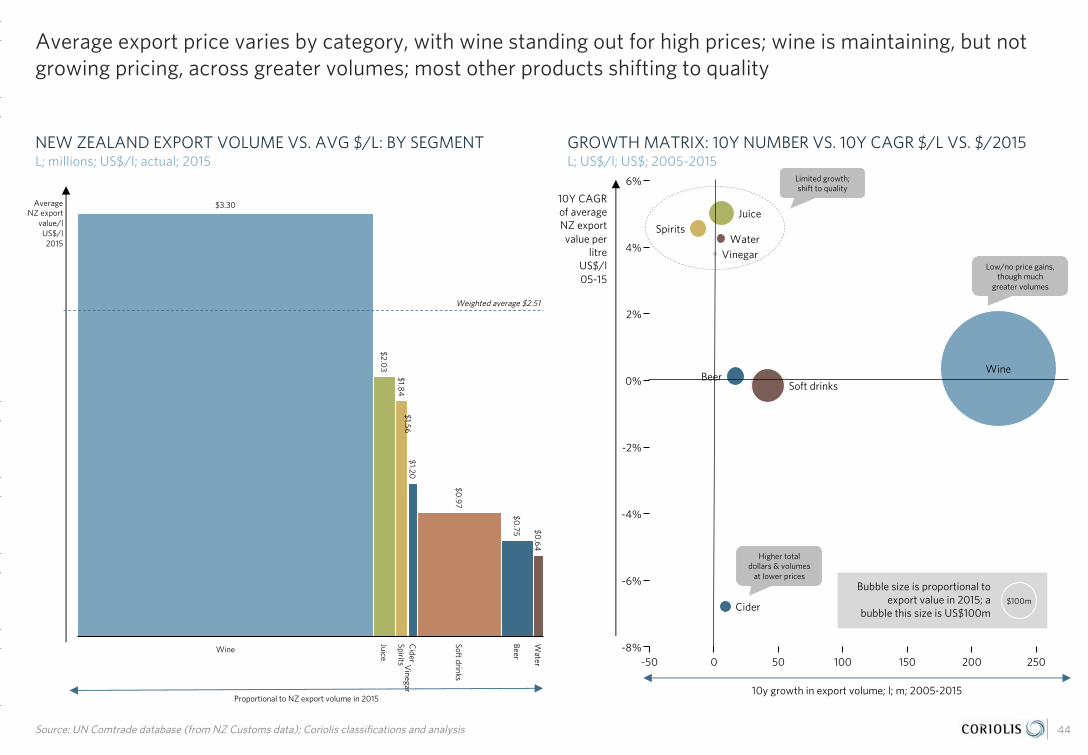
Average export price varies by category, with wine standing out for high prices; wine is maintaining, but not growing pricing, across greater volumes; most other products shifting to quality
44Source: UN Comtrade database (from NZ Customs data); Coriolis classifications and analysis
NEW ZEALAND EXPORT VOLUME VS. AVG $/L: BY SEGMENTL; millions; US$/l; actual; 2015
GROWTH MATRIX: 10Y NUMBER VS. 10Y CAGR $/L VS. $/2015L; US$/l; US$; 2005-2015
Bubble size is proportional to export value in 2015; a
bubble this size is US$100m
Cider
Wine
Vinegar
Beer
Water
Soft drinks
Spirits
Juice
$0.75 $0
.64
$1.84$1.56
$2.03
$3.30
$0.97
$1.20
Proportional to NZ export volume in 2015
Average NZ export
value/lUS$/l2015
Weighted average $2.51
15010050
0%
-2%
2%
6%
4%
250200-8%
-4%
-6%
-50 0
Juice
Beer
$100mCider
WaterVinegar
Spirits
Wine
Soft drinks
10Y CAGR of average NZ export value per
litreUS$/l 05-15
10y growth in export volume; l; m; 2005-2015
Higher total dollars & volumes
at lower prices
Limited growth; shift to quality
Low/no price gains, though much
greater volumes

New Zealand is growing its share of the global wine trade, but only maintaining share across most other beverages; cider appears to have stalled after solid growth (needs to transition beyond Australia)
45Source: UN Comtrade database (from NZ Customs data); Coriolis classifications and analysis
NEW ZEALAND SHARE OF WORLD EXPORT VALUE BY CATEGORYUS$; % of US$; 2015
NEW ZEALAND SHARE OF WORLD EXPORT VALUE BY CATEGORY% of US$; 2005-2015
Vinegar
Wine
Cider
Beer SpiritsJuice
Water
Soft drinks
0.2%
0.1%
0.3%
0.8%
0.5%
3.4%
0.3%
0.3%
Proportional to total global export value in 2015
NZ share of total global
trade; % of $;
2015
Soft drinks
Juice
2012
Water
Beer
20152013 201420112007 2008 20092005 2006
Wine
2010
Cider
Spirits
0.5% 0.5%
0.4%
0.2%
0.6%0.5%
0.6%
0.3%
0.6%
0.3%
0.1% 0.1%
0.2%0.2%
0.3%0.3% 0.3%
0.2%0.1% 0.2%
0.2%0.1% 0.1%
0.3%0.3%
0.2%0.1%
0.9%
0.2%0.1%
0.8%
0.1%0.1%
1.0%
0.1%0.1%
1.0%
0.1%0.1%
2.7%
3.0%
2.0%
2.5%
2.8%
2.2%
3.4%
1.6%
0.2%
3.0%
3.2%
1.8%
0.1%
0.3%
0.0%
0.6%
0.4%
0.1%
0.4%0.4%
0.2%
0.4%0.5%
0.2%
0.6%
0.4%
0.3%0.2%
0.4%
0.9%
0.3%
0.9%
0.3%
0.4%
0.2%0.3% 0.3%
0.2%

Wine, bulk
2010
10Y ABS
2005
10Y CAGR
Sparkling wine
2015
Wine, bottle +$565
$1,073-$14
$332
$774
+$190
$299
$685
$864
$8$84
$198 38%
11%
-8%
$25
$4
$11
WINE New Zealand has rapidly grown wine exports on the back of Marlborough Sauvignon Blanc, which is now a “must have” varietal across most major markets; Pinot Noir also achieving growing recognition
46Source: UN Comtrade database; photo credit (fair use; low resolution; complete product/brand for illustrative purposes); Coriolis classifications and analysis
NZ WINE EXPORT VALUEUS$m; 2005-2015
SHARE OF NZ WINE GRAPE AREA BY VARIETAL% of ha; 1992-2016
AGGREGATE GLOBAL EXPORT GROWTHUS$b; 2005-2015
EXAMPLE PRODUCTS: SAINT CLAIR2017
CAGR12%
$15.1
$1.8$3.6 $3.0
$22.7
$3.2
$5.8 $6.1
Wine, bottle Wine, bulk Sparkling wine Brandy/Cognac
CAGR4%
05 15
CAGR5%CAGR
6%
CAGR8%
200
1
2010
1993
Merlot
200
6
200
0
2015
Sauvignon Blanc
Pinot Noir20
09
Pinot GrisRiesling
200
4
200
3
2014
200
2
1992
200
5
Other red
Muller Thurgau1998Chardonnay
1996
200
7
2012
1997
Other White
2013
1999
2016
200
8Cabernet Sauvignon
1994
2011
1995
18%15%
15%15% 15%
18%
15%
19%
15%
17%16% 16%
19%16% 16%
3%3% 2%
4%2%3% 3%3% 2%
4%4% 4%2% 2%
4%4% 3%3% 3%3%4%4% 4% 2%3% 2%3% 3% 2% 2%3%
6%6% 8%7%4%4% 6%5% 5% 5%6% 4% 4%4%8% 8%8% 7%8%
30%34%28%
25% 25%
36% 53% 53%50%41% 43%
24%
9%
14%
10%9% 10%
15% 23% 24%20%15% 17%
4% 4%5%5% 5%
4%4%
3%4%
4% 4%5%
57% 57%58%53% 58% 58%
5% 5%5%5% 5%
0% 0%1%1% 1% 0% 0% 0%0%0% 0%2%
16% 12%18%22%20%
10%3% 2%4%8% 6%
19% 17%21%26% 23%
16%12% 9%12%14% 13%
29%
22% 23%22%
0% 0%
24%
29%29%28%
26%26%
3%
9% 8%9%9% 10% 8%
6% 5%7%
8% 7%
10%
2% 2%3%
4% 3%
2% 1% 2%2%1% 1%
8% 7%7%
1%
6%8%
11%13%
10%8% 8%
1%
2%2%
2%4% 3%
2% 1% 1%1%2% 2%
1% 1%1%1% 1%
2%3% 5%
2%2% 2%0%
2% 2%2%3% 3% 2%
0% 0%0%
2%0%
10% 9%10%13% 12% 8%4% 4%5%
6% 5%14%
5% 7%6%5% 5% 7%
15% 15%7%7% 7%
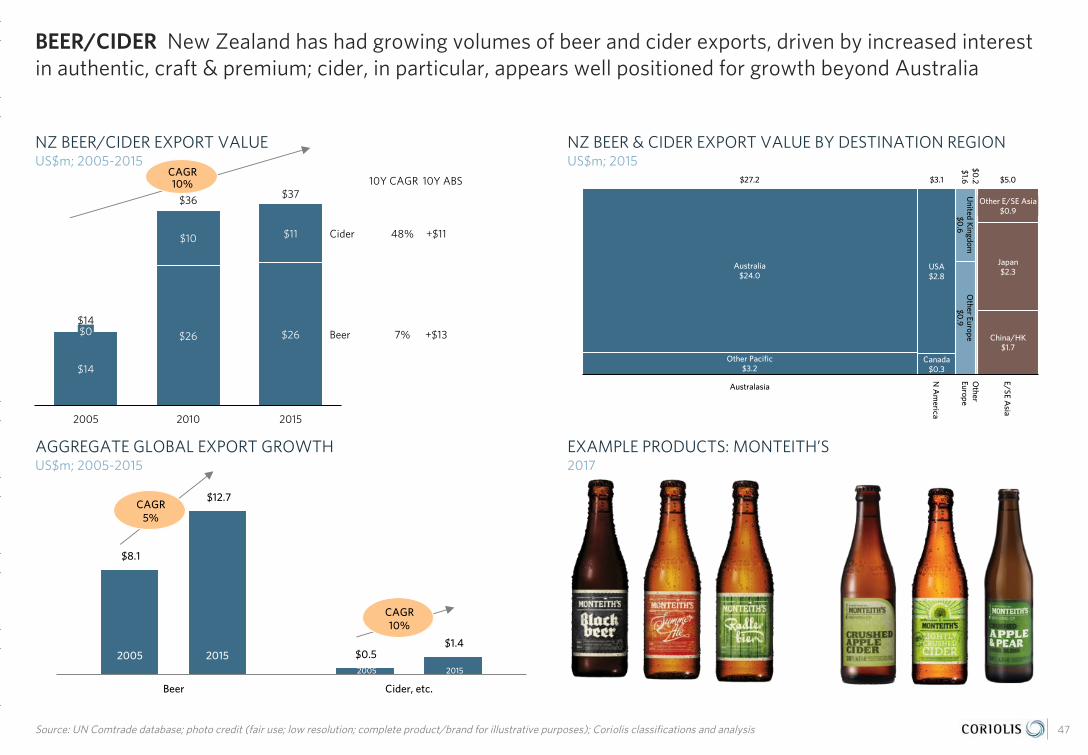
BEER/CIDER New Zealand has had growing volumes of beer and cider exports, driven by increased interest in authentic, craft & premium; cider, in particular, appears well positioned for growth beyond Australia
47Source: UN Comtrade database; photo credit (fair use; low resolution; complete product/brand for illustrative purposes); Coriolis classifications and analysis
NZ BEER/CIDER EXPORT VALUEUS$m; 2005-2015
NZ BEER & CIDER EXPORT VALUE BY DESTINATION REGIONUS$m; 2015
AGGREGATE GLOBAL EXPORT GROWTHUS$m; 2005-2015
EXAMPLE PRODUCTS: MONTEITH’S2017
$8.1
$0.5
$12.7
$1.4
Beer Cider, etc.
CAGR5%
2005 20152005 2015
CAGR10%
Europe
N A
merica
Other
Australasia
E/SE Asia
$3.1
$1.6 $5.0
$0.2
Canada$0.3
United K
ingdom$0
.6O
ther Europe$0
.9
Australia$24.0
Other Pacific$3.2
USA$2.8
China/HK$1.7
$27.2
Japan$2.3
Other E/SE Asia$0.9
10Y ABS
2005 2010 2015
10Y CAGR
Cider
Beer
$37$36
$14
$26 $26$0
$11 48%
7% +$13$14
$10 +$11
CAGR10%

SPIRITS New Zealand has a rapidly evolving alcoholic spirits industry that is seeking its “signature” spirit in a large and growing global market
$0.6 $1.0 $1.9 $3.8 $3.5
$7.5 $9.6 $10.4
$16.2
$22.3
$35.2
1965 1970 1975 1980 1985 1990 1995 2000 2005 2010 2015
48Source: UN Comtrade database; photo credit (fair use; low resolution; complete product/brand for illustrative purposes); Coriolis classifications and analysis
NZ SELECT ALCOHOLIC SPIRITS EXPORT VALUEUS$m; 2005-2015
GLOBAL ALCOHOLIC SPIRITS EXPORT VALUEUS$b; 1965-2015
NZ INDUSTRY STRATEGIC DIRECTIONModel; 2017
EXAMPLE PRODUCTS: SIMPLY PURE NZ2017
CAGR9%
RTDBeverages
Made elsewherebottled in NZ
Conventionalspirits made in
NZ
Conventional spirits made in
NZ with NZ flavours
New Zealand unique spirits
10Y ABS
20152010
10Y CAGR
2005
Liqueurs
GinRum
Whiskeys
Vodka
RTD/Other alc. Spirits
-$0
+$4-$2
-$0
$47
$24
-$5
$26
+$1
$1
$1
$1
$1
$1
$1
$7
$3$1
$6
$7
$3
$3
-12%16%
7%
-2%
-3%
-5%$0
$1$19 $14
$28

NARTD* New Zealand non-alcoholic beverages growing well, driven by juices and other flavoured beverages; Australia still the largest market, but E/SE Asia emerging (particularly Japan and China)
49
* NARTD = Non-alcoholic ready-to-drink (industry term)Source: UN Comtrade database; photo credit (fair use; low resolution; complete product/brand for illustrative purposes); Coriolis classifications and analysis
NZ NARTD EXPORT VALUE BY TYPEUS$; m; 2005-2015
NZ NARTD EXPORT VALUE BY DESTINATIONUS$; m; 2015
$8,764 $8,390
$1,751
$14,715
$17,528
$2,402
Juice Soft drinks Water
AGGREGATE GLOBAL EXPORT GROWTHUS$m; 2005-2015
EXAMPLE PRODUCTS: KARMA COLA Co.2015
CAGR5%
2005 2015
CAGR3%
CAGR8%
Other unsweetened Other flavoured carbonated
2005
10Y ABS10Y CAGR
Mineral water
Other juices
Apple juice
2015
Other flavoured bev.
Soft drinks
2010
$149
+$3
11%-14% -$35
+$5
$77
+$24
+$75
$110
$6$35
$80
$10
$24
$14$14
$10$17 2%
$7
30%
13%
$4
$57
$45
$3
$10CAGR
7%
Other
Australasia
N A
merica
E/SE Asia
$41.4$16.8 $3.5
USA$16.0
Australia$83.7
Other Pacific$9.0
Canada$0.8
China/HK$11.6
$92.7
Other E/SE Asia$11.8
Japan$18.0
New ZealandGrowth & Innovation
+ Horizons for growth
+ Emerging export stars
+ Mega-trends driving change
+ Innovation & new products 04
New Zealand firms continue to develop a range of innovative new beverage products
51
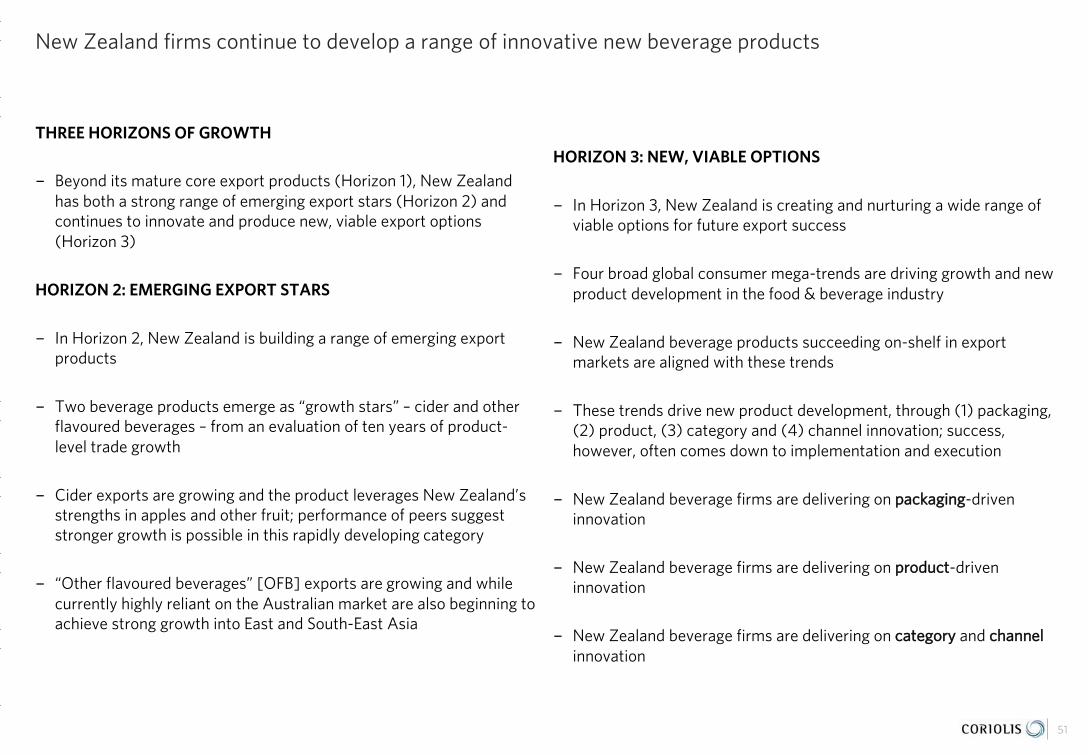
THREE HORIZONS OF GROWTH
- Beyond its mature core export products (Horizon 1), New Zealand has both a strong range of emerging export stars (Horizon 2) and continues to innovate and produce new, viable export options (Horizon 3)
HORIZON 2: EMERGING EXPORT STARS
- In Horizon 2, New Zealand is building a range of emerging export products
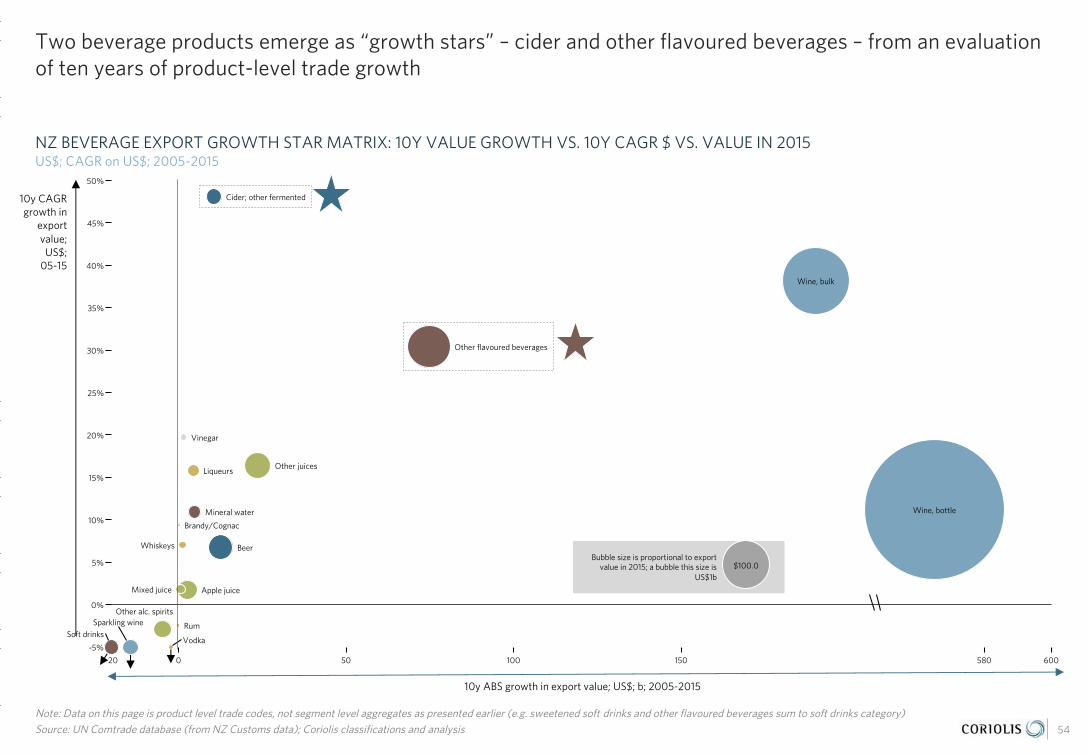
- Two beverage products emerge as “growth stars” – cider and other flavoured beverages – from an evaluation of ten years of product-level trade growth
- Cider exports are growing and the product leverages New Zealand’s strengths in apples and other fruit; performance of peers suggest stronger growth is possible in this rapidly developing category
- “Other flavoured beverages” [OFB] exports are growing and while currently highly reliant on the Australian market are also beginning to achieve strong growth into East and South-East Asia
HORIZON 3: NEW, VIABLE OPTIONS
- In Horizon 3, New Zealand is creating and nurturing a wide range of viable options for future export success
- Four broad global consumer mega-trends are driving growth and new product development in the food & beverage industry
- New Zealand beverage products succeeding on-shelf in export markets are aligned with these trends
- These trends drive new product development, through (1) packaging, (2) product, (3) category and (4) channel innovation; success, however, often comes down to implementation and execution
- New Zealand beverage firms are delivering on ppaacckkaaggiinngg-driven innovation
- New Zealand beverage firms are delivering on pprroodduucctt-driven innovation
- New Zealand beverage firms are delivering on ccaatteeggoorryy and cchhaannnneellinnovation

Beyond its mature core (Horizon 1) export products, New Zealand has both a strong range of emerging export stars (Horizon 2) and continues to innovate and produce new, viable export options (Horizon 3)
Source: McKinsey & Co.; Coriolis analysis
THREE HORIZONS OF GROWTH FRAMEWORK: NEW ZEALAND BEVERAGE INDUSTRYModel; 2017
52
− Defend and extend profitability of core business
− Efficiency & cost control− Process innovation− Scale− Supply chain
− Profits, margins, costs
− Wine
HORIZON 1Mature export categories & products
HORIZON 2Build emerging export products
HORIZON 3Create viable export options
Strategic Focus
Key success factors
Key metrics
Example products
− Expand and grow emerging businesses & products
− Customer acquisition− Speed & flexibility− Execution− Resources/funding
− Market share, growth
− Soft drinks− Cider
− Develop and discover new options for growth
− Risk taking− Market insight− Business model innovation− Culture & incentives
− Milestones
− Packaged water− Whisky− Liqueurs
FOCUS OF THIS SECTION
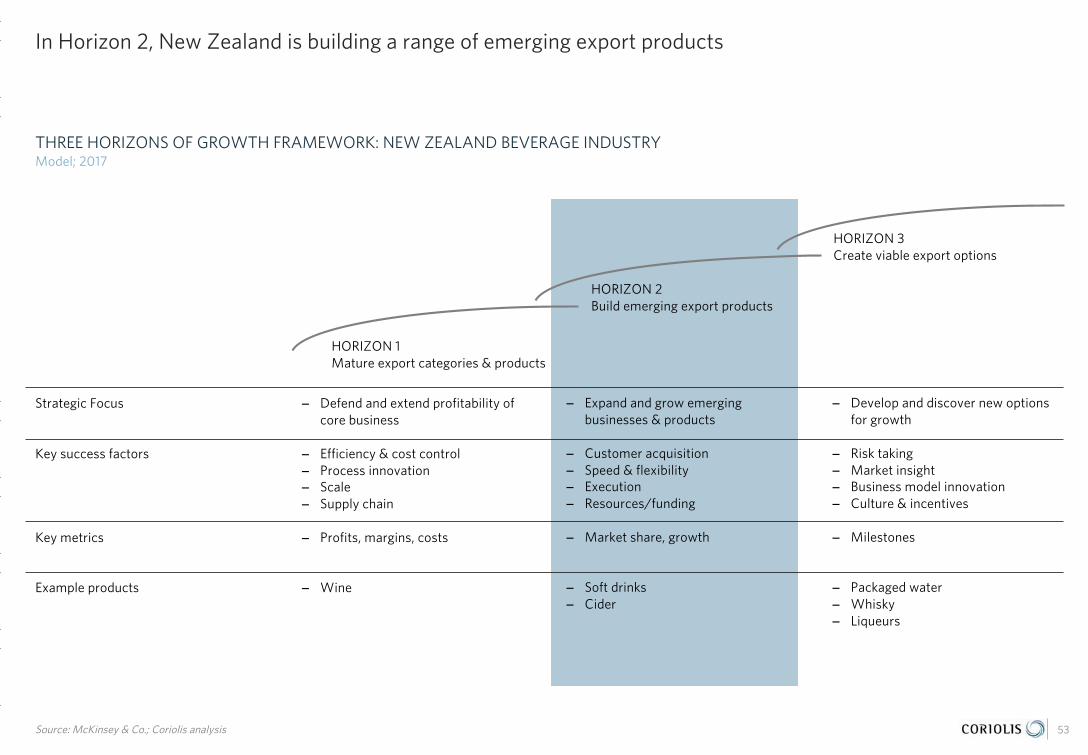
In Horizon 2, New Zealand is building a range of emerging export products
Source: McKinsey & Co.; Coriolis analysis
THREE HORIZONS OF GROWTH FRAMEWORK: NEW ZEALAND BEVERAGE INDUSTRYModel; 2017
53
Strategic Focus
Key success factors
Key metrics
Example products
HORIZON 1Mature export categories & products
HORIZON 2Build emerging export products
HORIZON 3Create viable export options
− Defend and extend profitability of core business
− Efficiency & cost control− Process innovation− Scale− Supply chain
− Profits, margins, costs
− Wine
− Expand and grow emerging businesses & products
− Customer acquisition− Speed & flexibility− Execution− Resources/funding
− Market share, growth
− Soft drinks− Cider
− Develop and discover new options for growth
− Risk taking− Market insight− Business model innovation− Culture & incentives
− Milestones
− Packaged water− Whisky− Liqueurs
Bubble size is proportional to export value in 2015; a bubble this size is
US$1b
Two beverage products emerge as “growth stars” – cider and other flavoured beverages – from an evaluation of ten years of product-level trade growth
Note: Data on this page is product level trade codes, not segment level aggregates as presented earlier (e.g. sweetened soft drinks and other flavoured beverages sum to soft drinks category) Source: UN Comtrade database (from NZ Customs data); Coriolis classifications and analysis
NZ BEVERAGE EXPORT GROWTH STAR MATRIX: 10Y VALUE GROWTH VS. 10Y CAGR $ VS. VALUE IN 2015US$; CAGR on US$; 2005-2015
54
-20
5%
0
0%
100 580150
-5%
50 600
30%
25%
20%
35%
50%
45%
40%
15%
10%
$100.0
Liqueurs
Whiskeys
Other alc. spirits
Vodka
Wine, bulk
Wine, bottle
Cider; other fermented
Brandy/Cognac
Sparkling wineSoft drinks
Rum
Beer
Vinegar
Mineral water
Mixed juice Apple juice
Other flavoured beverages
Other juices
10y ABS growth in export value; US$; b; 2005-2015
10y CAGR growth in
export value;
US$; 05-15

Cider exports are growing and the product leverages New Zealand’s strengths in apples and other fruit; performance of peers suggest stronger growth is possible in this rapidly developing category
55Source: UN Comtrade database (from NZ Customs data); photo credit (Coriolis or fair use; low resolution; complete product/brand for illustrative purposes); various published articles; Coriolis analysis
CIDER EXPORT VALUE: NZ VS. SWEDENUS$; m; 2005-2015
EXAMPLE: NZ PRODUCTS ON-SHELFSelect; Feb 2017
EXAMPLE: IN-STORE DISPLAYSelect; Feb 2017
Australia
200
8
200
9
2010
200
5
200
6
200
7
2011
2015
Sweden
New Zealand
2013
2012
2014
$18$14
$154
$11
$126
$2
$74
$2
$71
$0
$82
$1
$177
$30
$14
$171
$15$12
$175
$4
$52
$10
+$11m
+$159m
Singapore
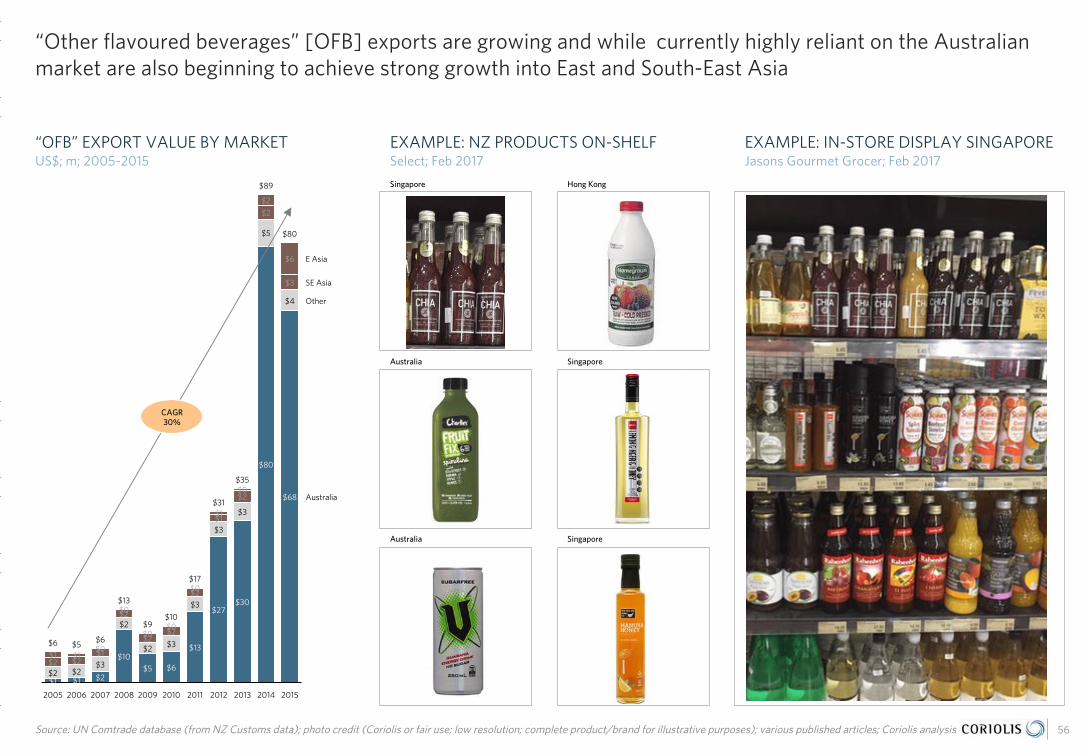
“Other flavoured beverages” [OFB] exports are growing and while currently highly reliant on the Australian market are also beginning to achieve strong growth into East and South-East Asia
56Source: UN Comtrade database (from NZ Customs data); photo credit (Coriolis or fair use; low resolution; complete product/brand for illustrative purposes); various published articles; Coriolis analysis
“OFB” EXPORT VALUE BY MARKETUS$; m; 2005-2015
EXAMPLE: NZ PRODUCTS ON-SHELFSelect; Feb 2017
EXAMPLE: IN-STORE DISPLAY SINGAPOREJasons Gourmet Grocer; Feb 2017
Singapore Hong Kong
Australia Singapore
SE Asia
2005
Other
201320122008 2010
Australia
2009
E Asia
20152006 2011 20142007
$1
$2
$2
$17
$10$9
$31
$80
$89
$35
$3
$2
$2
$6
$13
$6$5
$1 $2
$4
$1
$10$13
$27
$5 $6
$5
$3
$2
$2 $2
$2
$3
$3
$3
$3
$2
$6
$1
$0
$2
$2
$2
$2$1
$0
$68
$1
$30
$80
$1
$0$0
$0
$0
CAGR30%
Australia Singapore
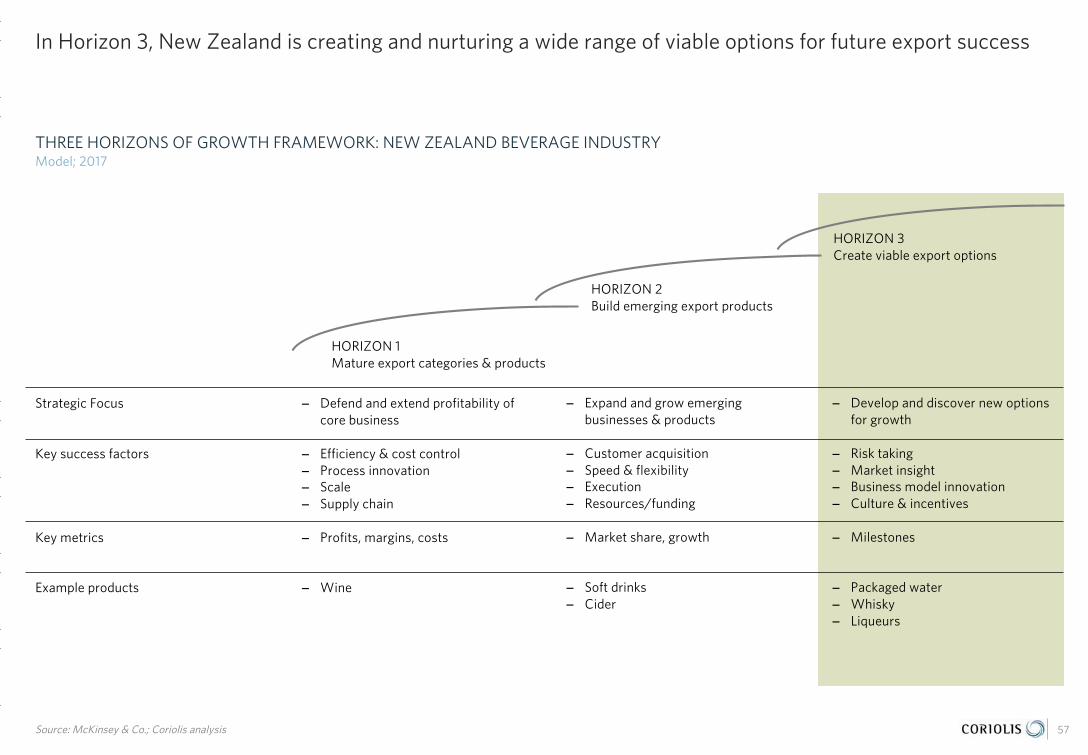
In Horizon 3, New Zealand is creating and nurturing a wide range of viable options for future export success
Source: McKinsey & Co.; Coriolis analysis
THREE HORIZONS OF GROWTH FRAMEWORK: NEW ZEALAND BEVERAGE INDUSTRYModel; 2017
57
Strategic Focus
Key success factors
Key metrics
Example products
HORIZON 1Mature export categories & products
HORIZON 2Build emerging export products
HORIZON 3Create viable export options
− Defend and extend profitability of core business
− Efficiency & cost control− Process innovation− Scale− Supply chain
− Profits, margins, costs
− Wine
− Expand and grow emerging businesses & products
− Customer acquisition− Speed & flexibility− Execution− Resources/funding
− Market share, growth
− Soft drinks− Cider
− Develop and discover new options for growth
− Risk taking− Market insight− Business model innovation− Culture & incentives
− Milestones
− Packaged water− Whisky− Liqueurs

Four broad global consumer mega-trends are driving growth and new product development in the food & beverage industry
Source: Boston Consulting Group; Datamonitor; Coriolis research and analysis 58
HEALTH & WELLNESS AUTHENTIC & RESPONSIBLE EASY & CONVENIENT SENSORY & INDULGENT
− Mid-high income countries experiencing an aging population
− Spread of Western lifestyle and Western diseases of affluence (e.g. diabetes)
− Ongoing waves of media hype around fad diets and new "superfoods” flavourings
− Food and drinks presented and viewed as both the problem and the solution
− Dramatic global shift to city living; 1800=3%, 1900=14%, 2015=50%; developed nations 75%+; 400 cities 1m+
− Loss of attachment to the land and food production
− Ongoing "rights revolution" now spreading to animals (e.g. non dairy milk demand)
− Ongoing waves of food scares around contamination, additives
− Dramatic increase in female participation on the workforce globally
− Consumers working longer hours to maintain relative income
− Work hours no longer just "9 to 5"; food needs at all times (e.g. night shift)
− Growing income polarisation into “haves and have-nots”
− Strongly emerging trend to premium (and discount) at the expense of the mid-market
− Emerging middle class across developing world driving consumption growth
− Incredible power of food and beverages in many social settings
− May be addressing specific conditions (e.g. weight management)
− May target a specific family member (e.g. grandparent, children)
− May reflect wider "healthy living" worldview
− May target specific foods perceived as high risk, unethical or visible (e.g. fairtradecoffee)
− May target a specific family member (e.g. child)
− May represent a need for an immediate solution (e.g. thirst)
− May represent an easy solution to a future challenge (e.g. single serve juice boxes for children's lunches)
− May range from "everyday luxury" to an occasional "treat"
− May be used to demonstrate social status, taste or style (e.g. top shelf spirit brands)
I am concerned about my health and am trying to live a healthy lifestyle
I am mindful of where my food comes from and how it is produced
I am trying to achieve work-life balance and need quick-and-easy meal solutions
I like to indulge in rich and sumptuous living beyond the bare necessities
FOUR CONSUMER FOOD & BEVERAGE MEGA-TRENDS

25g of carbs
New Zealand beverage products succeeding on-shelf in export markets are aligned with these trends
Source: photo credit (fair use; low resolution; complete product/brand for illustrative purposes); various published articles; Coriolis research and analysis 59
Sun ripened Nelson apples
100% New Zealand apples
Single-serve bottle
Crafted in a Traditional French Style
5% alcohol
Shelf-stable
Ready-to-drink 500ml size
Australia
H&W
H&W
A&R
A&R
E&C
E&C
E&C
S&I
“Brewer’s Series” releaseS&I
Sugarfree
Contains guarana
Single-serve can
A massive hit of energy
Contains B vitamins
Shelf-stable
Ready-to-drink 250ml size
Australia
H&W
H&W
A&R
E&C
E&C
E&C
S&I

These trends drive new product development, through (1) packaging, (2) product, (3) category and (4) channel innovation; success, however, often comes down to implementation and execution
Source: Coriolis
CONSUMER FACING INNOVATION IN THE FOOD & BEVERAGE INDUSTRY FROM TREND TO EXECUTIONSimplified model; 2017
60
CONSUMER FOOD & BEVERAGE MEGA-TRENDS
1. PACKAGING INNOVATION
NEW PRODUCT DEVELOPMENT
2. PRODUCT INNOVATION 3. CATEGORY INNOVATION 4. CHANNEL INNOVATION
Usage (e.g. ready-to-drink)
Shelf-life
Convenience (e.g. multi-pack)
Appearance (e.g. glass vs plastic)
Cost (e.g. plastic vs. glass)
Flavour
Formulation/recipe
New/different ingredients
Source/origin
Production system
Manufacturing process
Line extension
Creation of new category
New temperature state
Foodservice offer
Non-foods retail offer
Vending
Internet/Home delivery
Own retail stores
IMPLEMENTATION & EXECUTION
HEALTH & WELLNESS AUTHENTIC & RESPONSIBLE EASY & CONVENIENT SENSORY & INDULGENT
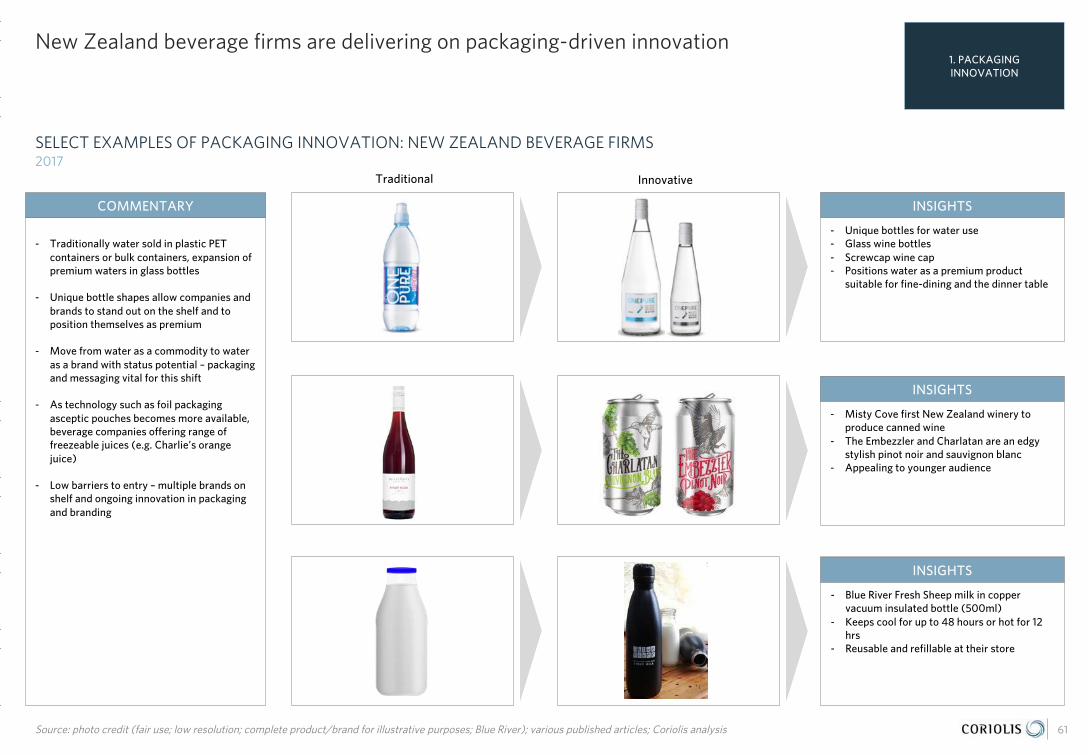
New Zealand beverage firms are delivering on packaging-driven innovation
Source: photo credit (fair use; low resolution; complete product/brand for illustrative purposes; Blue River); various published articles; Coriolis analysis
SELECT EXAMPLES OF PACKAGING INNOVATION: NEW ZEALAND BEVERAGE FIRMS2017
61
COMMENTARY
- Traditionally water sold in plastic PET containers or bulk containers, expansion of premium waters in glass bottles
- Unique bottle shapes allow companies and brands to stand out on the shelf and to position themselves as premium
- Move from water as a commodity to water as a brand with status potential – packaging and messaging vital for this shift
- As technology such as foil packaging asceptic pouches becomes more available, beverage companies offering range of freezeable juices (e.g. Charlie’s orange juice)
- Low barriers to entry – multiple brands on shelf and ongoing innovation in packaging and branding
INSIGHTS
- Unique bottles for water use- Glass wine bottles- Screwcap wine cap- Positions water as a premium product
suitable for fine-dining and the dinner table
INSIGHTS
- Misty Cove first New Zealand winery to produce canned wine
- The Embezzler and Charlatan are an edgy stylish pinot noir and sauvignon blanc
- Appealing to younger audience
INSIGHTS
- Blue River Fresh Sheep milk in copper vacuum insulated bottle (500ml)
- Keeps cool for up to 48 hours or hot for 12 hrs
- Reusable and refillable at their store
1. PACKAGING INNOVATION
Traditional Innovative

New Zealand beverage firms are delivering on product-driven innovation
Source: photo credit (fair use; low resolution; complete product/brand for illustrative purposes); various published articles; Coriolis analysis
SELECT EXAMPLES OF PRODUCT INNOVATION: NEW ZEALAND BEVERAGE FIRMS2017
62
- Scientifically developed Ti Tonic
- Uses New Zealand sourced grape seed and skin as antioxidant; white tea high in polyphenols; stevia and erythritolsweeteners
- Targeting the health conscious consumer
INSIGHTS
- CHIA blended drinks with super-juices, high in nutrients and omega 3
- Hydrated chia seeds make up between 75-90% of the ingredients in the various flavours
- Targeting health conscious consumer
- 100% natural, gluten free, vegan, GE Free, No preservatives, No added sugar, 100% NZ owned and made
INSIGHTS
- Villa Maria is a leading NZ wine company launch light wine
- Lighter in Alcohol (10%) and calories
- Launches range in Mar 2015 driven by customers demand for healthy lifestyle choices
- Part of ‘Lifestyle Wines’ research programme worth $16m over 7 years (PGP*)
INSIGHTS
2. PRODUCTINNOVATION
COMMENTARY
- Small brands are driving ongoing innovation with a constant stream of new beverages on-shelf and in cafes
- Products following trends in:- Healthy tonics (e.g. Ti Tonic)- Unique NZ (e.g. Aotea Native Tonics)- Functional ingredients (e.g. Chia, Hopt)- Gut health (e.g. Organic Mechanic OM
Kombucha)- Low sugar options (e.g. V 100% sugar-
free)- Lifestyle choices (e.g. Villa Maria “Light”
wine)- Premium (e.g. Garage Project gift
wrapped “Touched Wood” beer
- Brands driving innovation and showing on-going shift into multiple channels and positions
- EXAMPLE: Phoenix Organics – Juices, Waters, Good Energy organic energy drinks, lemon concentrates, sparkling grape, new range of mixers for cocktails (soda water, lemonade, ginger ale, tonic, cola), recent shift into 750ml bottles

New Zealand beverage firms are delivering on category and channel innovation
Source: photo credit (fair use; low resolution; complete product/brand for illustrative purposes); various published articles; Coriolis analysis
SELECT EXAMPLES OF CATEGORY & CHANNEL INNOVATION: NEW ZEALAND BEVERAGE FIRMS2017
63
McCashin’s Palaeo glacial water Garage Project canned beers and cellar door
Frucor’s V-Pure branch into natural products offer
- McCashin’s Brewery based in the South Island is the brewer of the iconic Stoke range of beers
- McCashin’s extended its non-alcoholic product range in March 2016 launching Palaeo water (still and sparkling)
- The water, sourced from a 350m deep bore on their site, is carbon-dated as being between 14,000 and 26,000 years old
- “Crystal clear and amongst the purest in the world, our Palaeo water comes from one of the oldest aquifers on earth”
- Palaeo water is distributed in NZ and throughout Asia
- www.stokebeer.co.nz
3&4. CATEGORY & CHANNEL INNOVATION
- Frucor’s “V” energy drink is a 20 year success story, the leader domestically and exporting internationally
- Over the last 10 years V has launched: Berry, Lemon, Double Hit, Energy Blue, Graphite, Iced Coffee, 0% Sugar, Zero, Reactor, Iced Chocolate, Spiked Punch and various limited edition flavours
- V Pure was launched recognising the need for energy but recognising the shift to natural ingredients
- V Pure uses only six natural ingredients
- Garage Project a Wellington based craft brewery established in 2011 has successfully repositioned the can
- Garage Project range of cans unique approach to branding includes artists designing labels for their beers; the aim, for the beers to stand out
- The cans are lighter to ship than glass bottles and recyclable
- Launched a new “wild” brewery in Wellington central
- Garage Project opened a cellar door at their brewery in Aro Valley and a Taproom with 18 beers on tap
Giesen’s Cider and Wine
- Giesen Wines known for their premium NZ wines launch Hard Apple Cider and Wine
- The spritzer-style blend of hard apple cider and white wine all from NZ fruit
- This is a product extension for Giesen who are a traditional wine company

New Zealand beverage firms are supported with access to advice, research facilities and pilot plants across five locations
Source: www.foodinnovationnetwork.co.nz; Coriolis 64
NZFIN
LOCATION FOCUS CAPABILITIES
Processed/FMCG foods Space/equipment for hireExport registrations ~1000 kg/shift
- Extrusion & Milling/Blending- Liquids/Beverage - High pressure processing- Freeze drying- General processing- Multiple packaging styles- Product development kitchen
Dairy & Infant Formula~500 kg/hourVegetable
- Spray dryer- Evaporator- Other dairy equipment- Packing- Powder (vegetable)
All Food and Beverage Specialist expertise- business development - direct to other facilities
DairyFruit & vegetablesAll Food and Beverage
- Same equipment as Manukau (1/5th scale)- Same equipment as Waikato (1/20th scale) - Post harvest technologies- Meat and small goods pilot plant- Located at Massey University
Processed/FMCG FoodsSpace/equipment for hireExport registrations 20-200L batch size
- Mixing /Blending/Emulsifying- Extrusion- Freezing/Cooking/Baking- General Processing- Product Development Kitchen- Technical and Business development
expertise

New ZealandBeverage Firms
+ Enterprises
+ Employment
+ Turnover
+ Ownership
+ Foreign investors
+ Acquisitions
+ Investment
+ Rebranding
+ Leadership 05

New Zealand has a strong and growing beverage industry that continues to attract investment
66
OVERVIEW
- The number of beverage processing firms in New Zealand has grown over the past decade, driven by wine and beer
- New Zealand has a large and robust beverage products industry with a range of participants of varying sizes
KEY METRICS
- Employment in beverage processing in New Zealand is growing, though slowly, as firms seek productivity gains
- Beverage processing is spread across the country, though Auckland and Marlborough stand out for absolute size
- Employment growth rates vary by region
- The wine industry is the major employer in the beverages section, accounting for half of all employees
- However, at a firm level two of the three largest employers are primarily soft drink manufacturers
FINANCIAL PERFORMANCE
- New Zealand’s beverage industry is led by predominantly beer and soft drink focused firms, with a strong second tier of dedicated wine producers
- The majority of the large beverage firms have foreign investment; the smaller wineries are predominantly privately owned
INVESTMENT
- The New Zealand beverage industry has attracted international investment from a wide range of sources
- Global firms investment in New Zealand firms is historical; however, new firms continue to invest in the sector
- More than $400m of acquisitions occurred over the last 18 months; global companies investing in innovative local craft and wineries looking to grow volumes
- Companies are investing in both land and plant to support strong growth in premium wines and craft beer
- Beverage firms are also investing in new and improved marketing- New leadership continues to enter the industry or be promoted from
within
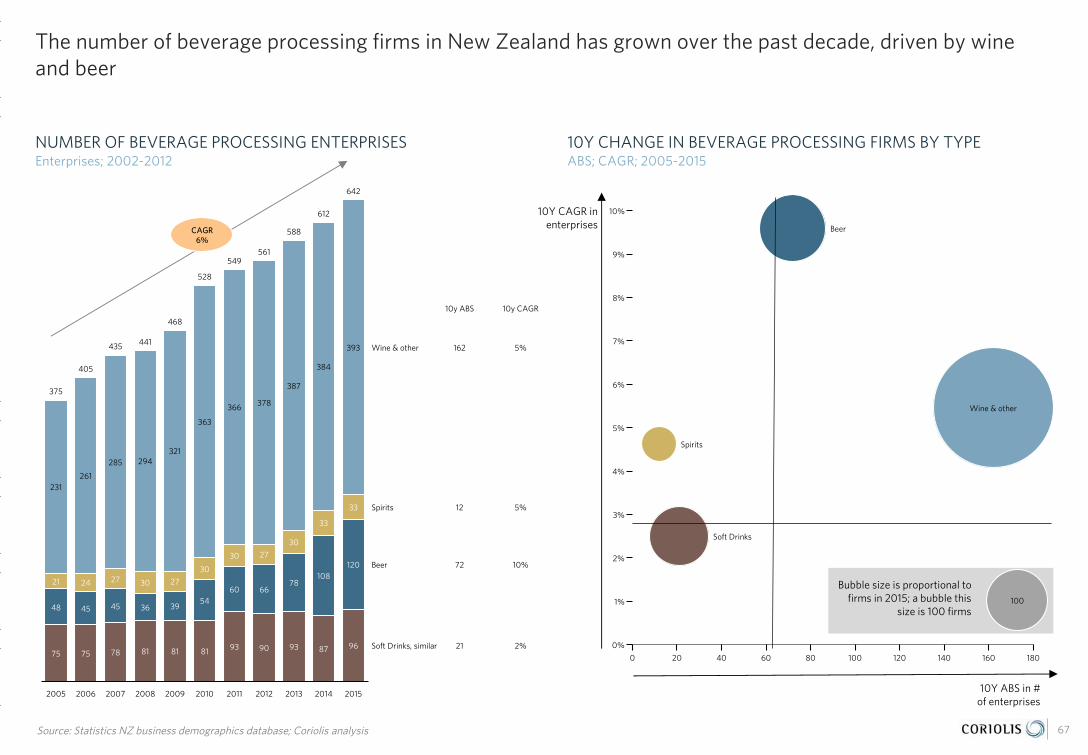
The number of beverage processing firms in New Zealand has grown over the past decade, driven by wine and beer
67
NUMBER OF BEVERAGE PROCESSING ENTERPRISESEnterprises; 2002-2012
10Y CHANGE IN BEVERAGE PROCESSING FIRMS BY TYPEABS; CAGR; 2005-2015
Source: Statistics NZ business demographics database; Coriolis analysis
200820072006
10y ABS
Soft Drinks, similar
10y CAGR
2005
Wine & other
2009 2012 20142011
Spirits
2013
Beer
20152010
72
12
387
642
393
612
384
21
588
162
528
405
375
441
468
435
10%
2%
561549
5%
5%
24 27
96
120
21
93
30
27
87
30
5460
45 36 3948
10878
45
66
30
78
321294
81
285
378
75
366
363
75
30
81 93 90
27
231261
81
33
33
CAGR6%
Bubble size is proportional to firms in 2015; a bubble this
size is 100 firms
0%
8%
3%
9%
10%
6%
5%
2%
4%
7%
1%
60 80400 20 100 160 180120 140
100
Soft Drinks
Wine & other
Beer
Spirits
10Y ABS in # of enterprises
10Y CAGR in enterprises

New Zealand has a large and robust beverage products industry with a range of participants of varying sizes
68
LARGE BEER, CIDER & SPIRITS LARGE SOFT DRINKS & WATER
MEDIUM/SMALL BEER & CIDER
LARGER WINE
MEDIUM/SMALLER WINE MEDIUM/SMALLER SOFT DRINKS & WATER

Employment in beverage processing in New Zealand is growing, though slowly, as firms seek productivity gains
69
TOTAL EMPLOYMENT BY BEVERAGE MNFG. ENTERPRISES1
Headcount; as of Feb; 2000-2015GROWTH IN AVERAGE EMPLOYEES/MANUFACTURERHead/unit; 2005-2015
Note: 2015 data latest available as of February 2017; 1. Defined as C121100 –121400 Beverage Manufacturing; Source: Statistics NZ business demographics database; Coriolis analysis
2009
10y ABS
20062005 20082007
10y CAGR
2012
Spirits
2014
Beer
20132011
Wine & other
2010 2015
Soft Drinks, similar
380
-170
4,8904,500
4,710
430
260
8,8608,740
9,130
8,860
9,1209,300
8,8909,090
-3%
3%
1%
1%
8,720
8,4208,220
2,110
580590
2,160
1,830
520
2,080
590640
2,080
1,4301,4601,430
1,400 1,390
1,840 1,8401,7001,530
1,400
520
1,890
5,1305,130
1,980
4,7904,660
1,900
4,6404,710
1,850
470
2,050
420510
2,180
4,330 4,560
2,050
460 420
CAGR1%
Bubble size is proportional to employment in 2015; a bubble this
size is 500 employees
-2%
-3%
500
-4%
-1%
2%
3%
0%
1%
400300-100 200-200 0 100
500
Soft Drinks
Spirits
Wine & other
Beer
10Y ABS in # of employees
10Y CAGR in employees

Bubble size is proportional to employment in 2015; a bubble this size is 1,000 people
Beverage processing is spread across the country, though Auckland and Marlborough stand out for absolute size; growth rates vary by region
70TMWW = Taranake, Manawatu-Wanganui & Wellington super-region; Source: Statistics NZ business demographics database; Coriolis analysis
BEVERAGE PROCESSING EMPLOYMENT BY REGIONHeadcount; as of Feb; 2016
10Y CHANGE IN BEVERAGE PROCESSING EMPLOYMENT BY REGIONABS; CAGR; 2016 total; Headcount; as of Feb; 2006 vs. 2016
SINI
BOP/Gisb/HB930
2,443
TMWW390
Tasman/WC321
Canterbury550
Marlborough1,200
4,525
Auckland/Northland/Waikato3,205
Otago/SL372
3%
7%
8%
9%
2%
400 500
0%
-1%
4%
1%
6%
5%
0-100 100 300200
500
Auckland/Northland/Waikato
BOP/Gisb/HB
TMWW
Canterbury
Otago/SL
Tasman/WC
Marlborough
10Y ABS
10Y CAGR
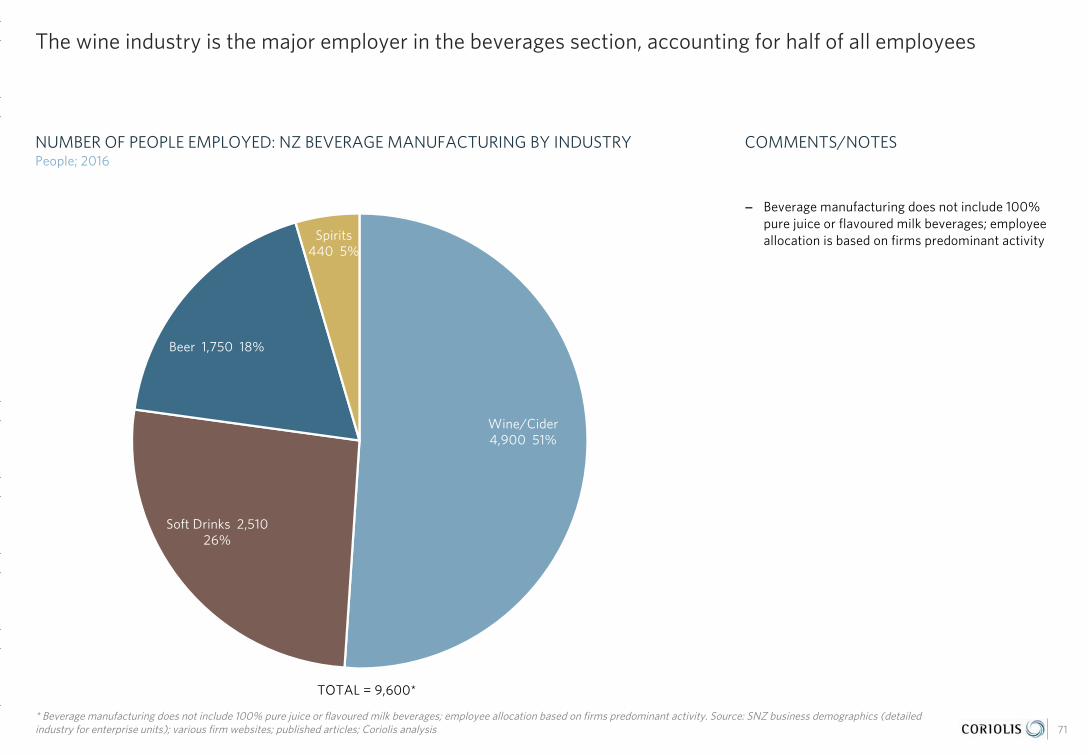
The wine industry is the major employer in the beverages section, accounting for half of all employees
Wine/Cider 4,900 51%
Soft Drinks 2,510 26%
Beer 1,750 18%
Spirits 440 5%
71* Beverage manufacturing does not include 100% pure juice or flavoured milk beverages; employee allocation based on firms predominant activity. Source: SNZ business demographics (detailed industry for enterprise units); various firm websites; published articles; Coriolis analysis
NUMBER OF PEOPLE EMPLOYED: NZ BEVERAGE MANUFACTURING BY INDUSTRYPeople; 2016
− Beverage manufacturing does not include 100% pure juice or flavoured milk beverages; employee allocation is based on firms predominant activity
COMMENTS/NOTES
TOTAL = 9,600*
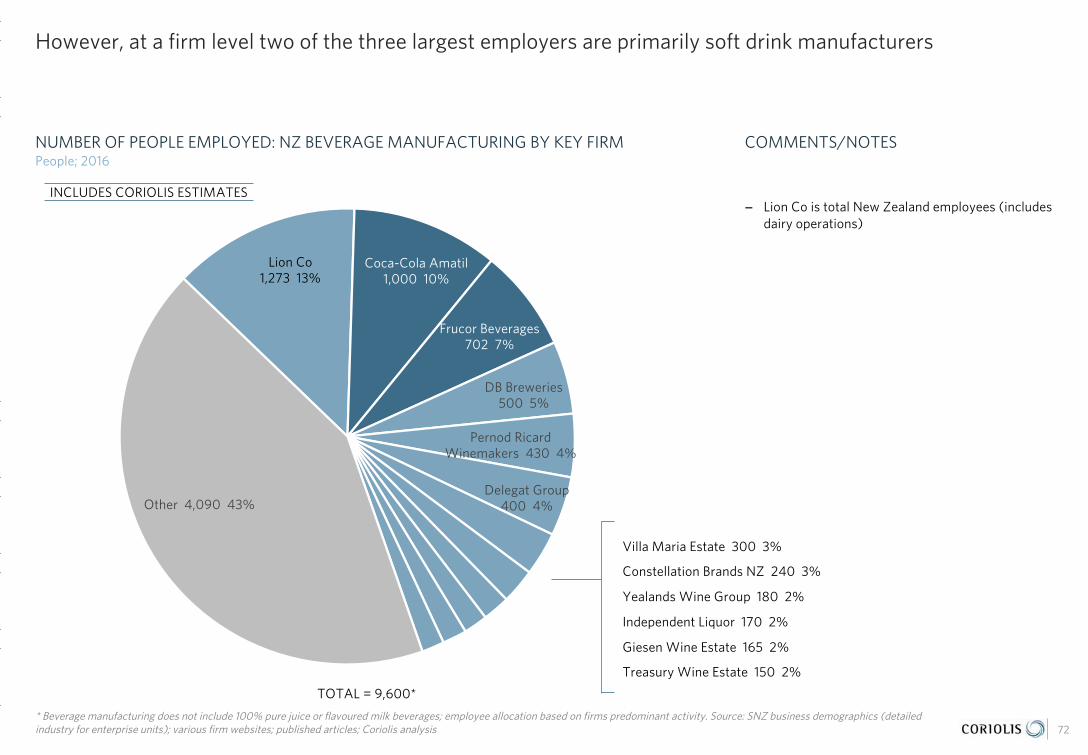
However, at a firm level two of the three largest employers are primarily soft drink manufacturers
Lion Co 1,273 13%
Coca-Cola Amatil1,000 10%
Frucor Beverages702 7%
DB Breweries500 5%
Pernod Ricard Winemakers 430 4%
Delegat Group400 4%
Villa Maria Estate 300 3%
Constellation Brands NZ 240 3%
Yealands Wine Group 180 2%
Independent Liquor 170 2%
Giesen Wine Estate 165 2%
Treasury Wine Estate 150 2%
Other 4,090 43%
72* Beverage manufacturing does not include 100% pure juice or flavoured milk beverages; employee allocation based on firms predominant activity. Source: SNZ business demographics (detailed industry for enterprise units); various firm websites; published articles; Coriolis analysis
NUMBER OF PEOPLE EMPLOYED: NZ BEVERAGE MANUFACTURING BY KEY FIRM People; 2016
− Lion Co is total New Zealand employees (includes dairy operations)
COMMENTS/NOTES
TOTAL = 9,600*
Villa Maria Estate 300 3%
Constellation Brands NZ 240 3%
Yealands Wine Group 180 2%
Independent Liquor 170 2%
Giesen Wine Estate 165 2%
Treasury Wine Estate 150 2%
INCLUDES CORIOLIS ESTIMATES

New Zealand’s beverage industry is led by predominantly beer and soft drink focused firms, with a strong second tier of dedicated wine producers
$561
$532
$429
$393
$366
$254
$249
$241
$227
$170
Lion Co
Coca-Cola Amatil
Frucor Beverages
Independent Liquor
DB Breweries
Delegat Group
Treasury Wine Estate
Pernod Ricard Winemakers
Constellation Brands NZ
Villa Maria Estate
Source: various company annual reports; NZCO; Coriolis estimates and analysis
ANNUAL TURNOVER BY TOP 10 FIRMS: NEW ZEALAND BEVERAGE INDUSTRYNZ$; m; FY2016
73
Actual from AR
FY16 estimate from available data
INCLUDES CORIOLIS ESTIMATES

The majority of the large beverage firms have foreign investment; the smaller wineries are predominantly privately owned
Foreign69%
Public 6%
Private 25%
Source: New Zealand Companies Office; various annual reports; Coriolis estimates and analysis
ESTIMATED PROPORTIONAL SHARE OF TOTAL INDUSTRY TURNOVER BY OWNERSHIP% of turnover/sales; 2016
74
Partially
Fully
INCLUDES ESTIMATESPRO-RATA TO OWNERSHIP
Etc.
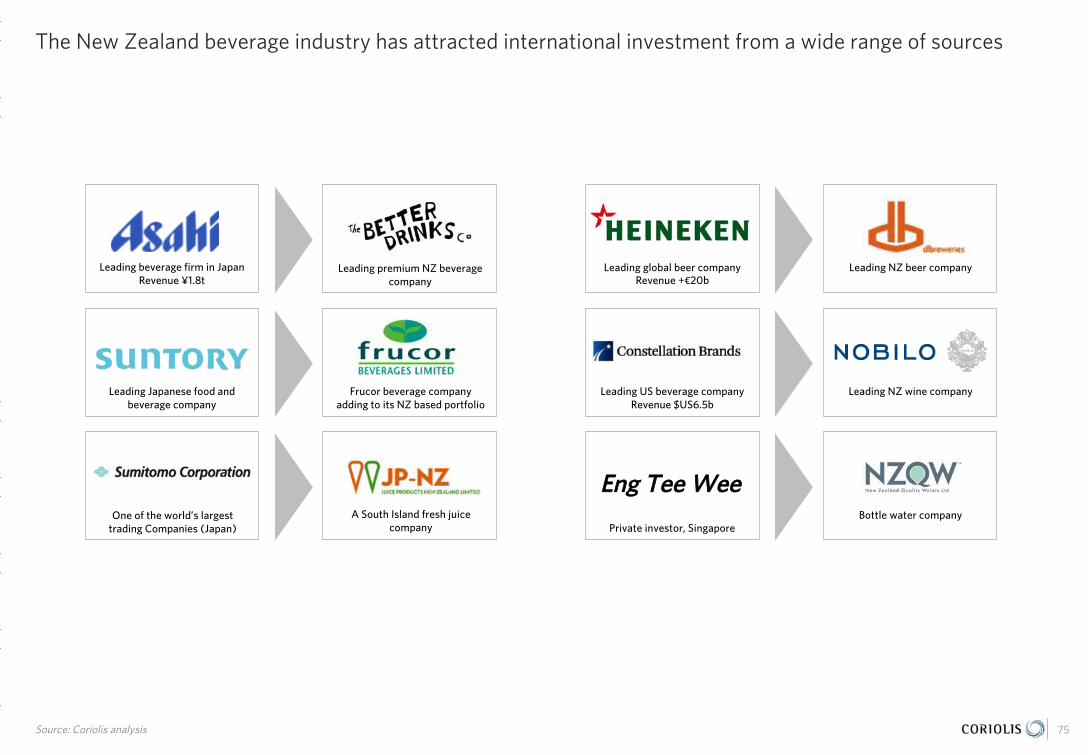
The New Zealand beverage industry has attracted international investment from a wide range of sources
Source: Coriolis analysis 75
Leading global beer companyRevenue +€20b
Leading NZ beer companyLeading beverage firm in JapanRevenue ¥1.8t
Leading premium NZ beverage company
Leading US beverage companyRevenue $US6.5b
Leading NZ wine companyLeading Japanese food and beverage company
Frucor beverage company adding to its NZ based portfolio
One of the world’s largest trading Companies (Japan)
A South Island fresh juice company Private investor, Singapore
Bottle water company
EEnngg TTeeee WWeeee

Global firms investment in New Zealand firms is historical; however, new firms continue to invest in the sector
76
2011 and earlier 2012-2014 2015+
OOrrddoovveerr TTrruusstt ((UUSSAA))
EEnngg TTeeee WWeeee((SSiinnggaappoorree))
GGiiffffiitthh((PPrriivvaattee,, UUSSAA))

More than $400m of acquisitions occurred over the last 18 months; global companies investing in innovative local craft and wineries looking to grow volumes
* “it was $10million purchase price plus $15million max potential earn out over 4 years” ** Industry estimate; Source: Coriolis 77
- Lion acquires craft brewer Panhead Custom Ales – launched 2013 in Upper Hutt; following on from acquisition of Emerson’s brewery in 2013; July 2016
- DB Breweries acquires Kapitai based boutique brewing company Tuatara from Rangatira Ivnestmetns Implied total value of $10m; Jan 2017
- Indevin acquires vineyards associated with Winegrowers Ara a total of 1,500 ha in Waihopai Valley; estimated value of $280m; Feb 2016
- Giesen acquires Ara wine brand from Winegrowers Ara; production shifts to Giesen’s, bottling at Wineworks; additional volume ensures additional growth and presence in premium markets (e.g. USA, UK); June 2106
- Peter Yealand sold 80% of company to the NZ-based utility company; July 2017
- Saint Clair acquires 50ha of vineyards, distribution network and brand (wine made at Marlborough Vintners); May 2016
- US based VC Liquid Asset Brands and Spirits Investment Partners acquire Stolen Spirits, established in 2010; looking to expand in USA; Oct 2015
$25m*
$89m
$10m**
$250-300m
N/A
$21m

$25m - Investment by Lion in Emerson’s new brewery, tap-room and restuaruant -increasing volume to 8mL/yr
N/A - New brewery with bStudio in Hawkes Bay to increase volumes
N/A - Built a 10,000m2 Keri Juice plant commissioned Sep ’16
Companies are investing in both land and plant to support strong growth in premium wines and craft beer
78Source: annual reports, new articles, company websites, Coriolis estimates
EXTENDING WINE CAPACITY INCREASING SCALE
+$100m - New winery under construction inHawkes Bay; 13,000 m2 building to support new farm vineyards
$29m - Acquires 838ha farm in Hawkes Bay to meet strong growth in global demand for super premium wines (Oyster Bay) adding 550,000 9L cases a year to portfolio when producing; adjacent to existing vineyard
THE BOTTLING COMPANY
N/A - Establishment of a new contract bottling company in Riverlands Industrial Estate, Marlborough; able to process 6,000 bottles/hr
$4.35m - Investment in 266ha land adjacent to existing vineyard in Awatere Valley
N/A - Expansion of wine production facility at Riverlands Industrial Estate
$1.2m - Investment in plant and infrastructure, new wine presses to increase production quality and volume
$30m - Expansion of Te Awa Estate winery Hawkes Bay

Beverage firms are also investing in new and improved marketing
Source: photo credit (various firms or fair use; low resolution; complete product, brand or promotional image for illustrative purposes); various published articles; Coriolis analysis 79
Rebranding New Packaging Advertising & Promotion

New leadership continues to enter the industry or be promoted from within
Note: No other firms provided photos 80
Simon TownsManaging Director
Constellation Brands NZ
Kevin BowlerCEO - NZ
Frucor Beverages
Yang ShenEstate Director
Cloudy Bay Vineyards
Angus McPhersonMD - AU & NZ
Treasury Wine Estate
Adrian Garforth MWCEO
Yealands Wine Group

New Zealand Beverages Firm Profiles
05

82* Estimate; Source: various companies annual financial statements (NZ Companies Office or company website); various press releases and news articles; Coriolis analysis
ACCOLADE WINES NZ
Jack GloverGeneral Manager
DESCRIPTION: Wine producer and marketer; Waipara Hills, Dusky Sounds, Mud House, Nobilo, Drylands, Ta_Ku, Monkey Bay, Haymaker brands; parent company headquartered in Australia, 5th
largest wine company in world
KEY PRODUCTS: Wine
OWNERSHIP: AU; PE (CHAMP (AU) 80%, Constellation Brands (USA) 20%) via Accolade Wines AU
COMPANY NUMBER: 4661159
ADDRESS: 22 Liverpool Street, Riverlands Estate,Blenheim
PHONE: +64 3 520 6011
WEBSITE: www.accolade-wines.com; www.mudhouse.co.nz
YEAR FORMED: 2013
STAFF EMPLOYED: 90
REVENUE: $41m (FY16)
COMPANY HIGHLIGHTS: Parent company acquired Lion Australia’s premium wine business, Fine Wine Partners, 6 Australian brands, 4 wineries, in Feb ’17; $1b+ ASX IPO listing considered but ultimately postponed in early ’17
ALLAN SCOTT WINES & ESTATES
Allan ScottDirector
DESCRIPTION: Winery and restuarant; Allan Scott, Moa Ridge, Scott Base brands; Marlborough and Central Otago vineyards
KEY PRODUCTS: Wine
OWNERSHIP: NZ; Private (Scott)
COMPANY NUMBER: 608289
ADDRESS: Jacksons Road, Blenheim
PHONE: +64 3 572 9054
WEBSITE: www.allanscott.com
YEAR FORMED: 1990
STAFF EMPLOYED: 28
REVENUE: $15-20m*
COMPANY HIGHLIGHTS: Tasting room opened in Cromwell in ‘15; Allan Scott released autobiography in ‘16
AMISFIELD
Craig ErasmusChief Executive Officer
DESCRIPTION: Cellar door and restaurant based in Queenstown; estate vineyard in Central Otago; Amisfield, Lake Hayes brands
KEY PRODUCTS: Wine
OWNERSHIP: NZ; Private (Darby/Kayne)
COMPANY NUMBER: 3312291
ADDRESS: 10 Lake Hayes Road,Queenstown
PHONE: +64 3 442 0556
WEBSITE: www.amisfield.co.nz
YEAR FORMED: 1999
STAFF EMPLOYED: 70
REVENUE: $10-15m (FY16)
COMPANY HIGHLIGHTS:
BABICH WINES LTD
Joe BabichManaging Director
DESCRIPTION: Family owned wine producer; vineyards in Auckland, Hawke’s Bay and Marlborough
KEY PRODUCTS: Wine
OWNERSHIP: NZ; Private (Babich Family)
COMPANY NUMBER: 57990
ADDRESS: 15 Babich Road, Henderson Valley, Auckland
PHONE: +64 9 833 7859
WEBSITE: www.babichwines.co.nz
YEAR FORMED: 1916
STAFF EMPLOYED: 65
REVENUE: $30-40m*
COMPANY HIGHLIGHTS: First vintage in new Babich Marlborough winery in ‘14, 4,000 t processed; acquired 79ha Echelon Vineyard in Waihopai Valley in ’14; extensive global PR campaign to celebrate 100 years in ‘16

83* Estimate; Source: various companies annual financial statements (NZ Companies Office or company website); various press releases and news articles; Coriolis analysis
BEVPAC NEW ZEALAND/ TSL PLASTICS
Graham LundieManaging Director
DESCRIPTION: Carbonated beverage manufacturers and contract packers; Jolly brand, house brands; P.E.T bottle manufacturer company
KEY PRODUCTS: Contract beverage filling
OWNERSHIP: NZ; Private (Lundie, Simth, Mazur, Borich)
COMPANY NUMBER: 803057/286873
ADDRESS: 76 Lady Ruby Drive, East Tamaki,Auckland
PHONE: +64 9 914 7180
WEBSITE: www.tslplastics.nz
YEAR FORMED: 1996/1986
STAFF EMPLOYED: 50
REVENUE: $15-20m
COMPANY HIGHLIGHTS:
CLOUDY BAY VINEYARDS
Yang ShenEstate Director
DESCRIPTION: Wine maker based in Marlborough; Cloudy Bay, Pelorus, Te Koko, Te Wahi; sister company Cape Mentelle in Western Australia
KEY PRODUCTS: Wine, cellar door, tourist experiences
OWNERSHIP: France; Public (Euronext:MC); (Groupe Arnault 46%, Diageo 34%)
COMPANY NUMBER: 271895
ADDRESS: 230 Jacksons Road, Blenheim, Marlborough
PHONE: +64 3 520 9147
WEBSITE: www.cloudybay.co.nz; www.lvmh.com
YEAR FORMED: 1985
STAFF EMPLOYED: 50
REVENUE: $52m (FY15)
COMPANY HIGHLIGHTS: New Estate Director moved from Domain Chandon in China ’16 to focus on high quality Sauvignon Blanc, Chardonnay, Pinot Noir and Pelorus Methode; raising the profile of Central Otago Pinot Noir to meet market demand.
COCA-COLA AMATIL NZ
Chris LitchfieldManaging Director
DESCRIPTION: Manufacturer and distributor of soft drinks, juice and water, with some brands under license from Coca-Cola USA; 4 production facilities located in Auckland, Putaruru, Christchurch
KEY PRODUCTS: Soft drinks, juices, water, flavoured dairy, alcoholic spirits, beer, cider, energy drinks, coffee
OWNERSHIP: AU; Public (Coca-Cola Amatil Limited (ASX:CCL))
COMPANY NUMBER: 440039
ADDRESS: The Oasis, Mt Wellington,Auckland
PHONE: +64 9 570 3000
WEBSITE: www.ccamatil.co.nz; www.ccamatil.com
YEAR FORMED: 1907
STAFF EMPLOYED: ~1,000
REVENUE: $532m (FY15)
COMPANY HIGHLIGHTS: Coca Cola Amatil and Beam Suntory distribution partnership in NZ in ‘15; AON Hewitt Best Employer ‘16; Rainbow Tick Accreditation ‘16; Monster Energy Drinks partnership ‘16; 10,000m2 Keri Juice plant commissioned Sep ’16, can produce 800,000 bottles a day
CONSTELLATION BRANDS NZ/NOBILO HOLDINGS
Simon TownsManaging Director
DESCRIPTION: Grower and maker of wines; Nobilo, Kim Crawford, Selaks, Monkey Bay, Drylands, VNO, The People’s Wine, Crafters Union, Wild Grace Wines
KEY PRODUCTS: Wine
OWNERSHIP: USA; Public (Constellation Brands Inc(NYSE:STZ))
COMPANY NUMBER: 1477933
ADDRESS: 45 Station Road, Huapai-Kumeu,Auckland
PHONE: +64 9 412 6666
WEBSITE: www.constellationnz.com; www.cbrands.com
YEAR FORMED: 2004
STAFF EMPLOYED: 240
REVENUE: $227m (FY16)
COMPANY HIGHLIGHTS: New CEO May ’16, from Constellation Brands in San Francisco; Nov ‘16 acquires 21ha in Central Otago for pinot noir production; opportunities to grow NZ brands in Australia; plans to double Drylands, Marlborough capacity over ’17-’18 to fill US demand
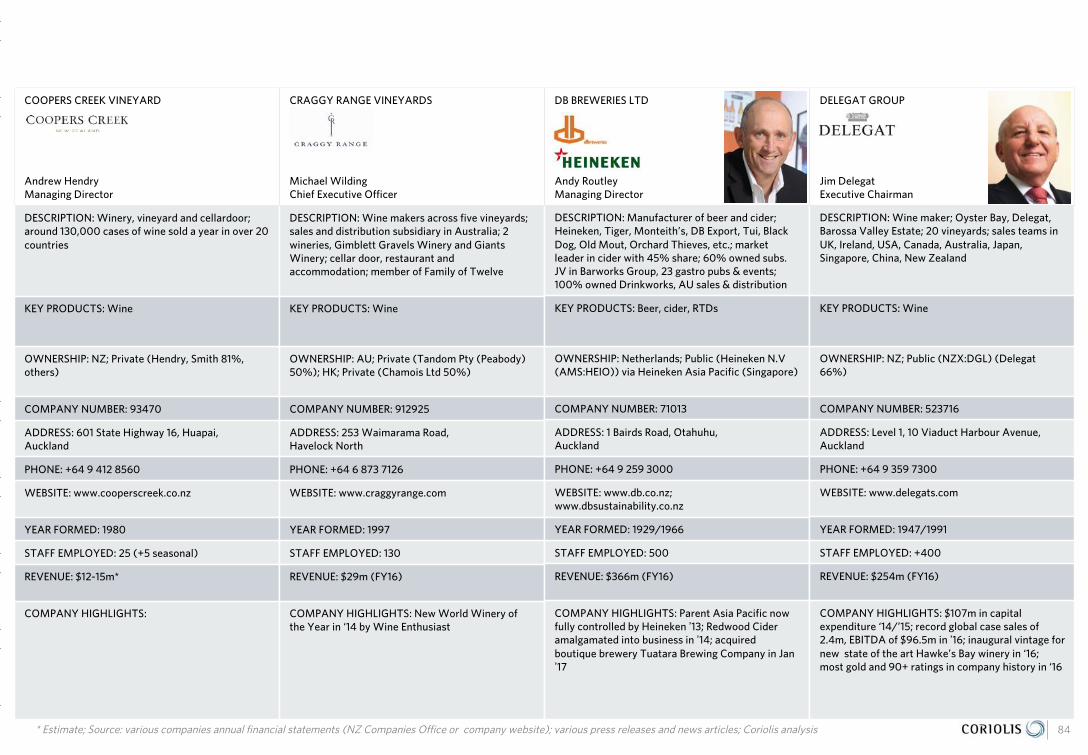
84* Estimate; Source: various companies annual financial statements (NZ Companies Office or company website); various press releases and news articles; Coriolis analysis
COOPERS CREEK VINEYARD
Andrew HendryManaging Director
DESCRIPTION: Winery, vineyard and cellardoor; around 130,000 cases of wine sold a year in over 20 countries
KEY PRODUCTS: Wine
OWNERSHIP: NZ; Private (Hendry, Smith 81%, others)
COMPANY NUMBER: 93470
ADDRESS: 601 State Highway 16, Huapai, Auckland
PHONE: +64 9 412 8560
WEBSITE: www.cooperscreek.co.nz
YEAR FORMED: 1980
STAFF EMPLOYED: 25 (+5 seasonal)
REVENUE: $12-15m*
COMPANY HIGHLIGHTS:
CRAGGY RANGE VINEYARDS
Michael Wilding Chief Executive Officer
DESCRIPTION: Wine makers across five vineyards; sales and distribution subsidiary in Australia; 2 wineries, Gimblett Gravels Winery and Giants Winery; cellar door, restaurant and accommodation; member of Family of Twelve
KEY PRODUCTS: Wine
OWNERSHIP: AU; Private (Tandom Pty (Peabody) 50%); HK; Private (Chamois Ltd 50%)
COMPANY NUMBER: 912925
ADDRESS: 253 Waimarama Road,Havelock North
PHONE: +64 6 873 7126
WEBSITE: www.craggyrange.com
YEAR FORMED: 1997
STAFF EMPLOYED: 130
REVENUE: $29m (FY16)
COMPANY HIGHLIGHTS: New World Winery of the Year in ‘14 by Wine Enthusiast
DB BREWERIES LTD
Andy RoutleyManaging Director
DESCRIPTION: Manufacturer of beer and cider; Heineken, Tiger, Monteith’s, DB Export, Tui, Black Dog, Old Mout, Orchard Thieves, etc.; market leader in cider with 45% share; 60% owned subs. JV in Barworks Group, 23 gastro pubs & events; 100% owned Drinkworks, AU sales & distribution
KEY PRODUCTS: Beer, cider, RTDs
OWNERSHIP: Netherlands; Public (Heineken N.V (AMS:HEIO)) via Heineken Asia Pacific (Singapore)
COMPANY NUMBER: 71013
ADDRESS: 1 Bairds Road, Otahuhu, Auckland
PHONE: +64 9 259 3000
WEBSITE: www.db.co.nz; www.dbsustainability.co.nz
YEAR FORMED: 1929/1966
STAFF EMPLOYED: 500
REVENUE: $366m (FY16)
COMPANY HIGHLIGHTS: Parent Asia Pacific now fully controlled by Heineken ’13; Redwood Cider amalgamated into business in ’14; acquired boutique brewery Tuatara Brewing Company in Jan ’17
DELEGAT GROUP
Jim DelegatExecutive Chairman
DESCRIPTION: Wine maker; Oyster Bay, Delegat, Barossa Valley Estate; 20 vineyards; sales teams in UK, Ireland, USA, Canada, Australia, Japan, Singapore, China, New Zealand
KEY PRODUCTS: Wine
OWNERSHIP: NZ; Public (NZX:DGL) (Delegat66%)
COMPANY NUMBER: 523716
ADDRESS: Level 1, 10 Viaduct Harbour Avenue, Auckland
PHONE: +64 9 359 7300
WEBSITE: www.delegats.com
YEAR FORMED: 1947/1991
STAFF EMPLOYED: +400
REVENUE: $254m (FY16)
COMPANY HIGHLIGHTS: $107m in capital expenditure ‘14/’15; record global case sales of 2.4m, EBITDA of $96.5m in ’16; inaugural vintage for new state of the art Hawke’s Bay winery in ‘16; most gold and 90+ ratings in company history in ‘16

85* Estimate; Source: various companies annual financial statements (NZ Companies Office or company website); various press releases and news articles; Coriolis analysis
ENVICTUS NZ
Neil McGarvaChief Executive Officer Envictus Dairies NZ
DESCRIPTION: 72% partner in JV Envictus Dairies NZ, manufacturer of UHT aseptic PET liquids: dairy, juice, alternative dairy and water products; factory in Whakatu; exports to China, Taiwan, Japan, AU; Naturalac Nutrition “Horleys” sports nutrition subsidiary; milk drying outsourced; contract packs
KEY PRODUCTS: UHT milk, flavoured milk, pet milk, fruit juice, sports nutrition beverages, weight loss water, coconut milk, almond milk
OWNERSHIP: Malaysia; Public (EnvictusInternational Holdings)
COMPANY NUMBER: 1863590
ADDRESS: 44 Johnston Way, Whakatu, Hastings
PHONE: +64 6 650 3000
WEBSITE: www.envictus-intl.com; www.horleys.com
YEAR FORMED: 2006
STAFF EMPLOYED: 33 FTE
REVENUE: $19m (FY16)
COMPANY HIGHLIGHTS: Name change in ‘14 after Etika’s global sale of dairy business; looked to sell Envictus Dairies in Feb ‘16 for $20m but agreement lapsed; launched RTD sports nutrition beverage, protein drinks, developed non-dairy nut milks and developing drinking yoghurt and real coffee products in ’17
FOLEY FAMILY WINES NZ
Mark TurnbullChief Executive Officer
DESCRIPTION: USA wine company; Vavasour,Grove Mill, Te Kairanga, Goldwater, Dashwood, Clifford Bay, Sanctuary, The Pass, Boatshed Bay, Babbling Brook, Walking Birds, MartinboroughVineyard brands; 4 wineries; Lighthouse Gin brand
KEY PRODUCTS: Wine, gin
OWNERSHIP: NZ; Public (NZX:FFW) (Foley (USA; Private) 66%, NZ Central Securities 17%, others)
COMPANY NUMBER: 307139
ADDRESS: 13 Waihopai Valley Road, Blenheim
PHONE: +64 3 572 8200
WEBSITE: www.nzwineco.co.nz; www.ffw.co.nz; www.lighthousegin.co.nz
YEAR FORMED: 1986
STAFF EMPLOYED: 65
REVENUE: $35m (FY16)
COMPANY HIGHLIGHTS: Acquired Lighthouse Gin in ‘14; invested in new warehouse at Grove Mill, $2.2m in ‘15; emphasis on selling branded product rather than bulk wine in ’16; earthquake damage of over $1m in Nov ’16 to Grove Mill Winery
FRUCOR BEVERAGES
Kevin BowlerChief Executive Officer NZ
DESCRIPTION: Manufacturer of soft drinks, juices and other beverages; brands include V Energy, Just Juice, Sparkling OH!, Fresh Up, McCoy, OVI, Citrus Tree, Mizone, Simply Squeezed, etc.; 20m cases of drink products/year from South Auckland plant; bottles and distributes Pepsico products in NZ
KEY PRODUCTS: Energy drinks, juice, sports drinks, water, carbonated soft drinks
OWNERSHIP: Japan; Private; (Suntory Holdings Ltd (Kotobuki Realty 90%, Torii, others))
COMPANY NUMBER: 913026
ADDRESS: 86 Plunket Avenue, Manukau City,Auckland
PHONE: +64 9 250 0100
WEBSITE: www.frucor.com
YEAR FORMED: 1962
STAFF EMPLOYED: 684
REVENUE: $429m (FY15)
COMPANY HIGHLIGHTS: Jun ‘16 launch “V Pure” using 6 natural ingredients
GIBBSTON VALLEY
Greg HuntChief Executive Officer
DESCRIPTION: Winery, restaurant, wine tours;based in Queenstown
KEY PRODUCTS: Wine
OWNERSHIP: USA; Private (Griffith, Pike)
COMPANY NUMBER: 449621
ADDRESS: 1820 State Highway 6, Gibbston, Queenstown
PHONE: +64 3 442 6910
WEBSITE: www.gibbstonvalley.com
YEAR FORMED: 1990
STAFF EMPLOYED: 55
REVENUE: $5-10m*
COMPANY HIGHLIGHTS: Original Home Block vineyard certified organic in ‘14
86* Estimate; Source: various companies annual financial statements (NZ Companies Office or company website); various press releases and news articles; Coriolis analysis
GIESEN WINE ESTATE
Theo, Alex and Marcel GiesenDirectors (Marcel right)
DESCRIPTION: Marlborough centric wine company with grapes throughout NZ; Cellar door in Marlborough; 93% of wine exported; #1 market Australia; Kaiser Brothers Brewery operating out of Head Office in Canterbury
KEY PRODUCTS: Wine, cider, beer
OWNERSHIP: NZ; Private (Giesen)
COMPANY NUMBER: 1004906
ADDRESS: 46B Halwyn Drive, Hei Hei, Christchurch
PHONE: +64 3 344 6270
WEBSITE: www.giesen.co.nz
YEAR FORMED: 1981
STAFF EMPLOYED: 105 (+60 seasonal)
REVENUE: $70-80m
COMPANY HIGHLIGHTS: Added Barossa Valley’s Peter Lehmann Wines, owned by Casella Family Brands into distribution business in ’15 along with Mirabeau Rose from Provence; awardedchampion pinot noir at the 2016 IWSC in the UK and outstanding medal, plus three champion titles at the Air NZ Wine Awards; Jun ’16 purchased Ara brand, UK presence; brewery operational in ‘16
HARRINGTON’S BREWERIES
Carl HarringtonManaging Director
DESCRIPTION: Beer and cider manufacturer; contract brewing and bottling
KEY PRODUCTS: Beer, cider
OWNERSHIP: NZ; Private (Harrington)
COMPANY NUMBER: 138071
ADDRESS: 6 Tenahaun Place, Wigram,Christchurch
PHONE: +64 3 929 0107
WEBSITE: www.harringtons.nz
YEAR FORMED: 1991
STAFF EMPLOYED: 21
REVENUE: $10-20m (FY16)
COMPANY HIGHLIGHTS: Acquired Matson’s Brewery in ‘14; moved operations from Ferry Road into new purpose built premises at Wigram in ’16; invested $2m Italian bottling line in ‘16; exited hospitality and retail side of business in ‘16; current focus on H&S and lean manufacturing programmes
HUNTER'S WINES (NZ) LTD
Jane HunterManaging Director
DESCRIPTION: Winery and restaurant; Hunters and Spring Creek brands; output of around 100,000 cases of wine; export approximately 85% of production
KEY PRODUCTS: Wine
OWNERSHIP: NZ; Private (Hunter)
COMPANY NUMBER: 140641
ADDRESS: 603 Rapaura Road, Blenheim
PHONE: +64 3 572 8489
WEBSITE: www.hunters.co.nz
YEAR FORMED: 1979
STAFF EMPLOYED: 25
REVENUE: $7-10m (FY16)
COMPANY HIGHLIGHTS: New winemaking team in ‘16
INDEPENDENT LIQUOR
James CollinsCountry Manager - NZ
DESCRIPTION: Distiller of spirits (Woodstock, Cruiser, Cody’s, Boundary Road, Long White, Canterbury Cream, others); brewer of beer(Calsberg, Asahi, NZ Pure, Haagen, Wild Buck, Founders); cider (Somersby, Wild Side, Honesty Box)
KEY PRODUCTS: Beer, RTDs, cider, spirits
OWNERSHIP: Japan; Public (Asahi Group Holdings(TYO:2502))
COMPANY NUMBER: 354989
ADDRESS: 35 Hunua Road, Papakura, Auckland
PHONE: +64 9 298 3000
WEBSITE: www.independentliquor.co.nz; www.asahigroup-holdings.com
YEAR FORMED: 1987
STAFF EMPLOYED: 170
REVENUE: $393m (FY15)
COMPANY HIGHLIGHTS: “The Mill” chain sold to Foodstuffs in Oct ’15 for $12m
87* Estimate; Source: various companies annual financial statements (NZ Companies Office or company website); various press releases and news articles; Coriolis analysis
INDEVIN GROUP LTD
Duncan McFarlaneGroup Chief Executive Officer
DESCRIPTION: Integrated wine supply co., owning and operating vineyards and wineries in Marlborough, Gisborne and Hawkes Bay. Largest New Zealand owner of vineyards and vineyard land. Have a large contract grower portfolio. Acquired parts of Lindauer assets from Pernod in 2010.
KEY PRODUCTS: Wine
OWNERSHIP: NZ; Private (Wallace 88%, others)
COMPANY NUMBER: 3164447
ADDRESS: 17-19 Winefair Close, Blenheim
PHONE: +64 3 520 6810
WEBSITE: www.indevin.com
YEAR FORMED: 2003
STAFF EMPLOYED: 220FTE+180 seasonal
REVENUE: $100m+
COMPANY HIGHLIGHTS: Acquired Todd Corporation vineyard holdings in Marlborough ‘16, 600ha of vines, 900ha of bare land suitable for further plantings, the brand Ara was sold to GiesenWines
INVIVO WINES NEW ZEALAND
Rob CameronManaging Director
DESCRIPTION: Wine makers; vineyards in Marlborough and Central Otago; produce Graham Norton wines
KEY PRODUCTS: Wine, low alcohol and calorie wine, spritzers
OWNERSHIP: NZ; Private (Lightbourne, Cameron,Dark, others)
COMPANY NUMBER: 1861924
ADDRESS: 55 Te Kauwhata Road, Te Kauwhata
PHONE: +64 9 630 6360
WEBSITE: www.invivowines.com
YEAR FORMED: 2006
STAFF EMPLOYED: 15-20
REVENUE: $5-10m*
COMPANY HIGHLIGHTS: Launched Graham Norton’s ‘16 Sauvignon Blanc and Shiraz, blending session in Ireland to create the wines; ‘15 vintage sold out in 2,000 stores in Ireland, UK, AU, NZ; acquired 1902 winery in Te Kauwhata in ‘16
JUICE PRODUCTS NZ LTD
Noboru SaekiChief Executive Officer
DESCRIPTION: Manufacturer of fruit and vegetable juices, concentrates, purees, blends; facility in Timaru; export to Asia, USA, AU; processes 70,000t, 70% of NZ carrot crop
KEY PRODUCTS: Carrot and fruit juice concentrate, fruit and vegetable purees, fruit and vegetable pulp
OWNERSHIP: Japan: Public (Sumitomo Corporation (TYO: 8053))
COMPANY NUMBER: 1207153
ADDRESS: 55 Sheffield Street, Washdyke, Timaru
PHONE: +64 3 687 4170
WEBSITE: www.jp-nz.com; www.sumitomocorp.co.jp
YEAR FORMED: 1993
STAFF EMPLOYED: 26 perm. 30 seasonal
REVENUE: $27m (FY16)
COMPANY HIGHLIGHTS: Acquired by Sumitomo Corp in ‘14; invested $1.5m on new aseptic production and puree extraction lines in ‘15; expanding laboratory facilities in ‘17
JUST WATER INTERNATIONAL
Tony FalkensteinChief Executive Officer
DESCRIPTION: Water coolers and water distribution to offices and homes; 3 bottling plants
KEY PRODUCTS: Water coolers, drinking water, filters
OWNERSHIP: NZ; Public (NZX:JWI) (The Harvard Group 68%, others)
COMPANY NUMBER: 368825
ADDRESS: 103 Hugo Johnston Drive, Penrose,Auckland
PHONE: +64 9 630 1300
WEBSITE: www.justwater.co.nz; www.jwi.co.nz
YEAR FORMED: 1989
STAFF EMPLOYED: 84 FTE 40 casual
REVENUE: $16m (FY16)
COMPANY HIGHLIGHTS: Sold Australian business, Just Water Australia to Waterlogic in ’15; acquired bottling plant for $3.3m in ‘16
88* Estimate; Source: various companies annual financial statements (NZ Companies Office or company website); various press releases and news articles; Coriolis analysis
KARMA COLA
Chris MorrisonCo-Founder
DESCRIPTION: Manufacturer of Fairtrade organic craft sodas; sale proceeds go back to Sierra Leone cola growers; supply into hospitality and cafes; Karma Cola Pty Ltd (AU); Karma Cola UK (UK/EU); exports to Singapore, Macau, Hong Kong, Japan and Taiwan
KEY PRODUCTS: Cola, lemonade, sparkling fruit flavoured waters; Karma Cola, Lemmy, Gingerella, All Good & Sparkling brands
OWNERSHIP: NZ; Private (Morrison, Coley, Stewart, others)
COMPANY NUMBER: 4458783
ADDRESS: 72 Williamson Avenue,Auckland
PHONE: +64 9 360 9691
WEBSITE: www.allgoodorganics.co.nz;www.karmacola.co.nz
YEAR FORMED: 2008
STAFF EMPLOYED: 20
REVENUE: $5-10m (‘16)
COMPANY HIGHLIGHTS: Global soft drink company selling fairtrade and organic carbonated beverages in New Zealand, Australia the UK & EU. Products manufactured in NZ & UK. Raised over US$100k for Karma Cola Foundation supporting cola nut growers in Sierra Leone.
LION
Rory GlassManaging Director – BSW NZ
DESCRIPTION: Lion is New Zealand’s largest alcoholic beverage company; also manufactures other beverages and dairy products
KEY PRODUCTS: Beer, wine, spirits, RTDs, cider, non alcoholic beverages, dairy
OWNERSHIP: Japan; Public (Kirin (TYO: 2503))
COMPANY NUMBER: 33986/ 1035696
ADDRESS: 27 Napier Street, Freemans Bay, Auckland
PHONE: +64 9 347 2000
WEBSITE: www.lionco.com; www.kirinholdings.co.jp
YEAR FORMED: 1860/1968/1977
STAFF EMPLOYED: 1,273
REVENUE: $561m Lion - BSW NZ (FY16)$29m Lion - Dairy and Drinks (FY16)
COMPANY HIGHLIGHTS: Acquired Morton Estate ($6.8m) Jan ‘15; acquired Upper Hutt brewery Panhead Custom Ales Jul ’16; Emerson’s moving to new $25m brewery, tap-room and restaurant to increase production to 8m litres/year in ‘17; increased focus on mid, low and non-alcoholic options
MCCASHIN’S BREWERY
Dean McCashinActing General Manager
DESCRIPTION: Beverages manufacturer based in Nelson; craft beer brewery, cider and non-alcoholic beverages; contract brewing and bottling; tours, restaurant and beer garden; contract brews for Moa Breweries; branch office in Taiwan, 4 staff; McCashin’s Distilling Co; oak barrel operations
KEY PRODUCTS: Beer, cider, water; Stoke, Rochdale, Palaeo brands
OWNERSHIP: NZ; Private (McCashin)
COMPANY NUMBER: 2223762
ADDRESS: 660 Main Road, Stoke, Nelson
PHONE: +64 3 547 5357
WEBSITE: www.mccashins.co.nz; www.rochdalecider.co.nz; www.stokebeer.co.nz
YEAR FORMED: 2009
STAFF EMPLOYED: 30
REVENUE: $10-15m (FY16)
COMPANY HIGHLIGHTS: McCashin’s Brewery Kitchen and Bar opened in ’15; launched premium brand Palaeo Water, 14,000-30,000 year old water source, in ’16; acquired Liquid Alchemy distilling business in Nov ’16, incorporated into McCashin’sDistilling Company, produces range of spirits incl. whiskey at brewery; acquired Nelson Cooperage, purchasing, reconditioning, selling oak barrels
MILLS REEF WINERY
Nick AleksichGeneral Manager
DESCRIPTION: Wine makers; winery and restaurant on 20 acres outside of Tauranga; five vineyards in Hawke’s Bay
KEY PRODUCTS: Wine
OWNERSHIP: NZ; Private (Preston)
COMPANY NUMBER: 17535
ADDRESS: 143 Moffat Road, Bethlehem, Tauranga
PHONE: +64 7 576 8800
WEBSITE: www.millsreef.co.nz
YEAR FORMED: 1989
STAFF EMPLOYED: 40 perm. 10 seasonal
REVENUE: $12-15m (FY16)
COMPANY HIGHLIGHTS:

89* Estimate; Source: various companies annual financial statements (NZ Companies Office or company website); various press releases and news articles; Coriolis analysis
MISSION ESTATE WINERY
Peter Holley Chief Executive Officer
DESCRIPTION: Wine makers; New Zealand’s first winery; entertainment, restaurant, accommodation, tourism, cellar door; vineyards in Hawke’s Bay and Marlborough
KEY PRODUCTS: Wine
OWNERSHIP: NZ; Private (Marist Holdings)
COMPANY NUMBER: 960152
ADDRESS: 198 Church Road, Greenmeadows, Napier
PHONE: +64 6 845 9350
WEBSITE: www.missionestate.co.nz
YEAR FORMED: 1851
STAFF EMPLOYED: 80 (inc. restaurant)
REVENUE: $10-15m (FY16)
COMPANY HIGHLIGHTS:
MOA BREWING COMPANY
Geoff RossChief Executive Officer
DESCRIPTION: NZ’s only listed craft beer brewer; based in Blenheim; exports to AU, Asia, Canada, USA; brewing in Blenheim and contract brewing at McCashins; planning stages for new brewery
KEY PRODUCTS: Craft beer, cider
OWNERSHIP: NZ; Public (NZX: MOA); (Pioneer Capital (PE) 25%, The Business Bakery 23%, Alan Scott Wines 7%, others)
COMPANY NUMBER: 1528394
ADDRESS: 258 Jacksons Road,Blenheim
PHONE: +64 3 572 5146
WEBSITE: www.moabeer.com
YEAR FORMED: 2003
STAFF EMPLOYED: 19
REVENUE: $8m (FY16)
COMPANY HIGHLIGHTS: 43% growth in volume sold in ’16, 2.5m litres; distribution agreement with ParrotDog Brewing for Moa to distribute in NZ; institutional placement share offer in ‘16 for PIE Funds Management to acquire 6.6% interest, $4m in total new equity
MOUNT RILEY WINES
John BuchananManaging Director
DESCRIPTION: Winery based in Blenheim; Mount Riley, Feather, Savee, Seventeen Valley brands; seven vineyards in Marlborough; export to Australia, Asia, Canada, UK; airlines and cruise lines
KEY PRODUCTS: Wine
OWNERSHIP: NZ; Private (Buchanan, Murphy)
COMPANY NUMBER: 869998
ADDRESS: 10 Malthouse Road, Riverlands, Marlborough
PHONE: +64 3 577 9900
WEBSITE: www.mountriley.co.nz
YEAR FORMED: 1997
STAFF EMPLOYED: 20
REVENUE: $15-20m*
COMPANY HIGHLIGHTS:
NEW ZEALAND QUALITY WATERS
Bruce ShermanGeneral Manager
DESCRIPTION: Producers and exporters of premium spring water based beverages; water source is Blue Spring in Putaruru plus artesian water; bottling plant at source: contract bottling service; offices in Australia, Thailand, Hong Kong
KEY PRODUCTS: Still, lightly flavoured spring water beverages; NZO Volcanic Spring Water, WAIZ brands
OWNERSHIP: Hong Kong; Private (NZO International 51%); Singapore; Private (Wee 49%)
COMPANY NUMBER: 1886777
ADDRESS: 83 Domain Road, Putaruru
PHONE: +64 7 883 8499
WEBSITE: www.nzqw.co.nz
YEAR FORMED: 2006
STAFF EMPLOYED: 21
REVENUE: $6-8m (FY16)
COMPANY HIGHLIGHTS: Brand refresh and new packaging in ’16; planned expansion of exports to Australia and Singapore; website updated in ’17; currently undergoing significant plant re-organisation with expected complete Jun ‘17
90* Estimate; Source: various companies annual financial statements (NZ Companies Office or company website); various press releases and news articles; Coriolis analysis
PEGASUS BAY LIMITED
Paul DonaldsonGeneral Manager
DESCRIPTION: Winery and restaurant in WaiparaValley, Canterbury; Pegasus Bay, Main Divide brands
KEY PRODUCTS: Wine
OWNERSHIP: NZ; Private (Donaldson)
COMPANY NUMBER: 977770
ADDRESS: Stockgrove Road, Waipara,Amberley
PHONE: +64 3 314 6869
WEBSITE: www.pegasusbay.com
YEAR FORMED: 1985
STAFF EMPLOYED: 70
REVENUE: $12-15m*
COMPANY HIGHLIGHTS:
PERNOD RICARD WINEMAKERS-NZ
Jo-Anna PartridgeOperations Director
DESCRIPTION: Grower and maker of wines; Church Road, Deutz, Brancott Estate, Stoneleigh; BrancottEstate is #1 wine brand in NZ; NZ operations divided into NZ sales & marketing of global portfolio of wine & spirits, and winemaking operation; overarching Management Committee based in AU
KEY PRODUCTS: Wine, sparkling wine
OWNERSHIP: France; Public (Pernod Ricard SA (Euronext:RI)) via Millstream Finance Ltd
COMPANY NUMBER: 86020
ADDRESS: 4 Graham Street, Auckland
PHONE: +64 9 336 8300
WEBSITE: www.pernod-ricard-winemakers.com
YEAR FORMED: 1961
STAFF EMPLOYED: 430
REVENUE: $241m (FY16) (Pernod Ricard Winemakers NZ)
COMPANY HIGHLIGHTS: 2.2m cases of BrancottEstate sold worldwide in ‘16; # 1 NZ Sauvignon Blanc in the UK by volume
SACRED HILL VINEYARDS
David MasonManaging Director
DESCRIPTION: Five wine brands: Sacred Hill, Gunn Estate, Ti Point, Wild South, White Cliff; 50% interest in Gimblett Gravels Vineyard Ltd
KEY PRODUCTS: Wine
OWNERSHIP: NZ; Private (Mason family 65%); HK; Private (Jebsen Beverage Co 30%)
COMPANY NUMBER: 961615
ADDRESS: 1472 Omahu Road, RD5, Hastings
PHONE: +64 6 879 8760
WEBSITE: www.sacredhill.com; www.jebsen.com;www.quenchcollective.co.nz
YEAR FORMED: 1986
STAFF EMPLOYED: 35
REVENUE: $43m (FY16)
COMPANY HIGHLIGHTS: Focus on exporting to USA in ’16; rebranded Sacred Hill Wine Company, set up in ‘12 to manage domestic sales and distribution of portfolio of wine, beer and cider, to Quench Collective in ’16; launched two new Marlborough wines in ‘16, high demand in US
SAINT CLAIR ESTATES WINES
Neal IbbotsonManaging Director
DESCRIPTION: Wine maker based in Marlborough; 6 vineyards throughout Marlborough; Saint ClairReserve, Pioneer Block, Premium, Vicars Choice brands; restaurant and cellar door; exports to ~70 world markets
KEY PRODUCTS: Wine
OWNERSHIP: NZ; Private (Ibbotson)
COMPANY NUMBER: 1017340
ADDRESS: 30-32 Liverpool Street, Riverlands Estate, Blenheim
PHONE: +64 3 578 8695
WEBSITE: www.saintclair.co.nz
YEAR FORMED: 1994
STAFF EMPLOYED: 60
REVENUE: $45-$55m (FY14)
COMPANY HIGHLIGHTS: NZ Producer of the Year in ‘16 highlighting a run of success in international wine shows in recent years; purchased Lake Chalice vineyard and brand in ’16; 5 gold awards at the Royal Easter Show Wine Awards in ‘17
91* Estimate; Source: various companies annual financial statements (NZ Companies Office or company website); various press releases and news articles; Coriolis analysis
SEIFRIED ESTATE
Hermann SeifriedDirector
DESCRIPTION: Winery and restaurant; Aotea, Old Coach Road, Rabbit Island, Seifried, Winemakers Collection brands; 250ha across 9 vineyards; exports 65% to over 20 countries
KEY PRODUCTS: Wine
OWNERSHIP: NZ; Private (Seifried)
COMPANY NUMBER: 918475
ADDRESS: 184 Redwood Road, Appleby,Nelson
PHONE: +64 3 544 5599
WEBSITE: www.seifried.co.nz
YEAR FORMED: 1973
STAFF EMPLOYED: 50 perm. 20 seasonal
REVENUE: $20-30m*
COMPANY HIGHLIGHTS:
SILENI ESTATES LIMITED
Nigel AveryChief Executive Officer
DESCRIPTION: Wine producer and exporter; based in Hawkes Bay with vineyards in Marlborough; 800ha, 250ha of contract grape growers; produces 760,000 cases, one of the fastest growing wineries in NZ; in top 10 by production volume; exports to over 80 markets
KEY PRODUCTS: Wine
OWNERSHIP: NZ; Private (Avery, Porter, Puvera Pty (AU) 6%, Edmonds)
COMPANY NUMBER: 882582
ADDRESS: 2016 Maraekakaho Road, Hastings
PHONE: +64 6 879 8768
WEBSITE: www.sileni.co.nz
YEAR FORMED: 1997
STAFF EMPLOYED: 40
REVENUE: $50-60m (FY16)
COMPANY HIGHLIGHTS:
SOLJANS ESTATE WINERY
Tony SoljanManaging Director
DESCRIPTION: Winery, café and functions; based in Auckland; exports to Canada, China, Japan, Pacific, Poland, USA, Malaysia, Taiwan
KEY PRODUCTS: Wine
OWNERSHIP: NZ; Private (Soljan)
COMPANY NUMBER: 658205
ADDRESS: 366 State Highway 16, Kumeu, Auckland
PHONE: +64 9 412 5858
WEBSITE: www.soljans.co.nz
YEAR FORMED: 1937
STAFF EMPLOYED: 50
REVENUE: $10m (FY16)
COMPANY HIGHLIGHTS:
THE BETTER DRINK CO LTD
George GordonGeneral Manager
DESCRIPTION: Manufacturer, marketer and distributor of beverages; Charlies, Phoenix, Juicy Lucy, Ti Tonics, Real Iced Tea, Stash Tea brands; production sites in NZ and AU; distribution rights for Sunkist products in NZ, Pacific Islands; exports to over 12 countries
KEY PRODUCTS: Juice, iced tea, soft drinks, tea
OWNERSHIP: Japan; Private (Asahi Group) via Asahi Holdings (AU)
COMPANY NUMBER: 969423
ADDRESS: Suite 101, 1 Cleveland Road, Parnell, Auckland
PHONE: +64 9 837 6740
WEBSITE: www.betterdrinks.co.nz;www.asahi.com.au; www.phoenixorganics.co.nz
YEAR FORMED: 1999
STAFF EMPLOYED: 100
REVENUE: $31m (FY15)
COMPANY HIGHLIGHTS: “Alliance” with Ti Tonics giving exclusive distribution rights announced in ‘15; CEO left in May ‘16

92* Estimate; Source: various companies annual financial statements (NZ Companies Office or company website); various press releases and news articles; Coriolis analysis
THE HOMEGROWN JUICE COMPANY
Stephen BrownlieDirector
DESCRIPTION: Manufacturer of raw cold pasteurised (HPP) juices; largest plantings of orange orchards in NZ, located in Gisborne and Hawkes Bay; retail and food service; Homegrownand Grove brands
KEY PRODUCTS: Orange, apple, grapefruit, lemon, lime, apple and kale juices, fruit and vegetable blend juices, berry, fruit, feijoa and apple smoothies
OWNERSHIP: NZ; Private (Brownlie)
COMPANY NUMBER: 4387684
ADDRESS: 407 Williams Street, Mahora, Hastings
PHONE: +64 6 878 8140
WEBSITE: www.homegrownjuice.co.nz
YEAR FORMED: 2013
STAFF EMPLOYED: N/A
REVENUE: $20-30m*
COMPANY HIGHLIGHTS:
THE WINE PORTFOLIO
John Coney Owner
DESCRIPTION: Winery operations; 5 vineyards in Hawkes Bay and 1 in Marlborough; 13 brands, Cathedral Cove, Mill Road, Nikau Point, Southern Cross, Penny Lane, Mimi, Southern Dawn, Leveret Estate, Falconhead, Coniglio, IQ, The Regent, Mansfield & Mars; exports to China, UK, AU
KEY PRODUCTS: Wine
OWNERSHIP: Canada; Private (Coney)
COMPANY NUMBER: 668538
ADDRESS: 2389 State Highway 2, Katikati
PHONE: +64 7 552 0795
WEBSITE: www.wineportfolio.co.nz
YEAR FORMED: 1995
STAFF EMPLOYED: 50 perm. 30 seasonal
REVENUE: $30-40m (‘16)
COMPANY HIGHLIGHTS: Sold Morton Estate brand and Marlborough vineyard to Lion for $6,775m in ’15; developed two new brands, Leveret and Falconhead in ‘14
TREASURY WINE ESTATES (MATUA) LTD
Angus McPhersonManaging Director – AU & NZ
DESCRIPTION: Wine maker and grower; Matua, Secret Stone, Angel Cove, Squealing Pig brands; 8 vineyards, 339ha planted; 1 winery; 85% of grapes sourced through grower contracts
KEY PRODUCTS: Wine
OWNERSHIP: AU; Public (ASX:TWE); (JP Morgan Nominees AU 28%, HSBC Custody Nominees 27%)
COMPANY NUMBER: 266340
ADDRESS: 130 St Georges Road, Parnell, Auckland
PHONE: +64 9 354 5250
WEBSITE: www.tweglobal.com; www.matua.co.nz
YEAR FORMED: 1969/1985
STAFF EMPLOYED: 150
REVENUE: $249m (FY16)
COMPANY HIGHLIGHTS: Closed Auckland winery and moved all production to expanded Marlborough facility, loss of 50 jobs in Mar ’16; closed Matua packaging plant and cellar door in Waimauku; sold Matua Auckland Winery to Sutton Group Holdings in July ’16, $4.3m
VILLA MARIA ESTATE LTD
Sir George FistonichFounder & Owner
DESCRIPTION: Wine maker and grower; Villa Maria, Vidal Estate, Thornbury, Esk Valley, Te Awa Single Estate, Left Field, Kidnapper Cliffs; exports to over 60 countries; Vineyard Plants Nursery
KEY PRODUCTS: Wine
OWNERSHIP: NZ; Private (Fistonich)
COMPANY NUMBER: 291073
ADDRESS: 118 Montgomerie Road, Mangere, Auckland
PHONE: +64 9 255 0660
WEBSITE: www.villamaria.co.nz; www.vidal.co.nzwww.teawacollection.com; www.eskvalley.co.nz
YEAR FORMED: 1961
STAFF EMPLOYED: 300
REVENUE: $160-180m*
COMPANY HIGHLIGHTS: Acquired 41ha of neighbour Pask Winery in Gimblett Gravels in ‘14; Villa Maria’s Sauvignon Blanc on North America Starbucks’ evening menu since April ’15; launched icon wine, Cabernet Sauvignon, RRP $150 in ’16; launch of lighter rose, winner of NZ Food Awards, Beverages category in ’16; part of MPI PGP programme; NZ Winery of Year ’16; highly awarded

93* Estimate; Source: various companies annual financial statements (NZ Companies Office or company website); various press releases and news articles; Coriolis analysis
WAIWERA WATER LIMITED
Avi JayapuramGeneral Manager
DESCRIPTION: Bottled water producer and distributor; exports to over 10 countries; co-owned Waiwera Organic Winery spirit maker, WaiweraThermal Resort; exports to United Arab Emirates, USA
KEY PRODUCTS: Bottled still and sparkling water; glass and PET
OWNERSHIP: NZ; Private (Khimich 80%); USA; (Ordover Trust 20%)
COMPANY NUMBER: 3401174
ADDRESS: 21 Waiwera Road, Waiwera, Auckland
PHONE: +64 9 448 2483
WEBSITE: www.waiwera.com; www.waiwera.me
YEAR FORMED: 1875
STAFF EMPLOYED: 23
REVENUE: $5-10m*
COMPANY HIGHLIGHTS:
WINEWORKS LIMITED
Tim Nowell-UstickeManaging Director
DESCRIPTION: Wine bottling, warehousing, transport, distribution service provider; 9 bottling lines at sites in Marlborough, Hawke’s Bay, Auckland; 60,000 cases/day capacity; 60m bottles in warehouses; bottles 40% of NZ’s wine
KEY PRODUCTS: Bulk wine transport, laboratory services, bottling, packaging, warehousing and distribution, certification, freight
OWNERSHIP: NZ; Private (Nowell-Usticke 60%, Vintage Investments 40%)
COMPANY NUMBER: 3324832
ADDRESS: 26 Liverpool Street, Riverlands,Blenheim
PHONE: +64 3 577 8166
WEBSITE: www.wineworks.co.nz
YEAR FORMED: 1995
STAFF EMPLOYED: 368
REVENUE: N/A
COMPANY HIGHLIGHTS: Opened multi-million dollar facility in Onehunga, Auckland in ‘16
YEALANDS WINE GROUP
Adrian Garforth MWChief Executive Officer
DESCRIPTION: Vineyard and wine maker; vineyard holdings in Marlborough and Hawke’s Bay; YealandFamily Wines, Crossroads, The Crossing, Babydoll, Southbank Estate, Silver Fern Wines, Flaxbourne, Clearwater Cove brands
KEY PRODUCTS: Wine
OWNERSHIP: NZ; Private (Marlborough Lines Ltd 85%, Yealand 15%)
COMPANY NUMBER: 5737427
ADDRESS: 139 Quay Street, Princes Wharf, Auckland
PHONE: +64 9 920 2880
WEBSITE: www.yealandswinegroup.co.nz
YEAR FORMED: 2006
STAFF EMPLOYED: 180
REVENUE: $100m (FY14)
COMPANY HIGHLIGHTS: Peter Yealand sold 80% of business to Marlborough Lines Company July ’15 for $89m; acquired 261ha Straight Views farm for $4.35m in ‘16, plans to convert to 70ha vineyard with first grapes by ‘20; Hawke’s Bay Crossroads vineyard and winery put on market in ’16; new CEO in ‘17

Appendices
+ Industry bodies
+ Trade codes
+ Glossary of terms
06

INDUSTRY ORGANISATIONSNew Zealand has a broad range of organisations which support the alcoholic and non-alcoholic beverage industries
95
- Represent 850 growers and 700 wineries
- Funded through: a levy on the sale of grapes collected by the Grape Growers Council under the Commodity Levies Act 1991
- Levy on the sale of wine collected by the Wine Institute under the Wine Act 2003
- www.nzwine.com
- Represent producers and marketers of beverages, juices, water and non-alcoholic beverages
- www.nzbc.nz
- Represents brewing industry in New Zealand
- Over 163 brewers
- Funded via members fees
- www.brewersguild.org.nz
- Representing the major brewing producers in Australia and New Zealand
- Four major brewers in NZ and AU; Carlton, Coopers, DB, Lion (95% market)
- www.brewers.org.au
- Represent leading producers, distributors, brand owners, importers and exporters of premium spirits and liqueurs (98% of industry)
- www.spiritsnz.org.nz
- Represents the manufacturers and suppliers behind New Zealand's food, beverage and grocery brands
- www.fgc.org.nz

TRADE CODES
HHSS CCooddee
SShhoorrtt DDeessccrriippttiioonn LLoonnggeerr ooffffiicciiaall ddeessccrriippttiioonn
200911 Frozen orange juice Frozen orange juice, unfermented, not containing spirit200912 Orange juice not-frozen unsweet Orange juice, not frozen, of a Brix value not >20, unfermented & not cont. added spirit, whether or not cont. added sugar/oth. sweetening matter200919 Orange juice not-frozen sweet Unfrozen orange juice, unfermented, not containing added spirit200921 Grapefruit juice Grapefruit juice, of a Brix value not >20, unfermented & not cont. added spirit, whether or not cont. added sugar/oth. sweetening matter200929 Grapefruit juice Grapefruit juice (excl. of 2009.21), unfermented & not cont. added spirit, whether or not cont. added sugar/oth. sweetening matter200931 Other citrus Juice of any single citrus fruit other than orange/grapefruit, of a Brix value not >20, unfermented & not cont. added spirit, whether or not cont. added sugar/oth. sweetener 200939 Other citrus Juice of any single citrus fruit other than orange/grapefruit (excl. of 2009.31), unfermented & not cont. added spirit, whether or not cont. added sugar/oth. sweetener200941 Pineapple juice Pineapple juice, of a Brix value not >20, unfermented & not cont. added spirit, whether or not cont. added sugar/oth. sweetening matter200949 Pineapple juice Pineapple juice (excl. of 2009.41), unfermented & not cont. added spirit, whether or not cont. added sugar/oth. sweetening matter200950 Tomato juice Tomato juice, unfermented, not containing added spirit200961 Grape juice Grape juice, incl. grape must, of a Brix value not >30, unfermented & not cont. added spirit, whether or not cont. added sugar/oth. sweetening matter200969 Grape juice Grape juice, incl. grape must (excl. of 2009.61), unfermented & not cont. added spirit, whether or not cont. added sugar/oth. sweetening matter200971 Apple juice, unsweetened Apple juice, of a Brix value not >20, unfermented & not cont. added spirit, whether or not cont. added sugar/oth. sweetening matter200979 Apple juice Apple juice (excl. of 2009.71), unfermented & not cont. added spirit, whether or not cont. added sugar/oth. sweetening matter200980 Kiwifruit juice; other fruit juices Juice of other single fruit, unfermented, not containing added spirit200990 Mixed juice Mixtures of juices, unfermented, not containing added spirit
220110 Mineral water Mineral waters and aerated waters, unsweetened220190 Other water, unsweetened Other unsweetened waters; ice and snow220210 Soft drinks Waters (incl. mineral and aerated), with added sugar220290 Other flavoured beverages Other non-alcoholic beverages, nes220300 Beer Beer made from malt220410 Sparkling wine Champagne and sparkling wine220421 Wine, bottle Wine (not sparkling); grape must with by alcohol holding 2L or less220429 Wine, bulk Wine (not sparkling); grape must with alcohol holding <10L220430 Grape must Other grape must, nes220510 Vermouth Vermouth and other wine of fresh grapes, flavours220590 Vermouth Vermouth and other wine of fresh grapes, flavours220600 Cider; other fermented Other fermented beverages (for example, cider)220710 Ethyl alcohol 80% Undenatured ethyl alcohol, of alcoholic strength of 80%220720 Ethyl alcohol any strength Ethyl alcohol and other denatured spirits of any strength220820 Distilled grape wine Spirits from distilled grape wine or marc220830 Whiskeys Whiskeys220840 Rum Rum and tafia220850 Gin Gin and Geneva220860 Vodka Vodka220870 Liqueurs Liqueurs and cordials220890 Other spirits Other spirituous beverages, nes220900 Vinegar Vinegar and substitutes for vinegar
GLOBAL HARMONISED SYSTEM (HS) TRADE CODES DEFINED AS BEVERAGESHS2002
96
GLOSSARY OF TERMS
97
A$/AUD Australian dollar n/a Not available/not applicable
ABS Absolute change NA/ME/CA North Africa / Middle East / Central Asia
ANZSIC AU/NZ Standard Industry Classification N. America North America (USA, Canada)
AU Australia Nec/nes Not elsewhere classified/not elsewhere specified
Australasia Australia and New Zealand N/C Not calculable
b Billion N.H Northern Hemisphere
CAGR Compound Annual Growth Rate NZ New Zealand
CN China NZ$/NZD New Zealand dollar
C/S America Central & South America (Latin America) R&D Research and Development
CRI Crown Research Institute S Asia South Asia (Indian Subcontinent)
CY Calendar year (ending Dec 21) SE Asia South East Asia
E Asia East Asia S.H Southern Hemisphere
EBITDA Earnings before interest, tax, depreciation and amortization SS Africa Sub-Saharan Africa
FAO Food and Agriculture Organisation of the United Nations T/O Turnover
FOB Free on Board UHT Ultra-high temperature
FY Financial year (of firm in question) US/USA United States of America
GBP British pounds US$/USD United States dollar
HK Hong Kong UK United Kingdom
IQF Individually quick frozen YE Year ending
JV Joint venture YTD Year to date
m Million

AUSTRALIACoriolis Australia Pty Ltd
PO Box 5831St Georges Terrace
Perth, WA 6831Australia
+61 8 9468 4691
NEW ZEALANDCoriolis (New Zealand) Limited
PO Box 90-509Victoria Street West
Auckland, 1142New Zealand
+64 9 623 1848
www.coriolisresearch.com
Coriolis is the leading Australasian management consulting firm specialising in the wider food value chain. We work on projects in agriculture, food and beverages, consumer packaged goods, retailing & foodservice. In other words, things you put in your mouth and places that sell them.
WHERE WE WORK
We focus on the Asia Pacific region, but look at problems with a global point-of-view. We have strong understanding of, and experience in, markets and systems in Australia, China, Japan, Malaysia, New Zealand, Singapore, South Korea, Thailand, the United Kingdom and the U.S.
WHAT WE DO
We help our clients assemble the facts needed to guide their big decisions. We develop practical, fact-based insights grounded in the real world that guide our clients decisions and actions. We make practical recommendations. We work with clients to make change happen. We assume leadership positions to implement change as necessary.
HOW WE DO IT
All of our team have worked across one-or-more parts of the wider food value chain, from farm-to-plate. As a result, our work is grounded in the real world. Our style is practical and down-to-earth. We try to put ourselves in our clients’ shoes and focus on actions. We listen hard, but we are suspicious of the consensus. We provide an external, objective perspective.
WHO WE WORK WITH
We only work with a select group of clients we trust. We build long term relationships with our clients and more than 80% of our work comes from existing clients. Our clients trust our experience, advice and integrity.
Coriolis advises clients on growth strategy, mergers and acquisitions, operational improvement and organisational change. Typical assignments for clients include…
FIRM STRATEGY & OPERATIONS
We help clients develop their own strategy for growing sales and profits. We have a strong bias towards growth driven by new products, new channels and new markets.
MARKET ENTRY
We help clients identify which countries are the most attractive –from a consumer, competition and channel point-of-view. Following this we assist in market entry planning & growth.
VALUE CREATION
We help clients create value through revenue growth and cost reduction.
TARGET IDENTIFICATION
We help clients identify high potential acquisition targets by profiling industries, screening companies and devising a plan to approach targets.
DUE DILIGENCE
We help organisations make better decisions by performing consumer and market-focused due diligence and assessing performance improvement opportunities.
EXPERT WITNESS
We provide expert witness support to clients in legal cases and insurance claims. We assist with applications under competition/fair trade laws and regulations.
98