Investors’ Day – Reserves workshop0c5e405b-8a4b-467f-a4d8-6f78d686f8... · Investors’ Day...
23
Investors’ Day – Reserves workshop Zurich, 4 April 2018 Philip Long, Group Chief Actuary Edmond Kartun, Head Actuarial Control P&C Sameet Shah, Head Actuarial Control L&H
Transcript of Investors’ Day – Reserves workshop0c5e405b-8a4b-467f-a4d8-6f78d686f8... · Investors’ Day...

Investors’ Day – Reserves workshop Zurich, 4 April 2018Philip Long, Group Chief ActuaryEdmond Kartun, Head Actuarial Control P&CSameet Shah, Head Actuarial Control L&H

Reserves workshop – Investors' Day | Zurich, 4 April 2018
• Based on all latest, relevant information
• Enable a consistent, global view across the Group
• Ensure we understand the uncertainties and risks to the reserves
Swiss Re’s reserving approach ensures transparent assessment of insurance liabilities
2
• Not to build buffers or under-reserve
• Not to manage results, or perform “step-reserving”
• Not to manage capital or create an effective statutory “equalisation reserve” where not required
Principles for Reserving US GAAP
• P&C: Best estimate, but with no discounting of expected future cashflows
• L&H: Primarily rules-based, with many product lines “locked-in” at inception
EVM
• Principles-based, best estimate reserves with discounting of expected future cashflows
• Market-consistent

Reserves workshop – Investors' Day | Zurich, 4 April 2018
Robust process and governance for appropriate reserve setting
3
Business Unit Regional Reserving Actuaries
First line of defence
Regional Reserving Committees (RRCs)
Group Reserving Committee
Second line of defence
Actuarial Control
• Propose assumptions and methodology
• US GAAP, EVM and statutory bases
• Feedback loop to pricing and claims management
• Local control process and peer reviews • RRC oversight
• Approve regional assumptions and reserves
• Independent quarterly reserve and assumptions review
• Deep-dive reviews
• Range and duration analysis
Reserves workshop – Investors' Day | Zurich, 4 April 2018
Swiss Re’s P&C initial loss reserving is gradually updated based on actual loss experience
4
Ult
ima
te L
oss
Time from start of treaty year
Claims paid
Favourable development from outset
Inception
Case estimates
IBNR
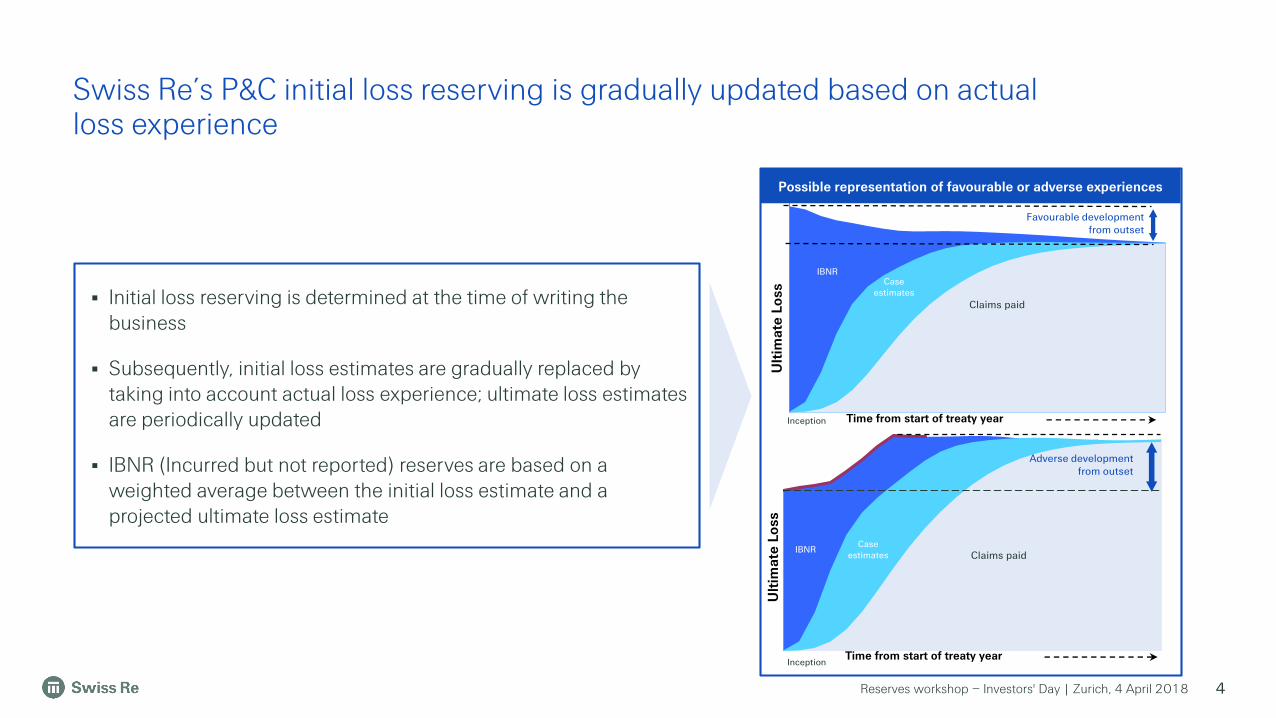
Initial loss reserving is determined at the time of writing the business
Subsequently, initial loss estimates are gradually replaced by taking into account actual loss experience; ultimate loss estimates are periodically updated
IBNR (Incurred but not reported) reserves are based on a weighted average between the initial loss estimate and a projected ultimate loss estimate
Ult
ima
te L
oss
Time from start of treaty year
Case estimates
IBNRClaims paid
Adverse development from outset
Inception
Possible representation of favourable or adverse experiences

Reserves workshop – Investors' Day | Zurich, 4 April 2018
P&C reserving approach depends on the type of claims
5
For large events which are sudden and unexpected, a separate process combines the knowledge of all relevant areas of expertise in estimating the initial ultimate loss
Reserving for asbestos and environmental claims is based on industry benchmarks which are reassessed annually
Reserving for claims subject to periodic payments depending on survival, such as motor liability, is performed separately and depends on the level of information provided by our cedents
Reserving for non-traditional business, such as retroactive deals or multi-year deals, is carried out on a deal-by-deal basis according to each deal's specifications
Loss development triangles for homogeneous portfolios are used for reserving traditional reinsurance and direct insurance claims. Standard actuarial techniques such as the Chain Ladder or the Benktander methods are applied using past claims experience
Benktander
Bornhuetter-Ferguson (B-F)
Today
Chain Ladder
Expected Loss Ratio
TimeInception
Expected loss

Reserves workshop – Investors' Day | Zurich, 4 April 2018
Reserves were released over the last few years
All major lines of business contributed to reserve releases
Strength in reserves remained strong and even increased between 2011 and 2017
Swiss Re’s P&C reserving strength is demonstrated by being in the upper half of a range of best estimates
6
Possible distribution of P&C reserves Illustrative
0
200
400
600
800
2011 2012 2013 2014 2015 2016 2017
Property Casualty Specialty
P&C reserve releases in USD m
Swiss Re’s reserving strength is independently assessed every quarter by the Actuarial Control team
Booked reserves are positioned on a range of best estimates –for more than 15 years, Swiss Re’s P&C reserves have been between the 60th and 80th percentile
Swiss Re does not target a specific percentile in the range
mid-point60th percentile
80th percentile
Best estimate range
Mid-point
1 477 9411 735 1 374 8001 394838Total:

Reserves workshop – Investors' Day | Zurich, 4 April 2018
Considerations when analysing P&C claims development triangles
7
Reasons for potential pitfalls Implications
Segmentation of claims into triangles
Changes in cedent reporting practices, changes to internal claims processes or one-off diagonal effect such as changes to discount rate for bodily injury claims
Atypical or unusual large losses
Market specific practices; in some countries, cedents often overestimate the initial case reserves
Large number of triangles might contribute to acertain degree of conservatism
Workers’ comp and liability triangles for 2016 and2017 show higher reported claims because of achange in cedent practice. Motor triangles are alsoimpacted by one-off diagonal effects
Risk of mis-projection
Motor triangles need to be analysed by country toadequately assess trend (not possible based onaggregated information); negative IBNR in accidentyear triangles for proportional business
VS.

Reserves workshop – Investors' Day | Zurich, 4 April 2018
Property Reinsurance – 2017 loss ratio impacted by natural catastrophes
8
• Ultimate loss ratio 2016 includes natural catastrophe events in 2017 impacting business written in 2016 (e.g. Cyclone Debbie)
• High ultimate loss ratio for 2017 includes impact of 2017 hurricanes (Harvey, Irma, Maria), Californian Wildfires and Mexican earthquakes
Treaty
Year
Ult Loss
Ratio
Paid
Losses
Case
ReservesIBNR
2002 57% 57% 0% 0%
2003 46% 46% 0% 0%
2004 74% 74% 0% 0%
2005 122% 122% 0% 0%
2006 41% 40% 0% 0%
2007 53% 52% 1% 0%
2008 54% 53% 1% 0%
2009 66% 65% 1% 0%
2010 102% 98% 2% 1%
2011 73% 71% 1% 0%
2012 55% 53% 2% 0%
2013 51% 49% 2% 0%
2014 48% 43% 4% 0%
2015 58% 44% 11% 3%
2016 73% 33% 23% 17%
2017 126% 13% 38% 76%
2006
20072008
2009
2010
2011
2012201320142015
2016
2017
0%
20%
40%
60%
80%
100%
120%
140%
0 12 24 36 48 60 72 84 96 108 120 132 144
Development Months
0
1'000
2'000
3'000
4'000
5'000
6'000
7'000
0%
20%
40%
60%
80%
100%
120%
140%
2002 2003 2004 2005 2006 2007 2008 2009 2010 2011 2012 2013 2014 2015 2016 2017
USD mPaid, incurred and ultimate loss ratio - Left Hand Scale Earned and written premium - Right Hand Scale
Paid Losses Case Reserves IBNR
UWY
Year
Earned
Premium in
USDm
12 24 36 48 60 72 84 96 108 120 132 144 156 168 180 192
2002 3'880 27% 57% 59% 58% 58% 58% 58% 57% 58% 57% 57% 57% 57% 57% 57% 57%
2003 3'889 23% 39% 47% 48% 47% 47% 47% 47% 46% 46% 46% 46% 46% 46% 46%
2004 3'983 32% 66% 75% 74% 75% 75% 75% 74% 74% 74% 74% 74% 74% 74%
2005 4'070 45% 116% 125% 124% 124% 123% 123% 122% 122% 122% 122% 122% 122%
2006 3'772 10% 37% 42% 42% 41% 41% 41% 41% 41% 41% 41% 41%
2007 3'920 18% 50% 53% 53% 54% 53% 53% 53% 53% 53% 53%
2008 4'038 21% 50% 55% 55% 55% 54% 55% 55% 55% 54%
2009 4'216 24% 63% 66% 66% 66% 66% 66% 67% 66%
2010 4'028 20% 75% 90% 90% 95% 98% 100% 101%
2011 4'954 30% 63% 68% 70% 73% 73% 73%
2012 6'367 15% 48% 54% 55% 55% 55%
2013 5'561 17% 47% 51% 51% 51%
2014 5'055 11% 40% 47% 47%
2015 5'274 12% 45% 55%
2016 5'419 18% 56%
2017 3'608 50%
Reported Loss Ratios per Development MonthTreaty
Year
Earned
Premium
in USDm
12 24 36 48 60 72 84 96 108 120 132 144 156 168 180 192
2002 1'506 16% 57% 70% 69% 71% 76% 77% 75% 77% 79% 80% 81% 83% 82% 83% 83%
2003 1'289 16% 43% 59% 63% 64% 65% 69% 68% 68% 69% 69% 71% 72% 72% 73%
2004 982 24% 51% 59% 63% 63% 63% 66% 66% 66% 67% 68% 69% 69% 70%
2005 1'095 19% 51% 60% 63% 65% 67% 68% 69% 70% 71% 72% 72% 72%
2006 894 17% 56% 67% 67% 69% 71% 72% 73% 75% 76% 78% 79%
2007 953 7% 37% 44% 47% 51% 55% 58% 63% 67% 72% 77%
2008 518 9% 53% 63% 65% 67% 68% 70% 70% 72% 72%
2009 470 10% 50% 61% 66% 68% 69% 70% 71% 71%
2010 336 11% 51% 61% 63% 64% 67% 68% 69%
2011 341 17% 58% 67% 68% 71% 71% 71%
2012 742 19% 61% 74% 77% 79% 79%
2013 458 15% 55% 69% 74% 75%
2014 661 11% 47% 65% 73%
2015 450 11% 52% 66%
2016 1'036 21% 77%
2017 544 39%
Reported Loss Ratios per Development Month Reported losses as % of earned premiums - Latest 12 years

Reserves workshop – Investors' Day | Zurich, 4 April 2018
Treaty
Year
Earned
Premium
in USDm
12 24 36 48 60 72 84 96 108 120 132 144 156 168 180 192
2002 1'506 16% 57% 70% 69% 71% 76% 77% 75% 77% 79% 80% 81% 83% 82% 83% 83%
2003 1'289 16% 43% 59% 63% 64% 65% 69% 68% 68% 69% 69% 71% 72% 72% 73%
2004 982 24% 51% 59% 63% 63% 63% 66% 66% 66% 67% 68% 69% 69% 70%
2005 1'095 19% 51% 60% 63% 65% 67% 68% 69% 70% 71% 72% 72% 72%
2006 894 17% 56% 67% 67% 69% 71% 72% 73% 75% 76% 78% 79%
2007 953 7% 37% 44% 47% 51% 55% 58% 63% 67% 72% 77%
2008 518 9% 53% 63% 65% 67% 68% 70% 70% 72% 72%
2009 470 10% 50% 61% 66% 68% 69% 70% 71% 71%
2010 336 11% 51% 61% 63% 64% 67% 68% 69%
2011 341 17% 58% 67% 68% 71% 71% 71%
2012 742 19% 61% 74% 77% 79% 79%
2013 458 15% 55% 69% 74% 75%
2014 661 11% 47% 65% 73%
2015 450 11% 52% 66%
2016 1'036 21% 77%
2017 544 39%
Reported Loss Ratios per Development Month
Accident & Health – distorted due to changes in cedent reporting
9
2006
2007
200820092010
20112012
2013201420152016
2017
0%
20%
40%
60%
80%
100%
120%
0 12 24 36 48 60 72 84 96 108 120 132 144
Development Months
Reported losses as % of earned premiums - Latest 12 years
0
300
600
900
1'200
1'500
1'800
0%
20%
40%
60%
80%
100%
120%
2002 2003 2004 2005 2006 2007 2008 2009 2010 2011 2012 2013 2014 2015 2016 2017
USD mPaid, incurred and ultimate loss ratio - Left Hand Scale Earned and written premium - Right Hand Scale
Paid Losses Case Reserves IBNR
Ult Loss
Ratio
Paid
Losses
Case
ReservesIBNR
94% 73% 10% 11%
81% 66% 7% 9%
80% 61% 8% 10%
82% 64% 8% 10%
85% 64% 14% 6%
91% 66% 11% 14%
81% 66% 7% 9%
79% 65% 6% 8%
78% 62% 7% 10%
84% 63% 8% 13%
86% 74% 6% 7%
89% 64% 12% 13%
90% 55% 18% 17%
88% 48% 18% 23%
96% 34% 43% 19%
87% 15% 24% 49%
• 2016 and 2017 show larger than usual reported losses as these years include “cedent” IBNR
• 2007 underwriting year should be ignored when projecting to Ultimate because it contains a high share of business that is fully retroceded

Reserves workshop – Investors' Day | Zurich, 4 April 2018
Liability proportional – reflects recent growth
10
Treaty
Year
Earned
Premium in
USDm
12 24 36 48 60 72 84 96 108 120 132 144 156 168 180 192
2002 1'204 12% 28% 42% 55% 65% 73% 78% 80% 80% 80% 82% 81% 82% 82% 82% 83%
2003 1'082 13% 27% 33% 42% 51% 55% 56% 56% 57% 58% 58% 59% 59% 60% 61%
2004 1'075 10% 26% 34% 43% 52% 57% 61% 63% 65% 65% 65% 66% 67% 70%
2005 1'135 2% 25% 34% 41% 52% 55% 57% 59% 61% 61% 62% 63% 65%
2006 988 4% 28% 37% 52% 57% 63% 65% 66% 69% 70% 71% 72%
2007 911 7% 28% 41% 52% 57% 66% 66% 70% 74% 77% 78%
2008 686 6% 38% 58% 66% 72% 79% 89% 88% 93% 94%
2009 705 9% 33% 53% 74% 79% 83% 85% 89% 91%
2010 600 9% 32% 47% 63% 75% 76% 82% 84%
2011 634 6% 27% 40% 53% 63% 71% 76%
2012 981 4% 21% 32% 47% 63% 74%
2013 893 4% 22% 36% 51% 64%
2014 1'311 2% 17% 34% 52%
2015 1'083 4% 20% 41%
2016 1'755 8% 34%
2017 715 15%
Reported Loss Ratios per Development MonthUlt Loss
Ratio
Paid
Losses
Case
ReservesIBNR
84% 78% 5% 1%
62% 57% 4% 0%
72% 65% 5% 2%
68% 61% 4% 3%
75% 65% 7% 3%
82% 70% 8% 4%
99% 82% 12% 5%
102% 80% 10% 11%
95% 69% 15% 11%
86% 59% 17% 10%
95% 56% 19% 21%
97% 46% 18% 33%
110% 32% 20% 58%
104% 21% 20% 63%
105% 7% 27% 71%
109% 1% 14% 94%
2006
2007
200820092010
2011
201220132014
201520162017
0%
20%
40%
60%
80%
100%
120%
0 12 24 36 48 60 72 84 96 108 120 132 144
Development Months
Reported losses as % of earned Premiums - Latest 12 years
0
350
700
1'050
1'400
1'750
2'100
0%
20%
40%
60%
80%
100%
120%
2002 2003 2004 2005 2006 2007 2008 2009 2010 2011 2012 2013 2014 2015 2016 2017
USD mPaid, incurred and ultimate loss ratio - Left Hand Scale Earned and written premium - Right Hand Scale
Paid Losses Case Reserves IBNR
• Higher IBNR on recent years given the immature nature of the business
• This portfolio is also impacted by the change in the cedent reporting, however to a lesser extent

Reserves workshop – Investors' Day | Zurich, 4 April 2018
Underwriting and accident year triangles serve different purposes
Underwriting year (UY) triangle Accident year (AY) triangle
Definition
Underwriting year groups claims information according to the calendar year in which the original policy or reinsurance contract was incepted
Accident year groups claims information by the calendar year in which the claim event (the date of loss) falls
Basis Gross of external retrocession Net of internal and external retrocession
DataPaid and reported loss ratio triangles, earned premiums net of commissions and latest IBNR
Paid and incurred (i.e. reported plus IBNR) claims triangles
Scope Traditional P&C business Traditional and non-traditional business
Purpose
• Project paid or reported claims to ultimate and are the basis for deriving the best estimate reserves
• Used internally to project to ultimate
• Give an indication on how the ultimate loss (i.e. reported plus IBNR) developed over time
• Constructed in order to comply with US GAAP reporting requirement
Number of years disclosed
16 underwriting years10 accident years for Reinsurance and 6 accident years for Corporate Solutions
11

Reserves workshop – Investors' Day | Zurich, 4 April 2018
Reserves walk between underwriting and accident year triangles
12
38.4
66.8
62.1
34.8
10.22.2
2.1 0.9 -0.8
13.7 -4.7
-1.0 -13.3
0.9 -14.0
20
25
30
35
40
45
50
55
60
65
UY 2002-2017P&C gross reserves
on UY basis
Other traditionalbusiness incl.
reserves for priorUY
US Asbestos &Environmental
Non-traditionalbusiness
Unallocated LossAdjustment
Expense (ULAE)
Acquisitionmethod
accounting
Gross L&H (shortand long duration)
Published grossUSGAAP Reserves
Retro Published netUSGAAP Reserves
ULAE Net L&H (short andlong duration)
Acquisitionmethod
accounting & OtherL&H discounting
Reserves for priorAY
Displayed P&C netreserves on AY
basis
P&C gross reserves displayed in the underwriting year triangles to gross US GAAP reserves as published in Note 5 in the Financial Report
Net US GAAP reserves to net P&C reserves displayed in the accident year triangles
P&C and L&H reserves as published
• Underwriting year triangles and accident year triangles are used for different purposes and are on a different basis
• Accident year triangles show incurred claims, i.e. reported claims and IBNR, while, underwriting year triangles show reported triangles

Reserves workshop – Investors' Day | Zurich, 4 April 2018
Swiss Re discloses its underwriting year triangles online and its accident year triangles in the Financial Report
13
Accident year triangleUnderwriting year triangle
• Underwriting year triangle is the basis to determine best estimate ultimate claims
• Accident year triangle can give an indication of how Swiss Re’s initial estimation has developed over time
The above triangle shows P&C Reinsurance – Property as an example of the accident year triangles disclosed in the Financial Report
The above shows Swiss Re Property Reinsurance figures and chart as an example of the underwriting year P&C loss ratio development triangles
UWY
Year
Earned
Premium in
USDm
12 24 36 48 60 72 84 96 108 120 132 144 156 168 180 192
2002 3'880 27% 57% 59% 58% 58% 58% 58% 57% 58% 57% 57% 57% 57% 57% 57% 57%
2003 3'889 23% 39% 47% 48% 47% 47% 47% 47% 46% 46% 46% 46% 46% 46% 46%
2004 3'983 32% 66% 75% 74% 75% 75% 75% 74% 74% 74% 74% 74% 74% 74%
2005 4'070 45% 116% 125% 124% 124% 123% 123% 122% 122% 122% 122% 122% 122%
2006 3'772 10% 37% 42% 42% 41% 41% 41% 41% 41% 41% 41% 41%
2007 3'920 18% 50% 53% 53% 54% 53% 53% 53% 53% 53% 53%
2008 4'038 21% 50% 55% 55% 55% 54% 55% 55% 55% 54%
2009 4'216 24% 63% 66% 66% 66% 66% 66% 67% 66%
2010 4'028 20% 75% 90% 90% 95% 98% 100% 101%
2011 4'954 30% 63% 68% 70% 73% 73% 73%
2012 6'367 15% 48% 54% 55% 55% 55%
2013 5'561 17% 47% 51% 51% 51%
2014 5'055 11% 40% 47% 47%
2015 5'274 12% 45% 55%
2016 5'419 18% 56%
2017 3'608 50%
Reported Loss Ratios per Development Month
UWY
Year
Ult Loss
Ratio
Paid
Losses
Case
Reserv
es
IBNR
2002 57% 57% 0% 0%
2003 46% 46% 0% 0%
2004 74% 74% 0% 0%
2005 122% 122% 0% 0%
2006 41% 40% 0% 0%
2007 53% 52% 1% 0%
2008 54% 53% 1% 0%
2009 66% 65% 1% 0%
2010 102% 98% 2% 1%
2011 73% 71% 1% 0%
2012 55% 53% 2% 0%
2013 51% 49% 2% 0%
2014 48% 43% 4% 0%
2015 58% 44% 11% 3%
2016 73% 33% 23% 17%
2017 126% 13% 38% 76%
1 Required supplementary information
1

Reserves workshop – Investors' Day | Zurich, 4 April 2018
Significant share of Swiss Re’s US GAAP L&H reserves are calculated using assumptions ‘locked-in’ at inception
14
As of 31 December 2017,USD billions
Life & HealthReinsurance
LifeCapital
Liabilities
Unpaid claims and claim adjustment expenses 12 129 2 308
Liabilities for life and health policy benefits 18 230 29 491
Policyholder account balances 1 574 35 963
Other reinsurance liabilities 5 528 4 410
Short-term debt 4 766 904
Long-term debt 6 914 1 603
Other 7 197 2 954
Total liabilities 56 338 77 633
Shareholders’ equity 8 221 7 088
Claims reserves are best estimate and reflect the expected future payments due for claims that have been incurred prior to the valuation date – they are mostly driven by L&H Reinsurance
Policy reserves are the net amount held to fund claims to be incurred after the valuation date; they take into account premiums due after the valuation date. These reserves are calculated using assumptions that are ‘locked-in’ at inception of the business, and include a margin for adverse deviation
Policyholder account balances are amounts held on behalf of the policyholder, for example in unit-linked funds – the vast majority stems from Life Capital closed book
Source: Swiss Re Financial Report 2017, page 203

Reserves workshop – Investors' Day | Zurich, 4 April 2018
Yearly renewable terms (YRT)
Pro
ject
ed
ca
sh fl
ow
s, U
SD
15
2’000
1’750
1’500
1’250
1’000
750
500
250
020151050
Coinsurance agreement
Life & Health reserve patterns vary with contract type – size of Swiss Re’s reserves is not a good indicator for the amount of risk
Claims
Premiums
15 200
250
500
750
1’000
1’250
1’500
1’750
2’000
50 10
Premium
Claims
• Life & Health contracts cover risks over many years, in some cases for the whole of life
• Structure of premium rates affects how reserves build up
• For coinsurance life contracts, reserves build up in the early years to fund the cashflow shortfall in later years
• For YRT contracts, there is minimal reserve build-up if the premiums and claims cashflows are well matched
Pro
ject
ed
ca
sh fl
ow
s, U
SD
4 000
3 000
0
1 000
2 000
151051
US GAAP average reserve, USD
Contract years
2 000
1 000
0
4 000
3 000
151 5 10
US GAAP average reserve, USD
Contract years
Illustrative
Illustrative

Reserves workshop – Investors' Day | Zurich, 4 April 2018
EVM best estimate reserves show that Swiss Re’s US GAAP L&H reserves are conservative with significant margin to emerge over time
16
2 000
1 500
1 000
500
0
3 000
-500
-1 500
-1 000
3 500
2 500
1
Projected reserves1
171413121110987 155432 16 18 190 6
EVM best estimate reserves
US GAAP reserves
1 Projected reserves = Present value of claims – Present value of premiums
Under EVM, the full value of expected profits are recognised upfront; this is represented in the chart by the negative reserves at inception
Future assumptions are regularly re-assessed for EVM
The conservatism in the US GAAP reserves is gradually released into reported earnings –this difference is called GAAP margin
Swiss Re uses EVM as it shows the true economic value of a transaction – indicating the future US GAAP earnings potential (before allowance for taxes and capital costs)
Illustrative
Contract years

Reserves workshop – Investors' Day | Zurich, 4 April 2018
More than USD 20bn L&H margin within Swiss Re’s US GAAP reserves
17
As of 31 December 2017, USD billions
Life & HealthReinsurance
LifeCapital Total L&H
US GAAP shareholders' equity 8.2 7.1 15.3
Discounting −0.3 −4.2 −4.5
Investments and debt −2.3 0.0 −2.3
Reserving basis 0.0
GAAP margins 17.3 3.3 20.6
Other 0.1 −0.5 −0.4
Recognition differences 0.0 −0.5 −0.5
Goodwill and other intangibles −1.9 −0.2 −2.1
Taxes −0.9 0.6 −0.3
Capital costs −7.1 −1.6 −8.7
Other 0.0 0.0 0.0
Total EVM valuation adjustments 4.9 −3.1 1.8
Economic net worth 13.1 4.0 17.1
Source: Swiss Re Financial Report 2017, page 63
US GAAP margin has increased from USD 13.8bn at year end 2012 to USD 20.6bn at year end 2017
The margin is diversified across geography and product lines
Significantly more margin in L&H Reinsurance than in Life Capital despite higher reserves in the latter

Reserves workshop – Investors' Day | Zurich, 4 April 2018
EVM sensitivities demonstrate resilience of Swiss Re’s L&H reserves to changes in assumptions
18
Change in economic net worth as of 31.12.2017,USD billions
Life & HealthReinsurance
LifeCapital
Reduce lapse rates by 10% (eg from 8.0% to 7.2%) 0.1 0.1
Mortality and morbidity rates reduced by 5%:
Mortality 2.8 0.1
Longevity -0.4 -0.1
Morbidity 0.6 0.0
Remove all allowance for future mortality improvement:
Mortality -8.0 -0.3
Longevity 1.0 0.3Increase future mortality improvement assumption by 100bps p.a.:
Mortality 5.9 0.2
Longevity -1.1 -0.3
Source: http://reports.swissre.com/2017/financial-report/evm/evm-sensitivities-online-only-content.html
The margin in the L&H reserves may be higher or lower depending on the eventual outcome of mortality, morbidity and lapse rates
Even with no mortality improvements there would be positive margin emerging in future
Reserves workshop – Investors' Day | Zurich, 4 April 2018 19
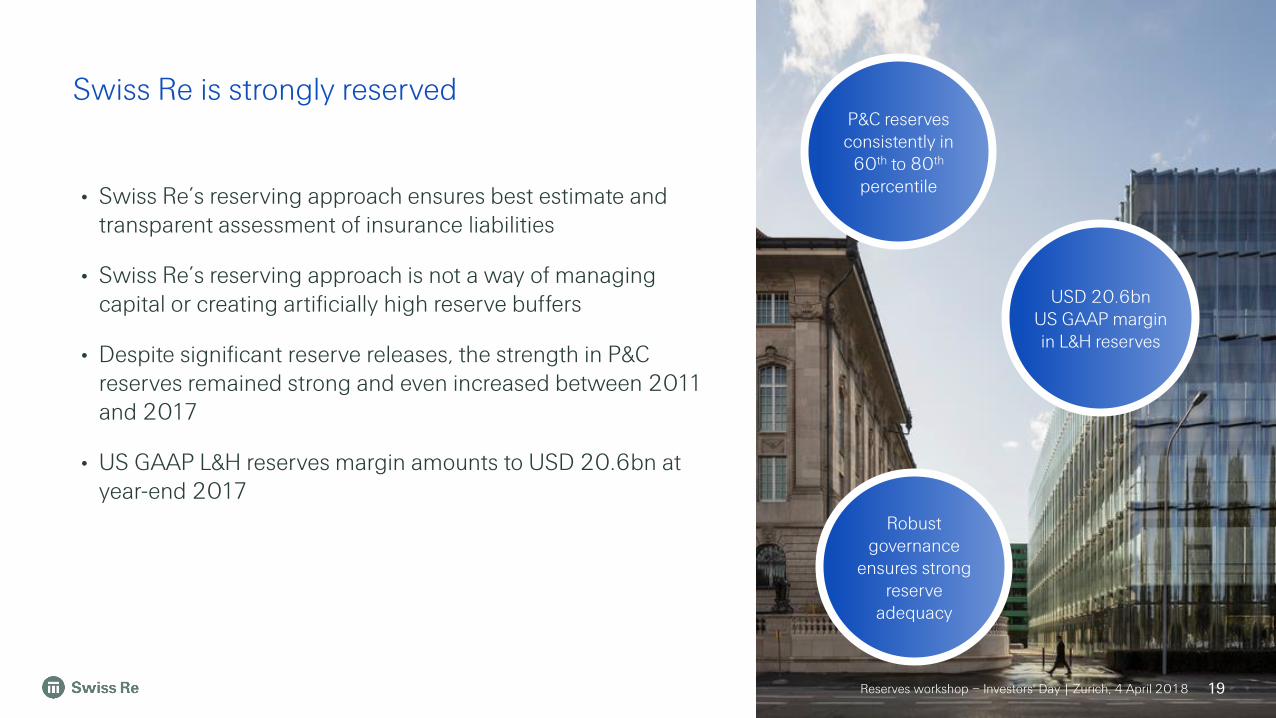
Swiss Re is strongly reserved
• Swiss Re’s reserving approach ensures best estimate and transparent assessment of insurance liabilities
• Swiss Re’s reserving approach is not a way of managing capital or creating artificially high reserve buffers
• Despite significant reserve releases, the strength in P&C reserves remained strong and even increased between 2011 and 2017
• US GAAP L&H reserves margin amounts to USD 20.6bn at year-end 2017
P&C reserves consistently in
60th to 80th
percentile
Robust governance
ensures strong reserve
adequacy
USD 20.6bn US GAAP margin in L&H reserves
Reserves workshop – Investors' Day | Zurich, 4 April 2018

Reserves workshop – Investors' Day | Zurich, 4 April 2018 20

Reserves workshop – Investors' Day | Zurich, 4 April 2018
Cautionary note on forward-looking statements
21
Certain statements and illustrations contained herein are forward-looking. These statements (including as to plans, objectives, targets, and trends) and illustrations provide current expectations of future events based on certain assumptions and include any statement that does not directly relate to a historical fact or current fact.
Forward-looking statements typically are identified by words or phrases such as “anticipate”, “assume”, “believe”, “continue”, “estimate”, “expect”, “foresee”, “intend”, “may increase”, “may fluctuate” and similar expressions, or by future or conditional verbs such as “will”, “should”, “would” and “could”. These forward-looking statements involve known and unknown risks, uncertainties and other factors, which may cause the Group’s actual results of operations, financial condition, solvency ratios, capital or liquidity positions or prospects to be materially different from any future results of operations, financial condition, solvency ratios, capital or liquidity positions or prospects expressed or implied by such statements or cause Swiss Re to not achieve its published targets. Such factors include, among others:
• the frequency, severity and development of insured claim events, particularly natural catastrophes, man-made disasters, pandemics, acts of terrorism and acts of war;
• mortality, morbidity and longevity experience;
• the cyclicality of the insurance and reinsurance sectors;
• instability affecting the global financial system;
• deterioration in global economic conditions;
• the effect of market conditions, including the global equity and credit markets, and the level and volatility of equity prices, interest rates, credit spreads, currency values and other market indices, on the Group’s investment assets;
• changes in the Group’s investment result as a result of changes in the Group’s investment policy or the changed composition of the Group’s investment assets, and the impact of the timing of any such changes relative to changes in market conditions;
• the Group’s ability to maintain sufficient liquidity and access to capital markets, including sufficient liquidity to cover potential recapture of reinsurance agreements, early calls of debt or debt-like arrangements and collateral calls due to actual or perceived deterioration of the Group’s financial strength or otherwise;
• any inability to realize amounts on sales of securities on the Group’s balance sheet equivalent to their values recorded for accounting purposes;
• changes in legislation and regulation, and the interpretations thereof by regulators and courts, affecting us or the Group’s ceding companies, including as a result of shifts away from multilateral approaches to regulation of global operations;
• the outcome of tax audits, the ability to realize tax loss carryforwards, the ability to realize deferred tax assets (including by reason of the mix of earnings in a jurisdiction or deemed change of control), which could negatively impact future earnings, and the overall impact of changes in tax regimes on business models;
• failure of the Group’s hedging arrangements to be effective;
• the lowering or loss of one of the financial strength or other ratings of one or more Swiss Re companies, and developments adversely affecting the Group’s ability to achieve improved ratings;
• uncertainties in estimating reserves;
• policy renewal and lapse rates;
• uncertainties in estimating future claims for purposes of financial reporting, particularly with respect to large natural catastrophes and certain large man-made losses, as significant uncertainties may be involved in estimating losses from such events and preliminary estimates may be subject to change as new information becomes available;
• extraordinary events affecting the Group’s clients and other counterparties, such as bankruptcies, liquidations and other credit-related events;
• legal actions or regulatory investigations or actions, including those in respect of industry requirements or business conduct rules of general applicability;
• changes in accounting standards;
• significant investments, acquisitions or dispositions, and any delays, unexpected costs, lower-than expected benefits, or other issues experienced in connection with any such transactions;
• changing levels of competition, including from new entrants into the market; and
• operational factors, including the efficacy of risk management and other internal procedures in managing the foregoing risks and the ability to manage cybersecurity risks.
These factors are not exhaustive. Swiss Re operates in a continually changing environment and new risks emerge continually. Readers are cautioned not to place undue reliance on forward-looking statements. Swiss Re undertakes no obligation to publicly revise or update any forward-looking statements, whether as a result of new information, future events or otherwise.
This communication is not intended to be a recommendation to buy, sell or hold securities and does not constitute an offer for the sale of, or the solicitation of an offer to buy, securities in any jurisdiction, including the United States. Any such offer will only be made by means of a prospectus or offering memorandum, and in compliance with applicable securities laws.

Reserves workshop – Investors' Day | Zurich, 4 April 2018
Investor Relations contacts
Hotline E-mail+41 43 285 4444 [email protected]
Philippe Brahin Jutta Bopp Manfred Gasser+41 43 285 7212 +41 43 285 5877 +41 43 285 5516
Chris Menth Iunia Rauch-Chisacof+41 43 285 3878 +41 43 285 7844
Corporate calendar & contacts
22
Corporate calendar
201820 April 154th Annual General Meeting Zurich4 May First Quarter 2018 Key Financial Data Conference call3 August Half-Year 2018 Results Conference call1 November Nine Months 2018 Key Financial Data Conference call

Reserves workshop – Investors' Day | Zurich, 4 April 2018
Legal notice
23
©2018 Swiss Re. All rights reserved. You are not permitted to create any modifications or derivative works of this presentation or to use it for commercial or other public purposes without the prior written permission of Swiss Re.
The information and opinions contained in the presentation are provided as at the date of the presentation and are subject to change without notice. Although the information used was taken from reliable sources, Swiss Re does not accept any responsibility for the accuracy or comprehensiveness of the details given. All liability for the accuracy and completeness thereof or for any damage or loss resulting from the use of the information contained in this presentation is expressly excluded. Under no circumstances shall Swiss Re or its Group companies be liable for any financial or consequential loss relating to this presentation.