
Investors’ & Analysts’ Meet - gailonline.com · Investors’ & Analysts’ Meet May 26, 2016,...
30
1 GAIL (India) Ltd. India’s Youngest Maharatna Investors’ & Analysts’ Meet May 26, 2016, Mumbai
Transcript of Investors’ & Analysts’ Meet - gailonline.com · Investors’ & Analysts’ Meet May 26, 2016,...

1
GAIL (India) Ltd. India’s Youngest Maharatna
Investors’ & Analysts’ Meet May 26, 2016, Mumbai

Safe Harbor Statement
This presentation has been prepared by GAIL (India) Ltd (Company or GAIL) solely for providing information about the Company. The information contained in this presentation is only current as of its date. Certain statements made in this presentation may not be based on historical information or facts and may be "forward-looking statements", including those relating to the Company’s general business plans and strategy, its future financial condition and growth prospects, and future developments in its industry and its competitive and regulatory environment. Actual results may differ materially from these forward-looking statements due to a number of factors, including future changes or developments in the Company’s business, its competitive environment, information technology and political, economic, legal and social conditions in India. This communication is for general information purposes only, without regard to specific objectives, financial situations and needs of any particular person. Company do not accept any liability whatsoever, direct or indirect, that may arise from the use of the information herein. The Company may alter, modify or otherwise change in any manner the content of this presentation, without obligation to notify any person of such revision or changes
2

Agenda
3
Introduction
Performance Highlights
Industry Outlook & Strategy
Q&A

4
Introduction

Overview: GAIL (India) Ltd.
• Domestic market share ~ 15%
• Commissioned Petrochemical Plant expansion in Pata( UP) with capacity of 0.4 MMTPA (taking total capacity to 0.81)
• Participation in BCPL & OPAL
• 6 Gas Processing Plants producing LPG, Propane, Pentane, Naphtha etc.
• LPG Transport Capacity 3.8 MMTPA(2038 Km.)
• A part of vertical integration
• Participation in 15 blocks (operator-2 blocks)
• Presence in Myanmar & US
• 118 MW Wind Power Plant and 5 MW Solar Power Plant
• Participation in RGPPL( Capacity 1967 MW)
• Over 11,000 Km of network(206MMSCMD)
• Sophisticated Gas management System
• Pursuing for expansion, Participation in RGPPL ( 5 MMTPA LNG Regasification Facility)
• Long-term Import Portfolio: 24 MMTPA
Operates
3/4th
of the total NG transmission in India
Contribute s more than
2/3rd
of the natural gas sold in India
Produces
1/5th
of the polyethylene produced in India
Responsible for
1/4th
of India’s total LPG transmission
Produces every
13th
LPG Cylinder
in India
Supplies gas for about
3/5th
of India’s fertilizer produced
Supplies gas for about
4/5th
of India’s gas based power
Operating more than
2/3rd
of India’s total CNG stations through
alliances

GAIL’s Sustainability Aspiration 2020
GAIL ranks amongst Top 10 Companies for CSR
by The Economic Times
GAIL:1st amongst PSUs & Utility Sector
GAIL @ COP 21 Paris Only O&G PSU to join energy majors to highlight the steps by Indian O&G industry
to combat climate change, releases corporate vision on climate change and became chapter lead for Improving Energy Efficiency
Target of 33% reduction in GHG emission intensity from
the base of FY2010-11
Target of 5% reduction in specific energy
consumption(petrochemical & LHC segment product)
Target of 45% reduction in water consumption intensity from the base of FY2010-11
Target of increasing waste water recycling by 5% of waste water generated
Target of imparting sustainability awareness
training to 100% of employees
Dedicated sustainability development policy with board level committee chaired by independent directors
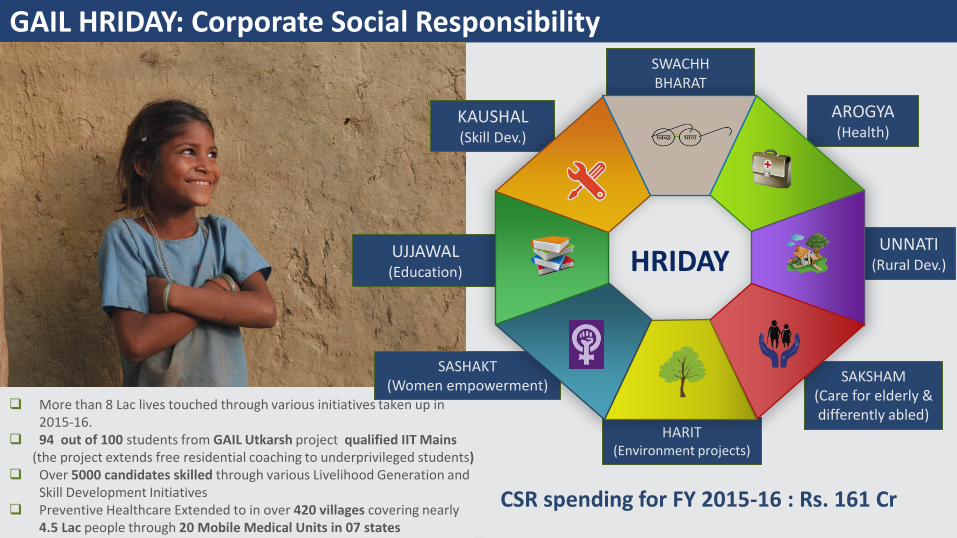
GAIL HRIDAY: Corporate Social Responsibility
UJJAWAL (Education)
SASHAKT (Women empowerment)
HARIT (Environment projects)
SAKSHAM (Care for elderly & differently abled)
UNNATI (Rural Dev.)
AROGYA (Health)
KAUSHAL (Skill Dev.)
SWACHH BHARAT
HRIDAY
CSR spending for FY 2015-16 : Rs. 161 Cr
More than 8 Lac lives touched through various initiatives taken up in 2015-16.
94 out of 100 students from GAIL Utkarsh project qualified IIT Mains (the project extends free residential coaching to underprivileged students) Over 5000 candidates skilled through various Livelihood Generation and
Skill Development Initiatives Preventive Healthcare Extended to in over 420 villages covering nearly
4.5 Lac people through 20 Mobile Medical Units in 07 states

Shareholding Structure & Share price movement
President of India, 56.11% LIC,
10.46% ONGC, 4.83%
IOC, 2.41%
FIIs, 16.35%
GDRs, 0.94%
Others, 8.91%
Top Shareholders other than GoI % Shareholding
LIC 10.46 %
ONGC 4.83 %
IOCL 2.41 %
LIC P&GS Fund 2.18 %
Matthews Pacific Tiger Fund 1.76 %
Source: BSE Website; Note: All data as on 31st March 2016 as per BSE website * Excluding Final dividend proposed at Rs. 3/share subject to approval of shareholders
8
0
100
200
300
400
500
0
0.2
0.4
0.6
0.8
1
1.2
Pri
ce (
in r
up
ee
s)
Price-Volume chart for the period of 1-4-2015 to 31-3-2016
Vo
lum
e (
in m
n)
Year Amount (`/share)
FY 2015-16* 2.5
FY 2014-15 6
FY 2013-14 10.4
FY 2012-13 9.6
FY 2011-12 8.7
FY 2010-11 7.5
52 Wk. High/Low
25 Jun 2015 `418
25 Aug 2015 ` 260
Dividend History(`)
Nearly 20 million shares of Rs. 10 face value is held by individual share holders

9
Performance Highlights

Major Highlights of FY 2015-16
10
Sales Turnover of ` 51,614 Cr & PBT of ` 3,173 Cr
BCPL Commissioned – Dedicated to Nation by Hon’ble PM on 5th Feb 2016
E&P Revenue from Myanmar (Net of Royalty & Govt. Share) ` 536 Cr
Capital expenditure - ~ Rs. 1512 Cr. in FY15-16
Loan Repayment during FY 2015-16 - ` 1,400 Cr
Renegotiated Long Term RLNG contract with PLL ; Contracted additional volume of 0.3 MMPTA
Implemented Gas Pooling scheme for stranded power plants. Marketed 5.87 MMSCMD in FY 2015-16
Imported 55 LNG cargoes in FY16 ( 22 at Dhabol), RGPPL Power Block Supplied 1187 MUs to Railways under PSDF scheme
Shareholders Agreement (SHA) & Investor Agreement (IA) of TAPI signed; GAIL’s Equity 5%
Credit Rating – Domestic ‘AAA’, International ‘Baa2’ (Moody) , BBB- (Fitch)
Consortium of GAIL GAS and BPCL got authorization for CGD in Haridwar & North Goa

44%
29%
5%
11% 3% 8%
APM/NAPM RLNG PMT Spot Mid Term RIL
56%
14%
8%
19% 3%
Physical Performance
118 105 96 92 92 84 81 79 72 74
FY12 FY13 FY14 FY15 FY16Gas Transmission Gas Marketing
Gas Volume Trend Gas Transmission Mix
448 427 445 441
334
FY12 FY13 FY14 FY15 FY16
1,441 1,371 1,307 1277 1,085
FY12 FY13 FY14 FY15 FY16
3,362
3,136 3,145 3093
2,819
FY12 FY13 FY14 FY15 FY16
Petrochemicals Sales Liquid Hydrocarbons Sales LPG Transmission
Gas Marketing Mix
11
(MMSCMD)
(TMT)
FY16 FY16

66%
34%
Gas Sourcing & Sector Wise Supply – FY16
15 18
11
6
11 7
2 6
Fertilisers Power CGD for CNG & PNG Others*
Imported Gas primarily consists of Long Term RLNG, Mid Term RLNG and Spot Major sources for domestic gas are ONGC( APM & Non APM), PMT at APM & PSC prices ,Ravva, Ravva satellite etc. Highest demand of Natural Gas from Power & Fertilizer companies
Domestic RLNG
12
(MMSCMD, % share)
49 MMSCMD
25 MMSCMD
* Others include Steel, Refineries, Sponge Iron, Petrochemicals, GAIL Internal consumption etc.
34% 33%
17% 16%
%age Share

Financial Performance (Standalone)
40,281 47,333
57,245 56569 51,614
FY12 FY13 FY14 FY15 FY16
Sales (net of ED, in ` Cr.)
6,247 7,234
7,945
5620 5,126
FY12 FY13 FY14 FY15 FY16
Gross Margin* (PBDIT, in ` Cr.)
5,340 6,058 6,402
4284
3,173
FY12 FY13 FY14 FY15 FY16
PBT* ( in ` Cr.)
3,654 4,022
4,375
3039 2,299
FY12 FY13 FY14 FY15 FY16
PAT ( in ` Cr.)
13 * Incl. exceptional items

Segment-Wise Breakup – FY16
Gas Marketing
NG Transmission
LPG Trans Petchem Liquid
Hydrocarbons Unallocated
incl. E&P 14
` 51614 Cr
` 3173 Cr
40337 3701 486
3041 3246
804
1468 1642
268
1105
760 141
(` in Cr.)
78
7
1
6
6
2
46
52
8
-35
24
4
Gas Marketing
NG Transmission
LPG Transmission
Petrochemicals
LHC
Unallocated
Profit Before Tax Turnover
(%)
Turn
ove
r (N
et o
f ED
) P
rofi
t b
efo
re T
ax

Major Variance in Profitability – FY15 vs. FY16
15
Increase in Profitability of Gas Marketing Segment by ~ ` 800 Cr
Increase in Gas Transmission Income due to Power Pooling by ~ ` 120 Cr
No retrospective tariff reversal in FY2015-16 vis-à-vis FY2014-15. Impact ` 409 cr.
Decrease in Petchem sales volume by 24 % led to impact of ~ ` (1100) Cr in Turnover.
Decrease in Avg. Polymer Price by 12% in FY16 Vs. FY15-Impact ~ ` (400) cr.
Decrease in Gas & Power cost of Petrochemicals by ~ ` 1100 Cr
Decrease in LHC sales volume by 15 % led to a impact of ~ ` (900) Cr in Turnover .
Decrease in Avg. LHC Price by 37% in FY16 Vs. FY15- Impact~ (1900) cr.
Decrease in Gas cost of LHC by ~ ` 600 Cr
Decrease in LPG Subsidy by ` 1000 Cr
Increase in E&P revenues (Net of Govt. share & Royalty) by ~` 200 Cr
Increase in Depreciation by ~ ` 300 cr.
Increase in Interest expense by ~ ` 300 cr.
Increase in CSR expense by ~ ` 100 cr.

Balance Sheet – 31.03.2016 (` in Cr.)
16
Share Capital 1268
Reserves & Surplus 29316
Borrowings* 8118
Deferred Tax Liab. 4047
Capital Employed 42,749
Tangible Assets 28015
Intangible Assets
731
CWIP 3403
Equity Investments
4547
Others 6054
NG Pipelines incl. Comp. 25263
Petrochemicals 12177
LPG Pipeline 1791
LHC Plants 1471
E&P assets 1274
Wind Power 767
Others 633
Gross Block 43378
Less Accumulated Depreciation 14631
Net block 28746
Line pipes & related
facilities
2832
Petrochemicals 124
Exploratory &
Development Well in
Progress
285
Others 162
CWIP 3403
Working capital 2197
Non Current assets less
Non Current Liability
3856
Others 6054

Financial Profile
21,449 24,038
26,858 28,888 30,314
FY12 FY13 FY14 FY15 FY16
Net Worth (in ` Cr.)
28,741 35,591
39,907 41,984 42,749
FY12 FY13 FY14 FY15 FY16
Capital Employed ( in ` Cr.)
26,307 31,149 34,056
41,389 43,377
FY12 FY13 FY14 FY15 FY16
Gross Block (in ` Cr.)
9
7
4 3
2
FY12 FY13 FY14 FY15 FY16
Debt Service Coverage Ratio (DSCR)
5,347
9,064 10,268 9556
8,118
FY12 FY13 FY14 FY15 FY16
Loans ( in ` Cr.)
0.25
0.38 0.38 0.33
0.27
FY12 FY13 FY14 FY15 FY16
Debt to Equity Ratio
17

Financial Performance on Consolidated basis
44,058 50,893
61,644 60,515 54572
FY12 FY13 FY14 FY15 FY16
Sales(net of ED)
7,762 8,314 9,235
6577 5,924
FY12 FY13 FY14 FY15 FY16
Gross Margin (PBDIT)
6,355 6,558 6,922
4,492 3,092
FY12 FY13 FY14 FY15 FY16
Profit before Tax
4,444 4,374 4,786
3160
2,252
FY12 FY13 FY14 FY15 FY16
Profit after Tax
18
(` in Cr.)

19
Capex & Borrowings
858 , 57%
136 , 9%
16 , 1%
72 , 5%
430 , 28%
Pipeline CGD BD/INT SOURCES/PROJECT DEVELOPMENT E&P Petrochemical
1350, 82%
104, 6%
69, 4%
78, 5% 53, 3%
Borrowings- Actual for FY 2015-16 is ‘NIL’; Estimated for FY 2016-17 is ‘NIL’
FY15-16 ` 1512 Cr
FY16-17E ` 1650 Cr
(` in Cr.)

20
Industry Outlook & Strategy

Projected Energy Demand: Role of Natural Gas Source: World Energy Outlook 2015/IEA, 2015
-400-200
0200400600800
10001200
EuropeanUnion
UnitedStates
Japan LatinAmerica
MiddleEast
SouthEast Asia
Africa China India
Change in Energy Demand, 2014-2040 Mtoe
0%
20%
40%
60%
80%
100%
Total Coal Oil Nuclear Gas Renewables
India's Share in world energy consumption growth by fuel, 2013-2040
India China Other Asia Middle East OECD Rest of World
0
30
60
90
120
150
180
2000 2005 2013 2020 2025 2030 2035 2040
Projected Natural Gas Production in India
Conventional Coalbed methane Tight gas
Shale gas Total gas demand
BCM
0%
16% 17%
0%
5%
10%
15%
20%
0
20
40
60
80
2013 2030 2040
Projected natural gas imports in India
Middle East & Caspian North AmericaRussia AustraliaAfrica Latin AmericaPL Import as a %age of total imports.
BCM

0
5000
10000
15000
20000
2010 2014 2015 2020 2025 2030 2035OECD European Union Europe Former Soviet Union US China India
Energy Outlook 2035 : India & World Incremental Energy Demand Outlook
SOURCE: BP Outlook 2035, February 2016/BP India Insight 2016
12928 13081 14431 15542
(MTOE)
16479 17307 12111
-
5,000
10,000
15,000
20,000
2010 2014 2015 2020 2025 2030 2035OECD European Union Europe Former Soviet Union US China India
Incremental Energy Production Outlook
13122 13237 14575 15566
(MTOE)
16494 17279 12106
+136% Growth in India’s energy consumption
9% Share of global energy Consumption in 2035
+123% Growth in India’s energy production
5% Share of global energy production in 2035
By year 2035,in India, demand for gas expands by 155%, followed by coal (+121%) and oil (+118%), while renewables rise by 656%, nuclear by 334%, and hydro by 99%.
India’s energy mix evolves very slowly over the Outlook, with fossil fuels accounting for 87% of demand in 2035, compared to a global average of 79%. This is down from 92% in 2014.
Decline in oil production (-24%) is
offset by increases in gas (+68%) and coal (+120%).
India’s energy production as a share of
consumption declines from 57% in 2014 to 54% by 2035 as imports rise by 153%.
India shows the fastest energy consumption growth among all major economies and remains import dependent.

252 258 261 269 299 325 345 352 359 366 380 395 411 427 445 463
-
100
200
300
400
500
2015 2016 2017 2018 2019 2020 2021 2022 2023 2024 2025 2026 2027 2028 2029 2030
All India Natural Gas Demand Potential (MMSCMD)
Demand Potential of Natural Gas in India
1
130 136 140 147 178
204 224 230 237 244 259 274 290 306 323 341
-
100
200
300
400
2015 2016 2017 2018 2019 2020 2021 2022 2023 2024 2025 2026 2027 2028 2029 2030
All India Natural Gas Open Demand (MMSCMD)
Fertilizer Power CGD (Dom&CNG) CGD (Com&Ind) Refinery/Pet. Captive Power Bulk Industrial - Grand Total
2
Overall Demand 1 Open Demand 2 Less: Existing Domestic and
RLNG supply (~121 MMSCMD)
SOURCE: KPMG Study

Source: PPAC website data Total gas sale = Domestic gas sale+ LNG imports. *Provisional data for 2015-16. It also includes sale of CBM of around 0.63MMSCMD. Reliance LNG Import Data is included from 2013-14 to 2014-15 in LNG Imports.
in MMSCMD
18.37 24.73
29.86 28.89 32.39 35.32 42.11 39.57
48.57 50.78 57.68
91.95 98.07
103.56 103.03
144.26
161.46 154.60
133.68 127.98
124.15 127.46
0%
5%
10%
15%
20%
25%
30%
35%
40%
45%
50%
0.00
20.00
40.00
60.00
80.00
100.00
120.00
140.00
160.00
180.00
2005-06 2006-07 2007-08 2008-09 2009-10 2010-11 2011-12 2012-13 2013-14 2014-15 2015-16*
LNG Imports Total Sale LNG Share Percentage
LNG Share in Gas Sales

Rising Petrochemical business
Indian PE Demand v/s Capacity-Evenly matching
CAGR of growth in $40 billion Indian Petrochemicals industry ~ 14 %
Indian Petrochemicals industry likely to reach $100 billion by 2020
India’s per capita consumption of plastics is just 11 kg vs. China per capita consumption of 38 kg.
World average of per capita consumption of Plastics is around 28 Kg with US consuming as high as 60-70 Kg per capita
Polymer demand growth is estimated to be 8-9% per annum and this represents huge upside for Plastics in general and GAIL in particular
India’s per capita is one of the lowest in Asia
India has big potential to grow & many opportunities
Actual Projections
(in KTA) 2015-16 2016-17 2017-18 2018-19 2019-20
Demand
HDPE (1) 2,192 2,367 2,557 2,761 2,982
LLDPE (2) 1,416 1,529 1,652 1,784 1,926
PE (1+2) 3,608 3,897 4,208 4,545 4,909
Capacity*
PE (1+2) 2,630 3,902 4,114 4,326 4,538
Growth Drivers
Robust economy
Strong domestic market & shift from unorganized to organized
Infrastructure development
Urbanization/Rise of middle class
Skilled work force
More subsidy for Agriculture sector
Growth drivers coupled with Capacity addition will result in growth in Top line as well as Bottom line for GAIL.
*Source: Study by Assocham & Industry Estimates

Major Projects (On-going & Upcoming)
Phenol-Acetone-Project*
Cost-:-Over ` 2000 Cr. Cap-:- 108 KTPA(Phenol) & 67 KTA (Acetone)
MANGLORE
KANJIKKOD
KOCHI
BANGLORE
KKMBPL (Ph.-II)
Length-:- 879 Km, Cost-:-Over ` 2900 Cr. Cap-:- 16 MMSCMD
DAHEJ & GANDHAR
JAGDISHPUR
HALDIA
GAYA
PHULPUR-DHAMRA-HALDIA-PIPELINE**
Length-:- 2539 Km, Cost-:-Over `12190 Cr. Cap-:- 16 MMSCMD
Map Not to scale *Phenol-Acetone-Project **To be commissioned in synchronization with anchor load customers
Vijaipur Auriya P/L** (VAPPL)
Length-:- 672 Km, Cost-:-Over `4500 Cr. Cap-:- 8.9 MMSCMD
26

81 78 244
663 751
-203 -137 -21
193 250
Sales PBT
E&P: Vertical Integration Net Sales & PBT (in ` Cr.)
338 343 357 310 306
169 171 178 151 146
FY12 FY13 FY14 FY15 FY16
Total Crude Production GAIL's Share
4.85 6.46
0.42 0.55
FY12 FY13 FY14 FY15 FY16
Total NG Production GAIL's Share
1.47 0.12
FY12 FY13 FY14 FY15 FY16
27
NG Production (in BCM.)
Crude Production (in ‘000 bbl.)
Key Developments during FY 2015-16 1. Field Development Plan of Tripura Onland approved by Govt. - Gas in place 1.2 TCF
& Recoverable Reserves 65 BCF. (GAIL’s share 80%) 2. Drilling of 1st Exploratory Well started in GAIL Operated CB-ONN-2010/11 (NELP-IX)
block (Gujarat) 3. Drilling initiated in 3 other NELP-IX Blocks
Portfolio of 15 blocks(2 in Myanmar) Reserves
Crude Oil, India (‘000 bbl) 930
Natural Gas, Myanmar (BCM)
5.34
Natural Gas, India (BCF) 52
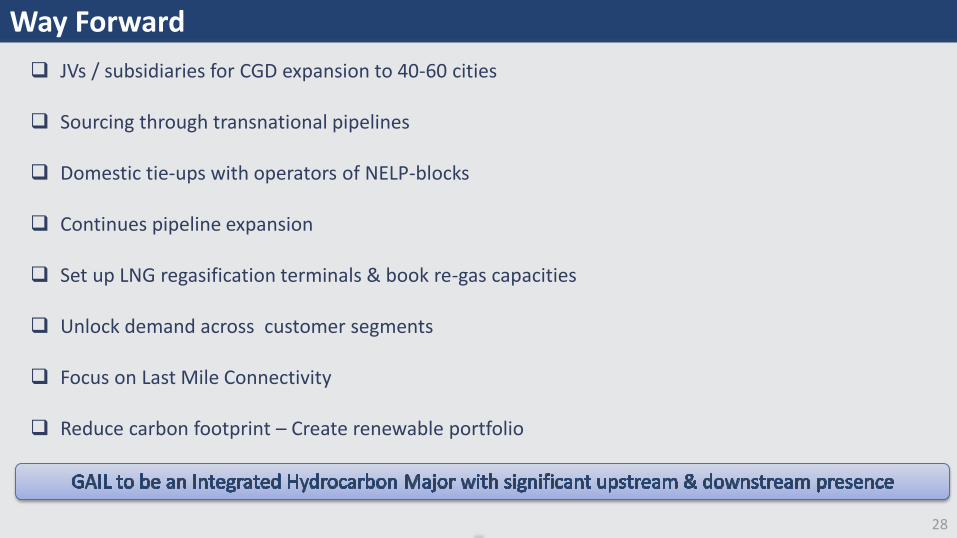
Way Forward
28
JVs / subsidiaries for CGD expansion to 40-60 cities
Sourcing through transnational pipelines
Domestic tie-ups with operators of NELP-blocks
Continues pipeline expansion
Set up LNG regasification terminals & book re-gas capacities
Unlock demand across customer segments
Focus on Last Mile Connectivity
Reduce carbon footprint – Create renewable portfolio

29
Thank You

16, Bhikaiji Cama Place, R.K. Puram, New Delhi-110066
www.gailonline.com
For Institutional Investors
& Analysts
Shri R C Gupta,
Executive Director (Finance & Accounts)
E-mail ID: [email protected]
For Retail Investors
Shri A K Jha,
Company Secretary
E-mail ID: [email protected]
India’s Youngest Maharatna
Our Touch Points
GAIL (India) Ltd.
30


![Investors & Analysts Presentation [Company Update]](https://static.fdocuments.us/doc/165x107/577c7c231a28abe0549972fe/investors-analysts-presentation-company-update.jpg)


![Presentation to Investors and Analysts [Company Update]](https://static.fdocuments.us/doc/165x107/577c7d531a28abe0549e52b6/presentation-to-investors-and-analysts-company-update.jpg)
![Investors/Analysts' Presentation [Company Update]](https://static.fdocuments.us/doc/165x107/577c7e161a28abe054a08404/investorsanalysts-presentation-company-update.jpg)
