
InvestorPPTMarch15
15
UPL LIMITED Consolidated Audited Results For the year ended 31 st March’15 Investor Presentation 27th April 2015
Transcript of InvestorPPTMarch15

UPL LIMITED
Consolidated Audited Results For the year ended 31st March’15
Investor Presentation
27th April 2015
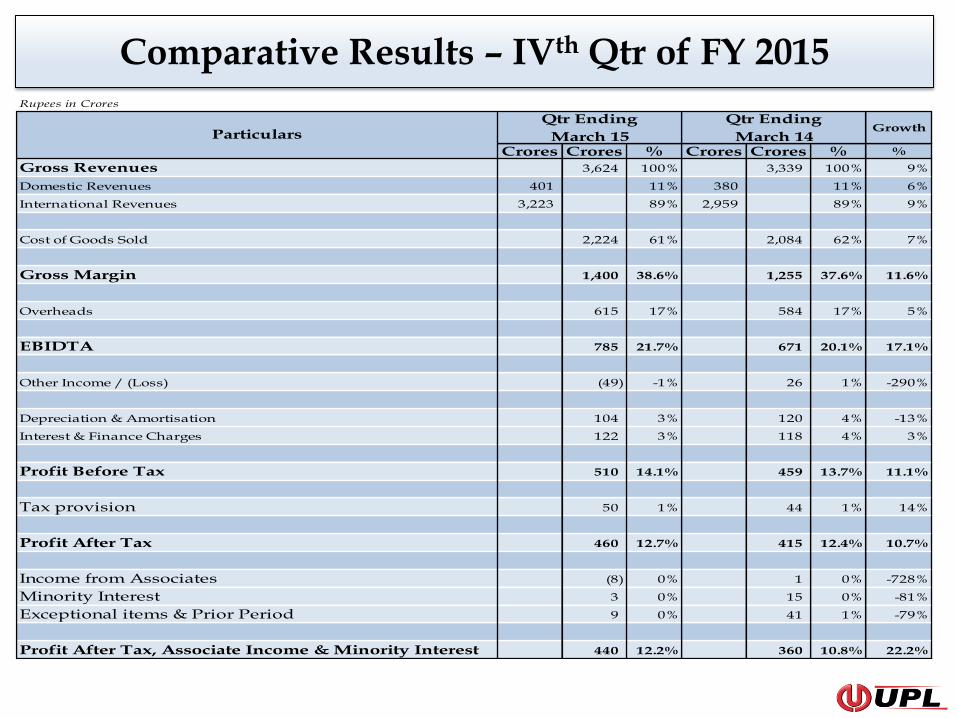
Comparative Results – IVth Qtr of FY 2015 Rupees in Crores
Growth
Crores Crores % Crores Crores % %
Gross Revenues 3,624 100% 3,339 100% 9%
Domestic Revenues 401 11% 380 11% 6%
International Revenues 3,223 89% 2,959 89% 9%
Cost of Goods Sold 2,224 61% 2,084 62% 7%
Gross Margin 1,400 38.6% 1,255 37.6% 11.6%
Overheads 615 17% 584 17% 5%
EBIDTA 785 21.7% 671 20.1% 17.1%
Other Income / (Loss) (49) -1% 26 1% -290%
Depreciation & Amortisation 104 3% 120 4% -13%
Interest & Finance Charges 122 3% 118 4% 3%
Profit Before Tax 510 14.1% 459 13.7% 11.1%
Tax provision 50 1% 44 1% 14%
Profit After Tax 460 12.7% 415 12.4% 10.7%
Income from Associates (8) 0% 1 0% -728%
Minority Interest 3 0% 15 0% -81%
Exceptional items & Prior Period 9 0% 41 1% -79%
Profit After Tax, Associate Income & Minority Interest 440 12.2% 360 10.8% 22.2%
ParticularsQtr Ending
March 14
Qtr Ending
March 15
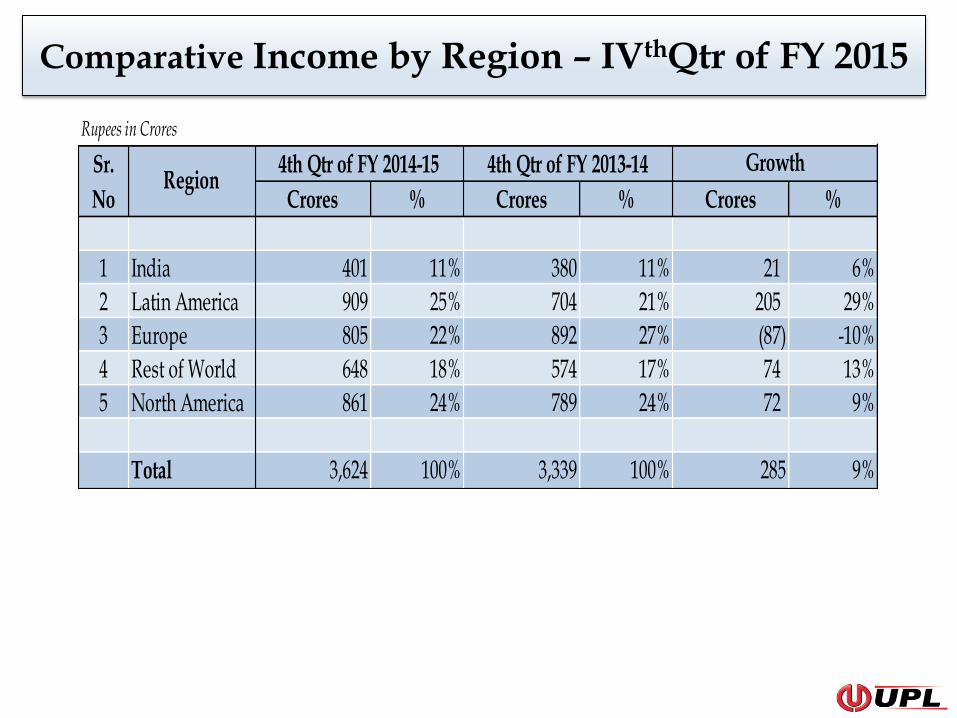
Comparative Income by Region – IVthQtr of FY 2015
Rupees in Crores
Crores % Crores % Crores %
1 India 401 11% 380 11% 21 6%
2 Latin America 909 25% 704 21% 205 29%
3 Europe 805 22% 892 27% (87) -10%
4 Rest of World 648 18% 574 17% 74 13%
5 North America 861 24% 789 24% 72 9%
Total 3,624 100% 3,339 100% 285 9%
4th Qtr of FY 2014-15 Growth4th Qtr of FY 2013-14Sr.
NoRegion
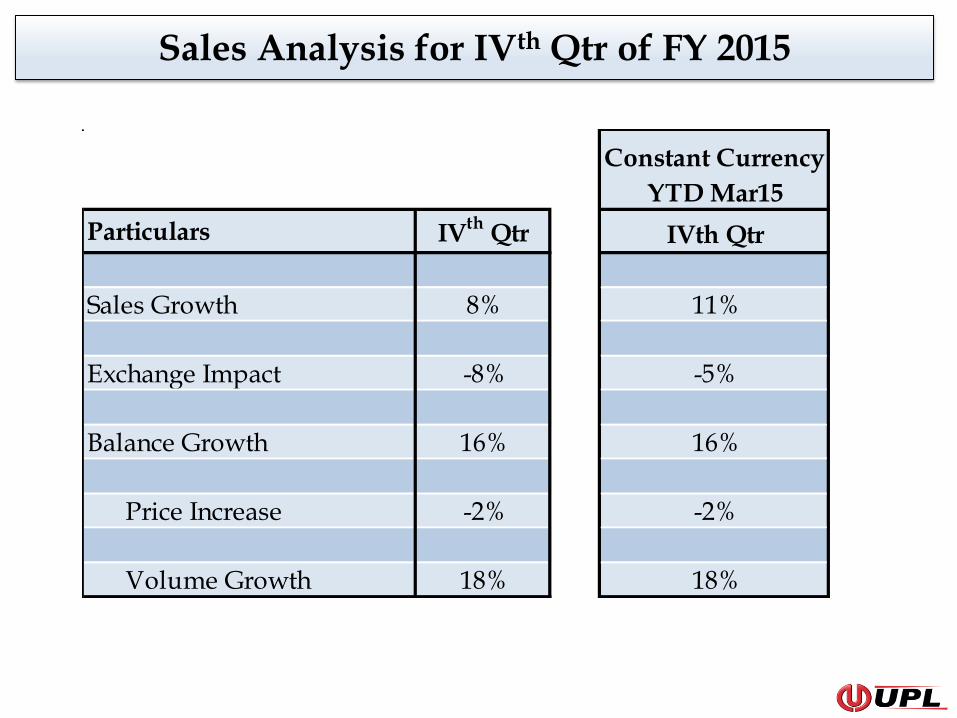
Sales Analysis for IVth Qtr of FY 2015
Particulars IVth
Qtr IVth Qtr
Sales Growth 8% 11%
Exchange Impact -8% -5%
Balance Growth 16% 16%
Price Increase -2% -2%
Volume Growth 18% 18%
Constant Currency
YTD Mar15

Comparative Results – Year ended FY 2015
Rupees in Crores
Growth
Crores Crores % Crores Crores % %
Gross Revenues 12,091 100% 10,771 100% 12%
Domestic Revenues 2,622 22% 2,245 21% 17%
International Revenues 9,469 78% 8,526 79% 11%
Cost of Goods Sold 7,455 62% 6,704 62% 11%
Gross Margin 4,636 38.3% 4,067 37.8% 14.0%
Overheads 2,273 19% 2,049 19% 11%
EBIDTA 2,363 19.5% 2,018 18.7% 17.1%
Other Income / (Loss) (3) 0% 131 1% -102%
Depreciation & Amortisation 425 4% 407 4% 4%
Interest & Finance Charges 517 4% 485 5% 7%
Profit Before Tax 1,418 11.7% 1,257 11.7% 12.8%
Tax provision 233 2% 222 2% 5%
Profit After Tax 1,185 9.8% 1,035 9.6% 14.5%
Income from Associates 21 0% 22 0% -5%
Minority Interest 43 0% 6 0% 572%
Exceptional items & Prior Period 19 0% 101 1% -81%
Profit After Tax, Associate Income & Minority Interest 1,144 9.5% 950 8.8% 20.4%
*Tax of Rs. 11 crores related to Profit on sale of Sipcam UPL Brazil SA is netted off with Exceptional items.
ParticularsYear Ending March 14Year Ending March 15
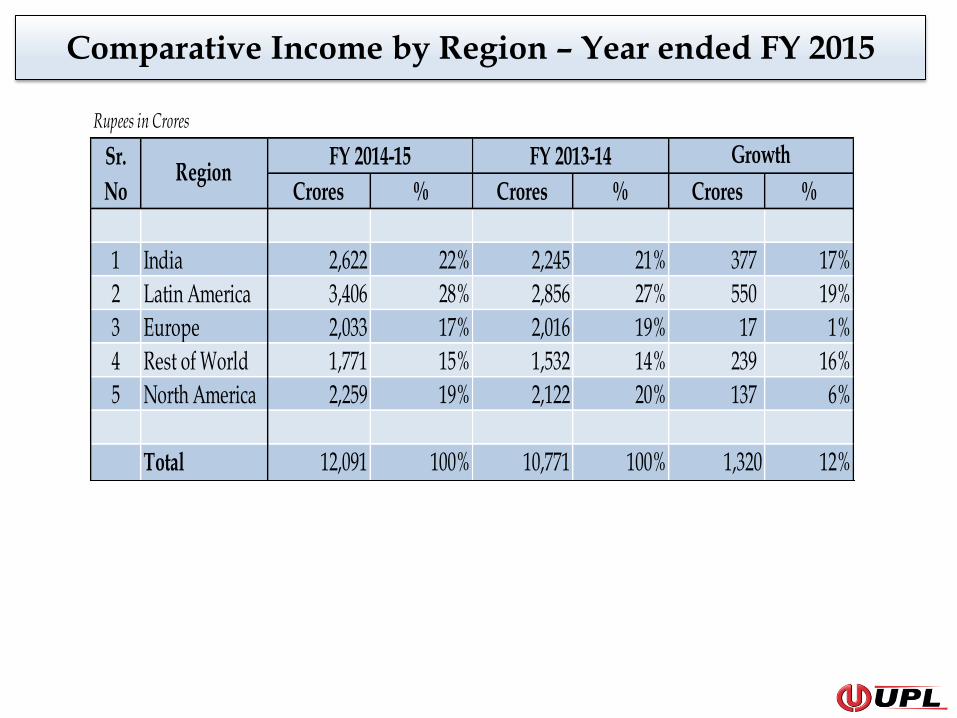
Comparative Income by Region – Year ended FY 2015
Rupees in Crores
Crores % Crores % Crores %
1 India 2,622 22% 2,245 21% 377 17%
2 Latin America 3,406 28% 2,856 27% 550 19%
3 Europe 2,033 17% 2,016 19% 17 1%
4 Rest of World 1,771 15% 1,532 14% 239 16%
5 North America 2,259 19% 2,122 20% 137 6%
Total 12,091 100% 10,771 100% 1,320 12%
GrowthSr.
NoRegion
FY 2014-15 FY 2013-14
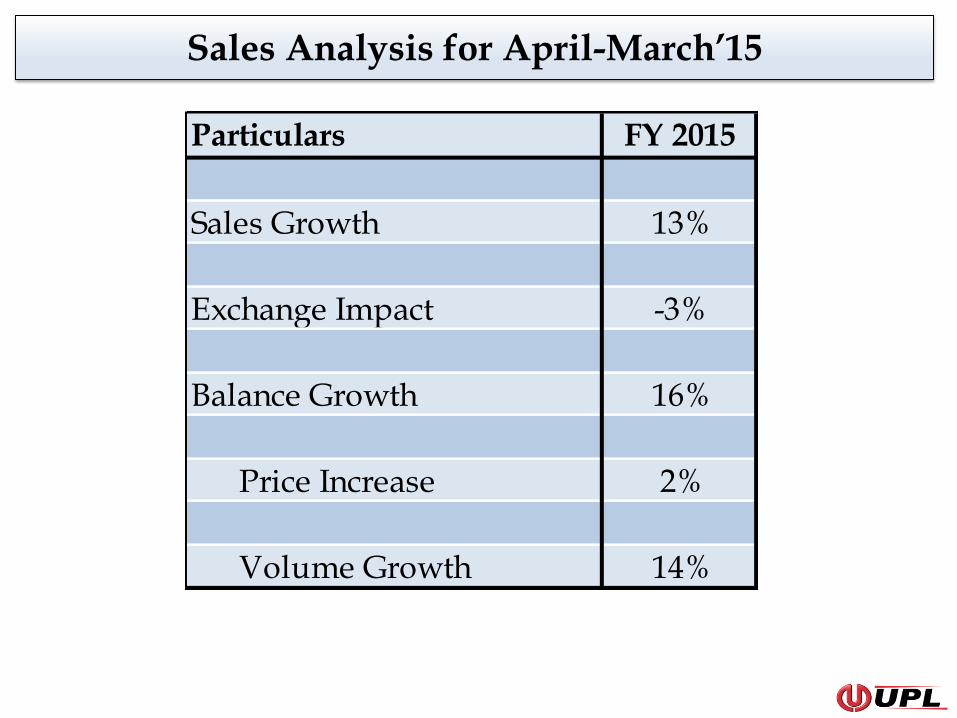
Sales Analysis for April-March’15
Particulars FY 2015
Sales Growth 13%
Exchange Impact -3%
Balance Growth 16%
Price Increase 2%
Volume Growth 14%

India
India
4th Qtr of
FY 2014-15
4th Qtr of
FY 2013-14Growth FY 2014-15 FY 2013-14 Growth
Revenue Crores 401 380 6% 2,622 2,245 17%
• New products Iris (Soya) and Eros (Rice), both herbicides performed as per expectation
• UPL Brands: Ulala, Lancer Gold, Starthene Power, Saaf, Saathi performed well
• Many states got affected due to drought like conditions in Kharif
• Unseasonal rain resulted in crop damage in wheat, mustard, fruits etc.
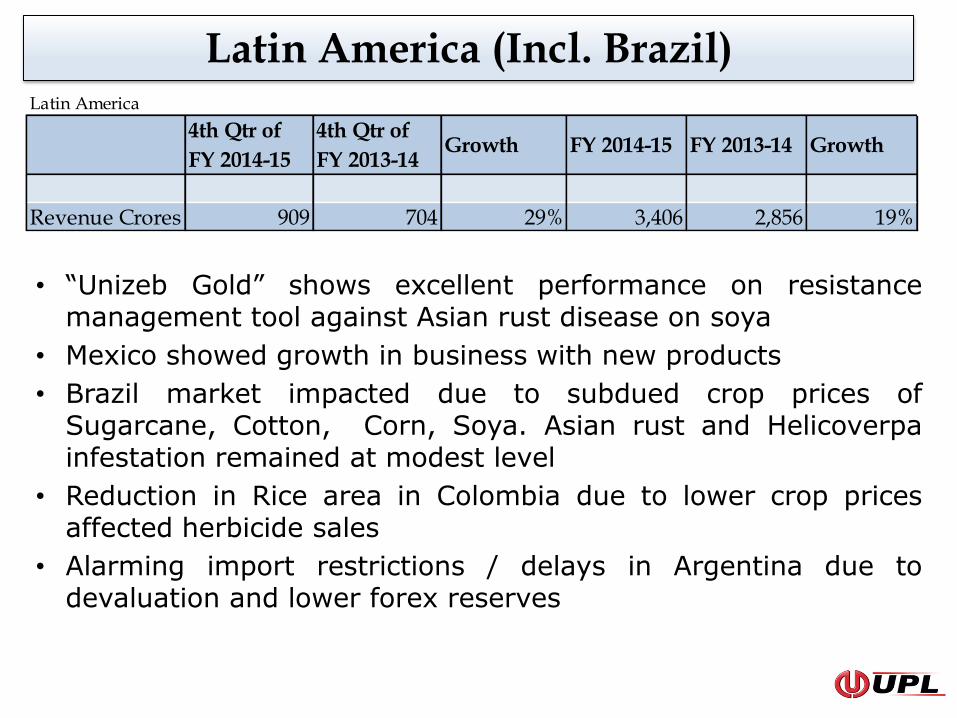
Latin America (Incl. Brazil) Latin America
4th Qtr of
FY 2014-15
4th Qtr of
FY 2013-14Growth FY 2014-15 FY 2013-14 Growth
Revenue Crores 909 704 29% 3,406 2,856 19%
• “Unizeb Gold” shows excellent performance on resistance management tool against Asian rust disease on soya
• Mexico showed growth in business with new products
• Brazil market impacted due to subdued crop prices of Sugarcane, Cotton, Corn, Soya. Asian rust and Helicoverpa infestation remained at modest level
• Reduction in Rice area in Colombia due to lower crop prices affected herbicide sales
• Alarming import restrictions / delays in Argentina due to devaluation and lower forex reserves

Europe Europe
4th Qtr of
FY 2014-15
4th Qtr of
FY 2013-14Growth FY 2014-15 FY 2013-14 Growth
Revenue Crores 805 892 -10% 2,033 2,016 1%
• Significantly impacted by currency devaluation – overall growth of 5% and exchange impact of -4.2%
• Early summer - but low disease pressure on potatoes. Cereal fungicides performed well
• Good harvest of Wheat, Potato, OSR, Sugar beet due to favorable summer
• Copper and Sulphur based portfolio performed well for demand in organic farming
• Export ban to Russia affected potato and fruits and added to price pressure
• Russia and Ukraine business affected by sanctions and unfavorable trading conditions

RoW Rest of world
4th Qtr of
FY 2014-15
4th Qtr of
FY 2013-14Growth FY 2014-15 FY 2013-14 Growth
Revenue Crores 648 574 13% 1,771 1,532 16%
• Excellent program in Philippines (on banana) and Indonesia (on rice) with new products
• New herbicide (Glufosinate) supported growth mainly in Asia
• Australian business showed improvement in FY 2015
• Increased market access through new registrations in Africa
• Regulatory stalemate still continues in Thailand and Vietnam affecting new product launches

North America North America
4th Qtr of
FY 2014-15
4th Qtr of
FY 2013-14Growth FY 2014-15 FY 2013-14 Growth
Revenue Crores 861 789 9% 2,259 2,122 6%
• Increase in Soya, Rice and Groundnut - though reduction in Corn area
• New product launches: Lifeline and Satellite helping growth in key segments and improved access to large customers
• Herbicide portfolio will open up opportunity for “Resistance Weed Management” in Horticulture and Field crops
• Expansion plan being implemented in Mid-West with new products
• Post Harvest segment did good business specially on Apple

Working Capital Analysis

Financial Results April–March’15 in crores
ParticularsQuarter
ended
31.03.2015
Quarter
ended
31.12.2014
Quarter
ended
31.03.2014
Year
ended
31.03.2015
Year
ended
31.03.2014(Audited) (Unaudited) (Audited) (Audited) (Audited)
Incomea) Net Sales 3,563 3,010 3,296 11,911 10,580
b) Other Income from Operations 61 37 42 180 191
Total Income 3,624 3,047 3,339 12,091 10,771
Expenditure
a) Consumption of RM, PM, TR goods 1,861 1,541 1,726 6,016 5,441
b) Employee benefits expenses 271 264 225 1,043 948
c) Depreciation / Amortisation 103 109 119 425 407
d) Other Expenses 708 667 716 2,669 2,364
Total 2,943 2,581 2,787 10,153 9,160
Profit from Operations before Oth Inc, Fin cost & Excep items 681 466 552 1,938 1,611
Other Income (49) 14 26 (3) 131
Profit from Operations before Interest and Exceptional items 632 480 578 1,935 1,742
Interest and Finance Cost 122 138 119 517 485
Profit after Interest but before Exceptional Items 510 342 459 1,418 1,257
Exceptional Items 13 16 26 3 85
Profit from Ordinary Activities before Tax 497 325 434 1,415 1,172
Prior Period Adjustments (4) 2 16 5 16
Profit from Ordinary Activities before Tax 501 323 418 1,410 1,156
Tax expense 50 60 44 244 222
Net Profit from Ordinary Activities after Tax 451 263 374 1,166 934
Less : Minority Interest 3 23 16 43 6
Add : Share of Profit from Associate Co (8) 9 1 21 22
Net Profit After Tax with Income from Associate Co. 440 249 360 1,144 950


