Topic 06 – Kinetics 6.2a: Collision theory 6.2B: Maxwell-Boltzmann & Catalysts

©
Investor Update 2018 2016 – 2020 Value & Resilience
February 2018
©
Disclaimer
2
ALL RIGHTS ARE RESERVED
© REPSOL, S.A. 2018
Repsol, S.A. is the exclusive owner of this document. No part of this document may be reproduced (including photocopying), stored, duplicated, copied, distributed or introduced into a retrieval system of any nature or transmitted in any form or by any means without the prior written permission of Repsol,
S.A.
This document contains statements that Repsol believes constitute forward-looking statements which may include statements regarding the intent, belief,
or current expectations of Repsol and its management, including statements with respect to trends affecting Repsol’s financial condition, financial ratios,
results of operations, business, strategy, geographic concentration, production volume and reserves, capital expenditures, costs savings, investments and
dividend payout policies. These forward-looking statements may also include assumptions regarding future economic and other conditions, such as future crude oil and other prices, refining and marketing margins and exchange rates and are generally identified by the words “expects”, “anticipates”, “forecasts”,
“believes”, estimates”, “notices” and similar expressions. These statements are not guarantees of future performance, prices, margins, exchange rates or other events and are subject to material risks, uncertainties, changes and other factors which may be beyond Repsol’s control or may be difficult to predict.
Within those risks are those factors and circumstances described in the filings made by Repsol and its affiliates with the Comisión Nacional del Mercado de Valores and with any other supervisory authority of those markets where the securities issued by Repsol and/or its affiliates are listed.
This document mentions resources which do not constitute proved reserves and will be recognized as such when they comply with the formal conditions
required by the system “SPE/WPC/AAPG/SPEE Petroleum Resources Management System” (SPE-PRMS) (SPE – Society of Pretroleum Engineers).
Repsol does not undertake to publicly update or revise these forward-looking statements even if experience or future changes make it clear that the projected performance, conditions or events expressed or implied therein will not be realized.
This document does not constitute an offer or invitation to purchase or subscribe shares, pursuant to the provisions of the Royal Legislative Decree 4/2015 of the 23rd of October approving the recast text of the Spanish Securities Market Law and its implementing regulations. In addition, this document does not
constitute an offer to purchase, sell, or exchange, neither a request for an offer of purchase, sale or exchange of securities in any other jurisdiction.
In October 2015, the European Securities Markets Authority (ESMA) published the Guidelines on Alternative Performance Measures (APM), of mandatory
application for the regulated information to be published from 3 July 2016. Information and disclosures related to APM used on the present document are included in Appendix I “Alternative Performance Measures” of the Management Report for the full year 2017.
The information contained in the document has not been verified or revised by the Auditors of Repsol.

© 3
2016-2020 Value & Resilience
1. Company overview
2. 2017 results and strategic delivery
3. Upstream update
4. Downstream update
5. Financing
6. 2018 objectives and strategic update
7. Annex – databook
3

© 4
Company overview 1 4

© 5
Through the value chain and across the globe
~700 kboepd production
~1 Million bpd refining capacity
Core businesses: Upstream and Downstream
~2.4 billion boe proved reserves (1)
(1) As at 31/12/2017 (2) As of 21/02/2018
Company overview
Our shareholders
Caixabank S.A.
Sacyr Vallehermoso, S.A.
Temasek
Free Float
78.6%
9.5%
7.9%
4.0%
(2)

©
Challenge: a volatile, uncertain and complex environment
• Keep financial and operating discipline: synergies and efficiencies
• Consolidate and extract the current
value of our assets • Manage portfolio to capture maximum
value • Review of projects with a long-term
pay back • Be ready to diversify/adapt traditional
businesses
Long term value capture
• Capex flexibility • Portfolio rationalization
• Synergies and company-wide Efficiency Program
• Shift from growth to value delivery
• Competitive and sustainable shareholder remuneration
• Integrated model • Self-financing strategy even
in a stress scenario • FCF breakeven reduction
Transformation Program
Efficiency
Portfolio Management
Value
Resilience
Strategic Plan 2016-2020
2016 to 2020: Value and Resilience Company overview
6
Strategic update scheduled for June 2018
©
Company overview
Production 2016: ~98 kboepd
Production 2017E: ~90 kboepd
Operatorship: ~37%
Gas production (2016): 77%
• Self-financed growth
• Relationship with governments/NOCs
• High potential exploration blocks
SouthEast Asia: FCF & Growth
(*)
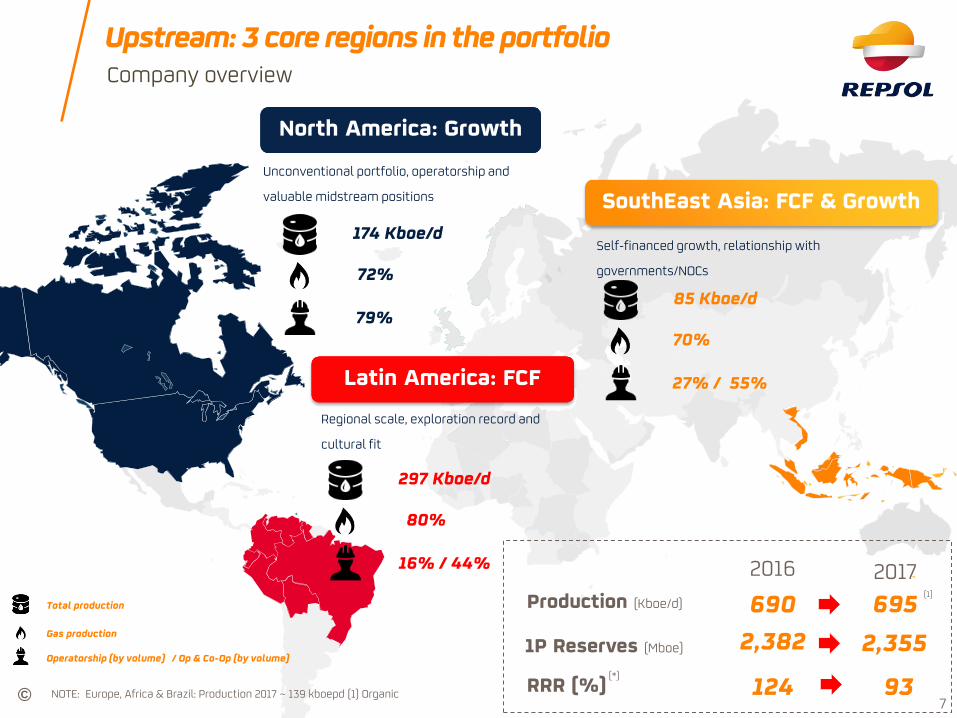
Upstream: 3 core regions in the portfolio
NOTE: Europe, Africa & Brazil: Production 2017 ~ 139 kboepd (1) Organic
1P Reserves (Mboe)
2016
2,382
2017
RRR (%) 93
Production (Kboe/d)
690 695
124
Unconventional portfolio, operatorship and
valuable midstream positions
(1)
(*)
7
174 Kboe/d
72%
79%
Total production
Gas production
Regional scale, exploration record and
cultural fit
297 Kboe/d
80%
16% / 44%
Self-financed growth, relationship with
governments/NOCs
85 Kboe/d
70%
27% / 55%
SouthEast Asia: FCF & Growth
Latin America: FCF
North America: Growth
2,355 Operatorship (by volume) / Op & Co-Op (by volume)

©
DOWNSTREAM
Refining Petrochemicals
LPG Marketing
1 million barrels of refining capacity per day.
Top quartile position among European peers along the cycle.
63 % FCC equivalent.
5 refineries optimized as a single operation system.
3,445 service stations in Spain → 70% have a strong link to the company and 27% directly managed .
4,709 service stations throughout Spain, Portugal, Peru, and Italy.
CARTAGENA
CORUÑA BILBAO
TARRAGONA
PUERTOLLANO
Oil pipelines CLH Oil pipeline Repsol
Trading and G&P
Logistic flexibility to enhance competitive feedstock imports at Tarragona and Sines.
All three sites are managed as a single petrochemical hub
G&P: transportation, marketing, trading and regasification of liquefied natural gas.
One of the leading retail distributors of LPG in Spain and Portugal.
Distribution of LPG in bottles, in bulk and
AutoGas.
Chemical sites and crackers strategically located to supply Southern Europe and Mediterranean markets.
Trading & Transport: trading and supply of crude oil and products
8
Downstream: Sustainable cash flow generator Company overview
Objective to generate FCF €1.7B per annum (average 2016-2020)
Peru
La Pampilla

©
Gas Natural Fenosa – divestment at february 2018 Company overview
9
Premium to market price at 19€/share
8.7x EV/EBITDA 2017
€3.8Bn proceeds
20% stake sold – Value crystalized
Above comparable trading multiples
Around 400 M€ of capital gains
Guidelines for redeployment of capital
Aim to build a higher return portfolio with a greater level of control.
Prudent reinvestment looking to obtain higher returns and clear synergies:
Grow our organic opportunities
Open for accretive acquisitions
Leverage our capabilities and existing client base

©
2 2017 Strategic Delivery & Results
10

©
2017 Results 2017 Strategic Delivery & Results
11
55.0 USD/Bbl
Brent
3.2
Henry Hub
3.2-3.6
3.0
Bn€
Capex
USD/MBtu 54.2 3.1
1.05 1.13 USD/€
Exchange rate
Main variables & company targets
2017 2017 Budget 2017 2017 Budget
2017 2017 Budget 2017 2017 Budget
43.7
1.11
2016
2016
2.5
3.4
2016
2016
(1)
(1) Capex is equivalent to payments for investments in the Management report

©
2017 Results 2017 Strategic Delivery & Results
12
~6.5 Bn€
EBITDA CCS
2.1
Synergies and efficiencies
1.1 0.9
(X)
Net Debt/EBITDA
Bn€ 6.6 ~2.4
40 <40
USD/Bbl
FCF Break Even
Main variables & company targets
2017 2017 Budget 2017 2017 Budget
2017 2017 Budget 2017 2017 Budget
5.0
~42
2016
2016
1.6
1.6
2016
2016

©
2017 Results 2017 Strategic Delivery & Results
13
~680 Kboe/d
Production volumes
~100
Organic Reserve Replacement Ratio (RRR)
1.7 1.7 Bn€
Organic FCF
% 695 93
6.4 6.8 USD/Bbl
Refining margin indicator
Upstream
2017 2017 Budget 2017 2017 Budget
2017 2017 Budget 2017 2017 Budget
690
6.3
2016
2016
124
1.5
2016
2016
Downstream
(1)
(1) Long term average target 100%
(2)
(2) Objective to generate FCF ~ €1,7 Bn per annum (average 2016-2020). Excluding divestments

©
2017 Results : 1.9 Bn€ of Net Debt reduction at 54 USD/Bbl 2017 Strategic Delivery & Results
14
Bn€
Operating Cash Flow
Capex Financial expenses
Others Reduction of net debt
Dividends & other equity instruments
Net Debt (M€)
2017
ND/EBITDA (X) 0.9
6.3
5.5
(3.0)
(0.5)
(0.3) 0.2
1.9
Rated BBB stable by the three credit rating agencies
2016
1.6
8.1
2015
2.7
11.9
(1)
(1) It includes the advance payments from 2017 Corporate Tax and the collection of €684 million for 2016 Corporate Tax settlement (2) Divestments, exchange rate and others
(2)
©
IMP
LEM
EN
TATIO
N
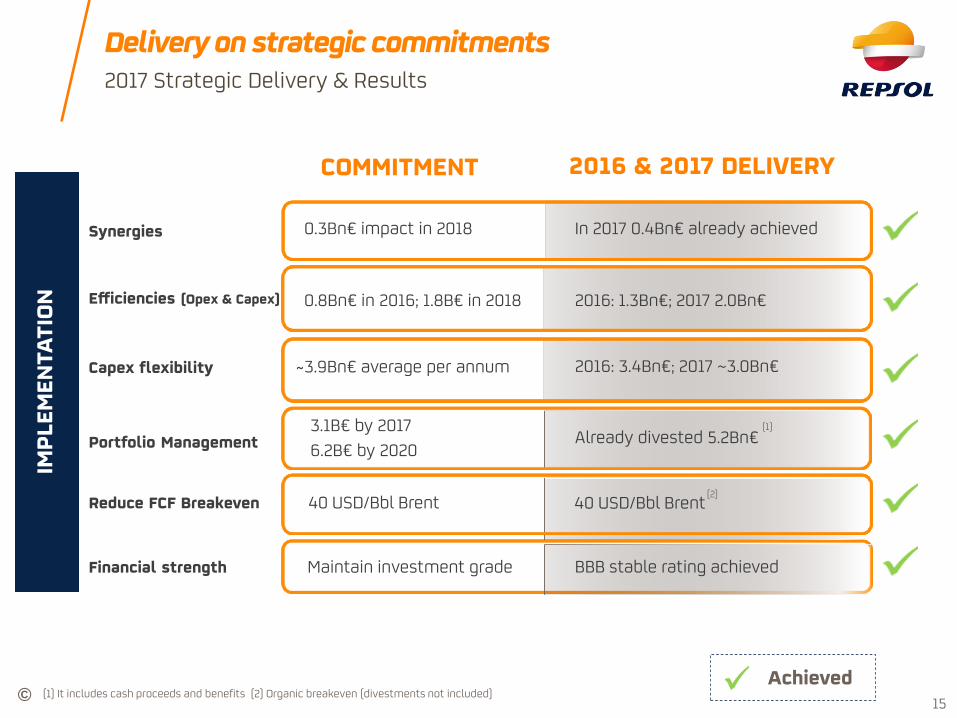
COMMITMENT 2016 & 2017 DELIVERY
Capex flexibility
Portfolio Management
Financial strength
Reduce FCF Breakeven
Efficiencies (Opex & Capex)
Synergies
40 USD/Bbl Brent
BBB stable rating achieved
Already divested 5.2Bn€ 3.1B€ by 2017
3.9Bn€ average per annum
In 2017 0.4Bn€ already achieved 0.3Bn€ impact in 2018
2016: 1.3Bn€; 2017 2.0Bn€ 0.8Bn€ in 2016; 1.8B€ in 2018
40 USD/Bbl Brent
Delivery on strategic commitments 2017 Strategic Delivery & Results
Achieved
2016: 3.4Bn€; 2017 ~3.0Bn€
Maintain investment grade
6.2B€ by 2020
15
(1)
(1) It includes cash proceeds and benefits (2) Organic breakeven (divestments not included)
(2)

©
3 Upstream update 16

©
2017 Upstream Results
1P Reserves (Mboe)
2016
2,382
2017
2,355
Production (Kboed) 695
Upstream
690
2015
2,373
559
(1) 3 year Organic average (2) Tagi, F1
RRR 3 year average (%) 123 (1)
EBITDA (Bn€) Opex (USD/Boe)
1.6 2.1 3.5
2015 2016 2017
18.3
12.3
First Oil / First Gas Final Investment Decision
Flyndre (UK)
Angelin (T&T)
Shaw / Caley (UK)
Red Emperor (Vietnam)
Buckskin (USA)
Sagari (Peru)
YME (Norway)
Kinabalu (Malaysia)
Juniper (T&T)
Reganne (Algeria)
Operational data & Results
2017 Projects - Delivered
~720 Kboe/d production in
December
33%
17
MLN (Algeria)
(2)
© 18
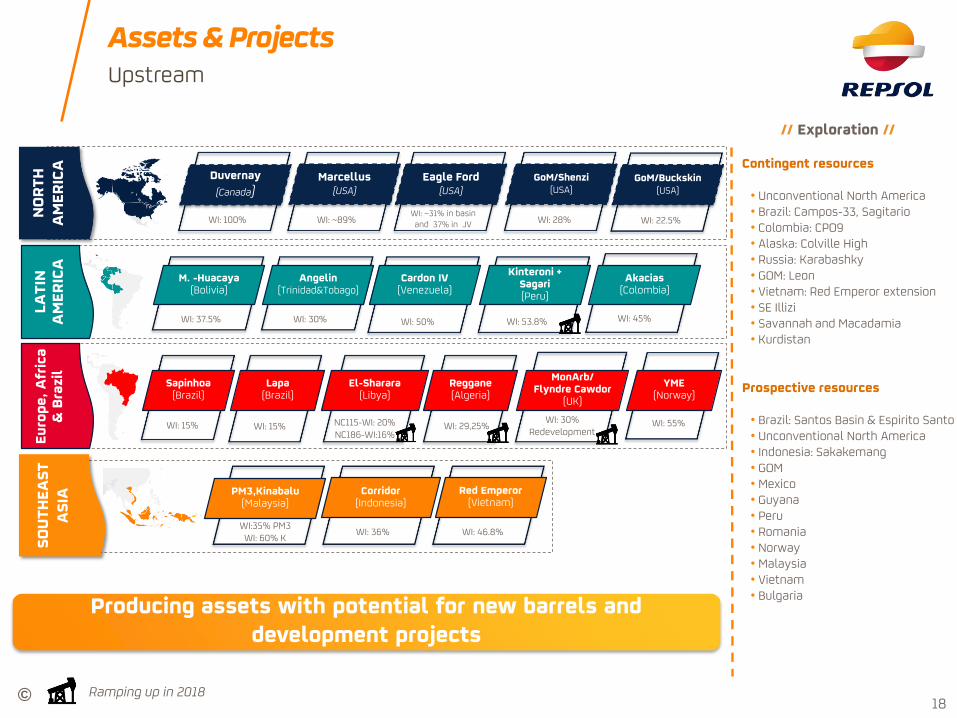
Assets & Projects Upstream
Contingent resources • Unconventional North America • Brazil: Campos-33, Sagitario • Colombia: CPO9 • Alaska: Colville High • Russia: Karabashky • GOM: Leon • Vietnam: Red Emperor extension • SE Illizi • Savannah and Macadamia • Kurdistan
Prospective resources • Brazil: Santos Basin & Espirito Santo • Unconventional North America • Indonesia: Sakakemang • GOM • Mexico • Guyana • Peru • Romania • Norway • Malaysia • Vietnam • Bulgaria
// Exploration //
Ramping up in 2018
Producing assets with potential for new barrels and development projects
Duvernay
(Canada)
WI: 100%
Marcellus (USA)
WI: ~89%
Eagle Ford (USA)
WI: ~31% in basin and 37% in JV
GoM/Shenzi(USA)
WI: 28%
NO
RTH
A
MER
ICA
M. -Huacaya(Bolivia)
WI: 37.5%
Angelin(Trinidad&Tobago)
WI: 30%
Cardon IV (Venezuela)
WI: 50%
Kinteroni + Sagari(Peru)
WI: 53.8%
LA
TIN
A
MER
ICA
Akacias(Colombia)
WI: 45%
Sapinhoa(Brazil)
WI: 15%
Lapa(Brazil)
WI: 15%
El-Sharara(Libya)
NC115-WI: 20%NC186-WI:16%
Reggane (Algeria)
WI: 29,25%
Euro
pe, A
fric
a
& B
razi
l MonArb/Flyndre Cawdor
(UK)
WI: 30%Redevelopment
PM3,Kinabalu(Malaysia)
WI:35% PM3WI: 60% K
Corridor(Indonesia)
WI: 36%
Red Emperor(Vietnam)
WI: 46.8%
SO
UTH
EA
ST
AS
IA
GoM/Buckskin (USA)
WI: 22.5%
YME (Norway)
WI: 55%

©
ACDC + 1 - Alaska Upstream update
Largest U.S. onshore conventional hydrocarbons discovery in 30 years.
Prior to drilling Horseshoe, Repsol as operator drilled 13 exploration and appraisal wells on the North Slope,
which led to multiple reservoir discoveries. Pikka Unit development is based on Nanushuk reservoir.
Alaska has significant infrastructure which allows new resources to be developed more efficiently.
Main data Location map
Project Alaska
Country USA
Operator Armstrong
Working Interest (Pikka) 49%
Working Interest (Horseshoe) 25%
Final Investment Decision 2019/2020
First Oil / First Gas 2023/2024
Contingent resources (Mboe) 1,200
Gross peak production (Kboed) ~120
19
Appraisal AreaArmstrong Op.(51%) Repsol (49%)*Oil Search Op. (25.5%) Armstrong (25.5%)
Exploration BlocksRepsol (49%)*Oil Search Op. (51%)
Pikka Unit Limits
Horseshoe Well 2017
ConocoPhillips 2018 Nanushuk
wells
Repsol 100% op

©
ACDC + 1 - Akacias Upstream update
Main data Location map
Project Akacias (CPO9)
Country Colombia
Operator Ecopetrol
Working Interest 45%
FID (1st/2nd stage) 1Q18/1Q19
First Oil / First Gas Producing
Gross plateau production (Kboed) ~50
Onshore heavy oil discovery operated by Ecopetrol.
Akacias proved to be same field as nearby Chichimene. Existing infrastructure has allowed approval of 1st
stage development to reach 16 kboed gross next year.
Full field development plan update to be agreed with Ecopetrol
Further Contingent resources / exploration upside in the block. 20
(1)
(1) FID: Final Investment Decision. Dates estimated
©
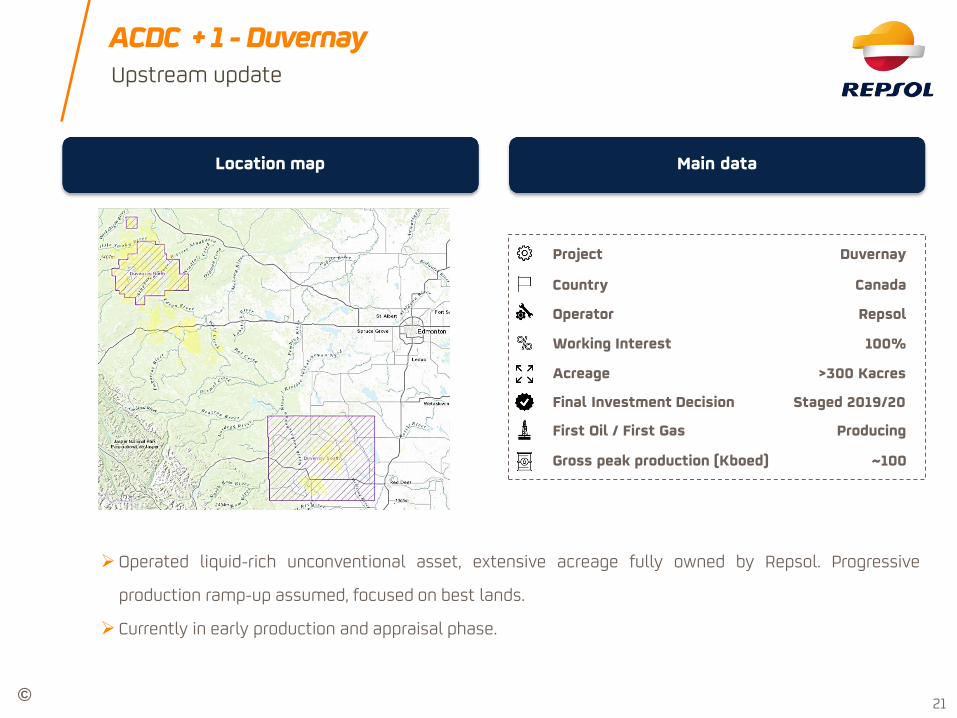
ACDC + 1 - Duvernay Upstream update
Main data Location map
Project Duvernay
Country Canada
Operator Repsol
Working Interest 100%
Acreage >300 Kacres
Final Investment Decision Staged 2019/20
First Oil / First Gas Producing
Gross peak production (Kboed) ~100
Operated liquid-rich unconventional asset, extensive acreage fully owned by Repsol. Progressive
production ramp-up assumed, focused on best lands.
Currently in early production and appraisal phase.
21
©
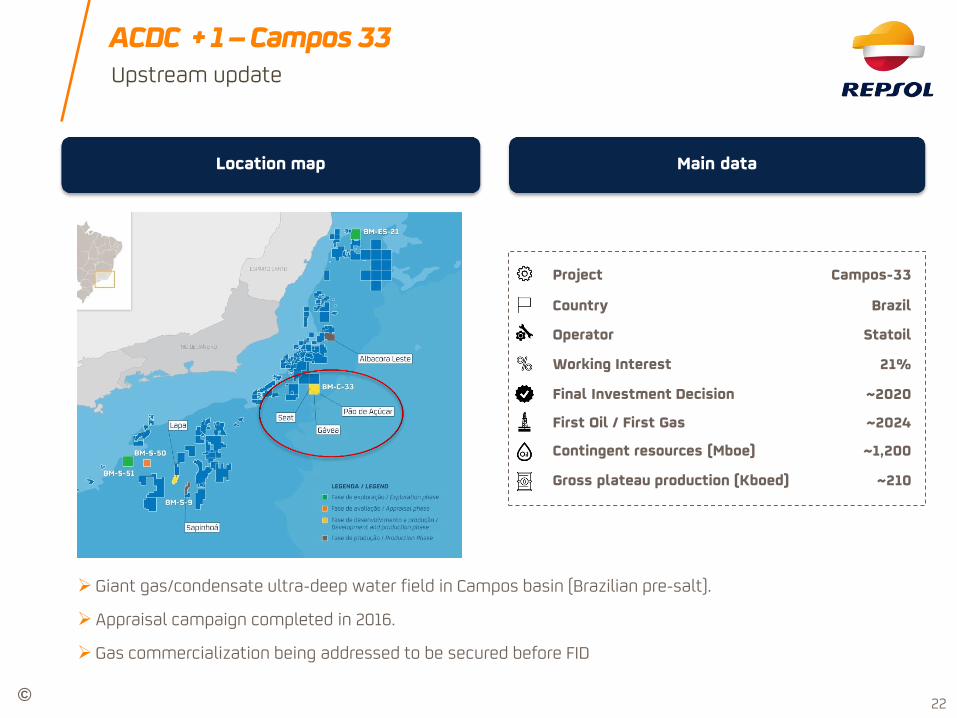
ACDC + 1 – Campos 33 Upstream update
Main data Location map
Project Campos-33
Country Brazil
Operator Statoil
Working Interest 21%
Final Investment Decision ~2020
First Oil / First Gas ~2024
Gross plateau production (Kboed) ~210
Giant gas/condensate ultra-deep water field in Campos basin (Brazilian pre-salt).
Appraisal campaign completed in 2016.
Gas commercialization being addressed to be secured before FID
Contingent resources (Mboe) ~1,200
22

©
ACDC + 1 – Sagitario Upstream update
Main data Location map
Project Sagitario (BM-S-50)
Country Brazil
Operator Petrobras
Working Interest 12%
Discovery announced in 2014 located in ultra-deep waters of the Santos Basin pre-salt. The test revealed
carbonate reservoirs with good permeability, 159 meters of pre-salt reservoirs bearing good quality oil
(32º API)
3D seismic processed in 2018, appraisal well expected for 1Q19.
Contingent resources (Mboe) -
Sagitario
23

© (1) 2020 guidance
9%
33%
23%
35%
Strategic Context Upstream update
Volumes CAPEX
690 695 750
2016 2017 2020
Organic portfolio potential
Kboe/d
2.4 2.1 2.5-3.0
2016 2017 2018-2020
Bn€
Reserve Replacement Ratio Production 16-20: 3 Regions & 3 play types
Non-operator offshore deep
Offshore-shallow waters
Unconventional
Onshore core plays
~90% of the production from core areas 2016-2020
North America
Latin America
South East Asia
124 93 100
2016 2017 2016-2020
%
Hurdle rate new projects: NPV = 0 with Brent < 50 USD/Bbl
24
(4)
(3) Excluding AC/DC+1 full field developments
(2) Capex is equivalent to payments for investments in the Management report
(4) Long term average target 100%
(3)
Core
(1)
(2)

25
Downstream update
4
25

©
2017 Downstream Results Downstream update
26
Indicator Refining Margin & Brent Utilization: Distillation and conversion
EBITDA & CAPEX FCF & Divestments
RMI (USD/Bbl) Brent (USD/Bbl)
8.5 6.3 6.8
52.4
43.7
54.2
2015 2016 2017
Distillation Conversion
2017
2016
2015
104.4% 93.6%
102.9% 88.0%
103.7% 88.9%
EBITDA CCS (Bn€) Capex (Bn€)
3.8
3.2 3.2
2015 2016 2017
0.9 0.7 0.8
Organic FCF (Bn€) Divestments (Bn€)
2015 2016 2017
0.5
1.2
1.7 1.5
3.1
(1)
(1) Capex is equivalent to payments for investments in the Management report
©
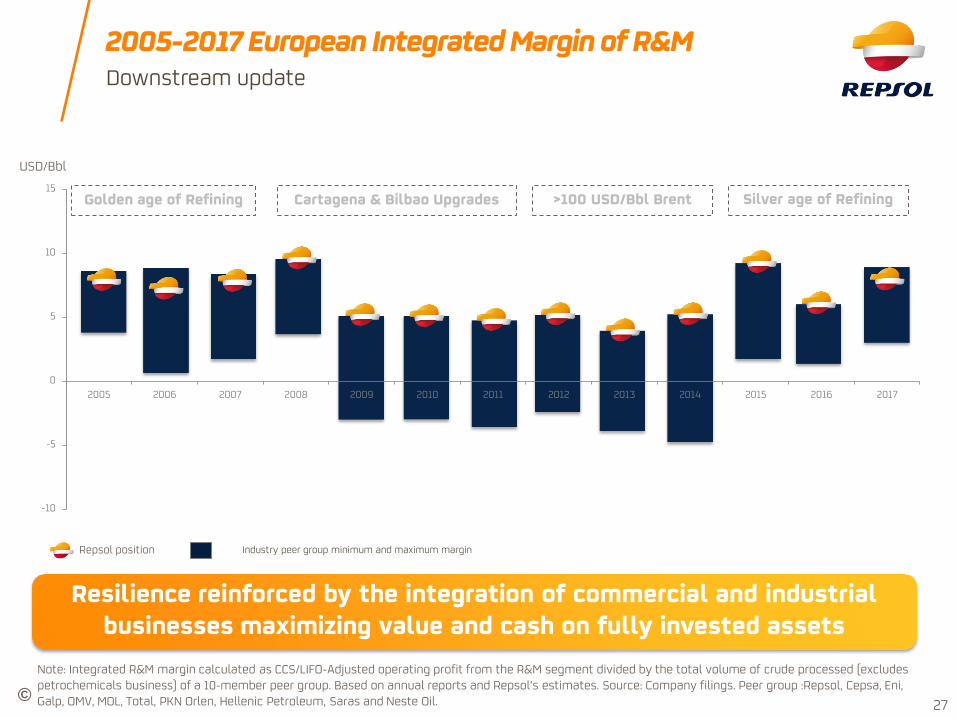
-10
-5
0
5
10
15
2005 2006 2007 2008 2009 2010 2011 2012 2013 2014 2015 2016 2017
USD/Bbl
27
Note: Integrated R&M margin calculated as CCS/LIFO-Adjusted operating profit from the R&M segment divided by the total volume of crude processed (excludes petrochemicals business) of a 10-member peer group. Based on annual reports and Repsol’s estimates. Source: Company filings. Peer group :Repsol, Cepsa, Eni, Galp, OMV, MOL, Total, PKN Orlen, Hellenic Petroleum, Saras and Neste Oil.
Repsol position Industry peer group minimum and maximum margin
Downstream update
2005-2017 European Integrated Margin of R&M
Resilience reinforced by the integration of commercial and industrial businesses maximizing value and cash on fully invested assets
Golden age of Refining Cartagena & Bilbao Upgrades >100 USD/Bbl Brent Silver age of Refining

© 28
Refining : top quartile position among European peers Downstream update
CARTAGENA
CORUÑA BILBAO
TARRAGONA
PUERTOLLANO
Oil pipeline Repsol
5 refineries optimized as a single system Top quartile position among European peers
Competitors refineries at risk in Europe Middle distillates deficit
Oil pipelines CLH
Obsolescence Market Accessibility
• Local Markets: 20% (Med / Nordic countries)
• Simple configuration: 60%
• Small size: 10% • Exports logistics: 10%
(1)
(1) Source: WoodMackenzie as of 31/12/2016 (2) Source: IHS Markit as of 31/12/2016 Main countries with deficit Middle distillates deficit (MTn)
(2)
France 23.4
Germany 15.7
Turkey 10.1
UK 18.0 Ireland
4.0
Austria 4.3
Switzerland 5.5
Diesel/Gasoil 40-45%
Gasoline 10-15%
Naphta 10-12%
Kerosene 4-7%
Coke 7-8%
Residual fuel oil 3-6%
LPG 2-4%
Others 15%
Product Yield
Morocco 6.2
Tunisia 1.8
~22 Refineries at risk ~2.4 MBbl/d of capacity at risk
0%
20%
40%
60%
80%
100%
0 2 4 6 8 10 12 14
Europe Mbpd
% FCC Equivalent
1Q 2Q 3Q 4Q

© 29
Chemicals Downstream update
Chemical specialties and synthetic rubber are produced through Dynasol a 50% partnership with Grupo KUO (Mexico).
Dynasol is a leader in the world synthetic rubber market and a global producer with plants in Europe, America, and Asia.
Competitive positioning, differentiated products and a customer-oriented organization
Iberian Peninsula petrochemical sites Dynasol Joint Venture
Tarragona
Puertollano
Sines
Petrochemical sites
3 Naphtha Crackers strategically located to supply Southern Europe and Mediterranean markets, managed as a single hub.
Feedstock flexibility and high integration with refining activities in the Spanish sites.
Products sold in over 90 countries; leading position in Iberian Peninsula.
Differentiated products such as EVA and metalocene polyethylene.
(!) Includes EVA and EBA copolymers (2) propylene oxide, polyols, glycols and styrene monomer
Production capacity (Thousand tons)
Base petrochemicals 2.603
Ethylene 1.214
Propylene 864
Butadiene 185
Benzene 290
ETBE/MTBE 50
Derivative petrochemicals 2.235
Poliolefins
Polyethylene (1) 793
Poliypropylene 505
Intermediate products (2 ) 937 Headquarters and Commercial Offices
Production Plants
Commercial Offices
Nanjing, China
Panjin, China
Madrid, Spain
Alava, Spain Santander, Spain
Houston, USA
Mexico City, Mexico
Altamira, Mexico

© 30
Marketing: retail distribution Downstream update
Service Stations
Lubricants, asphalts and specialized products
Aviation, Direct Sales and others
More than 400 scientists and researchers are responsible for designing and producing our lubricants at the Repsol Technology Center.
Confirming the growth and consolidation strategy, over 50% of sales of lubricant, asphalt and
specialized products are made in the international market through operations in over 90 countries and with 73 international lubricant distributors.
Spain Portugal Peru Italy Mexico
Number
Market Share
3.445 464 490 310
31% 16% 22% 2%
New market opportunites
Direct sales leading position in Spain and second in Portugal Jet sales in Spain, Portugal and Perú. Relevant volume increase in 2017. Leading position in plane-
refueling through Servicios Logísticos de Combustibles de Aviación (SLCA) and Terminales Canarios, in which Repsol holds a 50% interest. Presence in the two main Spanish airports, Madrid-Barajas and Barcelona-El Prat.
Strength of coke business with sales in 45 countries.

©
5 Financing
31

© 32
Financing
Net debt evolution
(Billion €)
11.9
8.1 6.3
2.7
1.6
0.9
0.0
1.0
2.0
3.0
0
2
4
6
8
10
12
14
2015 2016 2017
(X)
47%
Net debt (Bn€) Net Debt/EBITDA (X) Net Debt reduction
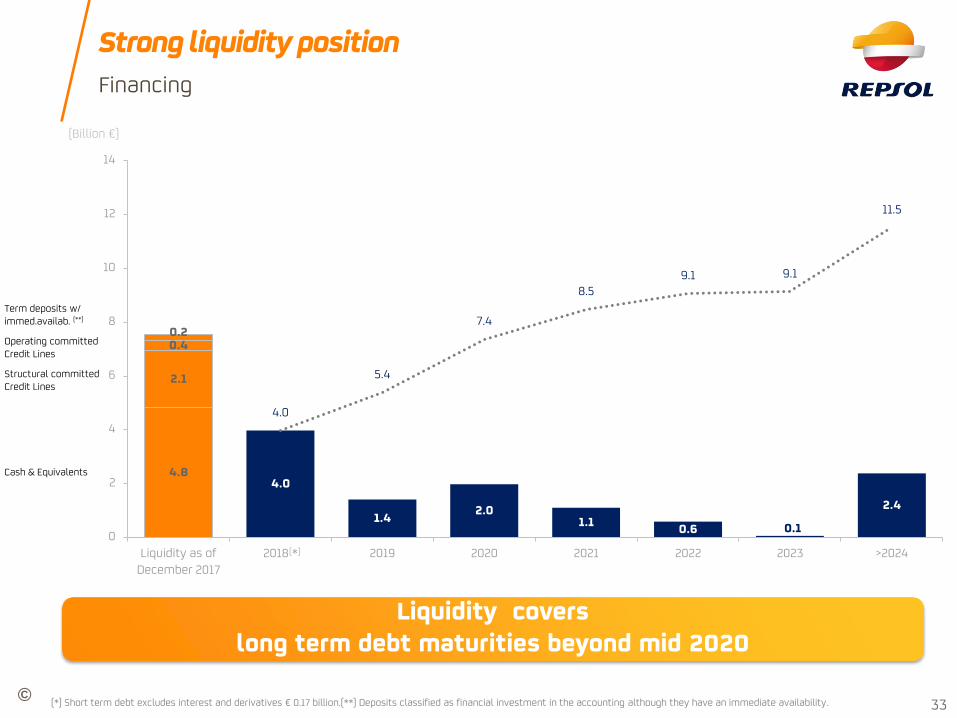
© 33
Financing
Strong liquidity position
(*) Short term debt excludes interest and derivatives € 0.17 billion.(**) Deposits classified as financial investment in the accounting although they have an immediate availability.
(Billion €)
Cash & Equivalents
Operating committed Credit Lines
Structural committed Credit Lines
Term deposits w/ immed.availab. (**)
4.8
2.1
0.4 0.2
4.0
1.4 2.0
1.1 0.6 0.1
2.4
4.0
5.4
7.4
8.5 9.1 9.1
11.5
0
2
4
6
8
10
12
14
Liquidity as of
December 2017
2018 * 2019 2020 2021 2022 2023 >2024
Liquidity covers long term debt maturities beyond mid 2020
( )

©
Industry Context
34
6 2018 Outlook

© 35
2018 Outlook & Strategic update
Outlook for 2018
Our assumptions
Brent price ($/Bbl) 59.0
2017 2018B
HH ($/MBtu) 3.1 3.5
54.2 Refining Margin ($/Bbl) 6.8
2017 2018B
Exchange rate ($/€) 1.13 1.16
6.8
Guidance
Production (KBoepd) >700
2017 2018B
Capex (Bn€) 3.0 3.4
695 FCF Breakeven ($/Bbl) 40
2017 2018B
EBITDA CCS (Bn€) 6.6 7.0
<40
(1) Budget (2) Long term objective, 50 USD/Bbl assuming full cash dividend
(2)
(1)
(3) Capex is equivalent to payments for investments in the Management report
(3)
©
Annex – databook 7

© 37
Historic data book
Environment and Repsol Group
International References Unit 2015 2016 2017 2015 2016 2017
Brent ($/Bbl) 52.4 43.7 54.2 Maya - Brent (13.8) (11.6) (9.7)
WTI ($/Bbl) 48.8 43.5 50.9 Ural - Brent (0.5) (1.2) (0.9)
Henry Hub ($/MBtu) 2.7 2.5 3.1 Gasoline - Brent 14.4 11.6 12.0
Average exchange rate ($/€) 1.11 1.11 1.13 Diesel - Brent 16.1 10.7 13.1
Algonquin ($/Mbtu) 4.8 3.1 3.7 Fuel oil - Brent (12.2) (11.3) (7.2)
Naphtha - Brent (1.0) (0.5) 0.4
Refining indicators Unit 2015 2016 2017
Refining margin indicator (Spain) $/bbl 8.5 6.3 6.8
Distillation utilization (Spain) % 88.9 88.0 93.6
Conversion utilization (Spain) % 103.7 102.9 104.4
Main figures (M€) 2015 2016 2017 Ratios Unit 2015 2016 2017
Adjusted Net Income 1,852 1,922 2,405 Net debt M€ (11,934) (8,144) (6,267)
EBIT 1,764 2,067 3,214 Net debt/Capital employed % 29.3 20.7 17.3
EBITDA CCS 5,112 5,032 6,580 Net debt/EBITDA CCS x 2.33 1.62 0.95
NET CAPEX 1 11,960 (500) 2,856
CAPITAL EMPLOYED 2 40,697 39,255 36,330 Credit metrics Rating Outlook
Upstream 23,275 23,853 21,612 Standard & Poor's BBB Stable
Downstream 9,758 9,469 9,749 Moody's Baa2 Stable
Corporate and others 7,664 5,933 4,969 Fitch BBB Stable
1 Includes 8,005 M€ of Talisman acquisition in Q2 152 Capital employed below 2.3 Bn€ in each single country
MACRO ENVIRONMENT
Last review
November 28, 2017
June 22, 2017
May 16, 2017
REPSOL GROUP
Spreads vs. Brent ($/bbl)

©
Upstream
Production 2016: ~98 kboepd
Production 2017E: ~90 kboepd
Operatorship: ~37%
Gas production (2016): 77%
• Self-financed growth
• Relationship with governments/NOCs
• High potential exploration blocks
SouthEast Asia: FCF & Growth
(*)
Historic data book
38
Main figures (M€) 2015 2016 2017
Adjusted Net Income (925) 52 632
EBIT (1,107) (87) 1,009
EBITDA 1,611 2,072 3,507
NET CAPEX 1 11,370 1,889 2,072
1 Includes 8,005 M€ of Talisman acquisition in Q2 15
2015 2016 2017
Organic RRR % 159 124 93
Mboe 2015 2016 2017 2015 2016 2017
Europe 10 19 19 51 62 59
Latin America 110 125 127 1,480 1,525 1,490
North America 51 67 63 520 496 504
Africa 5 6 14 128 125 128
Asia 28 36 31 194 174 174
Total 204 253 254 2,373 2,382 2,355
Realized prices
$/Boe 2015 2016 2017 2015 2016 2017
Europe 50.9 44.9 55.2 34.4 27.2 34.2
Latin America 44.0 37.1 47.0 14.5 11.0 13.3
North America 44.3 36.5 47.4 11.7 11.4 14.6
Africa 52.5 41.8 52.8 - - 27.1
Asia 43.0 39.4 51.2 27.5 25.1 29.6
Net Acreage
km2 2015 2016 2017 2015 2016 2017
Europe 1,312 1,230 1,199 31,622 28,344 15,373
Latin America 5,884 4,736 4,475 56,539 53,186 47,763
North America 6,442 5,316 5,234 20,456 17,342 5,503
Africa 2,709 2,744 2,744 57,930 54,794 22,389
Asia 4,319 4,638 4,105 88,277 109,560 96,598
Total 20,666 18,664 17,757 254,824 263,226 187,625
ExplorationDevelopment
Production Proven reserves
Oil Gas

©
Downstream
Production 2016: ~98 kboepd
Production 2017E: ~90 kboepd
Operatorship: ~37%
Gas production (2016): 77%
• Self-financed growth
• Relationship with governments/NOCs
• High potential exploration blocks
SouthEast Asia: FCF & Growth
(*)
Historic data book
39
RefiningRefining capacity
(kbbl/d)Converson index (%) Businesss Unit 2015 2016 2017
Spain 896 63 Refining
Bilbao (Petronor) 220 63 Distillation utilization % 86.7 86.0 93.2
Tarragona 186 44 Spain % 88.9 88.0 93.6
Coruña 120 66 Peru % 67.6 68.9 89.8
Puertollano 150 66 Conversion utilization Spain % 103.7 102.9 104.4
Cartagena 220 76 Processed crude oil Mtoe 43.3 43.2 47.4
Peru 117 24 Spain Mtoe 39.8 39.4 41.9
Peru Mtoe 3.5 3.8 5.4
Marketing Service stations (no.) Marketing
Total 4,709 Sales of oil products kt 47,605 48,048 51,836
Spain 3,445 Europe Sales kt 43,019 42,787 45,081
Portugal 464 Own network kt 21,124 20,468 21,186
Peru 490 Rest kt 4,586 5,261 6,755
Italy 310 Own network kt 2,073 2,238 2,288
Petrochemicals
Petrochemical Capacity (Kt/year) Basic kt 948 994 978
Derivatives kt 1,874 1,898 1,877
Ethylene 1,214 Total Sales kt 2,822 2,892 2,855
Propylene 864 Europe kt 2,396 2,428 2,412
Butadiene 185 Rest of the world kt 426 464 443
Benzene 290 LPG
Polyolefins 2,235 LPG sales kt 2,260 1,747 1,375
Europe kt 1,285 1,261 1,356
Rest of the world kt 975 487 19
Gas & Power
Gas Sales in North America Tbtu 299 414 496
LNG regasified (100%) in Canaport Tbtu 23 16 15
Downstream Assets
©
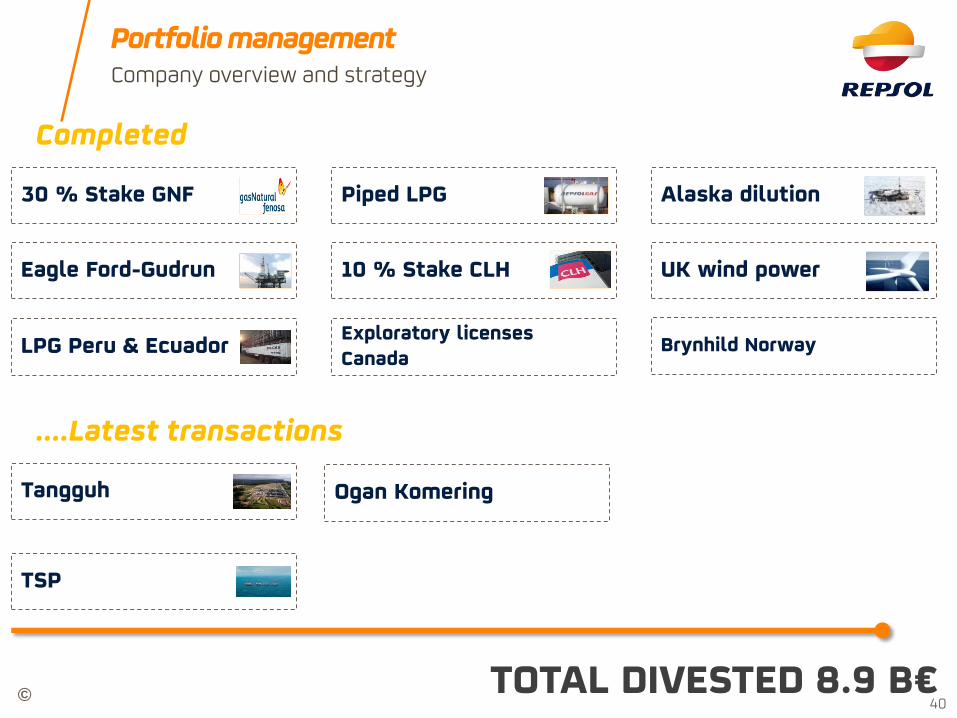
Portfolio management Company overview and strategy
30 % Stake GNF
….Latest transactions
TOTAL DIVESTED 8.9 B€
Completed
Eagle Ford-Gudrun
LPG Peru & Ecuador
Piped LPG
10 % Stake CLH
Exploratory licenses Canada
Alaska dilution
UK wind power
Brynhild Norway
Tangguh
TSP
40
Ogan Komering

©
Investor Update 2018 2016 – 2020 Value & Resilience
February 2018