Investor Report 1 1Q 11 - GEB Report 1Q 11 1 ... EEB is moving forward with its approximately USD...
21
Investor Report 1Q 11 1 Contact: Juan Felipe González Rivera Telephone: 571 3268000 ext 1546 E mail: [email protected] Bogota, Colombia, June 2011 Index Executive summary and highlights Performance of controlled subsidiaries. EEB transmission. TGI. DECSA – EEC. Performance of Non - Controlled investments. Emgesa. Codensa. Gas Natural. REP and CTM. EEB financial performance - consolidated. Annex 1: Legal notice and clarifications. Annex 2: EEB´s consolidated and stand alone financial statements. Annex 3: Overview of EEB Annex 4: Technical and regulatory terms. Annex 5: EBITDA LTM reconciliation. Annex 6: Tables and graphics’ footnotes.
Transcript of Investor Report 1 1Q 11 - GEB Report 1Q 11 1 ... EEB is moving forward with its approximately USD...
Investor Report
1Q 11
1
Contact: Juan Felipe González Rivera
Telephone: 571 3268000 ext 1546
E mail: [email protected]
Bogota, Colombia, June 2011
Index
Executive summary and highlights
Performance of controlled subsidiaries.
EEB transmission.
TGI.
DECSA – EEC.
Performance of Non - Controlled investments.
Emgesa.
Codensa.
Gas Natural.
REP and CTM.
EEB financial performance - consolidated.
Annex 1: Legal notice and clarifications.
Annex 2: EEB´s consolidated and stand alone financial statements.
Annex 3: Overview of EEB
Annex 4: Technical and regulatory terms.
Annex 5: EBITDA LTM reconciliation.
Annex 6: Tables and graphics’ footnotes.
Investor Report
1Q 11
2
Contact: Juan Felipe González Rivera
Telephone: 571 3268000 ext 1546
E mail: [email protected]
Executive summary and highlights
Table No 2 - Overview of the natural gas sector Colombia Peru Proven and probable reserves - TPC 7.6 15.9 Demand as of 4Q 10 - mm cfd 849 245 Demand growth 10/09 - % -18 20 Growth drivers as of 4Q 10 Lower demand from the thermo
generation industry due to the dissipation of El Niño
Strong demand growth from industrial and vehicular sectors
Sources: UPME; CNO; MEM - Peru
Table No 3 - Summary of EEB´s expansion projects
Project / company Country Sector Capex USD
Mm Status In operation:
Guajira - TGI Colombia Natural gas transportation 195 In operation In operation Cusiana I - TGI Colombia Natural gas transportation 171 In operation In operation Cusiana II - TGI Colombia Natural gas transportation 199 Under construction 4Q 11 ICA Peru - ConTUgas Peru Natural gas transportation
and distribution 280 Under construction. 3Q 13
Guatemala - TRECSA Guatemala Electricity transmission 373 Under construction 4Q 13
Reactors – EEB Colombia Electricity transmission 7 Under construction 1Q 12
Table No 1 – Overview of the electricity sector Colombia Peru Guatemala Installed capacity – MW 13,496 7,158 2,067 Demand 2010 - GWh 13,827 8,603 2,043 * Demand growth 10/09 % -0.4% 10% 3.65 * Growth drivers 2010 The transition from El Niño -
2010 to La Nina - 2011 - hit the regulated demand: less refrigeration and air conditioning.
Maintenance of Cerromatoso – big mining complex – negatively impact demand
Strong economic growth – around 9% -.
Organic growth.
Sources: XM, Upme, COES - Peru, AMM – Guatemala * Figures as of February
Investor Report
1Q 11
3
Contact: Juan Felipe González Rivera
Telephone: 571 3268000 ext 1546
E mail: [email protected]
Table No 5 – EEB´s consolidated financial indicators Cop Mm As of 1Q 11 As of 1Q 10 F 10 Operating revenue 334,703 228,829 932,435 Operating income 129,480 97,486 268,288
Consolidated EBITDA 1,220,081 1,101,385 1,601,354
Dividends and reserves decreed to EEB 179,459 595,433 1,092,944
Net income 224,397 739,779 995,706
Dividends and reserves decreed by EEB 0 291,537 1,059,205
Last credit rating international bonds (144A) S&P - 01 06 10: BB stable Fitch - 24 01 11: BB stable
224,397 739,779 995,706
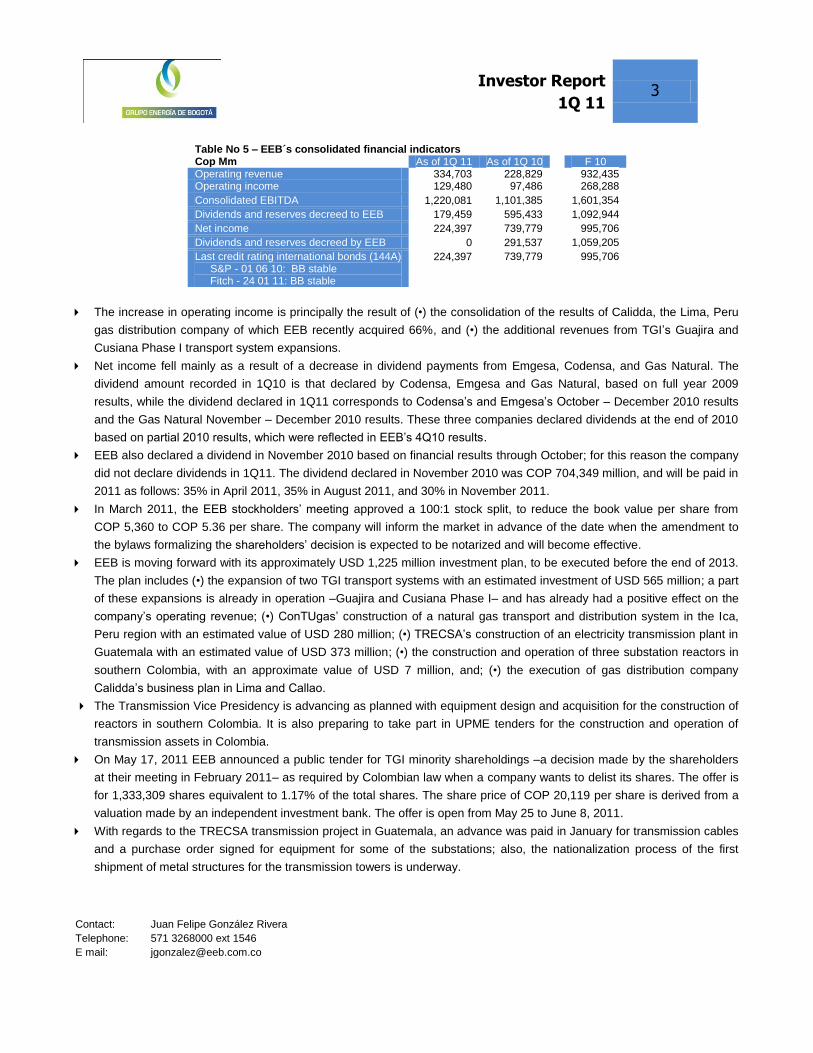
The increase in operating income is principally the result of (•) the consolidation of the results of Calidda, the Lima, Peru
gas distribution company of which EEB recently acquired 66%, and (•) the additional revenues from TGI’s Guajira and
Cusiana Phase I transport system expansions.
Net income fell mainly as a result of a decrease in dividend payments from Emgesa, Codensa, and Gas Natural. The
dividend amount recorded in 1Q10 is that declared by Codensa, Emgesa and Gas Natural, based on full year 2009
results, while the dividend declared in 1Q11 corresponds to Codensa’s and Emgesa’s October – December 2010 results
and the Gas Natural November – December 2010 results. These three companies declared dividends at the end of 2010
based on partial 2010 results, which were reflected in EEB’s 4Q10 results.
EEB also declared a dividend in November 2010 based on financial results through October; for this reason the company
did not declare dividends in 1Q11. The dividend declared in November 2010 was COP 704,349 million, and will be paid in
2011 as follows: 35% in April 2011, 35% in August 2011, and 30% in November 2011.
In March 2011, the EEB stockholders’ meeting approved a 100:1 stock split, to reduce the book value per share from
COP 5,360 to COP 5.36 per share. The company will inform the market in advance of the date when the amendment to
the bylaws formalizing the shareholders’ decision is expected to be notarized and will become effective.
EEB is moving forward with its approximately USD 1,225 million investment plan, to be executed before the end of 2013.
The plan includes (•) the expansion of two TGI transport systems with an estimated investment of USD 565 million; a part
of these expansions is already in operation –Guajira and Cusiana Phase I– and has already had a positive effect on the
company’s operating revenue; (•) ConTUgas’ construction of a natural gas transport and distribution system in the Ica,
Peru region with an estimated value of USD 280 million; (•) TRECSA’s construction of an electricity transmission plant in
Guatemala with an estimated value of USD 373 million; (•) the construction and operation of three substation reactors in
southern Colombia, with an approximate value of USD 7 million, and; (•) the execution of gas distribution company
Calidda’s business plan in Lima and Callao.
The Transmission Vice Presidency is advancing as planned with equipment design and acquisition for the construction of
reactors in southern Colombia. It is also preparing to take part in UPME tenders for the construction and operation of
transmission assets in Colombia.
On May 17, 2011 EEB announced a public tender for TGI minority shareholdings –a decision made by the shareholders
at their meeting in February 2011– as required by Colombian law when a company wants to delist its shares. The offer is
for 1,333,309 shares equivalent to 1.17% of the total shares. The share price of COP 20,119 per share is derived from a
valuation made by an independent investment bank. The offer is open from May 25 to June 8, 2011.
With regards to the TRECSA transmission project in Guatemala, an advance was paid in January for transmission cables
and a purchase order signed for equipment for some of the substations; also, the nationalization process of the first
shipment of metal structures for the transmission towers is underway.
Investor Report
1Q 11
4
Contact: Juan Felipe González Rivera
Telephone: 571 3268000 ext 1546
E mail: [email protected]
Table No 4 - Summary of expansion projects of non-controlled companies
Project Company Sector Country Capex Usd
Mm In
operation: Quimbo Emgesa Electricity generation Colombia 837 14 Substations - 3 Codensa Electricity distribution Colombia 68 11 Expansions to concessions - 4 REP Electricity transmission Peru 72 11 Expansions to concessions and new concessions - 13
CTM Electricity transmission Peru 748 11 - 13
Table No 6 - Selected financial indicators as of 1Q 11 - Non-controlled investments Cop Mm Usd mm
Emgesa Codensa Gas Natural REP CTM
Operating revenue 449,937 702,253 252,124 23.4 7.9 Operating income 268,983 176,753 76,274 8.4 4.6 EBITDA LTM 305.162 241,103 84,926 15.7 6.6 Net income 160,550 105,471 59.601 4.6 4.0 Dividends and reserves decreed to EEB 80,537 69,214 0 0 0 Capital reductions to EEB 0 0 0 0 0
On March 24, 2011, Emgesa’s stockholders declared a dividend of COP 155,324 million, for the October – December
2010 period. Last October, the company declared a dividend for the January – September 2010 period.
On March 24, 2011, Codensa’s stockholders declared a dividend of COP 133,502 million for the October – December
2010 period. Last October, the company also declared a dividend for the January – September 2010 period.
CTM was the successful bidder for the Trujillo – Chicalayo 220 kV line concession; this 304 km line is expected to require
an investment of approximately USD 153.4 million.
Return to index
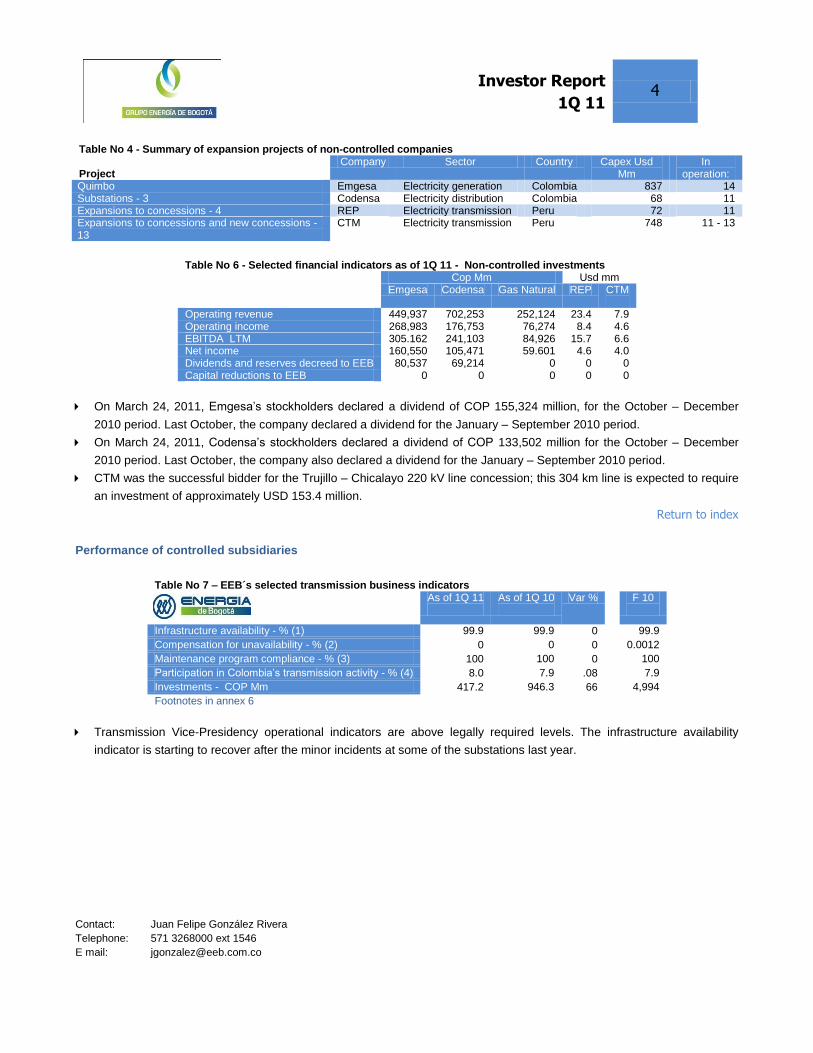
Performance of controlled subsidiaries
Table No 7 – EEB´s selected transmission business indicators As of 1Q 11
As of 1Q 10
Var % F 10
Infrastructure availability - % (1) 99.9 99.9 0 99.9
Compensation for unavailability - % (2) 0 0 0 0.0012
Maintenance program compliance - % (3) 100 100 0 100
Participation in Colombia’s transmission activity - % (4) 8.0 7.9 .08 7.9
Investments - COP Mm 417.2 946.3 66 4,994
Footnotes in annex 6
Transmission Vice-Presidency operational indicators are above legally required levels. The infrastructure availability
indicator is starting to recover after the minor incidents at some of the substations last year.
Investor Report
1Q 11
5
Contact: Juan Felipe González Rivera
Telephone: 571 3268000 ext 1546
E mail: [email protected]
Table No 8 – TGI´s selected indicators As of 1Q 11
As of 1Q 10
Var % F 10
Operating revenue - COP Mm 156,339 129,032 21.2 559,414 Operating income - COP Mm 95,439 76,461 24.8 194,564 Ebitda LTM - COP Mm 446,750 407,670 9.6 422,699 Net income - COP Mm 60,433 145,505 -58.5 69,831 Transported volume – Mm cfd 437 423 3.2 422 Firm contracted capacity – Mm cfd 529 423 25.1 485 IDR
S&P - Jun 10: BB; stable Fitch - Jan 11: BB; stable
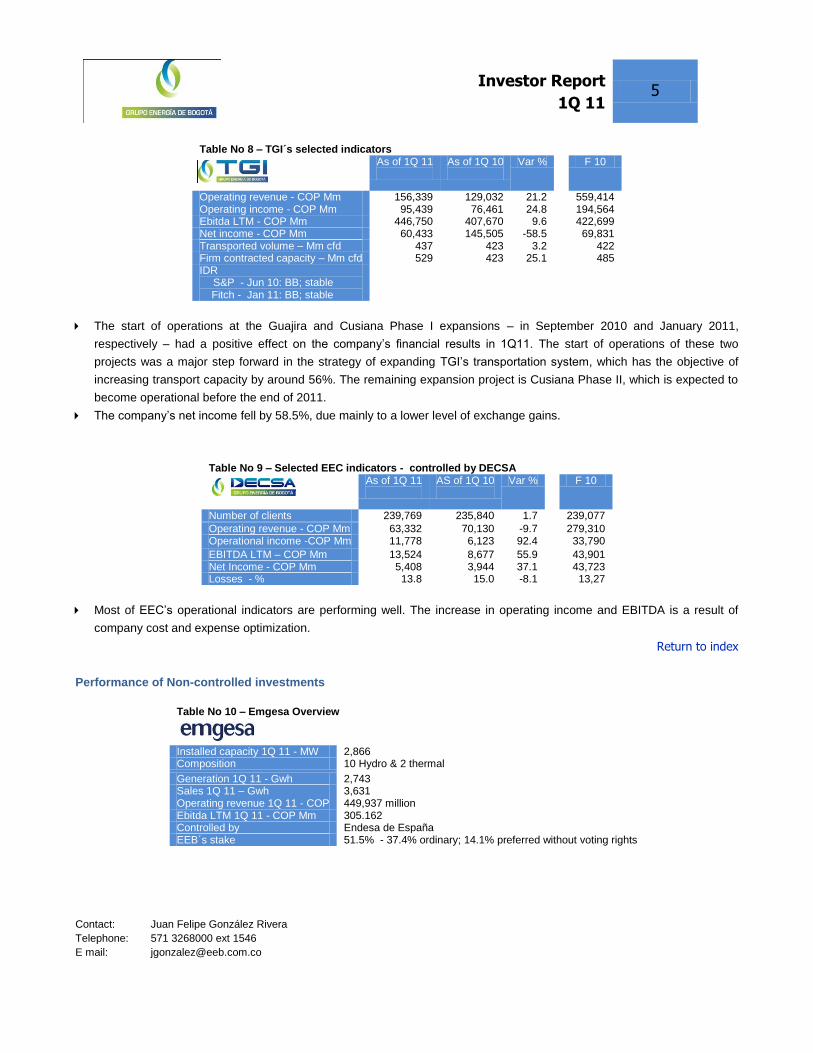
The start of operations at the Guajira and Cusiana Phase I expansions – in September 2010 and January 2011,
respectively – had a positive effect on the company’s financial results in 1Q11. The start of operations of these two
projects was a major step forward in the strategy of expanding TGI’s transportation system, which has the objective of
increasing transport capacity by around 56%. The remaining expansion project is Cusiana Phase II, which is expected to
become operational before the end of 2011.
The company’s net income fell by 58.5%, due mainly to a lower level of exchange gains.
Table No 9 – Selected EEC indicators - controlled by DECSA
As of 1Q 11
AS of 1Q 10
Var % F 10
Number of clients 239,769 235,840 1.7 239,077
Operating revenue - COP Mm 63,332 70,130 -9.7 279,310 Operational income -COP Mm 11,778 6,123 92.4 33,790
EBITDA LTM – COP Mm 13,524 8,677 55.9 43,901 Net Income - COP Mm 5,408 3,944 37.1 43,723 Losses - % 13.8 15.0 -8.1 13,27
Most of EEC’s operational indicators are performing well. The increase in operating income and EBITDA is a result of
company cost and expense optimization.
Return to index
Performance of Non-controlled investments
Table No 10 – Emgesa Overview
Installed capacity 1Q 11 - MW 2,866 Composition 10 Hydro & 2 thermal
Generation 1Q 11 - Gwh 2,743 Sales 1Q 11 – Gwh 3,631 Operating revenue 1Q 11 - COP 449,937 million Ebitda LTM 1Q 11 - COP Mm 305.162 Controlled by Endesa de España EEB´s stake 51.5% - 37.4% ordinary; 14.1% preferred without voting rights

Investor Report
1Q 11
6
Contact: Juan Felipe González Rivera
Telephone: 571 3268000 ext 1546
E mail: [email protected]
2.434
1.197
3.631
2.675
658
3.333
Contracts Spot Total
Sales - GWh
1T 11 1T 10-9%
81.9%
8.9%2.743
136
782
2.260
87
1.017
Production Contracts Spot
Supply- GWh
F 10 F 09
21.4%
56.3%
-23.1%
The greater availability of water resources resulting from the dissipation of the El Niño phenomenon had a positive effect
on production and sales. Spot market sales have increased as a result of favorable pricing.
Table No 11 - Capex
As of 1Q 11
AS of 1Q 10 Var % F 10
COP Mm 35,807 4,099 773% 117,395 USD Mm 19.1 2.1 809% 59.0
Increased capex reflects the start of construction on the El Quimbo hydroelectric project.
Table No 12 - Selected financial indicators of Emgesa Mm COP Mm COP Mm USD
1Q 11 1Q 10 Var % F 10 1Q 11 1Q 10 Operating revenue 449,937 458,779 -1,9 1,886,779 239.4 237.9 Cost of sales -173,199 -287,579 -39,8 -894,261 92.3 -149.1 Administrative expenses -7,755 -4,681 34,8 -21,790 -3.3 -2.4 Operating income 268,983 167,697 63,1 970,728 145,6 86.3 EBITDA LTM (1) 305.162 206,438 47,8 1,109,312 162,3 107.0 Net income 160,550 95,839 67,5 571,977 85,4 49.7 Dividends and reserves decreed to EEB 80,537 251,770 -68,0 251,770 42,8 130.5 Capital reductions to EEB 0 0 0 229,120 0 0 Net debt (2) / EBITDA LTM N.D N.D N.D 1.3 N.D N.D EBITDA LTM / Interests (3) N.D N.D N.D 8.4 N.D N.D Footnotes in annex 6
Emgesa EBITDA grew vigorously due mainly to the reduction in operational expenses as a result of reduced energy
purchases in the spot market and lower fuel consumption for thermoelectric generation.
Dividends accruing to EEB were below 2010 levels due to the fact they correspond to 4Q10 results only. In October 2010,
Emgesa declared a dividend for January – September 2010.

Investor Report
1Q 11
7
Contact: Juan Felipe González Rivera
Telephone: 571 3268000 ext 1546
E mail: [email protected]
Table No 13 – Overview of Codensa
Number of customers 2,429,365 Market share 1Q 11 - % 23.6 Codensa demand 1Q 11 - Gwh 13,224 Var. of Codensa´s demand 1Q 11/ 1Q 10 - % 3.11% Operational revenues F 10 - COP Mm 702,253 Ebitda LTM - COP Mm 241,103 Controlled by Endesa de España EEB´s stake 51.5% (36.4% ordinary; 15.1% preferred without voting rights)
Table No 14 - Quality of accounts receivable – COP Mm As of 1Q 11 1Q As of 10 Var % F 10
Overdue accounts receivable (1) 94,729 96,566 -1.9 87,164
Average monthly invoicing (2) 226,516 222,144 2.0 223,727
Delinquency index - % (3) 41.82 44.7 -6.4 39.0
Footnotes in Annex 6
The reduction in past due receivables was the result of improved collections related to sales of complementary services:
telecommunication infrastructure rental, and work carried out for third parties, among others.
Table No 15 - Capex
As of 1Q 11 As of 1Q 10 Var % F 10
COP Mm 32,321 28,490 13,4 299,282
USD Mm 17.2 14.8 16,2 156.4
The growth in capex reflects the company’s commitment to meet the increase in demand through the construction of the
Florida and Nueva Esperanza substations, as well as network and substation modernization.
Table No 16 - Selected financial indicators of Emgesa Mm COP Mm COP Mm USD As of 1Q 11 As of 1Q 10 Var % F 10 As of 1Q 11 As of 1Q 10
Operating revenue 702,253 668,032 5,1 2,787,215 373,6 346.4 Cost of sales -509,572 -487,725 4,5 -1,989,855 -271,1 -252.9 Administrative expenses -15,927 -9,890 61,0 -54,943 -8,5 -5.1 Operational income 176,753 170,416 3,7 742,417 94,0 88.4 EBITDA LTM (1) 241,103 232,280 3.8 993,362 128,3 119.7 Net income 105,471 112,038 -5,9 480,353 56,1 58.1 Dividends and reserves decreed to EEB 69,214 263,199 -73,7 443,189 36,8 136.5 Capital reductions to EEB 0 0 0 0 0 0 Net debt (2) / Ebitda LTM ND N.D N.D 1.05 N.D N.D Ebitda LTM / Interests (3) ND N.D N.D 9.98 N.D N.D Footnotes in annex 6
EBITDA increased during the period under analysis due to increases in tariffs and growth in demand.
Increased administrative expenses were the result of an increase in the tax on assets as a result of recent tax reform
legislation.
Net income fell due to an increase in income tax provisions. Recent tax reform legislation eliminated the deduction benefit
equivalent to 30% of the value of new investments.

Investor Report
1Q 11
8
Contact: Juan Felipe González Rivera
Telephone: 571 3268000 ext 1546
E mail: [email protected]
EEB’s dividend decreased because it corresponds to only 4Q10. Codensa declared a dividend in October last year for
January – September.
Table No 17 – Overview of Gas Natural
Number of customers 1,708,462
Sales in volume - Mm cfd 131,1
Market share - % N.D
Network – km 12,365
Operating revenue 1Q 11 - COP Mm 252,124
EBITDA LTM F 10 - COP Mm 84,926
Controlled by Gas Natural de España
EEB´s stake 25%
2%
0%
5%
3T 10 4T 10 1T 11
Change in sales
29%
55%
16%
Sales by customer Total: 131 mmcfd
Residential Commercial - Industrial Vehicle
The healthy recovery in sales is due to the elimination of the restrictions imposed by the Ministry of Mines and Energy
during the first months of 2010. These restrictions particularly affected industrial and vehicle demand.
The increase in capital expenditures reflects the progress in works related to networks and the regulation and
measurement stations.
Table No 18 – Capex
As of 1Q 11 As of 1Q 10 Var % F 10
Mm COP 2,407 1,313 83.8 18,471 Mm USD 1,28 0,68 87.5 9,7

Investor Report
1Q 11
9
Contact: Juan Felipe González Rivera
Telephone: 571 3268000 ext 1546
E mail: [email protected]
Table No 19 - Selected financial indicators of Gas Natural Mm COP Mm COP Mm USD
As of 1Q 11 As of 1Q 10 Var % F 10 As of 1Q 11 As of 1Q 10
Operating revenue 252,124 209,587 20,3 935,623 134,15 108.7 Cost of sales -142,792 -115,581 29,6 -533,243 -79.70 -59.9 Administrative expenses -26,058 -22,121 17.8 -93,724 -13.86 -11.5 Operational Income 76,274 71,885 6.1 308,585 40.58 37.3 EBITDA LTM (1) 84,926 78,555 8.1 340,492 45.19 40.7 Net income 59.601 60,560 -1.6 259,034 31.71 31.4 Dividends and reserves decreed to EEB 17,594 1/ 69,004 -74.5 116,442 9.36 35.8 Capital reductions to EEB 0 0 0 0 0 0 Net debt (2) / EBITDA ND ND ND 1.3 ND ND
EBITDA / Interests (3) ND ND ND 31.9 ND ND
Footnotes in annex 6
Increased sales and distribution volumes had a positive effect on EBITDA.
EEB’s dividend decreased because it corresponds to the financial results of the last two months of 2010 only. In
December 2010, the company declared a dividend for January – October 2010.
Table No 20 - Overview Rep and CTM
REP CTM Network - km 5,837 1,490 Voltage – kv 220, 138, 60 220, 138
Control led by ISA Colombia EEB´s stake - % 40
The reduction in EBITDA reflects (•) increased operational provisions for the company’s adoption of international
accounting norm NIC 37 - ―Provisions, Contingent Liabilities, and Contingent Assets‖ - and (•) reduced operating revenue
related to the annual adjustment of the concession’s revenues due to the revaluation of the Peruvian currency.
Table No 21 - Selected financial indicators of REP Mm USD Mm USD
As of 1Q 11 As of 1Q 10 Var % F 10
Operating revenue 23.4 24.3 -3.7 93.4 Cost of sales -7.8 -7,6 2.6 -40.5 Operating income 8.4 12,6 -33.0 35.1
EBITDA LTM (1) 15.7 16.7 -6.0 59.2 Net income 4.6 9,4 -51.1 19.8 Dividends decreed to EEB 0 0 0 0 Capital reductions to EEB 0 0 0 0 Net debt (2) / EBITDA ND ND ND 2.5 EBITDA / Interest (3) ND ND ND 8.1
Footnotes in Annex 6

Investor Report
1Q 11
10
Contact: Juan Felipe González Rivera
Telephone: 571 3268000 ext 1546
E mail: [email protected]
CTM’s reduced operating income is due to the adjustment of the concession’s annual compensation, and to increased
provisions resulting from the company’s adoption of international accounting norms.
Return to index
EEB´s Financial performance
Table No 23 - EEB´s consolidated results
Mm COP Variation Mm COP Mm USD
1Q 11 1Q 10 % F 10 1Q 11 1Q 10 Operating revenue (1) 334,703 228,829 46.27 932,435 178.08 118.65
Electricity transmission 24,382 22,890 6.52 93,711 12.97 11.86
Electricity distribution 63,198 70,127 -9.88 279,310 33.62 36.36 Natural gas trans. and dist. 247,123 135,812 81.96 559,414 131.48 70.42
Cost of sales (2) -161,553 -113,469 42.38 -426,161 -85.95 -58.83 Electricity transmission -9,631 -8,784 9.64 -39,094 -5.12 -4.55 Electricity distribution -46,288 -56,825 -18.54 -199,893 -24.62 -29.46 Natural gas trans. and dist. -105,634 -47,860 120.71 -187,174 56.20 -24.81
Gross income 173,150 115,360 50.10 506,274 92.12 59.816 Administrative expenses -43.670 -17,873 144.34 -237,986 -23.23 -9.26
Allocated to electricity transmission (3) -1,210 -1,306 -7.35 -6,117 -644 -677 Electricity distribution -8,848 -9,353 -5.40 -55,524 -4.70 -4.85
Natural gas trans. and dist. -33,612 -7,214 365.93 -176,344 -17.88 -3.74 Operating income 129,480 97,487 32.82 268,288 68.89 50.54
Dividends (4) 179,459 595,433 -69.86 1,059,205 95.48 308.74 Interest temp. investments & pension trusts (5) 14,950 10,844 37.86 77,302 7.95 5.62
Net exchange difference (6) 42,241 150,723 -71.97 168,959 22.47 78.15 Net valuation of hedging contracts (7) -4,894 -11,872 -58.78 -62,333 -2.60 6.15
Other revenue (8) 6,857 8,133 -15.69 78,634 3.64 4.21 Administrative expenses (9) -30,326 -27.006 12.29 -151,846 -16.13 -14.00
Financial expenses -67,320 -68,584 -1.84 -258,799 -35.81 -35.56 Other expenses 485 -360 -234.72 -7,747 258 -187 Net income before taxes and minority interest 270,932 754,798 -64.11 1,171,663 144.15 391.37
Minority interest (8) -33,203 -5,136 546.48 -24,978 -17.666 -2.66
Provision for income tax -13,332 -9,883 34.90 -53,741 7.09 -5.12 Net income 224,397 739,779 -69.67 1,092,944 119.39 383.58
Footnotes in annex 6
The increase in operating income reflects principally (•) the consolidation of Calidda in the financial statements. This
company, of which EEB recently acquired 66%, distributes natural gas in Lima, Peru; and (•) the additional revenue
derived from the start of operations of TGI’s Guajira and Cusiana Phase I transport system expansions.
Table No 22 - Selected financial indicators of CTM Mm USD Mm USD
As of 1Q 11 As of 1Q 10 Var % F 10
Operating revenue 7.87 8.38 -6.1 183.0 Cost of sales -1.28 -1.0 28.0 -161.0
Operating income 4.63 6.01 -23.0 20.6 EBITDA LTM (1) 6.59 7.4 -10.9 27.0 Net income 4.0 3.7 8.1 15.4 Dividends decreed to EEB 0 0 0 0 Capital reductions to EEB 0 0 0 0 Net debt (2) / Ebitda ND N.D ND 2.7 EBITDA / Interests (3) ND ND 3.3 Footnotes in annex 6
Investor Report
1Q 11
11
Contact: Juan Felipe González Rivera
Telephone: 571 3268000 ext 1546
E mail: [email protected]
The increase in operating expenses is also a result of the consolidation of Calidda, which added COP 73,680 million in
expenses.
The reduction in dividends received is due to the fact that the amount recorded in 1Q10 is that declared by Codensa,
Emgesa and Gas Natural, based on full year 2009 results, while those declared in 1Q11 correspond to Codensa’s and
Emgesa’s October – December 2010 results and the Gas Natural November – December 2010 results. These three
companies declared dividends at the end of 2010 based on partial 2010 results, which were reflected in EEB’s 4Q10
results.
The lower appreciation of the Colombian peso in 1Q11—5.66% in 1Q10 vs. 1.84% in 1Q11—explains the lower level of
exchange gains. This exchange rate variation also explains the reduced net loss on currency hedges.
Finally, the increase in minority interest is the result of the consolidation of Calidda’s minority interest and TGI’s new
partner –Citi Venture Capital – which acquired the equivalent of 31.9% of TGI’s stock in February 2011.
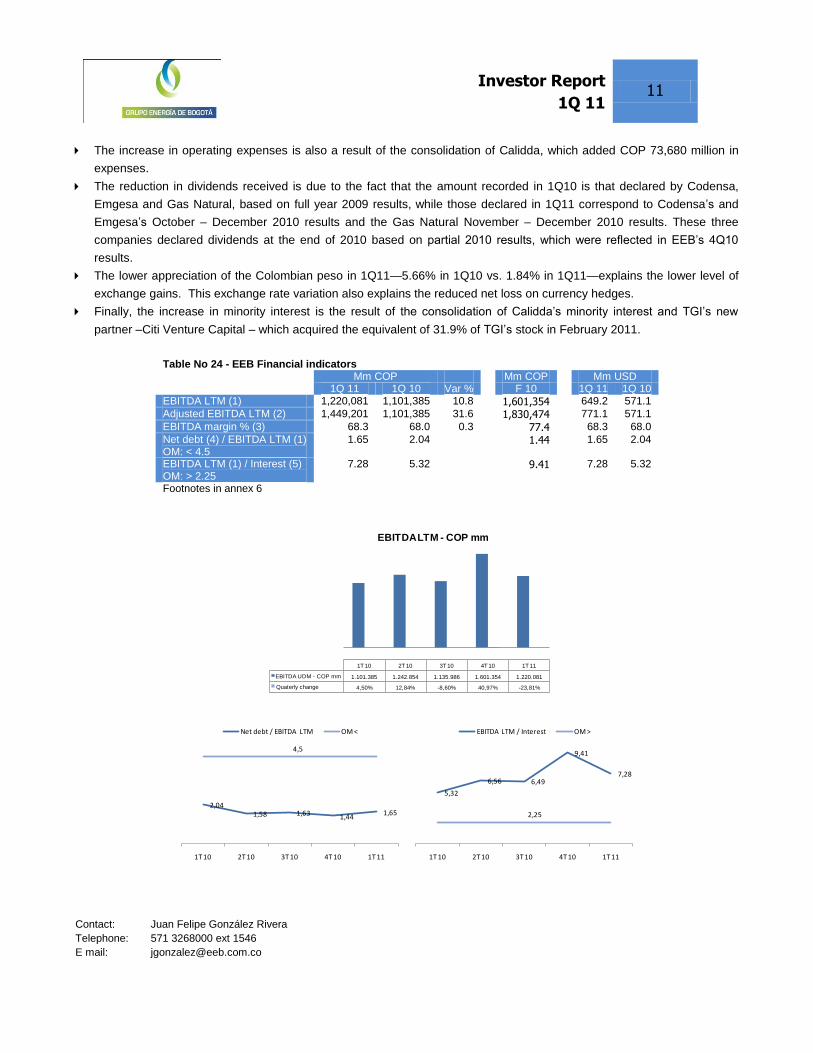
Table No 24 - EEB Financial indicators Mm COP Mm COP Mm USD 1Q 11 1Q 10 Var % F 10 1Q 11 1Q 10
EBITDA LTM (1) 1,220,081 1,101,385 10.8 1,601,354 649.2 571.1
Adjusted EBITDA LTM (2) 1,449,201 1,101,385 31.6 1,830,474 771.1 571.1
EBITDA margin % (3) 68.3 68.0 0.3 77.4 68.3 68.0
Net debt (4) / EBITDA LTM (1) OM: < 4.5
1.65 2.04 1.44 1.65 2.04
EBITDA LTM (1) / Interest (5) OM: > 2.25
7.28 5.32 9.41 7.28 5.32
Footnotes in annex 6
1T 10 2T 10 3T 10 4T 10 1T 11
EBITDA UDM - COP mm 1.101.385 1.242.854 1.135.986 1.601.354 1.220.081
Quaterly change 4,50% 12,84% -8,60% 40,97% -23,81%
EBITDA LTM - COP mm
2,041,58 1,63 1,44
1,65
4,5
1T 10 2T 10 3T 10 4T 10 1T 11
Net debt / EBITDA LTM OM <
5,32
6,56 6,49
9,41
7,28
2,25
1T 10 2T 10 3T 10 4T 10 1T 11
EBITDA LTM / Interest OM >

Investor Report
1Q 11
12
Contact: Juan Felipe González Rivera
Telephone: 571 3268000 ext 1546
E mail: [email protected]
The growth in LTM EBITDA is explained by the fact that Emgesa, Codensa and Gas Natural declared a dividend in favor
of EEB on two occasions during 2010.
Adjusted EBITDA is greater than EBITDA as a result of Emgesa’s capital reduction in 2Q10.
As a result of a higher level of EBITDA generation, the company’s leverage ratio decreased, despite a slight increase in
consolidated debt resulting from disbursement of a short-term loan of COP 98,000 million to EEB and the inclusion of
Calidda’s long-term debt of USD 114 million.
The interest coverage ratio also improved as compared to the prior year period. This is consistent with the higher level of
EBITDA and reduced net interest expense resulting from the revaluation of the peso.
Table No 25 - EEB Consolidated debt structure 1Q 11
COP mm Part.
% 1Q 10
COP mm Part.
% F 10
USD mm 1Q 11
USD mm 1Q 10
USD mm
Debt COP 198,952 6.0 100,002 3.3 100,638 106 52 Debt USD 2,964,249 88.9 2,824,388 92.4 2,801,083 1,577 1,464 Hedging operations 170,413 5.1 133,728 4.4 171,847 91 69 Total debt 3,333,614 100.0 3,058,119 100.0 3,073,568 1,774 1,586
Debt levels increased principally because of the short-term loan disbursement of COP 98,000 million to EEB for, as well
as the consolidation of Calidda’s long-term debt of USD 114 million in 1Q11.
While dollar-denominated debt approximately 7.69% in USD terms, the increase in COP was only 4.95%, as a result of
the revaluation of the Colombian peso.
The valuation of hedging operations was also affected by the revaluation of the peso.
Return to index

Investor Report
1Q 11
13
Contact: Juan Felipe González Rivera
Telephone: 571 3268000 ext 1546
E mail: [email protected]
Annex 1: Legal notice and clarifications
This document contains projections and estimates, using words such as “anticipate”, “believe”, “expect”, “estimate,” and
others having a similar meaning. Any information different from the historical data included in this submittal, including but
without limitation, that relative to the Company’s financial situation, its business strategy, plans, and objectives from
Management for future operations (including the development of plans and objectives relative to Company products and
services), corresponds to projections. Such projections involve known and unknown risks, uncertainties and other important
factors that may cause the Company’s results, performance or actual achievements to be materially different from the results,
performance or future achievements that are expressed or implicit in the projections. Such projections are based on
numerous assumptions concerning the Company’s present and future business strategies, and the environment in which the
Company will operate in the future. These estimates pertain only to the date of this submittal. The Company expressly
declares itself to be exempt from any obligation or commitment to distribute updates or reviews of any projection contained in
this submittal, so as to reflect any change to the Company’s expectations regarding them or any change in the events,
conditions or circumstances on which these projections may be based.
Financial projections and other estimates contained in this report were based on economic, competitive, regulatory and
operational assumptions, and take into account risks that are beyond the control of the Company. Financial projections are
uncertain and it can be expected that one or more of the assumptions under which these projections and estimates were
based becomes invalid. Also unexpected events or circumstances may occur. For the foregoing reasons, actual results may
differ significantly from the projections contained herein. Consequently, the projections herein should not be considered as
statements of fact. Potential investors should not consider the forward-looking statements contained herein or rely on them to
make investment decisions.
The company’s past performance cannot be considered a guide for its future performance.
Clarifications
Only for information purposes, we have converted some of the figures in this report to their equivalent in USD, using the
TRM rate for the end of the period as published by the Colombian Financial Superintendency. The exchange rates used
are as follows:
− 1Q11: 1,879.47 COP/USD
− 1Q10: 1,928.59 COP / USD
In the figures submitted, a comma (,) is used to separate thousands and a point (.) to separate decimals.
EBITDA is not an acknowledged indicator under Colombian or US accounting standards and may show some difficulties
as an analytical tool. Therefore, it must not be taken on its own as an indicator of the company´s cash generation.
In accordance to the offer memorandum of the notes issued by EEB -USD 610 million; 8.75%; 2014-; the company’s
consolidated EBITDA for a specific period is calculated taking operating revenues for such period and subtracting the cost
of sales, administrative expenses and interests generated in pension funds. One must add decreed dividends
(irrespective of whether they have been paid or not), interests of temporary investments, indirect taxes, amortization of
intangibles, depreciation of fixed assets and provisions and contributions made to pension funds.
Consolidated and adjusted EBITDA for a specific period is calculated taking the consolidated EBITDA for such period and
adding the cash coming from EEB attributable to capital reductions of those companies where EEB has shares.
Return to index

Investor Report
1Q 11
14
Contact: Juan Felipe González Rivera
Telephone: 571 3268000 ext 1546
E mail: [email protected]
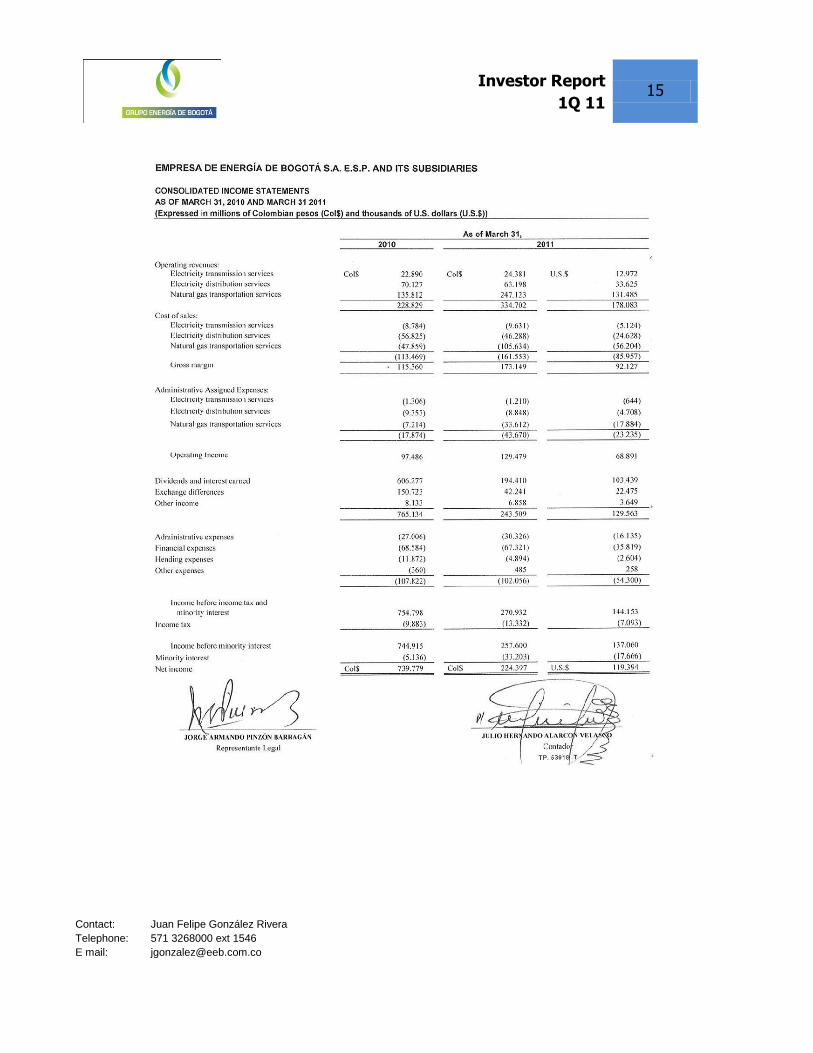
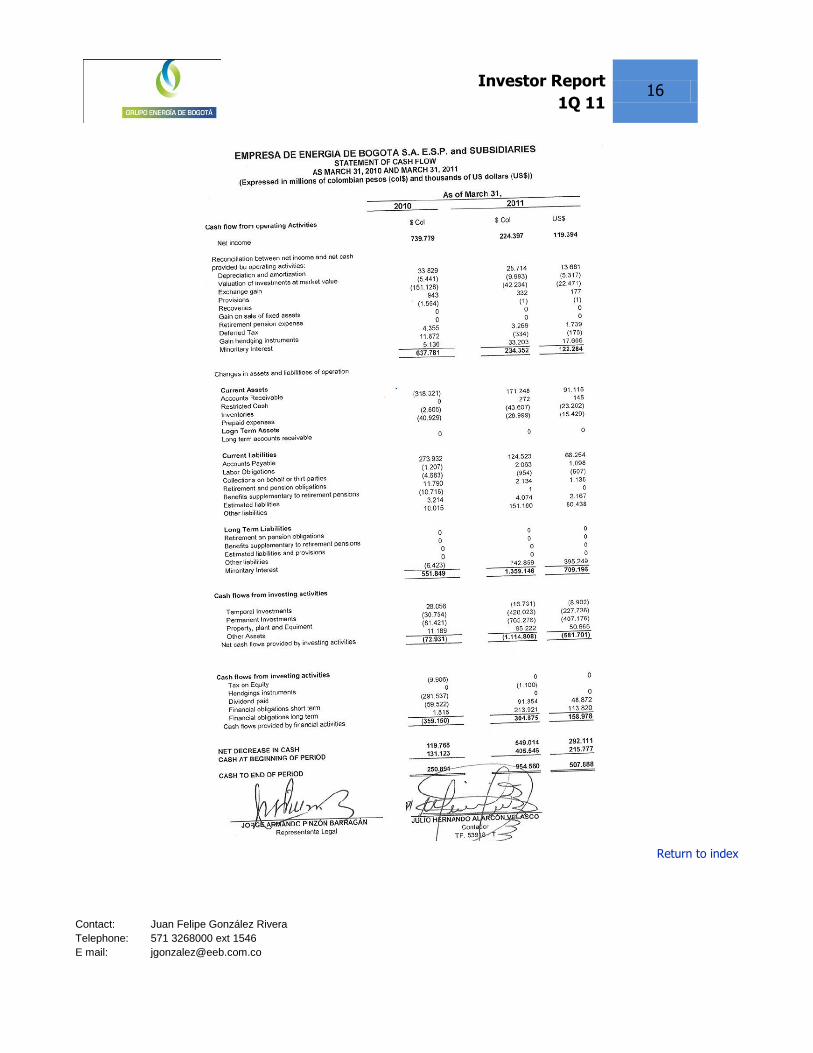
Annex 2: Consolidated financial statements F 10
Investor Report
1Q 11
15
Contact: Juan Felipe González Rivera
Telephone: 571 3268000 ext 1546
E mail: [email protected]
Investor Report
1Q 11
16
Contact: Juan Felipe González Rivera
Telephone: 571 3268000 ext 1546
E mail: [email protected]
Return to index

Investor Report
1Q 11
17
Contact: Juan Felipe González Rivera
Telephone: 571 3268000 ext 1546
E mail: [email protected]
Annex 3: EEB´s overview
EEB is an integrated energy company with interests in the natural gas and electricity sectors and operations in Colombia,
Peru and Guatemala;
The company was founded in 1896 and it is controlled by the District of Bogotá (81,5%; S&P BBB- rating);
EEB has an expansion strategy focused on the transmission and distribution of energy in Colombia and other countries
within the region.
A big part of its investments are concentrated in natural monopolies regulated by the Government, which allows the
company to enjoy a stable and predictable cash flow;
It participates, either directly or indirectly - through companies with control- in the transmission of energy and in the
transportation of natural gas;
The company participates in energy generation, transmission and distribution sectors as well as in the natural gas
distribution sector by means of investments in companies it does not control. The aforementioned refers to joint ventures
with companies such as ISA Colombia, Endesa and Gas Natural Spain.
It entered into two shareholder agreements with Endesa; these in turn regulate the governance of Emgesa and Codensa.
Amongst other things, the parties are bound to vote in favor of the distribution of as maximum dividends as permitted by
law.
EEB´S structure
Non - controlled companies
Natural Gas Distribution Electricity
Transmission Electricity Distribution Natural Gas
Transportation
Controlled Companies Natural gas Transp. and
Distrib . Electricity
Transmission Electricity Distribution Electricity
Generation
100%
97% 82%
66.9% 75%
25%
40% 1.8% 40%
51.5%
2.5%
51.5%
16.2% 25%
51%
66 %
15.6%
Return to index

Investor Report
1Q 11
18
Contact: Juan Felipe González Rivera
Telephone: 571 3268000 ext 1546
E mail: [email protected]
Annex 4: Technical and regulatory terms
BLN: US billion (109)
CAC: Compound Annual Growth
COP: Colombian Peso.
CHB: Central Hidroeléctrica de Betania
CTM: Consorcio Transmantaro,
CREG: Comisión de Regulación de Energía y Gas de Colombia. (Colombia’s Energy and Gas Regulating Commission).
Colombia’s state agency in charge of regulating electric power and natural gas residential public utility services.
DANE: Departamento Administrativo Nacional de Estadística (National Administrative Statistics Department). Agency
responsible for planning, collecting, processing, analyzing, and disseminating official statistics in Colombia.
Gwh: Gigawatt hour; unit of energy equivalent to 1,000,000 kwh
GNV: Natural Gas for vehicles,
IPC: Colombian Consumer Price Index.
KM: Kilometers
KWH: Unit of energy equivalent to the energy produced by a power of one kilowatt (kW) for one hour
MEM: Mercado de Energía Mayorista de Colombia; Wholesale Energy Market in Colombia
Mm: million
M: thousands
MW: Megawatt, power unit or work which equals one million watts,
N.A. Not applicable.
CFD: Cubic feet per day
Proinversión: Peru’s foreign investment promotion office
SIN: Sistema Interconectado Nacional, National Interconnected System
STN: Sistema de Transmisión Nacional, National Transmission System
SF: Superintendencia Financiera – Financial Superintendence. State entity in charge of regulating, overseeing and
controlling the Colombian financial sector
TRM: Market Representative Exchange Rate; it is an average of the transactions carried out in peso–dollar, and it is
calculated daily by the SF.
UPME: State agency responsible for planning Colombia’s mining and energy sectors.
USD: US dollars.
NON REGULATED ELECTRICITY USER: electricity consumers who have a peak demand greater than 0,10 MW or a
minimum monthly consumption above 55,0 MWh,
NATURAL GAS NON REGULATED USER: user with consumption above 100 kpcd,
Return to index
Investor Report
1Q 11
19
Contact: Juan Felipe González Rivera
Telephone: 571 3268000 ext 1546
E mail: [email protected]
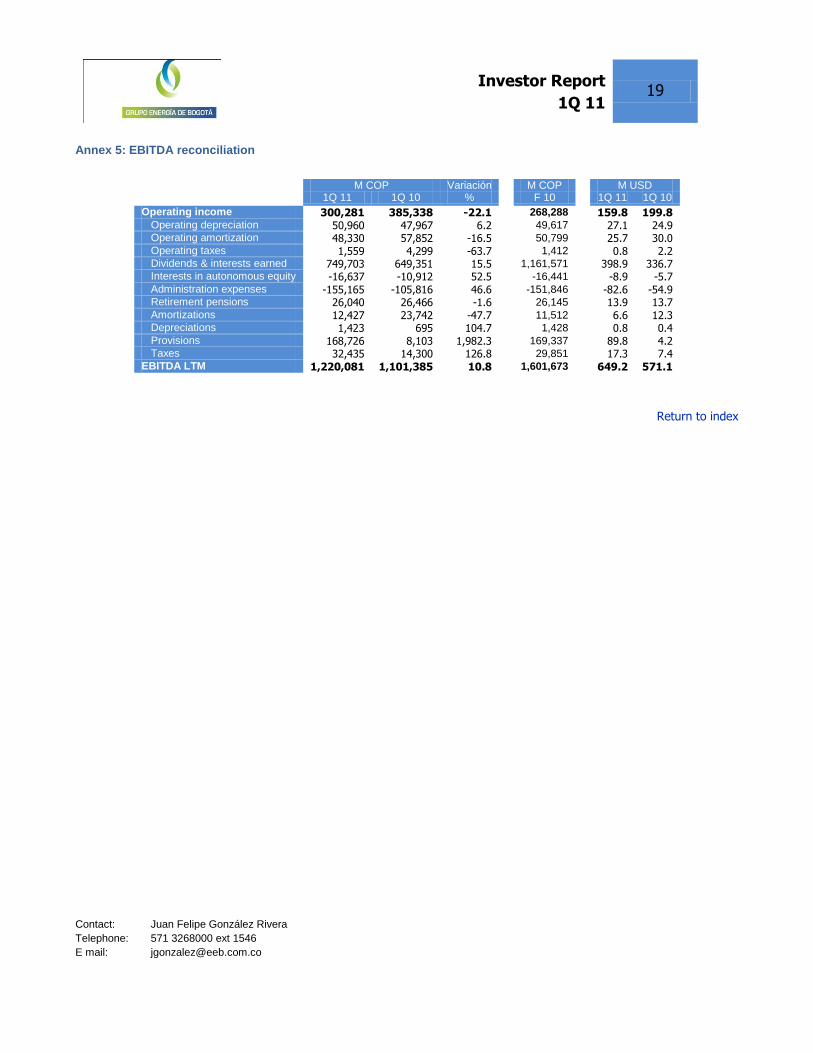
Annex 5: EBITDA reconciliation
M COP Variación M COP M USD 1Q 11 1Q 10 % F 10 1Q 11 1Q 10
Operating income 300,281 385,338 -22.1 268,288 159.8 199.8 Operating depreciation 50,960 47,967 6.2 49,617 27.1 24.9 Operating amortization 48,330 57,852 -16.5 50,799 25.7 30.0 Operating taxes 1,559 4,299 -63.7 1,412 0.8 2.2 Dividends & interests earned 749,703 649,351 15.5 1,161,571 398.9 336.7 Interests in autonomous equity -16,637 -10,912 52.5 -16,441 -8.9 -5.7 Administration expenses -155,165 -105,816 46.6 -151,846 -82.6 -54.9 Retirement pensions 26,040 26,466 -1.6 26,145 13.9 13.7 Amortizations 12,427 23,742 -47.7 11,512 6.6 12.3 Depreciations 1,423 695 104.7 1,428 0.8 0.4 Provisions 168,726 8,103 1,982.3 169,337 89.8 4.2 Taxes 32,435 14,300 126.8 29,851 17.3 7.4
EBITDA LTM 1,220,081 1,101,385 10.8 1,601,673 649.2 571.1
Return to index

Investor Report
1Q 11
20
Contact: Juan Felipe González Rivera
Telephone: 571 3268000 ext 1546
E mail: [email protected]
Annex 6: Foot notes
Table No 7 - EEB´s transmission business indicators
(1) Percentage of the infrastructure available in a period of time.
(2) Percentage of the revenue discounted due to accumulated unavailability of specific assets above the regulatory target.
(3) Ratio between the number of maintenance operations carried out and number of scheduled maintenance operations to be executed as part of the semi-annual Maintenance Plan.
(4) Ratio of the number of transmission assets owned by EEB and the total number of transmission assets in Colombia.
Return to table
Table 12 – Selected financial indicators of EMGESA
(1) Ebitda for the period under analysis was calculated by taking the operating profit and adding the amortizations of intangibles and depreciations of fixed assets for such period.
(2) It is the result of the financial debt in force at the end of the period under analysis, less cash and temporary investments in the same period.
(3) Accrued interest on financial debts for the previous twelve months.
Return to table
Table 14 – Quality of accounts receivable
(1) Accounts receivable with a delinquency level in excess of 30 days.
(2) Monthly invoicing average: Monthly average of invoicing in the past twelve months.
(3) Delinquency level index: (1)/(2)
Return to table
Table 16 – Selected financial indicators of Codensa
(1) Ebitda for the period under analysis was calculated by taking the operating profit and adding the amortizations of intangibles and depreciations of fixed assets for such period.
(2) It is the result of the financial debt in force at the end of the period under analysis, less cash and temporary investments in the same period.
(3) Accrued interest on financial debts for the previous twelve months.
Return to table
Table 19 – Selected financial indicators of Gas Natural
(1) Ebitda for the period under analysis was calculated by taking the operating profit and adding the amortizations of intangibles and depreciations of fixed assets for such period.
(2) It is the result of the financial debt in force at the end of the period under analysis, less cash and temporary investments in the same period.
(3) Accrued interest on financial debts for the previous twelve months.
Return to table

Investor Report
1Q 11
21
Contact: Juan Felipe González Rivera
Telephone: 571 3268000 ext 1546
E mail: [email protected]
Table 21 – Selected financial indicators of REP
(1) Ebitda for the period under analysis was calculated by taking the operating profit and adding the amortizations of intangibles and depreciations of fixed assets for such period.
(2) It is the result of the financial debt in force at the end of the period under analysis, less cash and temporary investments in the same period.
(3) Accrued interest on financial debts for the previous twelve months.
Return to table
Table 22 – Selected financial indicators of CTM
(1) Ebitda for the period under analysis was calculated by taking the operating profit and adding the amortizations of intangibles and depreciations of fixed assets for such period.
(2) It is the result of the financial debt in force at the end of the period under analysis, less cash and temporary investments in the same period.
(3) Accrued interest on financial debts for the previous twelve months.
Return to table
Table No 23 - Consolidated results of EEB
(1) Operating revenue for transmission services rendered directly by EEB, natural gas transmission of its controlled companies, TGI and Transcogas and energy distribution services that Decsa consolidates for his participation in EEC.
(2) Cost of sales of the transmission services rendered directly by EEB, natural gas transportation services and electricity distribution services conducted by its controlled companies. It includes personnel, materials, operation and maintenance costs, depreciation, amortization and insurances related to those activities.
(3) Transmission activity is operated directly by EEB. Administrative costs are allocated by the ABC system.
(4) Dividends decreed by non-controlled companies and temporary investors and pension funds autonomous equity.
(5) Interests of temporary investments that are generated by pension funds autonomous equity.
(6) Refers to net losses or earnings due to exchange rate variations and its impact on assets and liabilities expressed in foreign currency.
(7) Valuation of hedging operations contracted by EEB and TGI to reduce currency risk.
(8) Income from recovery of investments, leases and expenses.
(9) Expenses are not related to operational activities.
(10) Proportion of net income corresponding to minority investors in the company’s consolidated by EEB.
Return to table
Table 24 - Financial indicators of EEB
(1) Consolidation of EEB income less cost of sales, administrative expenses, interest on pension funds autonomous equity, plus dividends of participated companies, interest of Accounts receivable investments, indirect taxes, amortization of intangibles, depreciation of fixed assets, pension payments and provisions for the last 12 months. It is consolidated Ebitda plus capital reeducations of participated companies.
(2) Consolidated EBITDA plus capital reductions of participated companies.
(3) Is the result obtained when dividing consolidated EBITDA by operating income, added by dividends and accrued interests (without including interests received from investments made to autonomous equity of pension funds) of the last 12 months.
(4) Consolidated debt less free cash.
(5) Consolidated financial expenses of the past 12 months
Return to table Return to index