Investor Presentations2.q4cdn.com/.../Investor-Presentation-Updated_2017-9-12.pdfability to recruit...
28
September 2017 Investor Presentation
Transcript of Investor Presentations2.q4cdn.com/.../Investor-Presentation-Updated_2017-9-12.pdfability to recruit...

September 2017
Investor Presentation

2
Forward-Looking Statements
This presentation includes “forward-looking statements” within the meaning of the “safe harbor” provisions of the United States Private Securities Litigation Reform Act
of 1995. Forward-looking statements may be identified by the use of words such as “believe,” “intend,” “expect,” “estimate,” “plan,” “outlook,” “project” and other
similar words and expressions that predict or indicate future events or trends that are not statements of historical matters. These forward-looking statements include
statements regarding the Company’s optimism for agent recruitment, investment, acquisitions (including the integration of regional acquisitions), Motto Mortgage, and
improving housing conditions; the factors working to continue the Company’s momentum; the Company’s channels for long-term organic growth; the productivity of the
agent network; the focus on growing the highest quality real estate network in the world; and consistent execution of the Company’s plan and continued success; as well
as other statements regarding the Company’s strategic and operational plans and business models. Forward-looking statements should not be read as a guarantee of
future performance or results, and will not necessarily be accurate indications of the times at, or by, which such performance or results will be achieved. Forward-looking
statements are based on information available at the time those statements are made and/or management’s good faith belief as of that time with respect to future events,
and are subject to risks and uncertainties that could cause actual performance or results to differ materially from those expressed in or suggested by the forward-looking
statements. Such risks and uncertainties include, without limitation, (1) changes in business and economic activity in general, (2) changes in the real estate market,
including changes due to interest rates and availability of financing, (3) the Company’s ability to attract and retain quality franchisees, (4) the Company’s franchisees’
ability to recruit and retain real estate agents and mortgage loan originators, (5) changes in laws and regulations that may affect the Company’s business or the real
estate market, (6) failure to maintain, protect and enhance the RE/MAX and Motto Mortgage brands, (7) fluctuations in foreign currency exchange rates, as well as those
risks and uncertainties described in the sections entitled “Risk Factors” and “Management’s Discussion and Analysis of Financial Condition and Results of Operations”
in the most recent Annual Report on Form 10-K filed and Quarterly Report on Form 10-Q with the Securities and Exchange Commission (“SEC”) and similar disclosures
in subsequent periodic and current reports filed with the SEC, which are available on the investor relations page of the Company’s website at www.remax.com and on the
SEC website at www.sec.gov. Readers are cautioned not to place undue reliance on forward-looking statements, which speak only as of the date on which they are
made. Except as required by law, the Company does not intend, and undertakes no duty, to update this information to reflect future events or circumstances.

3
Why Invest in RE/MAX Today?
Organic Growth Catalysts Return of Capital
Shareholder Return Driven By
Stable recurring revenue
High margin & Strong
Free Cash Flow
Driven by:
1) Agent growth
2) Franchise sales
3) Motto Mortgage
4) Steadily improving
housing market
Independent region
acquisitions
Reinvest in the business
Other acquisitions within
our core competencies of
franchising and real
estate
Committed to returning
capital through dividend
payments over time
Dividend metrics:
– ~30% of FCF in 20161
– ~1.2% current yield2
FCF Fuels Catalysts and Return of Capital to Create Shareholder Value
1Free Cash Flow (“FCF”) = Operating Cash Flow – Capital Expenditures; $18M 2016 quarterly dividend payments / $60M 2016 FCF = 30%; see Appendix for reconciliationof Non-GAAP measures2Yield based on regular quarterly dividend of $0.18 and a stock price of $61.00 per share as of September 11, 2017
4
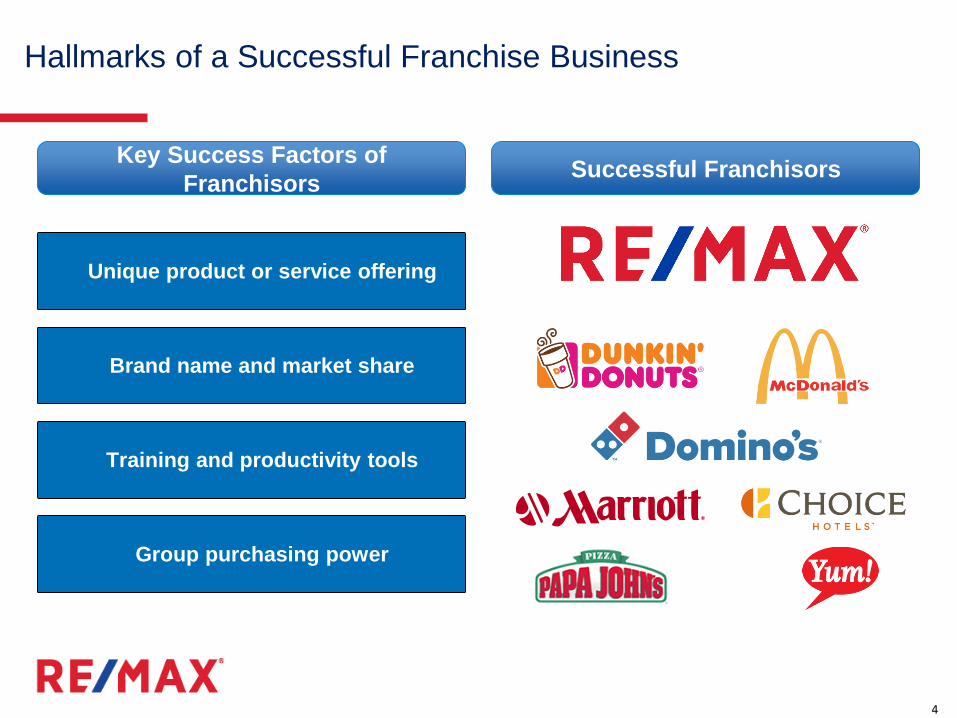
Unique product or service offering
Brand name and market share
Training and productivity tools
Group purchasing power
Hallmarks of a Successful Franchise Business
Key Success Factors of
FranchisorsSuccessful Franchisors

5
RE/MAX is a Premium Franchisor
Nobody sells more Real Estate than
RE/MAX1
100% franchised business, delivering
the full economic benefits of the model
Dual-brand franchisor, focused on our
core businesses
Among the best-in-class franchisor
operating margins
1As measured by residential transaction sides

6
Owned & operated by brokerage
30-40% of commission goes to broker
Commission rate typically determined
by brokerage, not agent
Lack of autonomy within brokerage
Marketing dictated by brokerage
100% franchised
Recommended 95% agent commission
Ability for agent to set commission
rates with sellers in many cases
Entrepreneurially driven agents
Multiple support channels: brand,
marketing & training
Revenue Driven by Commission Revenue Driven by Agent Count
Unique and Effective Agent-Centric RE/MAX Model
Traditional Brokerage The RE/MAX Model

7
Transactions Per
Agent
(Large brokerages only)1
U.S. Residential
Transaction Sides2
Brand Awareness
(unaided) 3
Countries and
Territories
Offices
Worldwide
Agents
Worldwide
17.2 1 million+ 27.6% 100+ 7,343 111,915
6.8 977,603 7.3% 16 800 154,979
8.4 727,415 14.2% 49 3,000 88,400
8.2 420,184 19.7% 77 7,300 110,800
8.2 128,812 1.1% 31 2,300 37,900
6.5 111,950 2.1% 66 850 20,300
6.9 70,980 0.6% 3 300 10,900
9.2 Not Released 4.3% 1 1,240 42,747
RE/MAX Agents at Large Brokerages on Average Outsell Competing Agents More Than 2 to 1
Ranking RE/MAX vs. Other National Real Estate Franchise Brands
Realogy Brand
Data is full-year or as of year-end 2016, as applicable. Except as noted, Coldwell Banker, Century 21, ERA, Sotheby’s and Better Homes and Gardens data is as reported by RealogyCorporation on SEC Form 10-K, Annual Report for 2016; Keller Williams, and Berkshire Hathaway HomeServices data is from company websites and industry reports1Transaction sides per agent calculated by RE/MAX based on 2017 REAL Trends 500 data, citing 2016 transaction sides for the 1,705 largest participating U.S. brokerages. ColdwellBanker includes NRT. Berkshire does not include HomeServices of America.²Keller Williams reports all transaction sides and does not itemize U.S. residential transactions.³MMR Strategy Group study of unaided awareness among buyers, sellers, and those planning to buy or sell; asked, when they think of real estate brands, which ones come to mind?

8
Among Highest Franchisor Adjusted EBITDA Margins1,2
57% 54%
27%
20%17%
15%12%
10%
Franchisors Real Estate Brokerages
1Adjusted EBITDA and Adjusted EBITDA margin are Non-GAAP measures. See appendix for definitions and reconciliations of RE/MAX Non-GAAP measures.
Other companies may calculate this measure differently so these measures may not be comparable. This chart is for illustrative purposes only. Calculations
use financial statements from company public filings.2Choice Hotels and Domino’s do not report Adjusted EBITDA therefore EBITDA has been used for the calculation of the margin
Full-year 2016

9
54%
18%
27%
Unmatched Global Footprint
June 30, 2017
Canada21,053 Agents
Outside the U.S.
and Canada31,968 Agents
U.S.63,249 Agents
RE/MAX Regional or Franchise Presence
RE/MAX Global Footprint Agents by Geography
The RE/MAX brand spans over 100 countries and territories
June 30, 2017

10
87,47689,008
93,228
98,010
104,826
111,915
116,270
2011 2012 2013 2014 2015 2016 Q2 2017
Global Agent Network Growing
+28,794 from 2011
through Q2 2017
Strongest full-year
agent gain in 2016
since 2006
Consistent organic
agent count growth for
the last five years
Total Network Agent Count

11
Motto Mortgage is a mortgage brokerage franchisor
Franchises will be independently owned and operated
Motto Mortgage is not a lender and will not underwrite loans
Offers potential homebuyers the opportunity to find both real estate agents and
independent Motto Mortgage loan originators in offices in one location
Motto Mortgage loan originators will access a variety of quality loan options from
multiple leading wholesalers
Ward Morrison will lead Motto Mortgage with an operational team which will scale as
Motto grows
Motto Mortgage franchises will ultimately be available for purchase by select
qualified brokerage owners in the real estate industry outside of RE/MAX
Motto Mortgage Fact Sheet

12
Motto Mortgage UpdateFocused on Enabling the Success of Initial Group of Franchisees
▪ Initial group of franchisees are
operational
▪ Focused on enabling success of
initial franchisees, who should
serve as concept validators
▪ Major marketing events
scheduled for the second half of
2017
Revenue ramp timeline: it should take ~14-17 months after a sale
for a franchisee to ramp to paying the full set of monthly fees
Operational update Financial Update
▪ Expect to sell tens of franchises
in 2017
▪ Expect 2017 Motto revenue in
the low single-digit millions of
dollars
▪ Expect 2017 Motto expenses to
exceed related revenue resulting
in a net investment

13
Reacquiring Independent Regions Increases Revenue Per Agent by ~$1,700
64% of Agents in the U.S. & Canada are in
Company-owned Regions1
Washington
Oregon
Idaho
Montana
California
Hawaii
ColoradoUtah
Wyoming
SouthDakota
NorthDakota
Texas
Pennsylvania
Delaware
Florida
North Carolina
South Carolina
BritishColumbia
Alberta
Saskatchewan
Manitoba
Yukon
U.S./Canada Overview1
Company-owned Regions
– 18 regions
– 54,145 agents
Independent Regions
– 10 regions
– 30,157 agents
Average Annual Revenue per
Agent
– Company-owned regions:
~$2,500
– Independent regions:
~$800
Company-owned Regions
Independent Regions
Nevada
Arizona New Mexico
Maryland
Virginia
WestVirginia
Missouri
Illinois
Ohio
Northwest
TerritoriesNunavut
1Agent counts are as of June 30, 2017 and average revenue to RE/MAX, LLC per agent is for the year ended December 31, 2016
New York
Alaska
New Jersey
Georgia
14
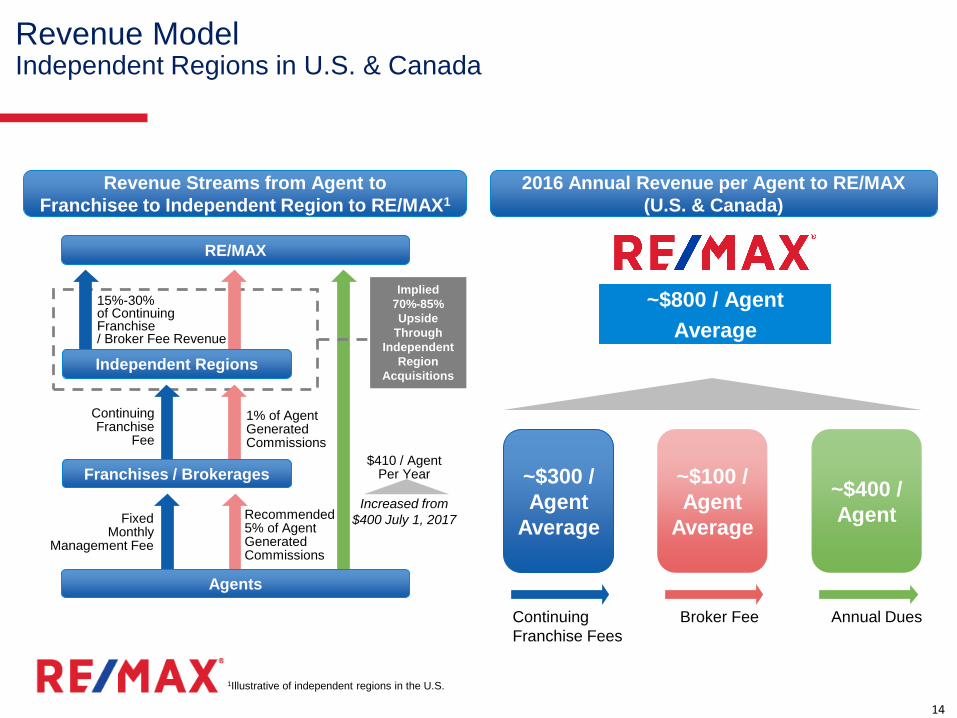
Agents
RE/MAX
Franchises / Brokerages
Independent Regions
$410 / AgentPer Year
Recommended5% of AgentGeneratedCommissions
Fixed Monthly
Management Fee
ContinuingFranchise
Fee
1% of Agent GeneratedCommissions
15%-30%of Continuing Franchise / Broker Fee Revenue
Implied
70%-85%
Upside
Through
Independent
Region
Acquisitions
~$300 /
Agent
Average
~$100 /
Agent
Average
~$400 /
Agent
Revenue Model Independent Regions in U.S. & Canada
~$800 / Agent
Average
Revenue Streams from Agent to
Franchisee to Independent Region to RE/MAX1
2016 Annual Revenue per Agent to RE/MAX
(U.S. & Canada)
Annual DuesBroker FeeContinuing
Franchise Fees
1Illustrative of independent regions in the U.S.
Increased from
$400 July 1, 2017

15
~$2,500 / Agent
Average
Revenue ModelCompany-owned Regions in U.S. & Canada
~$1,400 /
Agent
Average
~$700 /
Agent
Average
~$400 /
Agent
RE/MAX
Franchises / Brokerages
$410 / AgentPer Year
Recommended5% of AgentGeneratedCommissions
$128 / Agent Per Month
1% of Agent GeneratedCommissions
Agents
Revenue Streams from Agent to
Franchisee to RE/MAX1
2016 Annual Revenue per Agent to RE/MAX
(U.S. & Canada)
Annual DuesBroker FeeContinuing
Franchise Fees
Increased from
$123 July 1, 2016
Fixed Monthly
Management Fee
1Illustrative of company-owned regions in the U.S.
Increased from
$400 July 1, 2017

16
46%
21%
14%
19%
83%
13%
4%
Revenue by Stream and Geographic AreaGrowing Recurring Revenue Base
Revenue Streams Revenue by Geographic Area
U.S.
Canada
Outside the U.S.
and Canada
Recurring fees and dues (i.e. Continuing
Franchise Fees and Annual Dues) accounted for
65% of revenue in 2016
~96% of 2016 revenue
was generated in the U.S.
and Canada
Franchise Sales & Other
Franchise Revenue
Broker Fees
Annual Dues
Continuing
Franchise Fees

17
$43$49 $53
2014 2015 2016
$80
$90$95
2014 2015 2016
1Adjusted EBITDA and Adjusted Net Income are Non-GAAP measures. See appendix for definitions and reconciliations of Non-GAAP measures.
Annual Financial PerformanceGenerating High Margins
$171$177 $176
2014 2015 2016
Revenue Adjusted EBITDA1 Adjusted Net Income1
47%
($M) ($M) ($M)
Stable, High Adjusted
EBITDA Margins51% 54%

18
$1.8 $2.4 $2.4 $2.4 $2.4
2017 2018 2019 2020 2021 Thereafter
Maturities of Debt1 Balance Sheet
▪ Credit facility of $235.0 million plus $10.0 million
revolving credit facility
▪ Covenant light deal
▪ Variable Rate: LIBOR + 275bps with 0.75% floor
▪ $229.9 million in term loans1 and no revolving
loans outstanding
▪ Cash balance of $70.3 million on June 30, 2017
▪ Total Debt / Adjusted EBITDA of 2.3x2
▪ Net Debt / Adjusted EBITDA of 1.6x3
$222.7
Low Leverage to Support Strategy
1Net of unamortized debt discount and debt issuance costs2Based on twelve months ended June 30, 2017, Adjusted EBITDA of $100.1M and total debt of $229.9M, net of unamortized debt discount and debt issuance costs3Based on twelve months ended June 30, 2017, Adjusted EBITDA of $100.1M and net debt of $159.6M, net of unamortized debt discount, debt issuance costs and
cash balance at June 30, 2017

19
1Free Cash Flow = Operating Cash Flow – Capital Expenditures2Free Cash Flow after Distributions to RIHI = Free Cash Flow – Tax and other discretionary non-dividend distributions paid to RIHI to enable RIHI to satisfy its
income tax obligations3Unencumbered Cash Generated = Free Cash Flow after Distributions to RIHI – Quarterly debt principal payments – Annual excess cash flow payment on debt, see Appendix for reconciliation of Non-GAAP measures
$64$60
$50
$35
Operating CashFlow
Free CashFlow
Free CashFlow after
Distributionsto RIHI
UnencumberedCash Generated
Full-Year 2016
Acquire independent regions
Reinvest in the business
Other acquisitions
Return of capital
1
2
3
4
1
2
3
63% 37%As % of
Adj. EBITDA
Capital Allocation Priorities
52%
$’s in Millions
Cash Flow Generation Fuels Capital Allocation Strategy
Strong Annual Adjusted EBITDA Conversion to FCF

20
Leading Real Estate Franchisor
#1 Real Estate Franchise Brand1 with Unmatched
Global Footprint
Highly Productive Network of More Than 115,000
Agents
Agent-Centric Model is Different and Better
Stable, Recurring Fee-Based Revenue Model with Strong
Margins and Cash Flow
100% Franchised Business
Multiple Drivers of Shareholder Value Creation
1Source: MMR Strategy Group survey of unaided brand awareness in the U.S. and Canada

Each Office Independently Owned and Operated. 17_191524

22
200
250
300
350
400
450
500
550
600
650
Positive Forecasts for 2016 & 2017Gradual Expansion of the Housing Market Continues
1Source: NAR (National Association of Realtors) – Existing Home Sales, numbers presented are not seasonally adjusted; June 2013 through June 20172Source: NAR (National Association of Realtors) – U.S. Economic Outlook, July 20173Source: Fannie Mae – Economic and Strategic Research – Housing Forecast, July 20174Source: NAHB (National Association of Home Builders) – Housing and Interest Rate Forecast June 2017
Monthly Existing Home Sales1 (Thousands) Annual Existing Home Sales2,3 (M)
Housing Starts - Single Family3,4 (Thousands)Home Price Appreciation2,3 (YoY)
5.3
5.5
5.65.7
5.3
5.5
5.6
5.8
2015 2016 2017e 2018e
Fannie Mae NAR
5.9%6.2%
5.8%
4.7%
6.8%
5.1% 5.1%
3.5%
2015 2016 2017e 2018e
Fannie Mae NAR
713 782
831
945
713 784
855
961
2015 2016 2017e 2018e
Fannie Mae NAHB

23
Mortgage Finance ForecastsPurchase Originations Expected to Grow, Rates to Rise Slowly
1Source: Mortgage Bankers Association – MBA Mortgage Finance Forecast July 2017
Loan Originations1 Mortgage & Interest Rates1
3.6%4.2%
4.9%5.3%
1.8%
2.5%3.0%
3.5%
2016 2017e 2018e 2019e
30-Year Fixed 10-Year Treasury
$990
$1,089$1,178
$1,245
$901
$538
$410 $395
2016 2017e 2018e 2019e
Purchase Refinance

24
(Unaudited) (Amounts in thousands)
RE/MAX Holdings, Inc. Adjusted EBITDA Reconciliation to Net Income (Reflects RE/MAX Holdings with 100% ownership of RMCO, LLC)
Net income $ 47,810 $ 51,350 $ 43,979
Depreciation and amortization 16,094 15,124 15,316
Interest expense 8,596 10,413 9,295
Interest income (160) (178) (313)
Provision for income taxes 15,273 12,030 9,948
Gain on sale or disposition of assets and sublease (1) (171) (3,650) (340)
Loss on early extinguishment of debt and debt modif ication expense (2) 2,893 94 178
Equity-based compensation expense 2,330 1,453 2,002
Public offering related expenses (3) 193 1,097 —
Acquisition related expenses (4) 1,899 2,750 313
Adjusted EBITDA (5) $ 94,757 $ 90,483 $ 80,378
Adjusted EBITDA margin (5) 53.7 % 51.2 % 47.0 %
2014
Year Ended December 31,
2016 2015
(1) Represents gains on the sale or disposition of assets as well as the gains on the sublease of a portion of the Company’s corporate headquarters office building.
(2) Represents losses incurred on early extinguishment of debt on the Company’s credit facility for each full-year period presented as well as costs associated with the
refinancing of the Company’s credit facility during the year ended December 31, 2016.
(3) Represents costs incurred for compliance services performed in connection with the issuance of shares of Class A common stock as a result of the RIHI, Inc. (“RIHI”)
redemption of 5,175,000 common units in RMCO during the fourth quarter of 2015 (the “Secondary Offering”).
(4) Acquisition-related expenses include fees incurred in connection with the Company’s acquisitions of certain assets of HBN, Inc. (“HBN”) and Tails, Inc. (“Tails”) in October
2013, the acquisition of six Independent Regions (New York, Alaska, New Jersey, Georgia, Kentucky/Tennessee and Southern Ohio, collectively, the (“2016 Acquired
Regions”) and the acquisition of Full House Mortgage Connection, Inc., now known as Motto Mortgage (“Motto”). Costs include legal, accounting and advisory fees as well
as consulting fees for integration services.
(5) Non-GAAP measure. See the end of this presentation for definitions of Non-GAAP measures.

25
(Unaudited) (Amounts in thousands)
RE/MAX Holdings, Inc. Adjusted Net Income and Adjusted EPS Reconciliation to Net Income (Reflects RE/MAX Holdings with 100% ownership of RMCO, LLC)
Net income $ 47,810 $ 51,350 $ 43,979
Amortization of franchise agreements 14,590 13,566 13,566
Provision for income taxes 15,273 12,030 9,948
Add-backs:
Gain on sale or disposition of assets and sublease (1) (171) (3,650) (340)
Loss on early extinguishment of debt and debt modif ication expense (2) 2,893 94 178
Equity-based compensation 2,330 1,453 2,002
Public offering related expenses (3) 193 1,097 —
Acquisition related expenses (4) 1,899 2,750 313
Adjusted pre-tax net income 84,817 78,690 69,646
Less: Provision for income taxes at 38% (32,230) (29,902) (26,465)
Adjusted net income (5) $ 52,587 $ 48,788 $ 43,181
Total basic pro forma shares outstanding 30,188,341 29,925,446 29,345,764
Total diluted pro forma shares outstanding 30,237,368 30,083,609 29,976,577
Adjusted net income basic earnings per share (5) $ 1.74 $ 1.63 $ 1.47
Adjusted net income diluted earnings per share (5) $ 1.74 $ 1.62 $ 1.44
2016 2015 2014
Year Ended December 31,
(1) Represents gains on the sale or disposition of assets as well as the gains on the sublease of a portion of the Company’s corporate headquarters office building.
(2) Represents losses incurred on early extinguishment of debt on the Company’s credit facility for each full-year period presented as well as costs associated with the
refinancing of the Company’s credit facility during the year ended December 31, 2016.
(3) Represents costs incurred for compliance services performed in connection with the Secondary Offering.
(4) Acquisition-related expenses include fees incurred in connection with the Company’s acquisitions of certain assets of HBN and Tails in October 2013, the 2016 Acquired
Regions and the acquisition of Motto. Costs include legal, accounting and advisory fees as well as consulting fees for integration services.
(5) Non-GAAP measure. See the end of this presentation for definitions of Non-GAAP measures.

26
RE/MAX Holdings, Inc. Free Cash Flow and Unencumbered Cash Generation
(1) Non-GAAP measure. See the end of this presentation for definitions of non-GAAP measures.
Cash flow from operations $ 64,379 $ 77,358
Less: Capital expenditures (4,395) (3,546)
Free cash flow (1) 59,984 73,812
Free cash flow 59,984 73,812
Less: Tax and Other non-dividend discretionary distributions to RIHI (10,391) (7,358)
Free cash flow after tax and non-dividend discretionary distributions to RIHI (1) 49,593 66,454
Free cash flow after tax and non-dividend discretionary distributions to RIHI 49,593 66,454
Less: Quarterly debt principal payments (2,081) (2,080)
Less: Annual excess cash flow (ECF) payment (12,727) (7,320)
Unencumbered cash generated (1) $ 34,785 $ 57,054
Summary
Cash flow from operations $ 64,379 $ 77,358
Free cash flow $ 59,984 $ 73,812
Free cash flow after tax and non-dividend discretionary distributions to RIHI $ 49,593 $ 66,454
Unencumbered cash generated $ 34,785 $ 57,054
Adjusted EBITDA $ 94,647 $ 91,401
Free cash flow as % of Adjusted EBITDA 63.4% 80.8%
Free cash flow less distributions to RIHI as % of Adjusted EBITDA 52.4% 72.7%
Unencumbered cash generated as % of Adjusted EBITDA 36.8% 62.4%
Year Ended December 31,
2016 2015
27
Non-GAAP Financial Measures
The SEC has adopted rules to regulate the use in filings with the SEC and in public disclosures of financial measures that are not in accordance with U.S. GAAP, such as Adjusted EBITDA
and the ratios related thereto, Adjusted net income, Adjusted basic and diluted earnings per share (Adjusted EPS) and Free cash flow. These measures are derived on the basis of
methodologies other than in accordance with U.S. GAAP.
The Company calculates Adjusted EBITDA as EBITDA (consolidated net income before depreciation and amortization, interest expense, interest income and the provision for income taxes,
each of which is presented in the unaudited condensed consolidated financial statements included in the Quarterly Report on Form 10-Q), adjusted for the impact of the following items that
are either non-cash or the Company does not consider representative of its ongoing operating performance: loss or gain on sale or disposition of assets and sublease, loss on early
extinguishment of debt, professional fees and certain expenses incurred in connection with the Secondary Offering, acquisition-related expenses and equity-based compensation expense.
Adjusted EBITDA margin represents Adjusted EBITDA as a percentage of revenue.
During the first quarter of 2017, the Company revised its definitions of Adjusted EBITDA and Adjusted EBITDA margin to better reflect the performance of the business and comply with SEC
guidance. The Company now adjusts for equity-based compensation expense and no longer adjusts for straight-line rent expense and severance-related expenses. Adjusted EBITDA and
Adjusted EBITDA margin were revised in prior periods to reflect this change for consistency in presentation.
Because Adjusted EBITDA and Adjusted EBITDA margin omit certain non-cash items and other non-recurring cash charges or other items, the Company believes that each measure is less
susceptible to variances that affect its operating performance resulting from depreciation, amortization and other non-cash and non-recurring cash charges or other items. The Company
presents Adjusted EBITDA and the related Adjusted EBITDA margin because the Company believes they are useful as supplemental measures in evaluating the performance of its operating
businesses and provides greater transparency into the Company’s results of operations. The Company’s management uses Adjusted EBITDA and Adjusted EBITDA margin as factors in
evaluating the performance of the business.
Adjusted EBITDA and Adjusted EBITDA margin have limitations as analytical tools, and you should not consider these measures in isolation or as a substitute for analyzing the Company’s
results as reported under U.S. GAAP. Some of these limitations are:
• these measures do not reflect changes in, or cash requirements for, the Company’s working capital needs;
• these measures do not reflect the Company’s interest expense, or the cash requirements necessary to service interest or principal payments on its debt;
• these measures do not reflect the Company’s income tax expense or the cash requirements to pay its taxes;
• these measures do not reflect the cash requirements to pay dividends to stockholders of the Company’s Class A common stock and tax and other cash distributions to its non-controlling
unitholders;
• these measures do not reflect the cash requirements to pay RIHI Inc. and Oberndorf pursuant to the tax receivable agreements;
• although depreciation and amortization are non-cash charges, the assets being depreciated and amortized will often require replacement in the future, and these measures do not reflect
any cash requirements for such replacements;
• although equity-based compensation is a non-cash charge, the issuance of equity-based awards may have a dilutive impact on earnings per share; and
• other companies may calculate these measures differently so similarly named measures may not be comparable.
The Company’s Adjusted EBITDA margin guidance does not include certain charges and costs. The adjustments to EBITDA margin in future periods are generally expected to be similar to
the kinds of charges and costs excluded from Adjusted EBITDA margin in prior quarters, such as gain on sale or disposition of assets and sublease and acquisition related expenses, among
others. The exclusion of these charges and costs in future periods will have a significant impact on the Company’s Adjusted EBITDA margin. The Company is not able to provide a
reconciliation of the Company’s Non-GAAP financial guidance to the corresponding U.S. GAAP measures without unreasonable effort because of the uncertainty and variability of the nature
and amount of these future charges and costs.

28
Adjusted net income is calculated as Net income attributable to RE/MAX Holdings, assuming the full exchange of all outstanding non-controlling interests for shares of Class A common
stock as of the beginning of the period (and the related increase to the provision for income taxes after such exchange), plus primarily non-cash items and other items that management does
not consider to be useful in assessing the Company’s operating performance (e.g., amortization of acquired intangible assets, gain on sale or disposition of assets and sub-lease, loss on
early debt extinguishment, public-offering related expenses, acquisition-related expenses and equity-based compensation expense).
Adjusted basic and diluted earnings per share (Adjusted EPS) are calculated as Adjusted net income (as defined above) divided by pro forma (assuming the full exchange of all
outstanding non-controlling interests) basic and diluted weighted average shares, as applicable.
When used in conjunction with GAAP financial measures, Adjusted net income and Adjusted EPS are supplemental measures of operating performance that management believes are
useful measures to evaluate the Company’s performance relative to the performance of its competitors as well as performance period over period. By assuming the full exchange of all
outstanding non-controlling interests, management believes these measures:
• facilitate comparisons with other companies that do not have a low effective tax rate driven by a non-controlling interest on a pass-through entity;
• facilitate period over period comparisons because they eliminate the effect of changes in Net income attributable to RE/MAX Holdings, Inc. driven by increases in its ownership of RMCO,
LLC, which are unrelated to the Company’s operating performance; and
• eliminate primarily non-cash and other items that management does not consider to be useful in assessing the Company’s operating performance.
Free cash flow is calculated as cash flows from operations less capital expenditures, both as reported under GAAP, and quantifies how much cash a company has to pursue opportunities
that enhance shareholder value. The Company believes free cash flow is useful to investors as a supplemental measure as it calculates the cash flow available for working capital needs, re-
investment opportunities, potential independent region and strategic acquisitions, dividend payments or other strategic uses of cash.
Free cash flow after tax and non-dividend distributions to RIHI is calculated as free cash flow less tax and other non-dividend distributions paid to RIHI (the non-controlling interest
holder) to enable RIHI to satisfy its income tax obligations. Similar payments would be made by the Company directly to federal and state taxing authorities as a component of the Company’s
consolidated provision for income taxes if a full exchange of non-controlling interests occurred in the future. As a result and given the significance of the Company’s ongoing tax and non-
dividend distribution obligations to its non-controlling interest, free cash flow after tax and non-dividend distributions, when used in conjunction with GAAP financial measures, provides a
meaningful view of cash flow available to the Company to pursue opportunities that enhance shareholder value.
Unencumbered cash generated is calculated as free cash flow after tax and non-dividend distributions to RIHI less quarterly debt principal payments less annual excess cash flow payment
on debt, as applicable. Given the significance of the Company’s excess cash flow payment on debt, when applicable, unencumbered cash generated, when used in conjunction with GAAP
financial measures, provides a meaningful view of the cash flow available to the Company to pursue opportunities that enhance shareholder value after considering its debt service
obligations.
Non-GAAP Financial Measures (continued)