Investor Presentation - twse.com.tw
23
Investor Presentation December 2018
Transcript of Investor Presentation - twse.com.tw

Investor Presentation
December 2018

2
01 Introduction
02 Target Niche Markets to Fuel Sales
Growth
03 The Global Tek Alliance
04
Agenda
Automotive Safety Systems
(Airbag Inflators)
Execution
05 Robust Financial Performance

Global Tek - A Niche Machining Expert
⚫ Founded in 2000 & Listed on TWSE on Feb. 5th, 2018 (Ticker: 4566 TT)
⚫ Employees: 900+
⚫ Founders + management team shareholdings are more than 50%
⚫ Revenue: NT$3.3bn in 2017 with +23% 2013-17 sales CAGR
⚫ Products: Precision metal machining for airbag inflator, powertrain system
components, industrial applications and aviation products
3
Source: TEJ and Global Tek

4
Target Niche Markets to
Fuel Sales Growth
Powertrain System
Components

5
Liters per 100km EU US China
2015 5.6 7.4 6.9
2025 3-3.4 4.7 4
Avg. 5% reduction
per year
Our powertrain products enhance fuel efficiency and are used in enhanced ICE and
electrified drivetrains automobiles:
⚫ Dual Clutch Transmissions (DCT) improve fuel economy by 5~15%
⚫ Overrunning Alternator Decoupling (OAD) Systems improve fuel economy by 5%
⚫ Crankshaft vibration dampers are used in three-cylinder engines and hybrid cars
Auto Industry Trends Favor Powertrain Sales Growth
Source: Global
Tek
Government Mandated Fuel Consumption Targets for Passenger Cars

6
Our Product Portfolio
Airbag Inflator(24% 3Q18 sales)
Powertrain System
components(40% 3Q18 sales)
Industrial
Applications(25% 3Q18 sales)
Aviation
Products(11% 3Q18 sales)
Key components,
including igniter, diffuser
and sealing & inflator
subassembly
Hybrid and Three-
Cylinder Engine
Compatible:
• OAD and basfilter
• Crankshaft damper/pulley
• Vacuum pump component
• DCT: Dual-Clutch
Transmission components
• Modular camshaft head
and tailstock
•Oil refinery industrial
instruments
• Semiconductor wafer
fab instruments
• High-end bicycle
suspension and
transmission systems
•Landing gear
•Engine accessories
•Flight control
actuator
components
•Proximity sensor
components

7
Continuous Growth on End Demand
Airbag InflatorPowertrain System
ComponentsIndustrial
ApplicationsAviation Products
• Average # of airbags per
car to increase to 5.2 by
2020 from 3.5 in 2014.
• Emission reduction
• Engine downsizing
• Increasing clean energy
vehicles
• Rising capex at IC
Fabs & Oil Refineries
• High end and electric
bicycles
• New aircraft
demand
• LEAP engine rising
penetration
• Global Airbag market to
grow at 4% pa, reaching
US$5bn by 2021
• Includes knee, side,
frontal, external and
curtain airbags
• Out of 2023’s 110mn global
vehicles, 30% are expected to
be Advanced ICEs (down-
sized w/turbo)
• 7% are expected to be clean
energy vehicles vs. 5% in
2018
• Global Semi capex for
≤10nm to grow at a
21% CAGR from
2020-25
• WW bicycle mkt to
grow at a 4% CAGR
from 2018-26
• Global aircraft
volume to grow at a
4% CAGR between
2016 and 2036
Source: GIA, IHS, SEMI, Persistence Market Research, Airbus and Boeing

8
Tier 1 Customer Portfolio
Airbag InflatorPowertrain System
ComponentsIndustrial Applications Aviation Products
In-p
lan
t in
teg
rati
on
In-h
ou
se c
ap
acit
y
In-p
lan
t in
teg
rati
on
In-h
ou
se c
ap
acit
y
Note: Key Safety Systems (KSS) acquired the global assets of Japan-
based Takata Corporation in April 2018, with financial backing from KSS
parent Joyson Electronics (based in Ningbo, China), PAG, an Asia
based private equity firm and the Future Industry Investment Fund
("SDIC").
Our customers have a
65%+ share of the global
airbag market
9
Superior Track Record of Client
Satisfaction
Approved as a
Supplier of
Control
Systems
2012
Group Annual
Supplier Award
for 10 straight
years
2002-2012
Best Supplier
Award
2009-2010
Annual Merit
Supplier Award
2012
Best Supplier,
Drive
Line Systems
2013
Best Supplier,
Drive
Line Systems
2013
Annual
International
Excellent
Service Award
2013
Outstanding
Supplier Award
2009
Outstanding
Quality Award
2012
Best Supplier
Award
2001-2008
Outstanding
Supplier Award
2013
Outstanding
Progress
Award
2015
Outstanding
Cooperation
Award
2015
Outstanding
Quality
Award
2016
Annual
Performance
Supplier Award
2011

The Global Tek Alliance
10
“All for one, one for all”- Alexandre Dumas, The Three Musketeers

11
Balanced Deployment of Manufacturing Resources
Quality system:
Specialization:
Automotive
Industrial
Aviation
Core processes:
Dewaxing casting
CNC machining
Quality system:
Specialization:
Automotive
Core processes:
Forging / Bar stock
CNC machining
Taiwan – Xinwu Factory40% total sales (2017)
340 employees
China – Wuxi Factory52% total sales (2017)
444 employees
China – Xi’an Factory8% total sales (2017)
130 employees
Quality system:
Specialization:
Industrial
Aviation
Core processes:
CNC machining
In-plant integration In-house capacity

12
Growth Engine #1 : In-House Capability ◆ Targeting complex and critical components
◆ Powertrain and aviation product manufacturing
Improving Gross Margin
Growth Engine #2 : In-Plant Integration◆ Targeting less complex components
◆ Industrial and airbag-related products
◆ Supply chain resource management
Increasing Cash Flow
In-House + In-Plant = Alliance
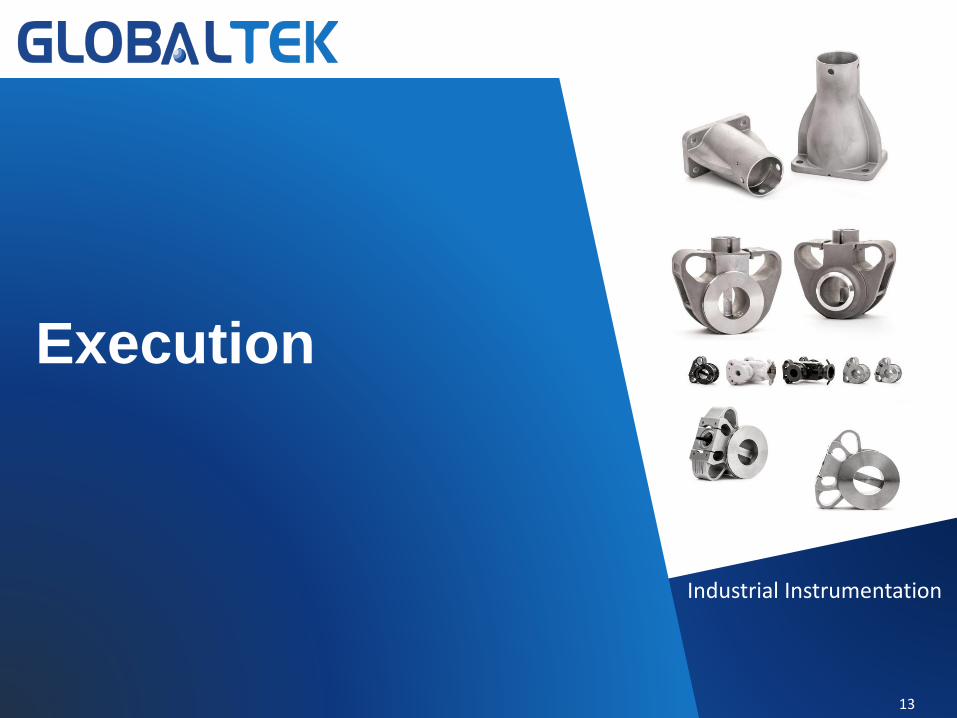
Execution
Industrial Instrumentation
13
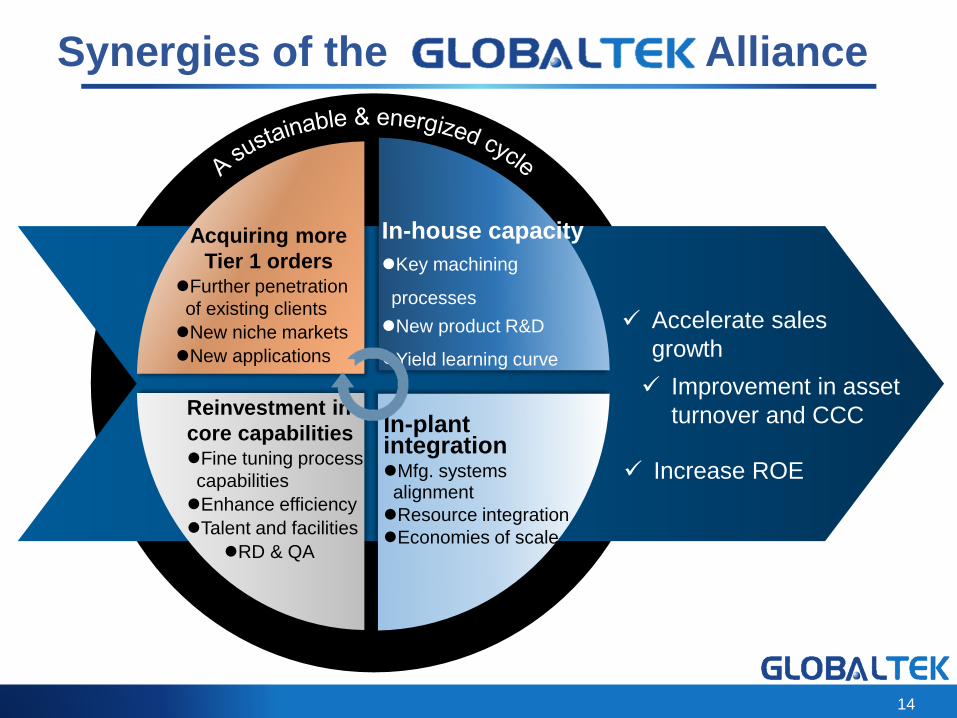
Acquiring more
Tier 1 orders⚫Further penetration
of existing clients
⚫New niche markets
⚫New applications
In-house capacity
⚫Key machining
processes
⚫New product R&D
⚫Yield learning curve
✓ Accelerate sales
growth
✓ Improvement in asset
turnover and CCC
14
In-plant integration⚫Mfg. systems alignment
⚫Resource integration
⚫Economies of scale
Reinvestment in
core capabilities ⚫Fine tuning process
capabilities
⚫Enhance efficiency
⚫Talent and facilities
⚫RD & QA
Synergies of the Alliance
✓ Increase ROE
15
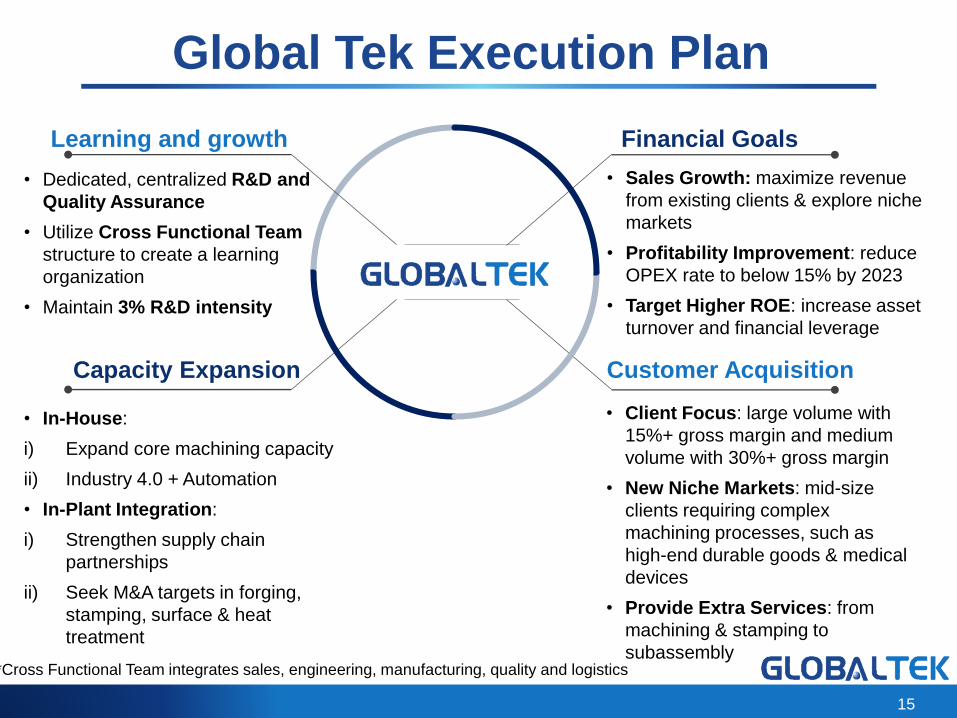
Global Tek Execution Plan
Learning and growth
Capacity Expansion
• In-House:
i) Expand core machining capacity
ii) Industry 4.0 + Automation
• In-Plant Integration:
i) Strengthen supply chain
partnerships
ii) Seek M&A targets in forging,
stamping, surface & heat
treatment
Financial Goals
Customer Acquisition
• Client Focus: large volume with
15%+ gross margin and medium
volume with 30%+ gross margin
• New Niche Markets: mid-size
clients requiring complex
machining processes, such as
high-end durable goods & medical
devices
• Provide Extra Services: from
machining & stamping to
subassembly
• Sales Growth: maximize revenue
from existing clients & explore niche
markets
• Profitability Improvement: reduce
OPEX rate to below 15% by 2023
• Target Higher ROE: increase asset
turnover and financial leverage
• Dedicated, centralized R&D and
Quality Assurance
• Utilize Cross Functional Team
structure to create a learning
organization
• Maintain 3% R&D intensity
*Cross Functional Team integrates sales, engineering, manufacturing, quality and logistics

16
Winning Formula
Investment in Superior Human Resources 41% of employees are college graduates, R&D staff are 5% of total
work force and 11% of R&D staff have a Master’s degree or above
Build a Defendable Niche in Our Focus MarketsForm strategic partnerships with top-five clients in each niche
market and support them with the cross function team structure and
agility
Supply Chain CollaborationShare resources with supply chain partners; pre-emptively
invest in in-house capacity and in-plant integration
Efficient Working Capital ManagementLower AR days, longer AP days and an 82% asset turnover ratio
result in a shorter cash conversion cycle than our peers
17
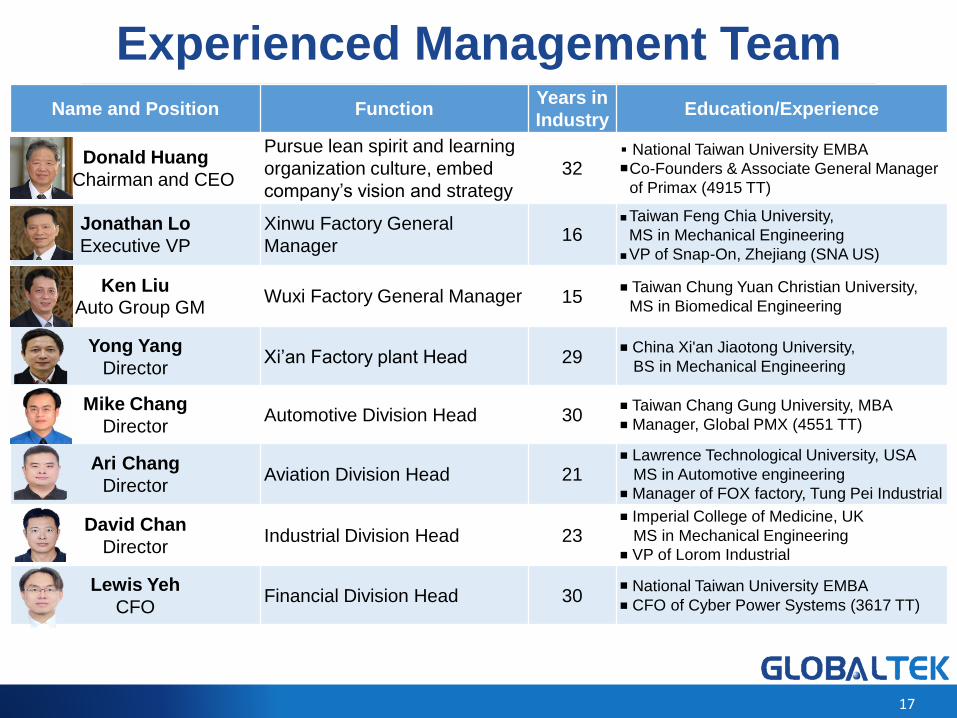
Name and Position FunctionYears in
IndustryEducation/Experience
Donald Huang
Chairman and CEO
Pursue lean spirit and learning
organization culture, embed
company’s vision and strategy
32■ National Taiwan University EMBA◼Co-Founders & Associate General Manager
of Primax (4915 TT)
Jonathan Lo
Executive VP
Xinwu Factory General
Manager16
◼Taiwan Feng Chia University,
MS in Mechanical Engineering
◼VP of Snap-On, Zhejiang (SNA US)
Ken LiuAuto Group GM
Wuxi Factory General Manager 15 ■ Taiwan Chung Yuan Christian University,
MS in Biomedical Engineering
Yong Yang
DirectorXi’an Factory plant Head 29
■ China Xi'an Jiaotong University,
BS in Mechanical Engineering
Mike Chang
DirectorAutomotive Division Head 30
■ Taiwan Chang Gung University, MBA
■ Manager, Global PMX (4551 TT)
Ari Chang
DirectorAviation Division Head 21
■ Lawrence Technological University, USA
MS in Automotive engineering
■ Manager of FOX factory, Tung Pei Industrial
David Chan
DirectorIndustrial Division Head 23
■ Imperial College of Medicine, UK
MS in Mechanical Engineering
■ VP of Lorom Industrial
Lewis Yeh
CFOFinancial Division Head 30
■ National Taiwan University EMBA
■ CFO of Cyber Power Systems (3617 TT)
Experienced Management Team
18
Robust Financial
Performance
Aviation Products

19
3Q18 Review and 2H18 Outlook
3Q18 Review
⚫ Revenue was NT$2.6bn., up 4% YoY.
➢ Airbag inflator sales declined 36% YoY, due to an higher 2017 base (Takata
recall-related demand) and due to Takata/KSS order adjustments in 2018.
➢ Sales from Powertrain Systems, Industrial Applications and Aviation grew
30%, 18% and 57% YoY respectively.
⚫ Gross margin decreased to 20% from 3Q17’s 23%, due to NT$ and RMB
strength vs the US$, rising raw material prices and changes in product mix.
⚫ Operating margin decreased to 5% from 3Q17’s 7%, due to the lower gross
margin and due to set up expenses for the Germany office (future EU sales HQ).
⚫ Non-op income was NT$1448mn, up 349% YoY, due to disposal of land assets
and FX gains.
⚫ Net income was NT$191mn, up 23% YoY.
2H18 Outlook⚫ The Takata/KSS order adjustment process is expected to last through 4Q18.
⚫ The demand outlook for Powertrain, Industrial and Aviation products is strong.
⚫ We expect gross margin to improve due to manufacturing efficiency
improvements and RMB/NT$ depreciation.

1,435 1,811
2,208 2,676
3,335
2,604
8
44
111130
198
0
50
100
150
200
250
-
500
1,000
1,500
2,000
2,500
3,000
3,500
4,000
2013 2014 2015 2016 2017 1Q-3Q18
Revenue Net profit after tax (RHS)
20
Financial Highlights
1.0
2.4
42
70
0
10
20
30
40
50
60
70
80
0.0
1.0
2.0
3.0
4.0
5.0
2016 2017
Dividend per share Payout (%) (RHS)
NT$mn NT$mn
NT$
NT$
Source: TEJ and Capital IQ

21
2013-3Q18 Income Statement
Source: TEJ and Capital IQ
2014 2015 2016 2017 1Q-3Q18
Revenue 1,435 1,811 2,208 2,676 3,335 2,604 26.3 21.9 21.2 24.6 4.4
Gross Profit 247 368 502 637 764 532 48.8 36.6 26.9 19.9 -6.5
Operating Expenses -218 -267 -326 -379 -476 -399 22.3 22.0 16.4 25.6 2.7
Operating Profit 29 101 177 258 288 133 248.8 75.3 46.1 11.5 -26.4
Pretax Income 38 69 142 205 291 278 84.0 104.6 44.1 41.9 24.9
Tax Expenses -31 -26 -31 -75 -92 -87 -14.5 19.6 138.2 23.4 30.4
Net Income to Parent 8 44 111 130 198 191 476.8 150.0 17.4 52.5 22.6
Basic EPS (NT$) 0.18 0.98 2.04 2.36 3.41 2.95 444.4 108.2 15.7 44.5 8.9
Key Financial Ratios (%)
Gross Margin 17.2 20.3 22.8 23.8 22.9 20.4
Operating Expense Ratio 15.2 14.7 14.8 14.2 14.3 15.3
Operating Margin 2.0 5.6 8.0 9.6 8.6 5.1
Effect Tax Rate 81.3 37.8 22.1 36.5 31.8 31.2
Net Margin 0.5 2.4 5.0 4.9 5.9 7.3
1Q-
3Q18
YoY (%)2017NT$mn 2013 2014 2015 2016

22
2013-3Q18 Balance Sheet
Source: TEJ and Capital IQ
2014 2015 2016 2017 3Q18
Total Assets 1,745 2,208 2,422 3,002 4,052 4,451 26.5 9.7 24.0 35.0 12.2
Cash 103 200 279 502 670 874 93.8 39.6 80.4 33.4 9.6
AR & NR 434 616 606 732 936 926 41.9 -1.6 20.8 28.0 5.9
Inventories 290 384 426 484 714 821 32.4 11.1 13.5 47.5 23.2
Fixed Assets 811 739 820 800 844 833 -9.0 11.0 -2.4 5.5 2.4
Total Liabilities 1,176 1,528 1,335 1,837 2,395 2,377 30.0 -12.6 37.6 30.4 0.7
AP & NP 371 412 389 733 692 634 11.0 -5.6 88.4 -5.6 -1.7
Total Equity 569 680 1,087 1,166 1,658 2,074 19.4 59.9 7.3 42.2 29.1
Key Financial Ratios
A/R Turnover Days - 104.3 99.6 90.0 90.0 96.6
Inventory Turnover Days - 84.0 85.5 80.4 83.8 100.0
A/P Turnover Days - 97.7 84.5 99.1 99.7 86.4
Cash Conversion Days - 90.6 100.5 71.3 74.1 110.2
ROE (%) - 7.1 12.5 11.5 14.0 10.2
ROA (%) - 2.2 4.8 4.8 5.6 4.5
Net debt (cash)/Equity (%) 96.8 98.1 34.6 9.7 28.1 10.6
3Q18YoY (%)
2017NT$mn 2013 2014 2015 2016

23
Disclaimer• The information contained in this confidential document ("Presentation") has been prepared by Global Tek (the "Company"). It has not been fully
verified and is subject to material updating, revision and further amendment.
• While the information contained herein has been prepared in good faith, neither the Company nor any of its shareholders, directors, officers,
agents, employees or advisers gives, has given or has authority to give, any representations or warranties (express or implied) as to, or in relation
to, the accuracy, reliability or completeness of the information in this Presentation, or any revision or supplement thereof, or of any other written or
oral information made or to be made available to any interested party or its advisers (all such information being referred to as "Information") and
liability therefore is expressly disclaimed. Accordingly, neither the Company nor any of its shareholders, directors, officers, agents, employees or
advisers takes any responsibility for, or will accept any liability whether direct or indirect, express or implied, contractual, tortious, statutory or
otherwise, in respect of, the accuracy or completeness or injury of the Information or for any of the opinions contained herein or for any errors,
omissions or misstatements or for any loss, howsoever arising, from the use of this Presentation or the information.
• Neither the issue of this Presentation nor any part of its contents is to be taken as any form of commitment on the part of the Company to proceed
with any transaction and the right is reserved by the Company to terminate any discussions or negotiations with any prospective investors. In no
circumstances will the Company be responsible for any costs, losses or expenses incurred in connection with any appraisal or investigation of the
Company. In furnishing this Presentation, the Company does not undertake or agree to any obligation to provide the recipient with access to any
additional information or to update this Presentation or to correct any inaccuracies in, or omissions from, this Presentation which may become
apparent.
• This Presentation should not be considered as the giving of investment advice by the Company or any of its shareholders, directors, officers,
agents, employees or advisers. Each party to whom this Presentation is made available must make its own independent assessment of the
Company after making such investigations and taking such advice as may be deemed necessary. In particular, any estimates or projections or
opinions contained herein necessarily involve significant elements of subjective judgment, analysis and assumptions and each recipient should
satisfy itself in relation to such matters.
• This Presentation includes certain statements that may be deemed “forward-looking statements”. All statements in this discussion, other than
statements of historical facts, that address future activities and events or developments that the Company expects, are forward-looking statements.
Although the Company believes the expectations expressed in such forward-looking statements are based on reasonable assumptions, such
statements are not guarantees of future performance and actual results or developments may differ materially from those in the forward-looking
statements. Factors that could cause actual results to differ materially from those in forward-looking statements include market prices, continued
availability of capital and financing, general economic, market or business conditions and other unforeseen events. Prospective Investors are
cautioned that any such statements are not guarantees of future performance and that actual results or developments may differ materially from
those projected in forward-looking statements.