Investor Presentation - · PDF fileDisclaimer . This presentation ... affiliate securities ......
45
© 2017 Envigo Investor Presentation August 2017
Transcript of Investor Presentation - · PDF fileDisclaimer . This presentation ... affiliate securities ......

© 2017 Envigo
Investor Presentation August 2017

38
48
55
115
180
4
229
118
98
166
166
166
111
111
111
143
178
199
Disclaimer This presentation (the “Presentation”) has been prepared solely for, and is being delivered on a confidential basis to, persons considering a possible
business relationship with Avista Heathcare Public Acquisition Corp. (the “Company”) or its affiliates, including Avista Capital Holdings, L.P. and its
affiliates (“Avista”). This Presentation is for informational purposes only and does not constitute an offer to sell, a solicitation of an offer to buy, or a
recommendation to purchase any equity, debt or other financial instruments of Envigo Holdings, Inc. (“Envigo”) or any of Envigo’s or the Company’s
affiliate securities (as such term is defined under U.S. Federal Securities Laws). No offer of securities shall be made except by means of a prospectus
meeting the requirements of the Securities Act of 1933, as amended, and applicable regulations in the Cayman Islands. Any reproduction of this
Presentation, in whole or in part, or the disclosure of its contents, without the prior consent of the Company is prohibited. By accepting this Presentation,
each recipient agrees: (i) to maintain the confidentiality of all information that is contained in this Presentation and not already in the public domain and (ii)
to use this Presentation for the sole purpose of evaluating a business relationship with the Company or its affiliates.
Forward-Looking Statements
This Presentation includes “forward looking statements” within the meaning of the “safe harbor” provisions of the United States Private Securities Litigation Reform Act
of 1995. Forward-looking statements may be identified by the use of words such as “forecast,” “intend,” “seek,” “target,” “anticipate,” “believe,” “expect,” “estimate,”
“plan,” “outlook,” and “project” and other similar expressions that predict or indicate future events or trends or that are not statements of historical matters. Such forward
looking statements include estimated financial information. Such forward looking statements with respect to revenues, earnings, performance, strategies, prospects and
other aspects of the businesses of the Company, Envigo or the combined company after completion of the proposed business combination are based on current
expectations that are subject to known and unknown risks and uncertainties, which could cause actual results or outcomes to differ materially from expectations
expressed or implied by such forward looking statements. These factors include, but are not limited to: (1) the occurrence of any event, change or other circumstances
that could give rise to the termination of the agreement governing the business combination between the Company and Envigo (the “Transaction Agreement”) and the
proposed business combination contemplated therein; (2) the inability to complete the transactions contemplated by the Transaction Agreement due to the failure to
obtain approval of the stockholders of the Company or other conditions to closing in the Transaction Agreement; (3) the abili ty to meet applicable listing standards
following the consummation of the transactions contemplated by the Transaction Agreement; (4) the risk that the proposed transaction disrupts current plans and
operations of Envigo as a result of the announcement and consummation of the transactions described herein; (5) the ability to recognize the anticipated benefits of the
proposed business combination, which may be affected by, among other things, competition, the ability of the combined company to grow and manage growth
profitably, maintain relationships with customers and suppliers and retain its management and key employees; (6) costs related to the proposed business combination;
(7) changes in applicable laws or regulations; (8) the possibility that Envigo may be adversely affected by other economic, business, and/or competitive factors; and (9)
other risks and uncertainties indicated from time to time in the final prospectus of the Company, including those under “Risk Factors” therein, and other documents filed
or to be filed with the Securities and Exchange Commission (“SEC”) by the Company. You are cautioned not to place undue reliance upon any forward-looking
statements, which speak only as of the date made. The Company and Envigo undertake no commitment to update or revise the forward-looking statements, whether as
a result of new information, future events or otherwise. Anyone using the presentation does so at their own risk and no responsibility is accepted for any losses which
may result from such use directly or indirectly. Recipients should carry out their own due diligence in connection with the assumptions contained herein. The forward-
looking statements in this Presentation speak as of the date first written above. Although AHPAC may from time to time voluntarily update its prior forward-looking
statements, it disclaims any commitment to do so whether as a result of new information, future events, changes in assumptions or otherwise except as required by
securities laws.
2

38
48
55
115
180
4
229
118
98
166
166
166
111
111
111
143
178
199
Disclaimer (Cont.) Use of Projections
The financial and operating projections contained herein represent certain estimates of Envigo as of the date hereof. Envigo’s independent public accountants have not
examined, reviewed or compiled the projections and, accordingly, do not express an opinion or other form of assurance with respect thereto. Furthermore, none of the
Company, Envigo nor their respective management teams can give any assurance that the projections contained herein accurately represent Envigo’s results of
operations or financial condition. This Presentation contains financial forecasts with respect to Envigo’s estimated EBITDA, Pro Forma Adjusted EBITDA and Pro Forma
Adjusted EBITDA Margin for Envigo’s fiscal years 2017 and 2018. Neither the Company’s independent auditors, nor the independent public accountants of Envigo,
audited, reviewed, compiled, or performed any procedures with respect to the projections for the purpose of their inclusion in this Presentation, and accordingly, neither
of them expressed an opinion or provided any other form of assurance with respect thereto for the purpose of this Presentation. In this Presentation, certain of the
above-mentioned estimated information has been repeated (in each case, with an indication that the information is an estimate and is subject to the qualifications
presented herein), for purposes of providing comparisons with historical data. The assumptions and estimates underlying the prospective financial information are
inherently uncertain and are subject to a wide variety of significant business, economic and competitive risks and uncertainties, including but not limited to those set-
forth above under “Forward-Looking Statements” that could cause actual results to differ materially from those contained in the prospective financial information.
Accordingly, there can be no assurance that the prospective results are indicative of the future performance of the Company or Envigo or that actual results will not
differ materially from those presented materially from those contained in the prospective financial information. Inclusion of the prospective financial information in this
Presentation should not be regarded as a representation by any person that the results contained in the prospective financial information are indicate of future results or
will be achieved. These variations could materially affect the ability to make payments with respect to any of its outstanding and/or future debt service obligations.
Industry and Market Data
Unless otherwise noted, the forecasted industry and market data contained in the assumptions for the projections are based upon Envigo management estimates and
industry and market publications and surveys. The information from industry and market publications has been obtained from sources believed to be reliable, but there
can be no assurance as to the accuracy or completeness of the included information. Envigo has not independently verified any of the data from third-party sources, nor
has Envigo ascertained the underlying economic assumptions relied upon therein. While such information is believed to be reliable for the purposes used herein, none
of the Company, Envigo, their respective affiliates, nor their respective directors, officers, employees, members, partners, shareholders or agents make any
representation or warranty with respect to the accuracy of such information.
Use of Non-GAAP Financial Measures
This Presentation has not been prepared in accordance with, and does not contain all of the information that is required by, the rules and regulations of the SEC.
EBITDA, Pro Forma Adjusted EBITDA, Adjusted Revenue and the related pro forma information presented in this presentation are supplemental measures of our ability
to service debt that are not required by, or presented in accordance with, generally accepted accounting principles in the United States (“GAAP”). EBITDA, Pro Forma
Adjusted EBITDA and Adjusted Revenue are not measurements of our financial performance under GAAP and neither should be considered as an alternative to net
income, operating income or any other performance measures derived in accordance with GAAP or as an alternative to cash flows from operating activities as a
measure of our liquidity.
3

38
48
55
115
180
4
229
118
98
166
166
166
111
111
111
143
178
199
Disclaimer (Cont.) Envigo believes that these non-GAAP measures of financial results provide useful information to management and investors regarding certain financial and business
trends relating to Envigo’s financial condition and results of operations. Envigo’s management uses these non-GAAP measures to compare Envigo’s performance to
that of prior periods for trend analyses, for purposes of determining management incentive compensation, and for budgeting and planning purposes.
Envigo believes that the use of these non-GAAP financial measures provides an additional tool for investors to use in evaluating ongoing operating results and trends.
Management of Envigo does not consider these non-GAAP measures in isolation or as an alternative to financial measures determined in accordance with GAAP.
Other companies may calculate EBITDA, Pro Forma Adjusted EBITDA and Pro Forma Adjusted EBITDA Margin and other non-GAAP measures differently, and
therefore Envigo’s EBITDA, Pro Forma Adjusted EBITDA and Pro Forma Adjusted EBITDA Margin and other non-GAAP measures may not be directly comparable to
similarly titled measures of other companies. A reconciliation of Non-GAAP measures used in this presentation to the most closely comparable GAAP measure is set
forth in the Appendix.
Additional Information
In connection with the proposed business combination between Envigo and the Company, the Company intends to file with the SEC a preliminary and definitive proxy
statement and will mail a definitive proxy statement and other relevant documentation to the Company’s stockholders. This Presentation does not contain all the
information that should be considered concerning the proposed business combination. It is not intended to form the basis of any investment decision or any other
decision in respect to the proposed business combination. The Company’s stockholders and other interested persons are advised to read, when available, the definitive
proxy statement in connection with the Company’s solicitation of proxies for the special meeting to be held to approve the transactions contemplated by the proposed
business combination because these materials will contain important information about Envigo, the Company and the proposed transactions. The definitive proxy
statement will be mailed to the Company’s stockholders as of a record date to be established for voting on the proposed business combination when it becomes
available. Stockholders will also be able to obtain a copy of the preliminary and definitive proxy statement once it is available, without charge, at the SEC's website at
http://sec.gov or by directing a request to: Avista Healthcare Public Acquisition Corp., 65 East 55th Street, 18th Floor, New York, NY 10022.
This Presentation shall not constitute a solicitation of a proxy, consent or authorization with respect to any securities or in respect of the proposed business combination.
Participation and Solicitation
The Company and its directors, executive officers and other members of its management and employees may be deemed to be participants in the solicitation of proxies
from the Company's stockholders in connection with the proposed business combination. Stockholders are urged to carefully read the proxy statement regarding the
proposed business combination when it becomes available, because it will contain important information. Information regarding the persons who may, under the rules of
the SEC, be deemed participants in the solicitation of the Company's stockholders in connection with the proposed business combination will be set forth in the proxy
statement when it is filed with the SEC. Information about the Company's executive officers and directors also will be set forth in the proxy statement relating to the
proposed business combination when it becomes available.
With respect to nonpublic information, we must also caution you that federal securities laws prohibit the purchase or sale of securities based on such information.
Moreover, you will be made insiders and as such will be restricted from buying and selling securities based on non-public information, and must hold such information in
confidence. If any of you do not wish to be so restricted, you should not attend these presentations or accept the materials prepared in connection therewith.
Certain statements contained herein relate to the Company or certain of its affiliates. An investment in the Company is not an investment in Avista or any such fund.
4

38
48
55
115
180
4
229
118
98
166
166
166
111
111
111
143
178
199
Transaction Overview
Transaction
Highlights
Premier
Sponsorship
and Alignment
of Interests
Management
and Board
5
Avista Healthcare Public Acquisition Corp. (“AHPAC”) and Envigo International Holdings, Inc. (“Envigo”), a
leading early stage contract research organization (“CRO”) providing a diverse set of non-clinical discovery
and safety assessment services for the biopharmaceutical, chemical and crop protection industries as well as
laboratory animal science tools (i.e. research model technologies) have entered into a definitive merger
agreement
Pro forma enterprise value of $924mm represents 10.6x CY18E Pro Forma Adjusted EBITDA
Pro forma net leverage of 3.9x LTM 9/30/2017E Pro Forma Adjusted EBITDA
Expected transaction close by year-end 2017
50% of founder shares allocated to Envigo shareholders
Envigo shareholders will purchase 25% of the private placement warrants
Two warrants are exercisable to purchase one whole Class A ordinary share for $11.50 per share
Assumes $100mm cash consideration to Envigo shareholders at closing
Tax Receivables Agreement provides for Company to make annual cash payments to Envigo shareholders
related to 85% of tax savings resulting from net operating losses generated pre-closing
7 member Board of Directors with at least 4 independent members
Initial board to include at least 2 AHPAC representatives and other qualified individuals including certain
current Envigo board members
Adrian Hardy, current President & Chief Executive Officer, to continue and serve on the Board of Directors
Existing Envigo management to continue to operate the business

38
48
55
115
180
4
229
118
98
166
166
166
111
111
111
143
178
199
Total basic common shares outstanding 65.0
Cost per share $10.00
At issuance equity value $650
Plus: pro forma net debt 274
At issuance enterprise value $924
Metric
x 12/31/17E PF Adj. EBITDA $72.9 12.7x
x LTM 6/30/18E PF Adj. EBITDA $82.5 11.2x
x 12/31/18E PF Adj. EBITDA $87.3 10.6x
Transaction Overview (Cont.)
Illustrative Sources and Uses
6
($mm except per share amounts)
Sources Amount
Rollover debt (non-cash) $294
AHPAC equity 310
Envigo shareholder equity (non-cash) 263
Total sources $867
Uses Amount
Total enterprise value $830
AHPAC estimated fees and expenses 16
Cash to balance sheet 20
Total uses $867
Illustrative Pro Forma Valuation
Illustrative Cash Sources and Uses
(basic shares in millions)
Ownership Shares % Own.
AHPAC public equity 31.0 47.7%
AHPAC founders 3.9 6.0%
Envigo shareholder equity 30.1 46.4%
Total 65.0 100.0%
Ownership Sources Amount
AHPAC equity $310
Existing Envigo cash on balance sheet 54
Total sources $364
Uses Amount
Paydown of Envigo debt $193
Cash to Envigo shareholders 100
Cash to balance sheet 20
Accrued interest 6
AHPAC & Envigo estimated cash fees and expenses 44
Total uses $364
Note: Debt figures above presented at par. GAAP debt figures will be lower due to upfront discounts and costs.
1) Includes Envigo shareholder fees paid in equity.
(1)

38
48
55
115
180
4
229
118
98
166
166
166
111
111
111
143
178
199
Recent Avista-Affiliated Healthcare IPOs
7
Note: Certain examples presented herein are for informational purposes only. It should not be assumed that investments made in the future will be comparable in quality or performance to the examples
described herein.
Financial Structuring Business Summary
Public Market Expertise
AHPAC’s management has experience executing financial structuring solutions in both private
and public markets
Company
Leading global Contract Research Organization, or CRO, exclusively focused on
Phase I to Phase IV clinical development services for the biopharmaceutical and
medical device industries
Full-service CRO with global scale: over 6,200 employees, 50 countries, six
continents
Executed $150mm IPO (Nov. 2014), five follow-on offerings and
three stock buybacks
Completed three cash acquisitions while private, including the
approximately ~$232mm all-cash acquisition / take private of
Kendle International (2011) (NASDAQ: KNDL)
Re-priced term loan twice prior to the IPO, lowering the interest rate
by 275 bps and removing all financial maintenance covenants
Supplier of medical imaging products for nuclear and ultrasound cardiovascular
diagnostic imaging procedures
Spinout from Bristol-Myers Squibb
Executed $74mm IPO (Jun. 2015) and five follow-on offerings
Negotiated $50mm revolver and $365mm term loan post-IPO
Leading global distributor of equipment and consumable supplies to the laboratory
sector
Minority investment alongside Madison Dearborn Partners
Executed $617mm IPO (Oct. 2014) and five follow-on offerings
Completed eleven bolt-on acquisitions post-IPO
Leading specialty pharmaceutical company focused on developing, manufacturing
and marketing branded prescription pharmaceutical products, with a concentration
in women's healthcare and dermatology
Led leveraged buyout consortium in the go-private transaction
Executed $1.1bn IPO (Sep. 2006)
Acquired Proctor & Gamble’s global pharmaceutical business for
$3.1bn (100% debt financed)
Extensive experience managing companies in public markets
Completed strategic, accretive M&A deals including both tuck-in acquisitions and transformational mergers
Has used strong relationships to successfully raise committed debt financing during difficult economic environments
Global medical products and technologies company, with leading market positions
in wound therapeutics, ostomy care, continence and critical care, and infusion
devices used in the treatment of diabetes and other conditions
Carve-out from Bristol Myers Squibb, joint acquisition with Nordic Captial
Executed $1.8bn IPO (Oct. 2016) and two secondary offerings
Notable acquisitions include Unomedical, a leading European
manufacturer of single-use medical devices and infusion sets, and
$321mm acquisition of 180 Medical, a leader in the home delivery
of catheters and urologic medical supplies in the U.S.

38
48
55
115
180
4
229
118
98
166
166
166
111
111
111
143
178
199
57.1%
48.9%
34.6%
16.9%
8.3% 6.9% 6.6%
16.7%
7.9% 5.7%
1.1%
5.5%
16.4%
7.5% 8.1%
Jun. 2015 Nov. 2014
8
Avista-affiliated healthcare companies have out-performed relative benchmarks post-IPO
+ Consistent out-performance across companies and throughout cycles
+ Continued price appreciation through transformational M&A, bolt-on acquisitions and other financing transactions
S&P 500
Health
care
S&P 500 S&P 500 S&P 500
S&P 500
S&P 500
Health
care
S&P 500
Health
care
S&P 500
Health
care
IPO date Oct. 2014 Sep. 2006
Multiple on
Investment(1) 1.6x 2.4x(2)
Oct. 2016
1.3x
S&P 500
Health
care S&P 500
Compound annual stock price appreciation since IPO
Track Record of Driving Stock Price Appreciation
2.6x 3.0x
Note: Data as of August 18th, 2017.
1) Based on IPO price.
2) Based on 0.160 Actavis shares received in post-IPO merger with Actavis (NYSE: ACT), now Allergan (NYSE: AGN).

38
48
55
115
180
4
229
118
98
166
166
166
111
111
111
143
178
199
Investment Highlights
Distinct Competitive Position
Diverse Customer Base with High Retention and
Recurring Revenue
Full Service, Mission Critical, Non-Clinical Capabilities with
Global Reach
Experienced Management Team
Track Record of Implementing Operational Improvements,
Enhancing Service Quality and Improving Profitability
9
Leading Market Position in an Industry with Strong Fundamentals
Attractive Organic Growth Strategy
Scalable M&A Platform
Strong Revenue Visibility
38
48
55
115
180
4
229
118
98
166
166
166
111
111
111
143
178
199
Europe 59%
North America
39%
ROW 3%
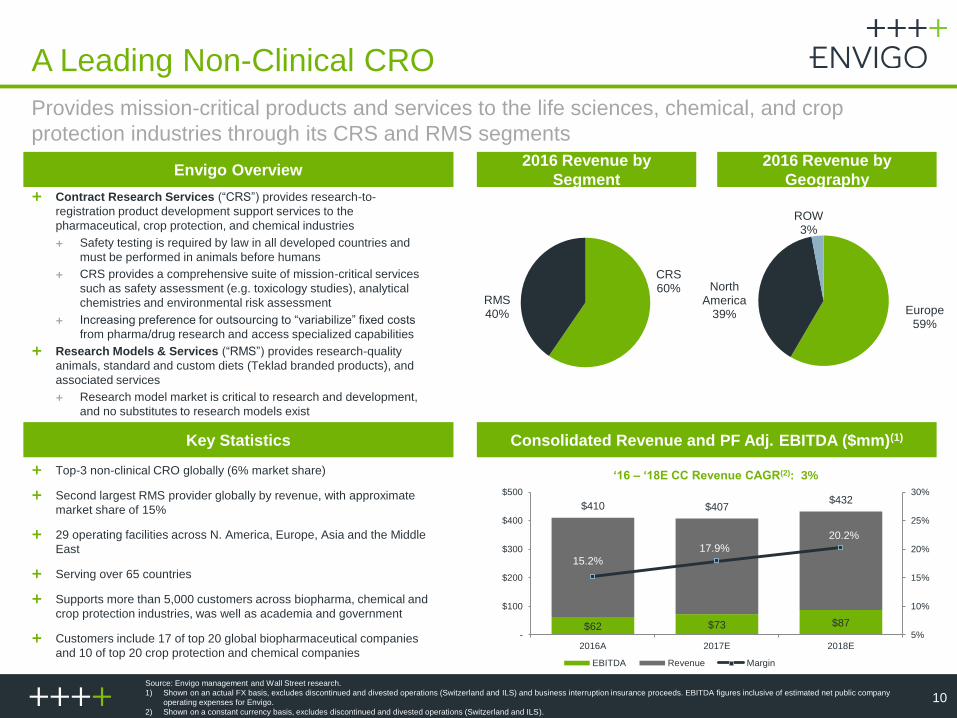
A Leading Non-Clinical CRO
Contract Research Services (“CRS”) provides research-to-
registration product development support services to the
pharmaceutical, crop protection, and chemical industries
Safety testing is required by law in all developed countries and
must be performed in animals before humans
CRS provides a comprehensive suite of mission-critical services
such as safety assessment (e.g. toxicology studies), analytical
chemistries and environmental risk assessment
Increasing preference for outsourcing to “variabilize” fixed costs
from pharma/drug research and access specialized capabilities
Research Models & Services (“RMS”) provides research-quality
animals, standard and custom diets (Teklad branded products), and
associated services
Research model market is critical to research and development,
and no substitutes to research models exist
Importance of research models’ genetics produces high customer
retention
10
Provides mission-critical products and services to the life sciences, chemical, and crop
protection industries through its CRS and RMS segments
Source: Envigo management and Wall Street research.
1) Shown on an actual FX basis, excludes discontinued and divested operations (Switzerland and ILS) and business interruption insurance proceeds. EBITDA figures inclusive of estimated net public company
operating expenses for Envigo.
2) Shown on a constant currency basis, excludes discontinued and divested operations (Switzerland and ILS).
2016 Revenue by
Geography
2016 Revenue by
SegmentEnvigo Overview
Key Statistics
Top-3 non-clinical CRO globally (6% market share)
Second largest RMS provider globally by revenue, with approximate
market share of 15%
29 operating facilities across N. America, Europe, Asia and the Middle
East
Serving over 65 countries
Supports more than 5,000 customers across biopharma, chemical and
crop protection industries, was well as academia and government
Customers include 17 of top 20 global biopharmaceutical companies
and 10 of top 20 crop protection and chemical companies
Consolidated Revenue and PF Adj. EBITDA ($mm)(1)
‘16 – ‘18E CC Revenue CAGR(2): 3%
CRS 60%
RMS 40%
$62 $73 $87
$410 $407 $432
15.2%
17.9%
20.2%
5%
10%
15%
20%
25%
30%
-
$100
$200
$300
$400
$500
2016A 2017E 2018E
EBITDA Revenue Margin

38
48
55
115
180
4
229
118
98
166
166
166
111
111
111
143
178
199
Envigo’s Position in the Biopharma R&D Process
11
Identification of
drug targets and
candidates,
synthesis,
characterization,
screening and
assays for
therapeutic
efficacy
In vivo and in
vitro studies
conducted to
assess both ontarget
and offtarget activity.
Toxicology studies
and pharmacology
studies evaluate
a drug for safety
prior to use in
humans
Including Phase
I, Phase II and
Phase III testing;
these trials
determine
statistically
significant safety
and efficacy in
comparison to
placebo or
standard of
care
Upon marketing
approval,
additional safety
and efficacy
data must be
periodically
reported to
regulators
Discovery Non-clinical Clinical Post Marketing
Wide array of products and services enable customers to reduce costs, increase speed and enhance productivity and
effectiveness in drug discovery and development
Through the acquisition of Harlan, Envigo expanded into the RMS business and broadened its support for the pharmaceutical,
crop protection and chemical industries, as well as universities, government, and other research organizations
Investigational new
drug application
New drug application and
biologic license application
Source: Envigo management.

38
48
55
115
180
4
229
118
98
166
166
166
111
111
111
143
178
199
Attractive CRO Sector Fundamentals
Source: Wall Street research, Evaluate Pharma and 3rd party research.
12
Increasing Cost and Complexity of Drug Development
Global CRO market expected to grow at 7-8% annually through
2020, with $33 billion of total outsourced development and
continuing CRO market penetration
Long-term sector growth supported by:
Growing drug development spend by biopharma as cost and
complexity of development rises
Sustained rise in outsourcing as small / mid-sized biopharma
lack in-house capabilities
Emergence of biotechnology companies have driven
expansion in the non-clinical CRO market
Pharmaceutical pricing pressures driving a greater focus on
cost and development time optimization
Global drug regulators and developers now require more
complex studies to better predict safety and efficacy of
compounds in development
CROs help clients shorten the drug development process, enabling
clients to reach commercialization faster, while maintaining a high
level of quality
$33
$35 $38
$41 $44
48% 50% 52%
55% 57%
30%
40%
50%
60%
70%
80%
$10
$15
$20
$25
$30
$35
$40
$45
'16A '17E '18P '19P '20P
Total Outsourced Development % of Total Development
Global CRO Market ($b)
$144 $147 $152 $155 $160 $164
$0
$50
$100
$150
$200
'16A '17E '18P '19P '20P '21P
Global Biopharmaceutical R&D Spend ($b)

38
48
55
115
180
4
229
118
98
166
166
166
111
111
111
143
178
199
Non-Clinical CRO Sector Dynamics
13
Evidence of sustained sector upturn:
Non-clinical CRO market projected to increase at a 9.7%
CAGR over next 4 years
Large biopharma continues to rationalize capacity and
increase level of outsourced non-clinical activity
Volume levels in the non-clinical CRO sector have increased
over the past two years driven by robust levels of biotech
funding and increased outsourcing from large biopharma
Other relevant trends:
Only three industry players with global scale: Envigo,
Labcorp / Covance and Charles River Labs
Large biopharma companies are consolidating their vendors
which is putting an emphasis on non-clinical CROs with
geographic reach and comprehensive service offerings
Non-clinical testing increasingly complex, so drug developers
need access to highly specialized capabilities
Large biopharma continues to look towards biotech (either
via partnership investing or M&A) to drive their innovation
engines
Public equity markets contribute only a small portion of
funding for non-clinical R&D (~9% of total external
sources)
Outsourced Non-Clinical CRO Market ($b)
$4.0 $4.4
$4.8 $5.3
$5.8
36% 38%
40% 42%
44%
20%
25%
30%
35%
40%
45%
50%
55%
60%
65%
70%
$0
$2
$4
$6
'16A '17E '18P '19P '20P
Outsourced Non-clinical Development % Outsourced to CROs
Compounds in Pipeline by Phase
Source: Wall Street research, Frost & Sullivan report and 3rd party research.
5,106
1,446
1,889
693
5,484
1,541
2,011
744
6,061
1,666
2,151
808
6,861
1,856
2,261
954
Preclinical Phase I Phase II Phase III
2013 2014 2015 2016

38
48
55
115
180
4
229
118
98
166
166
166
111
111
111
143
178
199
Envigo’s Business Evolution
14
1930 2009 2012 1950 2014 2015
2009: LSR is
taken private
and delisted
from the NYSE
1951: Predecessor of
Life Sciences
Research, Inc. (LSR)
is founded
2012: Current
borrower is
incorporated for
purpose of
senior secured
notes offering
2014: Parent
Holding
Company
acquires Harlan
Laboratories
Holdings Corp.
2015: The
company
rebrands under
the new name
“Envigo” 1980: Harlan
Industries
acquires GIBCO
(Sprague Dawley
and Teklad)
1931: Harlan
Industries is
founded
2005: Genstar
purchases
controlling
interest in
Harlan
2008: Harlan
Laboratories
unified under
one brand
60+ years of experience as a CRS provider and 150 years of combined industry experience
between predecessor companies
2017 2016
Source: Envigo management.

38
48
55
115
180
4
229
118
98
166
166
166
111
111
111
143
178
199
Global Footprint
15
Source: Envigo management.
1) Madison, WI facilities include both bioproducts processing building and isolators/diet building.
2) Indianapolis, IN facilities include isolators/distribution building, barrier/isolators building, admin building and separate barrier building.
Established presence throughout North America, Europe, Asia, and the Middle East with a
network of 29 operating facilities
3,300+ Employees servicing over 65 countries
1,000+ Technicians
100+ Analysts
200+ Study Directors
70+ PhDs
40+ Surgeons
25+ Pathologists
RMS (21 facilities)
CRS (8 facilities)
Corporate HQ
Diets
Sales
Shardlow, U.K.
• 110,976 square
feet
• ~300 staff Horst, The
Netherlands
• 47,500 square feet
• ~100 staff
Livermore, CA
• 22,134 square feet
• ~70 staff
Indianapolis, IN (2)
• 169,878 square
feet
• ~300 staff
Madison, WI (1)
• 82,000 square feet
• ~150 staff
Huntingdon, U.K.
• 469,000 square
feet
• ~1,000 staff
Princeton, NJ
• 152,567
square feet
• ~300 staff

38
48
55
115
180
4
229
118
98
166
166
166
111
111
111
143
178
199
$68 $74 $85
$247 $247 $271
27.4% 30.0%
31.5%
15%
25%
35%
45%
-
$80
$160
$240
$320
2016A 2017E 2018E
EBITDA Revenue Margin
2016 CRS
Services
Contract Research Services (CRS) Overview
Offerings
60+ years of experience from an industry founder
8 research facilities across North America, Europe, and Middle East with
>300 animal rooms in total
Cell and animal-based safety testing of new medicines, industrial chemicals,
and crop protection products
Regulatory and scientific consultancy to optimize development programs
and product registration strategies
Strong operational focus in safety assessment, analytical chemistries and
environmental sciences
Standalone safety testing services, integrated program packages, and full
range program management services
Strengths
Global presence with the full-service capabilities necessary to win preferred
provider contracts with large multinational customers
One of only three global companies that can perform end-to-end non-clinical
testing from early development to product registration, for biologics and
small molecules
Leader in a variety of higher value, specialty toxicology services (inhalation,
reproductive, etc.)
Multiple preferred partnership arrangements with large biopharma and
multinational crop protection and chemical companies
16
Diversified range of research-to-registration product development support services
2016 CRS Orders
by Customer Type
Estimated Market Share
CRS Revenue and PF Adj. EBITDA ($mm)(3)
Safety Assessment
58%
Analytical Chemistries
18%
Environmental
Sciences 19%
CMC 4%
Other 2%
Pharma 61%
Crop Protection
16%
Chemical 23%
Source: Envigo management and Wall Street research.
1) Gross orders shown on a constant currency basis.
2) Net orders shown on a constant currency basis.
3) Shown on an actual FX basis, excludes discontinued and divested operations (Switzerland and ILS) and business interruption insurance proceeds. EBITDA figures inclusive of estimated net public company operating expenses for Envigo.
4) Shown on a constant currency basis, excludes discontinued and divested operations (Switzerland and ILS).
‘16 – ‘18E CC Revenue CAGR(4): 6%
Charles River 22%
LabCorp / Covance
17%
Envigo 6% MPI
5%
Other 49%
(1) (2)

38
48
55
115
180
4
229
118
98
166
166
166
111
111
111
143
178
199
Source: Envigo management and Wall Street research.
1) Gross orders shown on a constant currency basis.
2) Includes freight and container revenue.
3) Shown on an actual FX basis.
4) Shown on a constant currency basis.
$24 $28 $32
$171 $167 $169
14.1% 16.7%
18.9%
0%
10%
20%
30%
40%
-
$80
$160
$240
2016A 2017E 2018E
EBITDA Revenue Margin
Academia 43%
Pharma 29%
CRO 13%
Govt 6%
Other 9%
Research Models & Services (RMS) Overview
Offerings
80+ years of experience from an industry founder
Research-quality animals, including standard and specialty small animal
strains
Industry-leading standard and custom Teklad diets for laboratory animals,
plus bedding and enrichment products
Value-added services, including custom animal breeding, surgical services,
colony housing, and genetic and health monitoring
Biologic products including tissue, serum and antibodies
21 operating facilities in North America, Europe, Middle East, and Asia
Strengths
High product stickiness – customers focus on avoiding variability in their
data
The only provider of fixed formula diets and PhD nutritionists for custom diet
preparation
Strong specialty oncology portfolio, including 2015 launch of world’s first
nude Severe Combined Immunodeficiency mouse and 2017 launch of
radiation-resistant immunodeficient mouse
17
Diversified range of products and services to R&D-based life science companies as well as
academic and government institutions
Estimated Market Share
RMS Revenue and PF Adj. EBITDA ($mm)(3)
2016 RMS Orders
by Customer Type
2016 RMS
Product Mix
Charles River Labs 50%
Envigo 15%
The Jackson Laboratory
13%
Taconic 11%
Janvier Labs 4%
Covance 4%
Other 3%
Small Animals
58%
Diets & Bedding
29%
Services
10%
Other Animals
3%
‘16 – ‘18E CC Revenue CAGR(4): (1%)
(1)
(2)
(1)

38
48
55
115
180
4
229
118
98
166
166
166
111
111
111
143
178
199
Leading Market Position with Strong Fundamentals
18
Non-Clinical Testing Segment
Increasing Demand From Large to Mid-
tier Biopharma Clients Growing Biologics Pipeline
Crop and Chemical Markets have
Different Drivers and Cycles
Source: Wall Street research.
+ Increasing penetration in non-clinical
outsourcing market
+ Rise in demand resulting from
increased study complexity
+ Requires increasing complexity of
testing
+ Tailored medicine means more targets
for discovery and safety work
+ Strict regulations drive chemical testing
demand
+ Innovative crop protection agents
needed to meet global food production
requirements
+ Third largest non-clinical CRO and largest in crop protection / chemical
+ Second largest provider of research models
+ One of only three global companies that can perform end-to-end non-clinical testing from early development to product registration, for
biologics and small molecules
+ Leader in a variety of higher-value, specialty toxicology services (inhalation, reproductive, etc.)
+ Sustainable momentum in a recession-resistant industry not driven by consumer spending
+ The only provider of fixed formula diets and PhD nutritionists for custom diet preparation
Envigo Strengths
Non-clinical CRO industry growth estimated to be 9-10% per annum over the next four years, with expected outsourced non-clinical
development spend to be $5.8bn by 2020

38
48
55
115
180
4
229
118
98
166
166
166
111
111
111
143
178
199
Market Growth Drivers For Envigo Are Strong
19
Biopharmaceutical
Robust growth in early stage product development
Increased outsourcing of safety studies as large biopharma looks to reduce fixed costs
Consolidation of large biopharma vendor lists favors the big three CROs
Growth in small company R&D translates directly into CRO growth as they have little or no
internal capability to do non-clinical research
Diverse and robust biotech funding environment for non-clinical research
Chemical & Crop Protection
Increasingly stringent regulatory scrutiny continues to drive regulations
that increase the amount of safety testing required
Crop protection demand driven by the ongoing need to increase the
efficiency of food production to feed growing global populations
Government & Academia
NIH initiatives to increase funds to research and
development, such as 21st Century Cures bill
EU and UK funding for research remains high
38
48
55
115
180
4
229
118
98
166
166
166
111
111
111
143
178
199
Diverse and Strong Customer Base with High
Retention and Recurring Revenue
20
Source: Envigo management.
1) * = Ranked outside of top 10.
2) Represents Order Intake in 2014 – 2016.
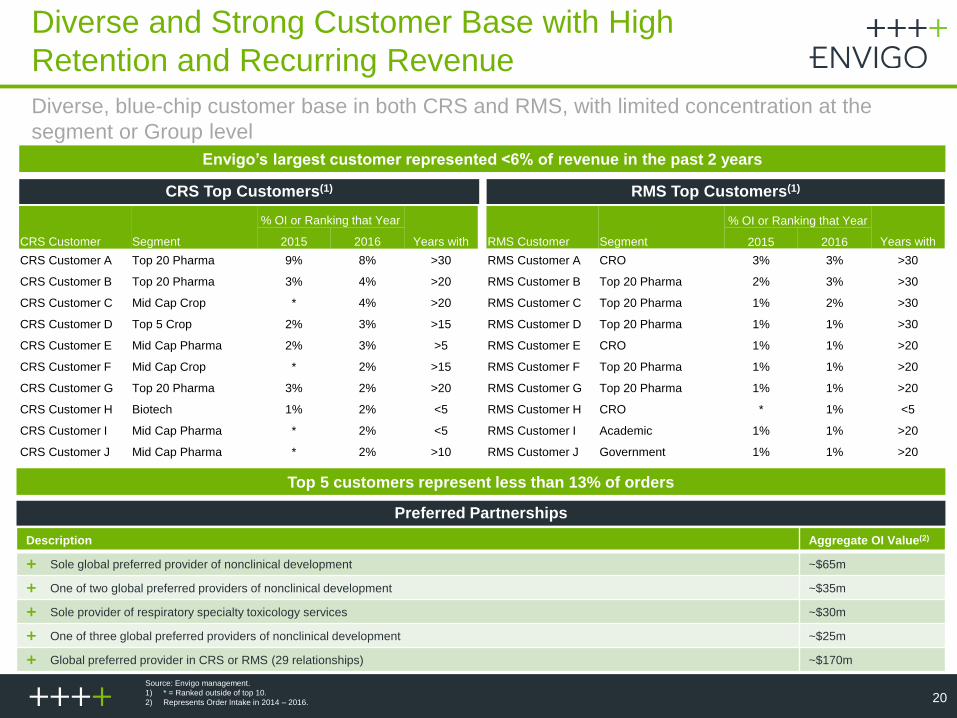
Diverse, blue-chip customer base in both CRS and RMS, with limited concentration at the
segment or Group level
RMS Top Customers(1) CRS Top Customers(1)
CRS Customer Segment
% OI or Ranking that Year
Years with 2015 2016
CRS Customer A Top 20 Pharma 9% 8% >30
CRS Customer B Top 20 Pharma 3% 4% >20
CRS Customer C Mid Cap Crop * 4% >20
CRS Customer D Top 5 Crop 2% 3% >15
CRS Customer E Mid Cap Pharma 2% 3% >5
CRS Customer F Mid Cap Crop * 2% >15
CRS Customer G Top 20 Pharma 3% 2% >20
CRS Customer H Biotech 1% 2% <5
CRS Customer I Mid Cap Pharma * 2% <5
CRS Customer J Mid Cap Pharma * 2% >10
RMS Customer Segment
% OI or Ranking that Year
Years with 2015 2016
RMS Customer A CRO 3% 3% >30
RMS Customer B Top 20 Pharma 2% 3% >30
RMS Customer C Top 20 Pharma 1% 2% >30
RMS Customer D Top 20 Pharma 1% 1% >30
RMS Customer E CRO 1% 1% >20
RMS Customer F Top 20 Pharma 1% 1% >20
RMS Customer G Top 20 Pharma 1% 1% >20
RMS Customer H CRO * 1% <5
RMS Customer I Academic 1% 1% >20
RMS Customer J Government 1% 1% >20
Envigo’s largest customer represented <6% of revenue in the past 2 years
Top 5 customers represent less than 13% of orders
Preferred Partnerships
Description Aggregate OI Value(2)
Sole global preferred provider of nonclinical development ~$65m
One of two global preferred providers of nonclinical development ~$35m
Sole provider of respiratory specialty toxicology services ~$30m
One of three global preferred providers of nonclinical development ~$25m
Global preferred provider in CRS or RMS (29 relationships) ~$170m

38
48
55
115
180
4
229
118
98
166
166
166
111
111
111
143
178
199
84%
16%
Existing Customers New Customers
88%
12%
Existing Customers New Customers
95%
5%
Placed Not Placed
97%
3%
Repeat Non Repeat
Diverse and Strong Customer Base with High
Retention and Recurring Revenue (Cont.)
21
54%
23%
23%
5%
31%
Gross orders 2016 Gross orders 2015
CRS Customer Stickiness
RMS Customer Stickiness
Proportion of customers that placed orders in last 2 of 3
years
Proportion of 2016 customers that placed orders in 2015 (in
value)
Source: Envigo management.
1) Excludes discontinued and divested operations (Switzerland and ILS).
(1)

38
48
55
115
180
4
229
118
98
166
166
166
111
111
111
143
178
199
267 256 274
2015 2016 LTM June 17
Strong Revenue Visibility
22
CRS Constant Currency Gross Orders ($mm)(1)
Envigo typically has forward 12 month revenue visibility of >60%
Historical Quarterly RMS Revenue ($mm)
CRS
Envigo has 7-8 months of future CRS revenue in current
backlog
Backlog typically translates to revenue within 9 months
Studies range in duration from weeks to months; very few
studies longer than 1 year duration
Studies in backlog are either on-going or generally
projected to start within next 6 months
Proposal/bid volume has been strong due to improved macro
non-clinical environment, strengthening biotech demand and
REACH chemical work
RMS
Research models and diets is a highly stable consumable
business
Very high customer retention as customers prefer to use a
consistent animal model in experiments to minimize variability
Despite some seasonality in Q4, revenue is quite consistent
over historical periods due to highly stable end markets and
customer stickiness
Source: Envigo filings and Envigo management and Wall Street Research.
1) Shown on a constant currency basis, excludes discontinued and divested operations (Switzerland and ILS).
46 46 44
40
45 45 43
39
44 42

38
48
55
115
180
4
229
118
98
166
166
166
111
111
111
143
178
199
Distinct Competitive Position
RMS
Strong reputation with regulators
Maintained a reputation for quality for 60+ years
Produces thousands of study reports used in regulatory
filings each year, garnering a level of trust among
regulators that is critical to clients
Massive background data assets
With approximately 1,000 animal studies per year, Envigo
has collected a comprehensive set of background data
that is needed for interpretation of biologic findings
Strong customer loyalty
80+ years of experience in RMS
16 of Envigo’s top 20 customers have been repeat
customers for 15+ years
Reduces experimental variability for customers by
supplying genetically consistent animal models time after
time, which deters customers from product switching and
ensures repeat business
Highly specialized infrastructure
Specialized biosecurity procedures and equipment which
protect animals against disease
Specialized assays, instruments, computer systems,
process monitoring and control systems
Established global footprint including owned facilities totaling ~1.8mm square feet; estimated replacement value >$200mm(1)
Unwavering adherence to strict standards set by regulatory (e.g. EPA, FDA, USDA) and accreditation (e.g. AAALAC) bodies
Equipment must be validated according to strict guidelines
Highly educated and experienced workforce including 70+ PhD scientists, 40+ surgeons and 25+ pathologists
All operations employees given in-depth training on animal welfare and regulatory compliance
CRS
Source: Envigo management.
1) Reflects owned properties only. 23

38
48
55
115
180
4
229
118
98
166
166
166
111
111
111
143
178
199
Patricia Henahan
CFO
Joined Envigo in mid-2016; previously 10 years as divisional CFO for AstraZeneca and Hospira
10 years as US Army officer
Lean Six Sigma Black Belt
BS in Biology from University of Notre Dame and MBA from Wharton
Dr. Adrian Hardy
CEO
15 years with Envigo and 2 years at Novartis
Appointed Envigo CEO in July 2016 after two years leading Harlan integration as COO, and 8 years as
global head of sales and marketing
PhD in Molecular and Developmental Biology from University College, London
Experienced Management Team
24
Mike Caulfield
President, North
America and RMS
Lizanne Muller
President, EMEA
and CRS
Craig Boyd
Chief Commercial
Officer
16 years with Envigo, most of which spent as General Manager of the Princeton CRS site
Responsible for all North America operations, CRS and RMS
Previously worked at Bristol Myers Squibb and Pharmaco in regulatory compliance and quality
assurance
BS in Biology from Rutgers University
Joined Envigo in mid-2017; previously 17 years with the Dishman Group with senior operational,
compliance, commercial and finance roles; significant acquisition experience
Responsible for all ROW operations, CRS and RMS
Rand Afrikaans University, South Africa
Joined Envigo in August 2017; previously 20 years in sales and marketing, including leadership roles
with Novartis, Mylan, Hospira and Mayne Pharma
Responsible for global sales and marketing for all Envigo products and services
BA from University of Wollongong and MBA from Deakin University, Australia
Source: Envigo management.

38
48
55
115
180
4
229
118
98
166
166
166
111
111
111
143
178
199
Attractive Organic Growth Strategy
25
Significant and multi-layered growth initiatives
Revenue Growth
Margin Expansion
Land and expand with new large biopharma accounts
Broaden relationships within biotech and consultant sector
Leverage introductions between CRS and RMS into cross-selling opportunities
for key customers
Build on scientific expertise in biologics and inhalation
Geographic expansion opportunities
Continue to implement identified operational cost savings initiatives
Consolidate certain back office functions currently located at the
divisional level
Roll out sales organization changes to increase revenue and utilize
operating leverage to drive margin expansion
Focus on RMS footprint and logistics to continue driving RMS
margin expansion
38
48
55
115
180
4
229
118
98
166
166
166
111
111
111
143
178
199
Operations Cost Savings
+ Process driven savings by reducing waste,
process improvement and service consolidation
+ Shared administrative resources
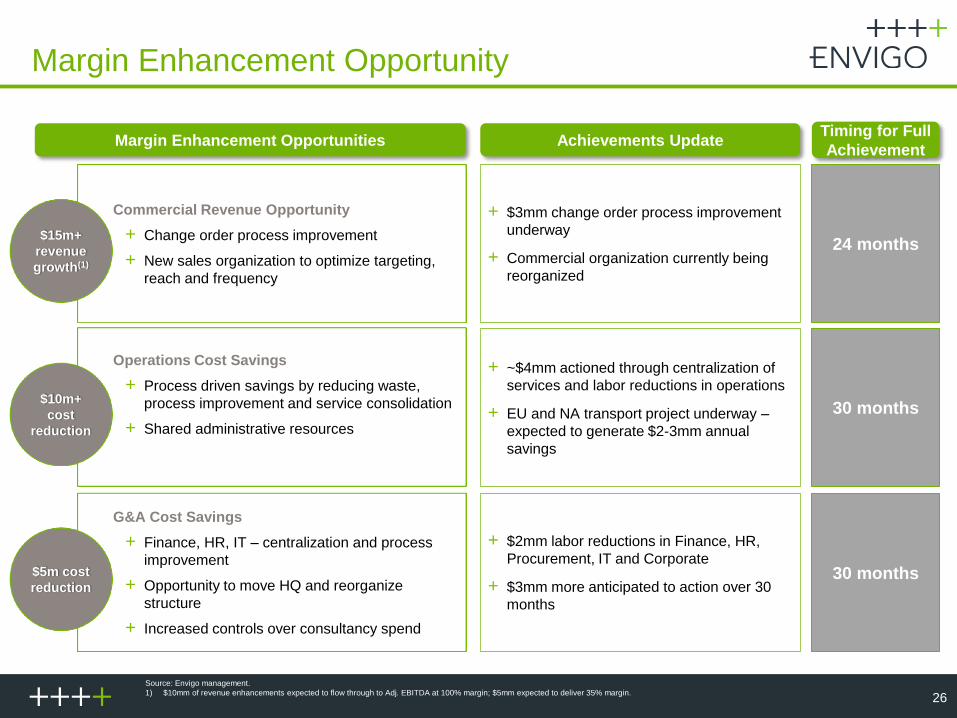
Margin Enhancement Opportunity
26
Source: Envigo management.
1) $10mm of revenue enhancements expected to flow through to Adj. EBITDA at 100% margin; $5mm expected to deliver 35% margin.
Margin Enhancement Opportunities Timing for Full
Achievement
$10m+
cost
reduction
Commercial Revenue Opportunity
+ Change order process improvement
+ New sales organization to optimize targeting,
reach and frequency
$15m+
revenue
growth(1)
G&A Cost Savings
+ Finance, HR, IT – centralization and process
improvement
+ Opportunity to move HQ and reorganize
structure
+ Increased controls over consultancy spend
$5m cost
reduction
24 months
30 months
30 months
Achievements Update
+ $2mm labor reductions in Finance, HR,
Procurement, IT and Corporate
+ $3mm more anticipated to action over 30
months
+ ~$4mm actioned through centralization of
services and labor reductions in operations
+ EU and NA transport project underway –
expected to generate $2-3mm annual
savings
+ $3mm change order process improvement
underway
+ Commercial organization currently being
reorganized
38
48
55
115
180
4
229
118
98
166
166
166
111
111
111
143
178
199
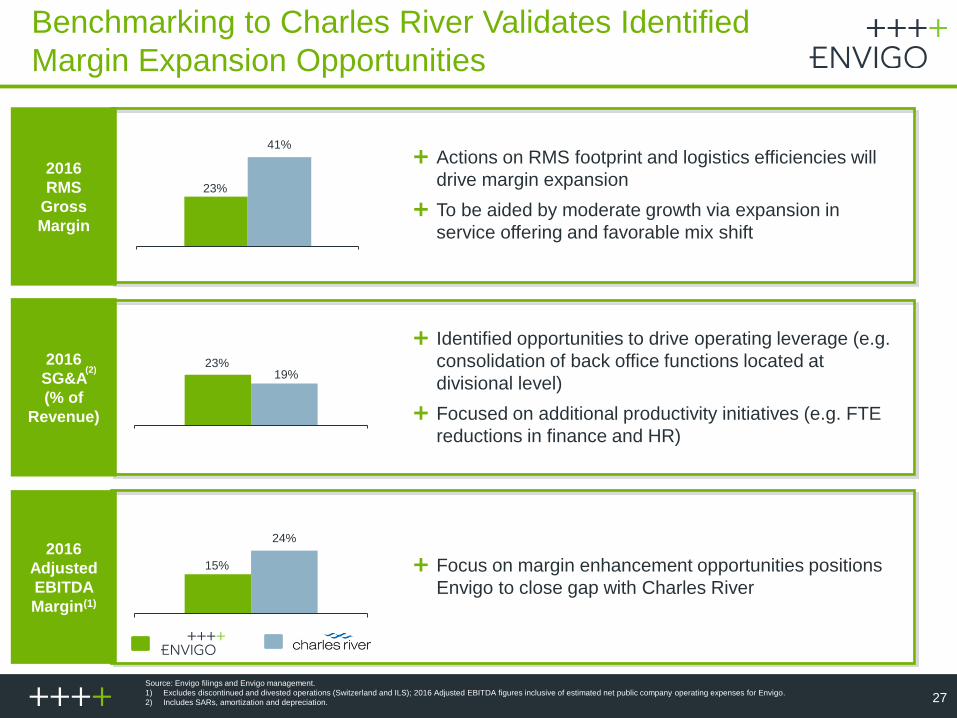
Benchmarking to Charles River Validates Identified
Margin Expansion Opportunities
27
Source: Envigo filings and Envigo management.
1) Excludes discontinued and divested operations (Switzerland and ILS); 2016 Adjusted EBITDA figures inclusive of estimated net public company operating expenses for Envigo.
2) Includes SARs, amortization and depreciation.
2016
RMS
Gross
Margin
2016
SG&A
(% of
Revenue)
15%
24%
23% 19%
23%
41%
Identified opportunities to drive operating leverage (e.g.
consolidation of back office functions located at
divisional level)
Focused on additional productivity initiatives (e.g. FTE
reductions in finance and HR)
Actions on RMS footprint and logistics efficiencies will
drive margin expansion
To be aided by moderate growth via expansion in
service offering and favorable mix shift
2016
Adjusted
EBITDA
Margin(1)
Focus on margin enhancement opportunities positions
Envigo to close gap with Charles River
(2)

38
48
55
115
180
4
229
118
98
166
166
166
111
111
111
143
178
199
Scalable M&A Platform
28
Potential Targets Key Points
Envigo Acquisition Criteria
Scale players are driving consolidation
Significant opportunity to accelerate growth through
acquisitions
Potential to unlock scale and scope efficiencies
Ability to expand geographic reach and offerings
Clear vision and line of sight into potential near-term
acquisition candidates
Achievability of cost and market synergies
Increased geographic reach and penetration
Enhanced product offering, technical expertise and value-
added services
Cash flow accretive in the short-term
Mid-Sized non-clinical CROs
Specialized RMS providers
Bioanalytical service providers
Demonstrated ability to execute acquisition growth strategy to accelerate EBITDA growth

38
48
55
115
180
4
229
118
98
166
166
166
111
111
111
143
178
199
89 86
176 171 167 169
130 116
254 247 247 271
Historical and Projected Revenue
29
Consolidated Revenue(1) ($mm) CRS Revenue(1) ($mm)
RMS Revenue(1) ($mm)
Source: Envigo filings and Envigo management.
1) Shown on an actual FX basis, excludes discontinued and divested operations (Switzerland and ILS); segment numbers are before intercompany eliminations.
2) Shown on a constant currency basis, excludes discontinued and divested operations (Switzerland and ILS).
‘CC growth rate(2)
215 200
424 410 407
432
2% 2% 5%
‘CC growth rate(2)
‘CC growth rate(2)
(1%) 5% 4% 8% (2%)
(1%) (2%) 0% (1%)

38
48
55
115
180
4
229
118
98
166
166
166
111
111
111
143
178
199 33
36
57
62
73
87
36 35
66 68 74
85
14 16
22 24
28 32
Historical and Projected Pro Forma Adjusted EBITDA
30
Source: Envigo filings and Envigo management.
Note: CRS and RMS Pro Forma Adjusted EBITDA before corporate control cost. See Appendix for reconciliation of non-GAAP measures to the most directly comparable GAAP measure.
1) Shown on an actual FX basis, excludes discontinued and divested operations (Switzerland and ILS); 2015-2018 Pro Forma Adjusted EBITDA figures inclusive of estimated net public company operating expenses for Envigo; segment
numbers are before intercompany eliminations.
2) Shown on a constant currency basis, excludes discontinued and divested operations (Switzerland and ILS) and business interruption insurance proceeds.
Consolidated PF Adjusted EBITDA(1) ($mm) CRS PF Adjusted EBITDA(1) ($mm)
RMS PF Adjusted EBITDA(1) ($mm)
14% 15%
PF Adjusted EBITDA Margin PF Adjusted EBITDA Margin
PF Adjusted EBITDA Margin
18%
‘16 – ‘18E CC
CAGR(2): 20%
‘16 – ‘18E
CAGR: 12%
‘16 – ‘18E
CAGR: 15%
12% 14% 17% 19%
20% 26% 27% 30% 32% 30% 27% 18% 15%
19% 16%
Increased by 20%
on a constant
currency basis
year-over-year in
the first half of 2017

38
48
55
115
180
4
229
118
98
166
166
166
111
111
111
143
178
199
$60
$84
12.1%
1.0%
Q2 2016 Q2 2017
Net Orders Cancellations as % of Gross Orders
$17 $16
$103 $100
16.3% 16.2%
Q2 2016 Q2 2017
EBITDA Revenue Margin
Q2 2017 Financial Performance Update
31
CRS business experiencing strong momentum in gross orders,
generating $85 million during the second quarter (+24% versus
the prior year period and +30% versus the prior quarter)
Broad-based, diverse order intake across customer type
and therapeutic areas
1H 2017 net orders up 34% versus 2H 2016 and 17% versus
1H 2016
Cancellations continued to decline during the second
quarter of 2017, at ~1% of gross orders versus ~12% of
gross orders during 2Q 2016
Strong order flow best indicator of future revenue growth,
providing visibility into forecasted revenues and
demonstrating robust demand for Envigo’s services
Robust pipeline for 2H’17 RFP opportunities provides for
continued growth in net orders
Second quarter revenue decline attributable to lower than
expected orders in Q4’16 as well as higher than average
cancellations during Q2’16 and Q3’16, which have now
returned to normalized levels
40%
(3%)
CC CRS Net Orders ($mm)
CC Consolidated Revenue and PF Adj. EBITDA ($mm)
Source: Envigo filings and Envigo management.
Note: Excludes discontinued and divested operations (Switzerland and ILS) and business interruption insurance proceeds. PF Adjusted EBITDA figures inclusive of estimated net public company operating
expenses for Envigo.
$68
$85
Q2 2016 Q2 2017
24%
CC CRS Gross Orders ($mm)

38
48
55
115
180
4
229
118
98
166
166
166
111
111
111
143
178
199
216 227
239 254 258 252
242 230 227
251 19
20 19
13 10 14 23 27 31
23 234
246 258
267 268 266 265 256 257
274
$0
$50
$100
$150
$200
$250
$300
Q1 2015A Q2 2015A Q3 2015A Q4 2015A Q1 2016A Q2 2016A Q3 2016A Q4 2016A Q1 2017A Q2 2017A
Net Orders Gross Orders
Historical CRS Business Trends
32
Source: Envigo management.
1) Presented on a rolling LTM basis
2) Shown on a constant currency basis, excludes discontinued and divested operations (Switzerland and ILS), as well as Israel
CRS LTM Gross and Net Orders(1,2) ($mm)
Gross orders have been steady over the last two years, despite the closure of one of the company’s largest sites
Cancellation rates increased in mid-2016 after a period of being below historical norms, but have returned to normal levels and LTM
cancellations expected to continue declining
Robust pipeline of new proposals / bids going into 2H 2017

38
48
55
115
180
4
229
118
98
166
166
166
111
111
111
143
178
199
CRS Cancellations Summary
33
Note: Shown on a constant GBP-USD rate of 1.30.
Cancellations ($mm)
(5.2) (4.3)
(2.4) (1.4) (1.5)
(8.2)
(12.1)
(5.1) (5.3)
(0.9)
(14.0)
(12.0)
(10.0)
(8.0)
(6.0)
(4.0)
(2.0)
0.0
Q1 15 Q2 15 Q3 15 Q4 15 Q1 16 Q2 16 Q3 16 Q4 16 Q1 17 Q2 17
High cancellation rates and study delays in Q2/Q3 2016 significantly impacted CRS
revenues and EBITDA
Cancellations over the last three quarters have returned to normalized levels

38
48
55
115
180
4
229
118
98
166
166
166
111
111
111
143
178
199
Long Term Financial Goals
34
Note: These targets are forward-looking, are subject to significant business, economic and competitive uncertainties and contingencies, many of which are beyond the control of Envigo and its management,
and are based upon assumptions with respect to future decisions, which are subject to change. Actual results may vary and these variations may be material. Nothing in this presentation should be regarded
as a representation by any person that these goals will be achieved and Envigo undertakes no duty to update its goals.
Organic net revenue growth: mid-single digits
Organic adjusted EBITDA growth: low double digit
Adjusted EBITDA margins: low to mid 20% area
with potential upside from synergistic M&A

38
48
55
115
180
4
229
118
98
166
166
166
111
111
111
143
178
199
18%
9% 9% 12%
9%
22%
11% 11%
Peer Financial Benchmarking
35
Source: Envigo filings and Envigo management and Wall Street Research.
Note: Envigo growth rate shown on a constant currency basis. Charles River growth rate shown on a constant currency basis.
1) Parexel, ICON, and Medpace adjusted to consensus estimates for SBC on EBITDA. Estimates for INC Research exclude the impact of inVentiv Health merger.
Revenue
Growth
(’18E) 5% 7% 6% 5%
7%
18%
11% 9%
Adj.
EBITDA
Growth
(’18E)
Adj.
EBITDA
Margin
(’17E)
18%
24% 25%
19%
25%
18%
24%
30%
Early stage
CROs Late stage CROs
(1)
38
48
55
115
180
4
229
118
98
166
166
166
111
111
111
143
178
199
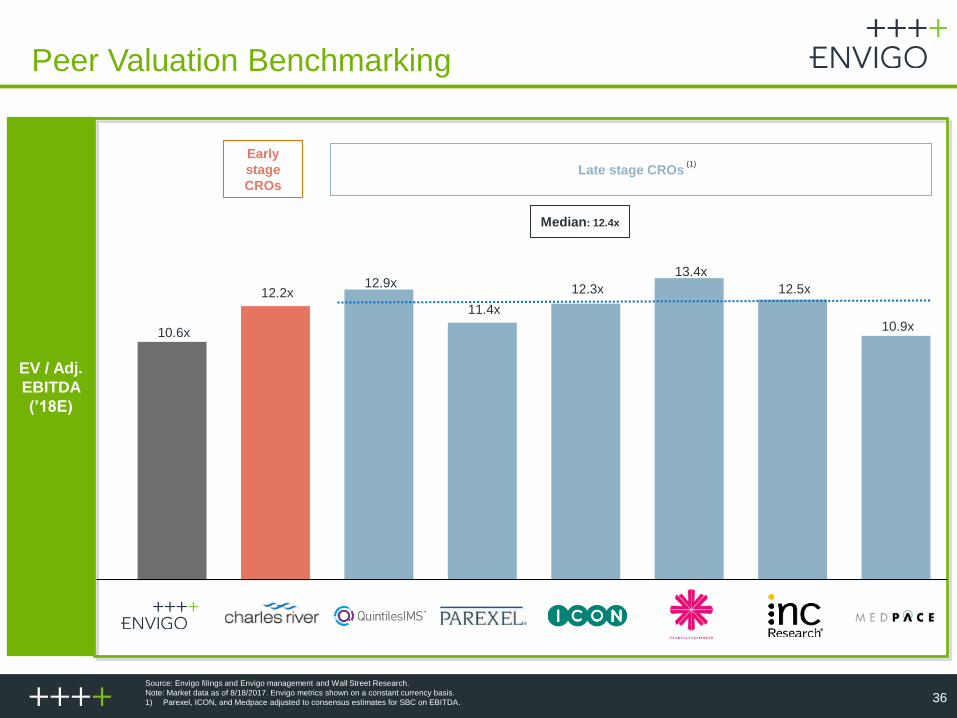
10.6x
12.2x 12.9x
11.4x
12.3x
13.4x
12.5x
10.9x
14.2x15.1x
14.2x 14.5x13.4x
16.2x15.3x
11.7x
Peer Valuation Benchmarking
36
Source: Envigo filings and Envigo management and Wall Street Research.
Note: Market data as of 8/18/2017. Envigo metrics shown on a constant currency basis.
1) Parexel, ICON, and Medpace adjusted to consensus estimates for SBC on EBITDA.
EV / Adj.
EBITDA
(’18E)
Adj. EV /
EBITDA
- Capex
(’18E)
Early
stage
CROs
Late stage CROs (1)
Median: 12.4x
SBC and acq-related amortization on EPS.

38
48
55
115
180
4
229
118
98
166
166
166
111
111
111
143
178
199
Investment Highlights
Diverse Customer Base with High Retention and
Recurring Revenue
Full Service, Mission Critical, Non-Clinical Capabilities with
Global Reach
Experienced Management Team
Track Record of Implementing Operational Improvements,
Enhancing Service Quality and Improving Profitability
37
Leading Market Position in an Industry with Strong Fundamentals
Attractive Organic Growth Strategy
Scalable M&A Platform
Strong Revenue Visibility
Distinct Competitive Position

Appendix
38

38
48
55
115
180
4
229
118
98
166
166
166
111
111
111
143
178
199
Chemical & Crop Protection Sector Dynamics
39
Chemical Industry Regulations and New Products Drive
Post-REACH Business
World regulators are increasingly looking to ensure the safety
of chemicals for both humans and the environment, and
increasing regulations drive increased volumes for CROs
Largest current example is the European REACH
legislation, which is expected to drive demand for testing
into the 2020’s
Other countries are expected to follow suit, creating future
growth
Approximately 75% of chemical spend is estimated to be
outsourced to CROs due to the complexity of regulatory
requirements
Global Crop Protection Industry Growth Expected to
2022
Demand for CRO services driven both by development of new
active ingredients and regulations demanding re-testing of
older products on the market
New actives ingredient programs driven by increasing demand
for higher crop yields and better pest control
Newly registered compounds in Europe require re-testing
every 10 years to ensure compliance to modern safety
standards
May extend to older registered products (similar to
REACH) at some point in the future
Total Chemical Testing Spend ($b)
Outsourced Crop Protection Testing Spend ($b)
$0.0
$0.2
$0.4
$0.6
$0.8
$1.0
2015 Total Crop Protection Testing Spend 2015 Outsourced Crop Protection TestingSpend
~$0.9B
~$0.4B
$0.7 $0.7
$0.3 $0.3 $0.1 $0.1
$0.0 $0.1
$0.1 $0.1
$0.1 $0.1
$0.2 $0.2
$0.3 $0.3
$0.3 $0.3
~$1.0B ~$1.1B
~$0.7B ~$0.6B
~$0.5B ~$0.6B
$0.0
$0.2
$0.4
$0.6
$0.8
$1.0
$1.2
2016A 2017E 2018P 2019P 2020P 2021P
Catch-up REACH testing Non catch-up REACH testing Other chemical testing
Source: Wall Street research and L.E.K. analysis.
REACH
deadline
38
48
55
115
180
4
229
118
98
166
166
166
111
111
111
143
178
199
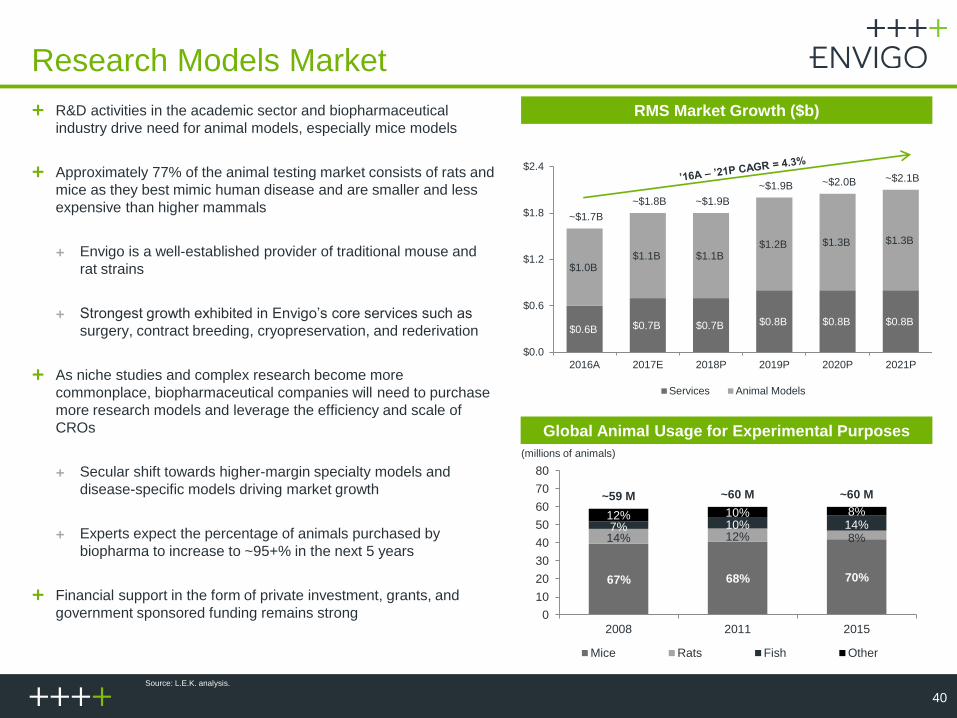
Research Models Market
40
RMS Market Growth ($b) R&D activities in the academic sector and biopharmaceutical
industry drive need for animal models, especially mice models
Approximately 77% of the animal testing market consists of rats and
mice as they best mimic human disease and are smaller and less
expensive than higher mammals
Envigo is a well-established provider of traditional mouse and
rat strains
Strongest growth exhibited in Envigo’s core services such as
surgery, contract breeding, cryopreservation, and rederivation
As niche studies and complex research become more
commonplace, biopharmaceutical companies will need to purchase
more research models and leverage the efficiency and scale of
CROs
Secular shift towards higher-margin specialty models and
disease-specific models driving market growth
Experts expect the percentage of animals purchased by
biopharma to increase to ~95+% in the next 5 years
Financial support in the form of private investment, grants, and
government sponsored funding remains strong
Global Animal Usage for Experimental Purposes
$0.6B $0.7B $0.7B $0.8B $0.8B $0.8B
$1.0B $1.1B $1.1B
$1.2B $1.3B $1.3B
~$1.7B
~$1.8B ~$1.9B
~$1.9B ~$2.0B ~$2.1B
$0.0
$0.6
$1.2
$1.8
$2.4
2016A 2017E 2018P 2019P 2020P 2021P
Services Animal Models
67% 68% 70%
14% 12% 8% 7% 10% 14%
12% 10% 8%
~59 M ~60 M ~60 M
0
10
20
30
40
50
60
70
80
2008 2011 2015
Mice Rats Fish Other
Source: L.E.K. analysis.
(millions of animals)

38
48
55
115
180
4
229
118
98
166
166
166
111
111
111
143
178
199
Capital Expenditures
41
Invested $1.0mm to upgrade Barcelona CRS facility (HVAC, cage washers, other improvements) and achieve AAALAC
accreditation
Invested $1.7mm in next generation digital telemetry equipment at Huntingdon, Princeton and Barcelona CRS facilities to provide
continuous monitoring of key cardiovascular safety measures, supporting client and regulatory demand for better insight into
potential test agent cardiac toxicity
Invested $2.0mm to implement HR and finance systems needed to support increased scale of business and enable back office
efficiency as business grows
Invested $3.9mm to renovate Horst barriers following barrier break; scope includes replacement autoclaves and caging, among
other facility improvements
Recent Capital Investments
($mm) 2015A 2016A 2017E 2018E
Maintenance and Regulatory $10.0 $15.2 $10.0 $12.0
Profit Growth 6.1 4.3 5.0 10.0
Capex $16.1 $19.5 $15.0 $22.0
% of Revenue 3.7% 4.7% 3.7% 5.1%
Adj. EBITDA - Capex $41.7 $48.3 $57.9 $65.3
% Conversion 72.1% 71.2% 79.4% 74.8%
Source: Envigo filings and Envigo management.

38
48
55
115
180
4
229
118
98
166
166
166
111
111
111
143
178
199
Non-GAAP Financial Reconciliation
42
Source: Shown on an as-reported FX basis.
($mm) 2015A Q1 16 Q2 16 Q3 16 Q4 16 2016A Q1 17 Q2 17 2017E 2018E
Revenue $439.1 $108.3 $109.8 $103.0 $94.3 $415.4 $100.6 $99.1 $407.1 $431.6
Discontinued Swiss operations (8.5) (0.1) 0.0 – – (0.0)
Divested ILS operations (7.1) (1.4) (1.7) (1.6) (0.3) (5.1) – – – –
Adjusted revenue $423.5 $106.8 $108.1 $101.4 $94.0 $410.2 $100.6 $99.1 $407.1 $431.6
Net Income ($62.3) ($8.5) ($0.2) ($22.5) ($16.6) ($47.7) $1.8 $1.4
Plus: Tax Expense / (Benefit) (2.2) 2.0 (1.1) 0.6 1.0 2.5 3.6 0.0
Plus: Net Interest Expense 43.7 11.8 12.0 12.2 14.7 50.6 11.4 11.7
Foreign Exchange Gain/(Loss) 11.6 0.7 7.4 3.3 9.1 20.5 (1.7) (6.7)
Other Income/(Expense) – – (1.3) 5.5 (0.7) 3.5 0.1 0.1
EBIT ($9.1) $5.9 $16.8 ($0.9) $7.5 $29.4 $15.0 $6.5
Depreciation & Amortization 29.2 6.2 5.8 5.6 5.5 23.1 5.2 5.6
Adjustments 25.6 0.8 (0.7) 8.4 3.6 12.0 (1.2) 3.6
Adjusted EBITDA $45.7 $12.9 $21.9 $13.1 $16.6 $64.5 $19.1 $15.8 $71.4 $85.8
Discontinued Swiss operations 10.6 1.2 1.0 – (1.1) 1.1
Divested ILS operations (0.3) 0.5 0.2 0.0 (0.1) 0.6 – – – –
Estimated net public company operating
expenses1.5 0.4 0.4 0.4 0.4 1.5 0.4 0.4 1.5 1.5
Business interruption proceeds – – (5.3) – – (5.3) – – – –
Pro-forma Adjusted EBITDA $57.5 $15.0 $18.2 $13.5 $15.8 $62.5 $19.5 $16.2 $72.9 $87.3

38
48
55
115
180
4
229
118
98
166
166
166
111
111
111
143
178
199
Revenue Bridge from 2016 to 2018
43
$415 ($6)
($5)
$404
$6 ($9) $10
$1 $412 ($5)
$407
$5 $412
$5 ($5)
$21 ($2) $432
2016A Fx ILS/Swiss 2016 CCAdjustedRevenue
RMSPrice
RMSVolume
CRS IntercoMvmt
2017P CCRevenue
H1'17 Fx 2017PAFx
Revenue
H1'17 Fx 2017P CCRevenue
RMSPrice
RMSVolume
CRS IntercoMvmt
2018PRevenue
Note: Shown on a constant GBP-USD rate of 1.30.
1) Based on forecasted CRS gross orders.
2018 Performance in Pharma and Crop
Protection Will More than Offset the Impact
of REACH in the Chemical Sector (1)
Pharma: ~11% growth
Chemical: ~(11%) growth
Crop Protection: ~13% growth

38
48
55
115
180
4
229
118
98
166
166
166
111
111
111
143
178
199
Pro Forma Adjusted EBITDA Bridge
44
$73
$14 ($2)
$65 ($2)
($5)
$2 $2
$60
$6 ($8) $8
$8 $74 ($1) $1 $74
$5 ($4)
$87
Note: Shown on a constant GBP-USD rate of 1.30.

38
48
55
115
180
4
229
118
98
166
166
166
111
111
111
143
178
199
CRS Revenue Predictability(1)
45
($mm)
163 160 152 153
174
124 130
122
107
144
121 121 119 120 130
H2 15 H1 16 H2 16 H1 17 H2 17E
Beginning backlog Net orders in previous half-year Revenue
Conversion rate
Revenue/ Net orders 97% 94% 97% 112% 91%
Revenue / Beg. Backlog 74% 76% 78% 78% 75%
At median, six-month forward conversion rate to revenue
historically has been 97% of net orders and 76% of beginning
backlog; lower projected relative metrics in second half of 2017
reflect management’s conservatism in its forecast
Source: Envigo Management.
1) Shown on a constant currency basis.