Investor Presentation Sept10 - Amazon S3€¦ · • Airtel current monthly net adds at 3.0 million...
25
Investor Presentation Bharti Airtel Limited
Transcript of Investor Presentation Sept10 - Amazon S3€¦ · • Airtel current monthly net adds at 3.0 million...

Investor Presentation
Bharti Airtel Limited

Disclaimer
The information contained in this presentation is only current as of its date. All actions and statements made herein or otherwise shall be subject to the
applicable laws and regulations as amended from time to time. There is no representation that all information relating to the context has been taken
care off in the presentation and neither we undertake any obligation as to the regular updating of the information as a result of new information, future
events or otherwise. We will accept no liability whatsoever for any loss arising directly or indirectly from the use of, reliance of any information
contained in this presentation or for any omission of the information. The information shall not be distributed or used by any person or entity in any
jurisdiction or countries were such distribution or use would be contrary to the applicable laws or Regulations. It is advised that prior to acting upon this
presentation independent consultation / advise may be obtained and necessary due diligence, investigation etc may be done at your end. You may
also contact us directly for any questions or clarifications at our end.
This presentation contain certain statements of future expectations and other forward-looking statements, including those relating to our general
business plans and strategy, our future financial condition and growth prospects, and future developments in our industry and our competitive and
regulatory environment. In addition to statements which are forward looking by reason of context, the words ‘may, will, should, expects, plans, intends,
anticipates, believes, estimates, predicts, potential or continue’ and similar expressions identify forward looking statements.
Actual results, performances or events may differ materially from these forward-looking statements including the plans, objectives, expectations,
estimates and intentions expressed in forward looking statements due to a number of factors, including without limitation future changes or
developments in our business, our competitive environment, telecommunications technology and application, and political, economic, legal and social
conditions in India. It is cautioned that the foregoing list is not exhaustive
This presentation is not being used in connection with any invitation of an offer or an offer of securities and should not be used as a basis for any
investment decision.
Investor Relations :- http://www.bhartiairtel.inFor any queries, write to: [email protected]
“The information contained herein does not constitute an offer of securities for sale in the United States. Securities may not be sold in the United States absent registration or an exemption from registration under the U.S. Securities Act of 1933, as amended. Any public offering of securities to be made in the United States will be made by means of a prospectus and will contain detailed information about the Company and its management, as well as financial statements. No money, securities or other consideration is being solicited, and, if sent in response to the information contained herein, will not be accepted.”
3
Mobile Services Telemedia Services Enterprise Services DTH
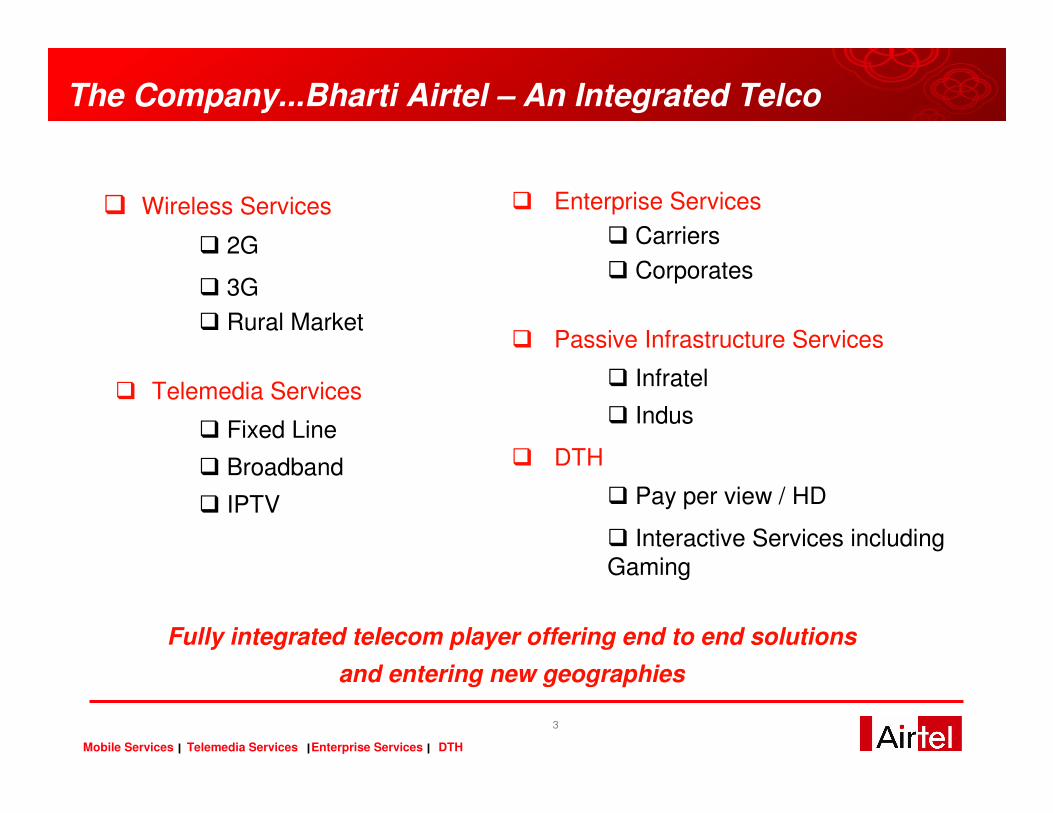
The Company...Bharti Airtel – An Integrated Telco
� Wireless Services
� 2G
� 3G
� Rural Market
� Telemedia Services
� Fixed Line
� Broadband
� IPTV
� Enterprise Services
� Carriers
� Corporates
� Passive Infrastructure Services
� Infratel
� Indus
� DTH
� Pay per view / HD
� Interactive Services including Gaming
Fully integrated telecom player offering end to end solutions
and entering new geographies
4
Mobile Services Telemedia Services Enterprise Services DTH
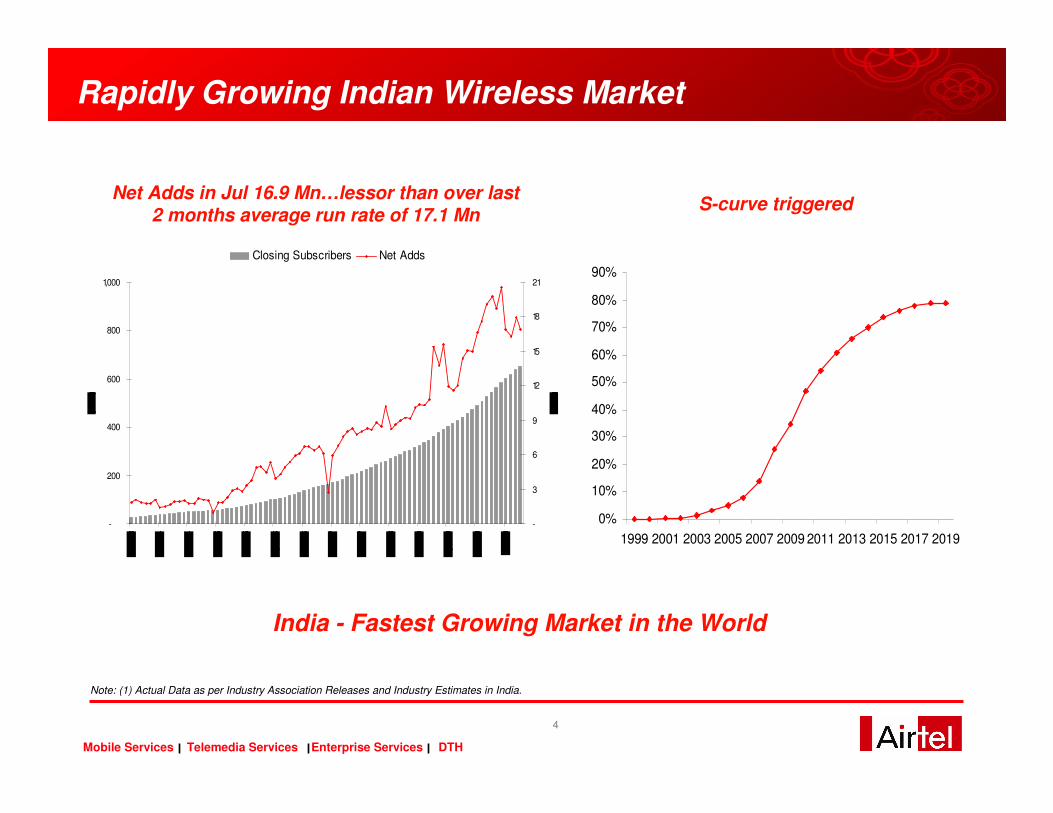
Net Adds in Jul 16.9 Mn…lessor than over last 2 months average run rate of 17.1 Mn
S-curve triggered
Rapidly Growing Indian Wireless Market
Note: (1) Actual Data as per Industry Association Releases and Industry Estimates in India.
India - Fastest Growing Market in the World
0%
10%
20%
30%
40%
50%
60%
70%
80%
90%
1999 2001 2003 2005 2007 2009 2011 2013 2015 2017 2019-
200
400
600
800
1,000
-
3
6
9
12
15
18
21
Closing Subscribers Net Adds

5
Mobile Services Telemedia Services Enterprise Services DTH
Wireless Market Structure in India
• Airtel continuously consolidating its market leadership position despite intense competition
• Airtel current monthly net adds at 3.0 million vs. 2.8 million a year ago
• Airtel ranks 1& 2 in 17 circles in terms of number of subscribers
• Over 59% of net adds coming from B&C circles (rural India)
Airtel Continues to lead on Revenue Market Share
Subscriber Trends Customer Market Share – CMS (%)
Note: Based on subscriber data for India as on July 31th 2010 as per TRAI press release.
139.2
113.3 111.5
79.0
70.774.9
63.8
34.031.3 32.8
18.4
26.6
35.532.1
-
20
40
60
80
100
120
140
160
Airte
l
Relia
nce
Vodafo
ne
BS
NL+M
TN
L
Idea
Tata
Oth
ers
Jul-10 Jul-09 Net adds during the year
21.3%
17.4%
12.1%11.5%
9.8%10.8%
17.1%
23.8%
18.6%17.8%
13.7%
10.0%8.9%
7.2%
5.0%
7.0%
9.0%
11.0%
13.0%
15.0%
17.0%
19.0%
21.0%
23.0%
25.0%
Airte
l
Relia
nce
Vodafo
ne
BS
NL+M
TN
L
Idea
Tata
Oth
ers
CMS(Jul'10) CMS(Jul'09)

6
Mobile Services Telemedia Services Enterprise Services DTH
� Customer Base : 36.36 Mn
� Performace Indicators:
Revenue: 9,583 Mn
EBITDA: 2,635 Mn
� Prepaid Base: 99.3%
→one of the highest in the world
� Usage per sub per month: 103 Minutes
→one of the lowest
� ARPU: ~ US$ 7.4
� Rate per minute: ~ US¢ 7.2
→ one of the highest
� VAS: ~ 7.9%
→One of the lowest
Another Growth Engine - Africa

7
Mobile Services Telemedia Services Enterprise Services DTH
Emerging Market Characteristics…
Telecom Penetration
Population (mm)
GDP Size, (PPP adjusted)
GDP Growth (Real) %
Broadband Penetration
India* Africa**
8.6%
1200 mm
US$ 3,530 bn
58.17% (688.38 mn telecom subs)
0.83% (9.77 mn)
465mm
3.1%
US$ 6,90 bn
NA
*Telecom and Broadband penetration for India as on July 31th 2010 as per TRAI press release.
** Data pertaining to the 15 African countries where Zain Africa has operations (Source: IMF, Global Insight , Economist Intelligence Unit,CIA World Factbook, World Resource Institute.)
32%

8
Mobile Services Telemedia Services Enterprise Services DTH
Bharti – a growth journey
‘DELHI
1996 2001 2003 2004 2010
No. of circles Today
1 5 15 22 19 countries

9
Mobile Services Telemedia Services Enterprise Services DTH
Latest Results – FY10/1Q’11
Key operating and financial metrics
21.3%29.0%ROE
18.4%24.4%ROCE
13.7%21.5%Net Profit Margin
36.9%40.3%EBITDA Margin
$ 361 mn$ 1,989 mn Net Income
$ 857 mn$ 3,710 mn Cash Profit
$ 947 mn$ 3,714 mnEBITDA
$ 2,625 mn$ 9,271 mnRevenue
183.4 mn137.0 mnCustomers
Q1FY11*FY 10
Continued Strong Performance
� Wireless Customer market share leadership in India at 21.5%.
� Total minutes on network carried in Q1 – 206.2 bn [Over 800 bn minutes per annum]
� Total employee strength – 24,843 (Includes 6,600 Africa employees)
� Balance sheet strength:
� Assets – $ 31 billion
� Net debt – $ 12.9 billion
� Net debt to EBITDA (Annualised)– 2.9 Times
� Continues to be FCF positive on a standalone basis
Note: (1) Wireless customer market share of India. (2) The approved dividend is for the shareholders in India.
* Includes 23 days of Airtel Africa
10
Mobile Services Telemedia Services Enterprise Services DTH
Wireless Services - India
11
Mobile Services Telemedia Services Enterprise Services DTH
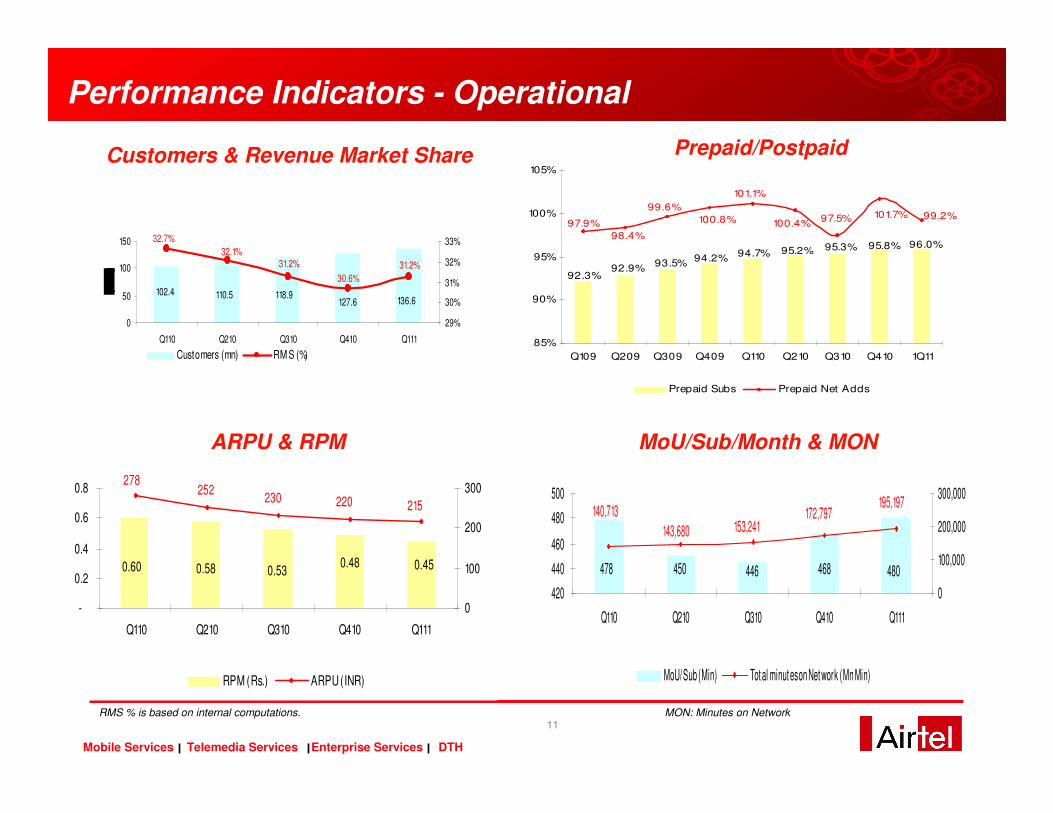
Performance Indicators - Operational
Customers & Revenue Market Share Prepaid/Postpaid
MoU/Sub/Month & MONARPU & RPM
0.450.480.60 0.58 0.53
215220230252
278
-
0.2
0.4
0.6
0.8
Q110 Q210 Q310 Q410 Q111
0
100
200
300
RPM (Rs.) ARPU (INR)
480468446450478
195,197172,797
153,241143,680
140,713
420
440
460
480
500
Q110 Q210 Q310 Q410 Q111
0
100,000
200,000
300,000
MoU/ Sub (Min) Tot al minut es on Net work (Mn Min)
96.0%95.8%95.3%95.2%94.7%94.2%
93.5%92.9%
92.3%
99.2%101.7%97.5%100.4%
101.1%
100.8%97.9%
98.4%
99.6%
85%
90%
95%
100%
105%
Q109 Q209 Q309 Q409 Q110 Q210 Q310 Q410 1Q11
Prepaid Subs Prepaid Net Adds
RMS % is based on internal computations. MON: Minutes on Network
136.6127.6118.9102.4 110.5
31.2%
32.7%
32.1%31.2%
30.6%
0
50
100
150
Q110 Q210 Q310 Q410 Q111
29%
30%
31%
32%
33%
Customers (mn) RM S (%)

12
Mobile Services Telemedia Services Enterprise Services DTH
Current positioning and way forward…
� Brand
� Distribution
� Churn lower than industry
� Spectrum Mix (900/1800 MHz)
� Improving cost efficiencies
� Lowest cost GSM network
� Revenue size
(>$ 9 Bn)
� Revenue Market
Share
� Increasing the usage through U&R drive
� Wallet share
� Driven by rural strategy
� Changing face of
growth through M-Com,
M-entertainment & 3G
Leadership Positioning Growth strategy and plans
Revenue
Non financial vitals
Cost
New Revenue Streams
Net Adds
Maximizing usage

13
Mobile Services Telemedia Services Enterprise Services DTH
Telemedia Services - India
14
Mobile Services Telemedia Services Enterprise Services DTH
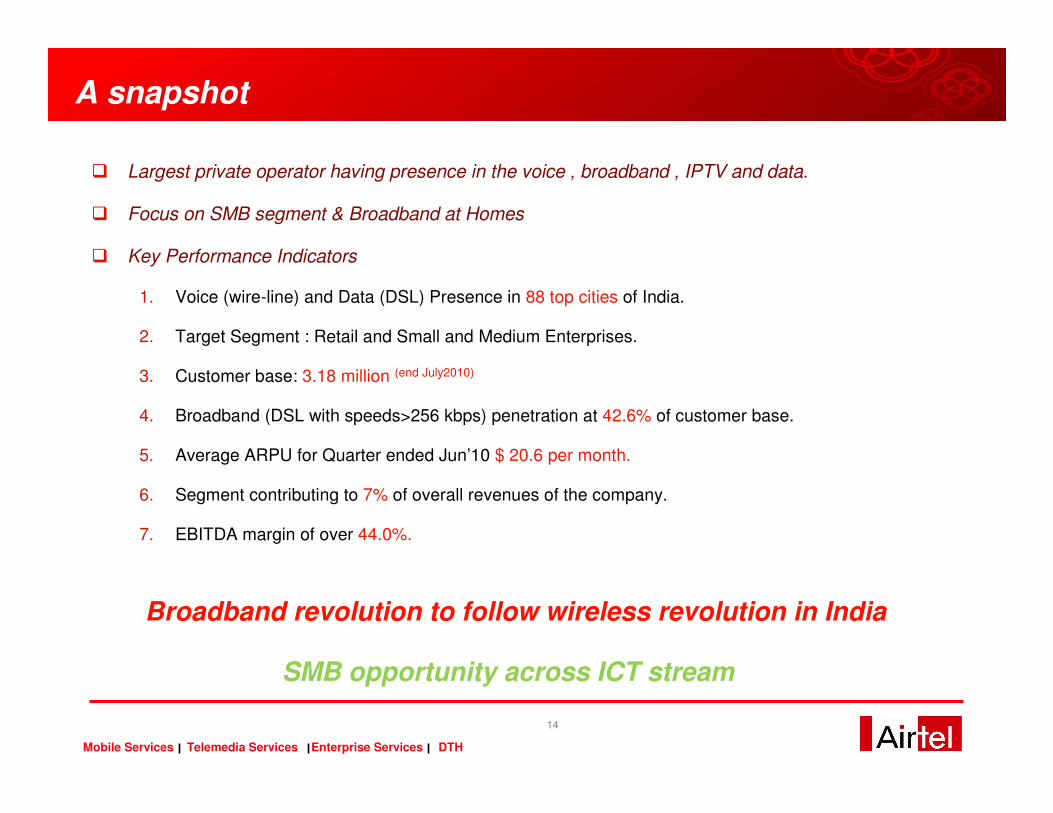
A snapshot
� Largest private operator having presence in the voice , broadband , IPTV and data.
� Focus on SMB segment & Broadband at Homes
� Key Performance Indicators
1. Voice (wire-line) and Data (DSL) Presence in 88 top cities of India.
2. Target Segment : Retail and Small and Medium Enterprises.
3. Customer base: 3.18 million (end July2010)
4. Broadband (DSL with speeds>256 kbps) penetration at 42.6% of customer base.
5. Average ARPU for Quarter ended Jun’10 $ 20.6 per month.
6. Segment contributing to 7% of overall revenues of the company.
7. EBITDA margin of over 44.0%.
Broadband revolution to follow wireless revolution in India
SMB opportunity across ICT stream

15
Mobile Services Telemedia Services Enterprise Services DTH
Enterprise Services - India
16
Mobile Services Telemedia Services Enterprise Services DTH
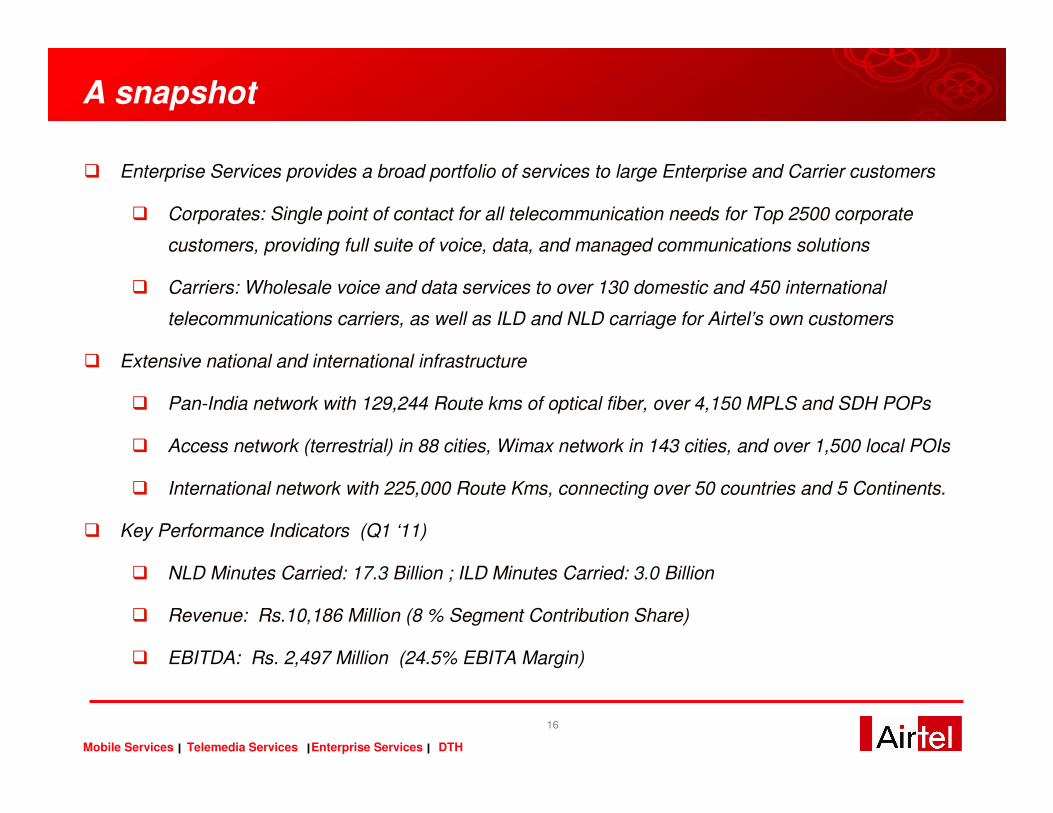
A snapshot
� Enterprise Services provides a broad portfolio of services to large Enterprise and Carrier customers
� Corporates: Single point of contact for all telecommunication needs for Top 2500 corporate
customers, providing full suite of voice, data, and managed communications solutions
� Carriers: Wholesale voice and data services to over 130 domestic and 450 international
telecommunications carriers, as well as ILD and NLD carriage for Airtel’s own customers
� Extensive national and international infrastructure
� Pan-India network with 129,244 Route kms of optical fiber, over 4,150 MPLS and SDH POPs
� Access network (terrestrial) in 88 cities, Wimax network in 143 cities, and over 1,500 local POIs
� International network with 225,000 Route Kms, connecting over 50 countries and 5 Continents.
� Key Performance Indicators (Q1 ‘11)
� NLD Minutes Carried: 17.3 Billion ; ILD Minutes Carried: 3.0 Billion
� Revenue: Rs.10,186 Million (8 % Segment Contribution Share)
� EBITDA: Rs. 2,497 Million (24.5% EBITA Margin)

17
Mobile Services Telemedia Services Enterprise Services DTH
Passive Infrastructure Services - India
18
Mobile Services Telemedia Services Enterprise Services DTH
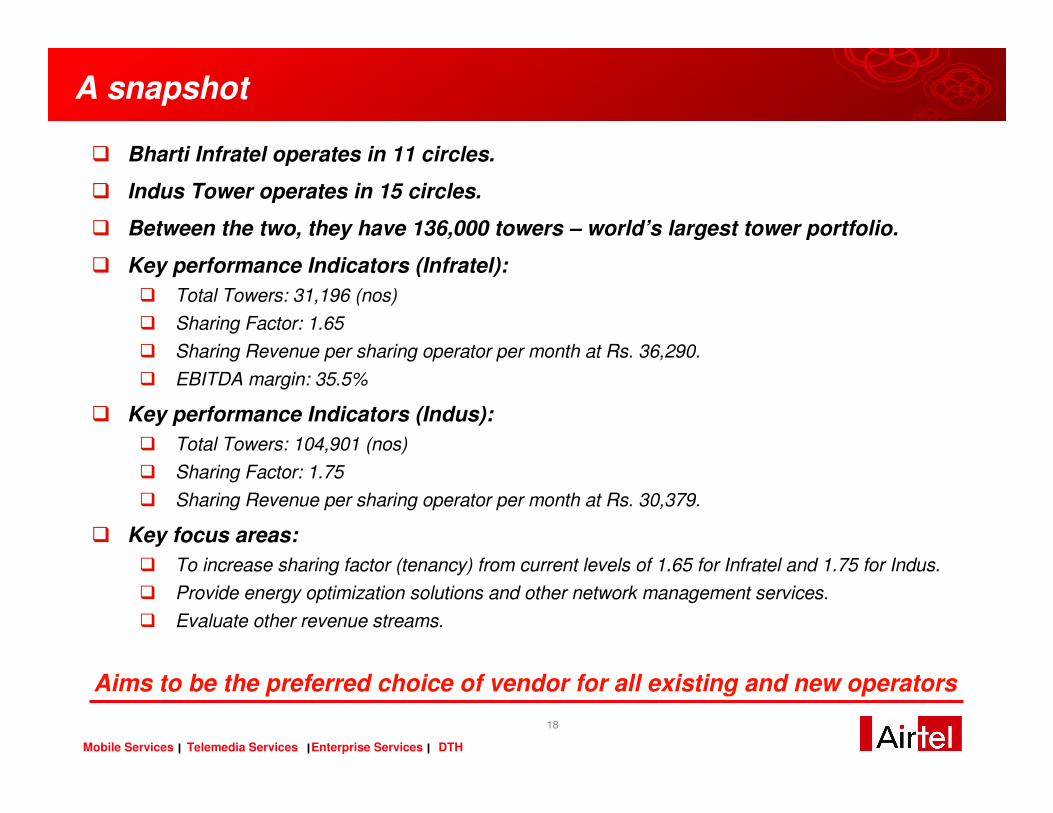
A snapshot
� Bharti Infratel operates in 11 circles.
� Indus Tower operates in 15 circles.
� Between the two, they have 136,000 towers – world’s largest tower portfolio.
� Key performance Indicators (Infratel):
� Total Towers: 31,196 (nos)
� Sharing Factor: 1.65
� Sharing Revenue per sharing operator per month at Rs. 36,290.
� EBITDA margin: 35.5%
� Key performance Indicators (Indus):
� Total Towers: 104,901 (nos)
� Sharing Factor: 1.75
� Sharing Revenue per sharing operator per month at Rs. 30,379.
� Key focus areas:
� To increase sharing factor (tenancy) from current levels of 1.65 for Infratel and 1.75 for Indus.
� Provide energy optimization solutions and other network management services.
� Evaluate other revenue streams.
Aims to be the preferred choice of vendor for all existing and new operators

19
Mobile Services Telemedia Services Enterprise Services DTH
Summary
20
Mobile Services Telemedia Services Enterprise Services DTH
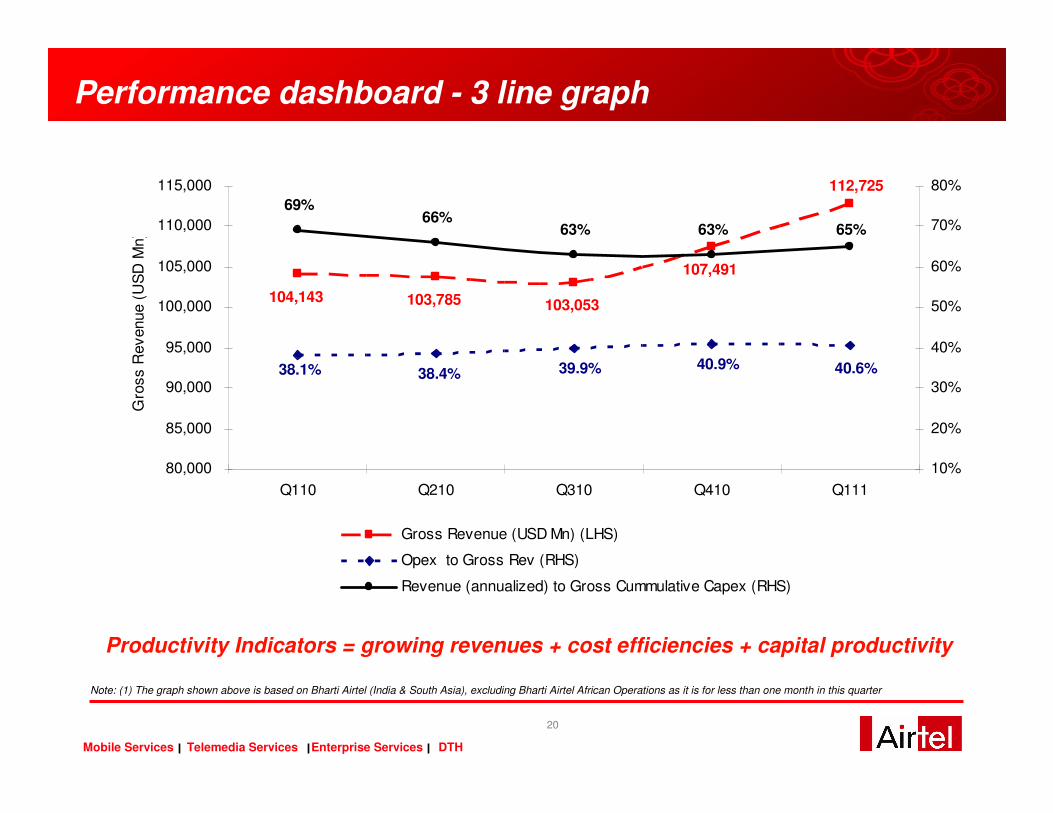
Performance dashboard - 3 line graph
Productivity Indicators = growing revenues + cost efficiencies + capital productivity
112,725
107,491
103,053103,785104,143
38.1% 38.4% 39.9% 40.9% 40.6%
69%66%
63% 63% 65%
80,000
85,000
90,000
95,000
100,000
105,000
110,000
115,000
Q110 Q210 Q310 Q410 Q111
Gro
ss R
evenue (
US
D M
n)
10%
20%
30%
40%
50%
60%
70%
80%
Gross Revenue (USD Mn) (LHS)
Opex to Gross Rev (RHS)
Revenue (annualized) to Gross Cummulative Capex (RHS)
Note: (1) The graph shown above is based on Bharti Airtel (India & South Asia), excluding Bharti Airtel African Operations as it is for less than one month in this quarter

21
Mobile Services Telemedia Services Enterprise Services DTH
Segment contribution…Rev, EBITDA and Investment
Note: (1) Revenue and EBITDA is gross of inter segment eliminations.(2) Investments are on gross basis.
REVENUE
80%
7%
8%
17% 2%
EBITDA
78%9%
6%
16%-7%
INVESTMENTS
89%
9%3%
17% 2%
Mobile Services Telemedia Services Enterprise Services
Infratel Services Others
22
Mobile Services Telemedia Services Enterprise Services DTH
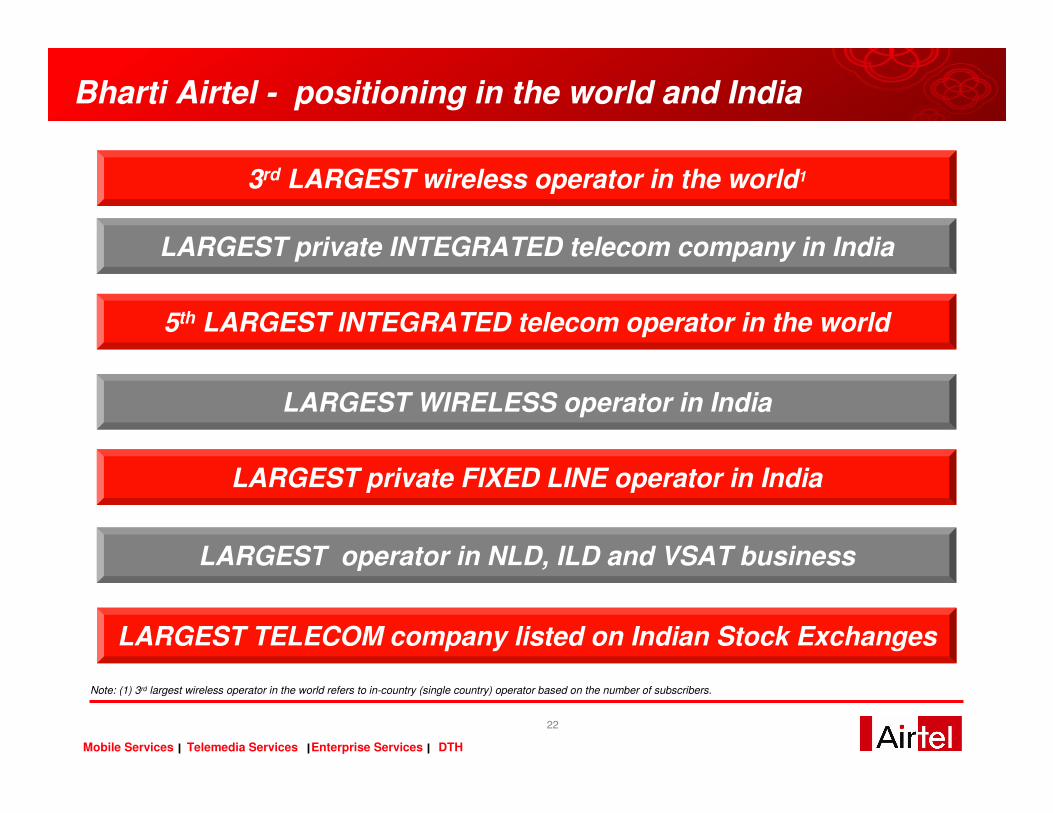
3rd LARGEST wireless operator in the world1
LARGEST operator in NLD, ILD and VSAT business
Bharti Airtel - positioning in the world and India
LARGEST private INTEGRATED telecom company in India
LARGEST WIRELESS operator in India
LARGEST private FIXED LINE operator in India
Note: (1) 3rd largest wireless operator in the world refers to in-country (single country) operator based on the number of subscribers.
LARGEST TELECOM company listed on Indian Stock Exchanges
5th LARGEST INTEGRATED telecom operator in the world
23
Mobile Services Telemedia Services Enterprise Services DTH
Recent Honours

24
Mobile Services Telemedia Services Enterprise Services DTH
Bharti Airtel – Leadership in business Recent Honours
� NDTV Profit Business Leadership Awards 2010
� Top Telecom Company
� Sunil Bharti Mittal - Business Innovator of the Year
� India’s Most Innovative company - Wall Street Journal
� Most Preferred Cellular Service Provider - 2010 CNBC Awaaz Consumer Awards
� Tele.net Telecom Operator award
Won in 6 out of total 14 categories. Few among them being
� ‘Powerful Brand’ - Economic Times (the only corporate brand to be awarded the AAA rating)
� Sunil Bharti Mittal - Global Telecom Leader - Voice & Data magazine
� Akhil Gupta, Deputy Group CEO and MD - Asia Corporate Dealmaker Award 2010
� Manoj Kohli, CEO( International) & Joint MD - Telecom Man of the year - Tele.net
� Business world – FICCI – SEDF Corporate Social Responsibility Awards 2009-10
� Most Admired company
� Best National Mobile operator
� Best Internet and Broadband operator
� Best Enterprise services

Disclaimer
The information contained in this presentation is only current as of its date. All actions and statements made herein or otherwise shall be subject to the
applicable laws and regulations as amended from time to time. There is no representation that all information relating to the context has been taken
care off in the presentation and neither we undertake any obligation as to the regular updating of the information as a result of new information, future
events or otherwise. We will accept no liability whatsoever for any loss arising directly or indirectly from the use of, reliance of any information
contained in this presentation or for any omission of the information. The information shall not be distributed or used by any person or entity in any
jurisdiction or countries were such distribution or use would be contrary to the applicable laws or Regulations. It is advised that prior to acting upon this
presentation independent consultation / advise may be obtained and necessary due diligence, investigation etc may be done at your end. You may
also contact us directly for any questions or clarifications at our end.
This presentation contain certain statements of future expectations and other forward-looking statements, including those relating to our general
business plans and strategy, our future financial condition and growth prospects, and future developments in our industry and our competitive and
regulatory environment. In addition to statements which are forward looking by reason of context, the words ‘may, will, should, expects, plans, intends,
anticipates, believes, estimates, predicts, potential or continue’ and similar expressions identify forward looking statements.
Actual results, performances or events may differ materially from these forward-looking statements including the plans, objectives, expectations,
estimates and intentions expressed in forward looking statements due to a number of factors, including without limitation future changes or
developments in our business, our competitive environment, telecommunications technology and application, and political, economic, legal and social
conditions in India. It is cautioned that the foregoing list is not exhaustive
This presentation is not being used in connection with any invitation of an offer or an offer of securities and should not be used as a basis for any
investment decision.
Investor Relations :- http://www.bhartiairtel.inFor any queries, write to: [email protected]
“The information contained herein does not constitute an offer of securities for sale in the United States. Securities may not be sold in the United States absent registration or an exemption from registration under the U.S. Securities Act of 1933, as amended. Any public offering of securities to be made in the United States will be made by means of a prospectus and will contain detailed information about the Company and its management, as well as financial statements. No money, securities or other consideration is being solicited, and, if sent in response to the information contained herein, will not be accepted.”


![Agriculture Nomura Sept10[1]](https://static.fdocuments.us/doc/165x107/577d35631a28ab3a6b905080/agriculture-nomura-sept101.jpg)