Investor Presentation Q2 2015 Results - zonebourse.com A/S... · Investor Presentation Q2 2015...
24
Investor Presentation Q2 2015 Results 27 August 2015
Transcript of Investor Presentation Q2 2015 Results - zonebourse.com A/S... · Investor Presentation Q2 2015...
Investor PresentationQ2 2015 Results
27 August 2015
Forward-looking statements
2
This presentation contains forward-looking statements, including, but not limited to, the statements and expectations contained in the “Outlook” section of this presentation. Statements herein, other than statements of historical fact, regarding future events or prospects, are forward-looking statements. The words ‘‘may’’, “will”, “should”, ‘‘expect’’, ‘‘anticipate’’, ‘‘believe’’, ‘‘estimate’’, ‘‘plan’’, "predict," ‘‘intend’ or variations of these words, as well as other statements regarding matters that are not historical fact or regarding future events or prospects, constitute forward-looking statements. ISS has based these forward-looking statements on its current views with respect to future events and financial performance. These views involve a number of risks and uncertainties, which could cause actual results to differ materially from those predicted in the forward-looking statements and from the past performance of ISS. Although ISS believes that the estimates and projections reflected in the forward-looking statements are reasonable, they may prove materially incorrect, and actual results may materially differ, e.g. as the result of risks related to the facility service industry in general or ISS in particular including those described in the Annual Report 2014 of ISS A/S and other information made available by ISS.
As a result, you should not rely on these forward-looking statements. ISS undertakes no obligation to update or revise any forward-looking statements, whether as a result of new information, future events or otherwise, except to the extent required by law.
The Annual Report 2014 of ISS A/S is available at the Group’s website, www.issworld.com.
Agenda
3
• Highlights• Highlights
• Regional Performance• Regional Performance
• Financial Results• Financial Results
• Organisational Structure• Organisational Structure
• Outlook• Outlook
• Q&A• Q&A
REMINDERCapital Markets’ Day
17 September 2015London
12.30 – 17.00 (UK)
All enquiries to Martin Kjær Hansen ([email protected])
Highlights
5

Business Highlights Q2 2015
6
Operating Performance
Integrated Facility Services (IFS)
Emerging Markets
Strategic Initiatives
• Strategic initiatives progressing according to plans• Positive effect on margins continuing• Phase III of procurement initiative being launched• Integration of GS Hall on-track, insourcing of previously sub-contracted services has begun• Change in organisational structure to facilitate alignment across the group and boost customer focus
• Organic growth of 8% and an operating margin of 6.1% (unchanged year-on-year)• Represents 25% of group revenue
• Strong growth in IFS (+10% in local currency) which now represents 33% of group revenue• Significant IFS contract start-ups: Huawei (China) and UBS (UK)• Major IFS contract expansions: Danske Bank (Nordic, Eastern Europe) and DSB (Denmark)• Notable IFS contract win: Huashan Hospital (China), Healthcare segment (UK)
• Global Corporate Clients (GCC) revenues +13% in local currency• Start-up of significant Cleaning contract with major financial services customer
• Strong organic growth• Improved operating margin, despite operational challenges in the Netherlands and Brazil• Solid LTM cash conversion• Significantly improved net result

Key IFS Contracts Launched in Q2 2015
7
Future potential • Longer-term potential given scale of Huawei in China and internationally
• Seamless mobilisation thus far• Scope to deliver additional servces• 5 Broadgate will be a showcase building in London and hence
affords ISS the potential to demonstrate our delivery of transformational IFS
Why ISS?
• ISS demonstrated a deep understanding of Huawei’s needs• Customised service offering, delivering Hong Kong service
standards in mainland China• Initial support from ISS Hong Kong with service levels maintained by
local team thereafter
• ISS solution sharply focused on supporting UBS in attracting and retaining employees while enhancing their well-being
• High emphasis placed on transformation, sustainability, safety and security, technology and innovation
Scope
• 3-year contract, starting April 2015• Cleaning, Security, Office Support, Customer Service and Facility
Management provided at a residential campus for up to 3,300 Huawei employees
• c. 320 ISS employees (incl. 36 Hong Kong residents in Year 1)
• 5-year contract• Technical services, Energy management, Cleaning, Waste
management, Pest control, Security, Real Estate services, Client services
• 1.5m sq ft of property (incl. 5 Broadgate), c. 400 ISS employees
Background• Huawei seeking to attract and retain talented employees by
providing comfortable and enjoyable working and living conditions• ISS’ international brand and reputation – together with its leading
position in the Hong Kong market – helped forge the relationship
• UBS seeking a flexible, productive, world class office facilityachieving the highest standards of sustainability
• ISS’ relationship with UBS in Switzerland had illustrated our abilityto deliver ahead of customer expectations

Financial Highlights Q2 2015
8
1. Resilient Organic Growth
Organic growth was 4.8% in Q2 2015 vs. 3.1% in Q1 2015• Western Europe impacted by large contract
launches and selective demand for non-portfolio services (Switzerland and UK)
• Continued strong growth in emerging marketsand the Pacific
• Continued strong growth in IFS• Macroeconomic conditions in certain European
countries remain challenging
3. Strong Cash Conversion(2)2. Improved Operating Margin(1)
Organic Growth (%) Cash Conversion (LTM)LTM Operating Margin (LTM)
0%
1%
2%
3%
4%
5%
6%
7%
Q22011
Q22012
Q22013
Q22014
Q22015
Organic Growth (Q) Organic Growth (LTM)
5.0%5.1%5.2%5.3%5.4%5.5%5.6%5.7%5.8%5.9%6.0%
Q22011
Q22012
Q22013
Q22014
Q22015
Operating Margin (LTM)
Operating margin was 5.3% in Q2 2015 vs. 5.2% in Q2 2014• Positive margin progression across most
regions• Strategic initiatives to improve profitability and
competitiveness continue to progressaccording to plan
• Operational challenges in the Netherlands and Brazil
LTM cash conversion was 99% in Q2 2015 vs. 97% in Q1 2015• Ensuring a strong cash performance remains a
key priortity• Result reflects our efforts to ensure timely
payment for work performed
0%
20%
40%
60%
80%
100%
120%
Q22011
Q22012
Q22013
Q22014
Q22015
Cash Conversion (LTM)
Three key financial priorities
Regional Performance
9

Regional Performance Q2 2015
10
Developed Markets Emerging Markets(1)
75%of Group revenue
43%of Group employees
4%organic growth(vs. 2% in Q1 2015)
6.0%operating margin(2)
(vs. 5.7% in Q2 2014)
25%of Group revenue
57%of Group employees
8%organic growth(vs. 7% in Q1 2015)
6.1%operating margin(2)
(vs. 6.1% in Q2 2014)
(1) Emerging Markets comprise Asia, Eastern Europe, Latin America, Israel, South Africa and Turkey(2) Operating profit before other items and corporate costs
Regional Performance Q2 2015
11
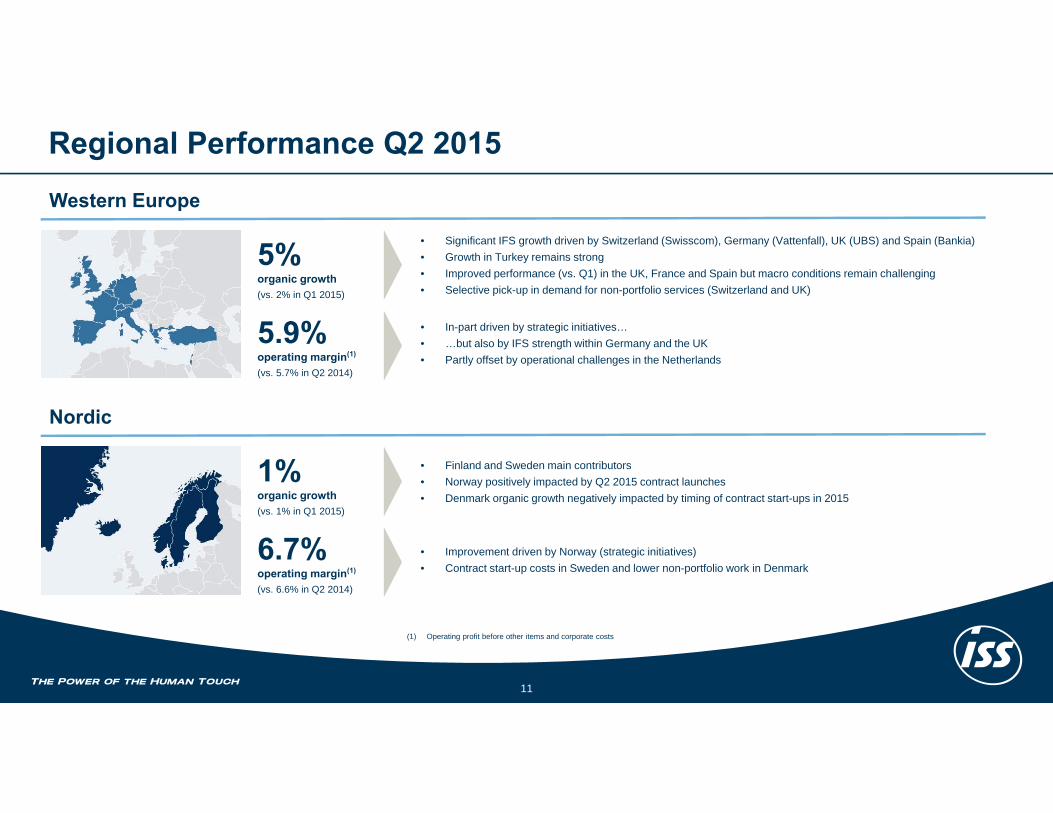
Western Europe
5%organic growth(vs. 2% in Q1 2015)
5.9%operating margin(1)
(vs. 5.7% in Q2 2014)
• Significant IFS growth driven by Switzerland (Swisscom), Germany (Vattenfall), UK (UBS) and Spain (Bankia)• Growth in Turkey remains strong• Improved performance (vs. Q1) in the UK, France and Spain but macro conditions remain challenging• Selective pick-up in demand for non-portfolio services (Switzerland and UK)
• In-part driven by strategic initiatives…• …but also by IFS strength within Germany and the UK• Partly offset by operational challenges in the Netherlands
Nordic
1%organic growth(vs. 1% in Q1 2015)
6.7%operating margin(1)
(vs. 6.6% in Q2 2014)
• Finland and Sweden main contributors• Norway positively impacted by Q2 2015 contract launches• Denmark organic growth negatively impacted by timing of contract start-ups in 2015
• Improvement driven by Norway (strategic initiatives)• Contract start-up costs in Sweden and lower non-portfolio work in Denmark
(1) Operating profit before other items and corporate costs

Regional Performance Q2 2015
12
Asia
10%organic growth(vs. 8% in Q1 2015)
7.0%operating margin(1)
(vs. 7.0% in Q2 2014)
• Double-digit organic growth in India, Indonesia, China and Thailand• Hong Kong returns to growth due to contract start-ups• Strong performance from Global Corporate Client contracts in Singapore
• Operational improvements in Hong Kong and cost savings in India
Latin America
4%organic growth(vs. 6% in Q1 2015)
4.9%operating margin(1)
(vs. 4.7% in Q2 2014)
• Higher demand for non-portfolio services in Chile• Price increases in Argentina• Contract losses in Brazil and Mexico with no significant contract start-ups
• Improved performance in Mexico and Chile• Margin declines in Brazil due to contract losses, scope reductions and cost increases
(1) Operating profit before other items and corporate costs

Regional Performance Q2 2015
13
Pacific
8%organic growth(vs. 10% in Q1 2015)
North America
Eastern Europe
• Strong performance across the board but notably within IFS and the aviation segment
• Growth driven by remote site resource segment in Australia• Year-on-year growth in Aviation has slowed versus Q1
4.9%operating margin(1)
(vs. 4.1% in Q2 2014)
1%organic growth(vs. -2% in Q1 2015)
• Restructuring initiatives have yielded an improved operational performance• Positive impact from IFS and higher demand for non-portfolio services
• Returned to positive organic growth in Q2• Higher demand for portfolio and non-portfolio services from Global Corporate Clients• Negative impact from contract exits and losses in 2014 and 2015
4.2%operating margin(1)
(vs. 3.2% in Q2 2014)
4%organic growth(vs. 1% in Q1 2015)
• Contract scope reductions in Romania and the Czech Republic, contract start-up costs and contract losses in Poland
• Driven by contract wins in Poland and Slovenia and higher demand for non-portfolio services in Slovakia• Negatively impacted by Czech Republic (contract loss in Financial Services, lower-than-expected volume developments elsewhere)
6.3%operating margin(1)
(vs. 7.3% in Q2 2014)
(1) Operating profit before other items and corporate costs

Financial Results
14

16,000
16,500
17,000
17,500
18,000
18,500
19,000
19,500
20,000
20,500
21,000
Q2 2014 Divestments/acquisition
Currency Organic Q2 2015
Revenue Bridge
15
(1%)
DKK million
Q2 2015 revenue growth of 9.8%
Note net currency impact due primarily to GBP, CHF, and USD
6%
4.8% 20,206
18,397
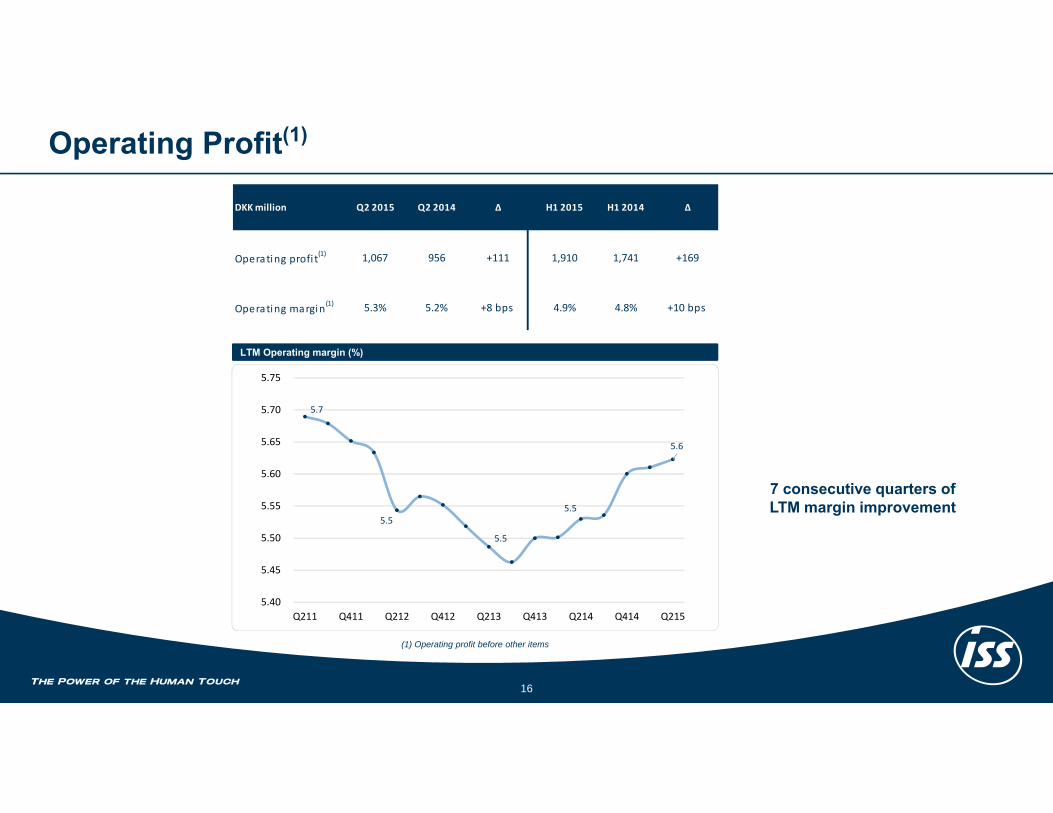
5.7
5.5
5.5
5.5
5.6
5.40
5.45
5.50
5.55
5.60
5.65
5.70
5.75
Q211 Q411 Q212 Q412 Q213 Q413 Q214 Q414 Q215
Operating Profit(1)
16
LTM Operating margin (%)
(1) Operating profit before other items
DKK million Q2 2015 Q2 2014 Δ H1 2015 H1 2014 Δ
Operating profi t(1) 1,067 956 +111 1,910 1,741 +169
Operating margin(1) 5.3% 5.2% +8 bps 4.9% 4.8% +10 bps
7 consecutive quarters of LTM margin improvement
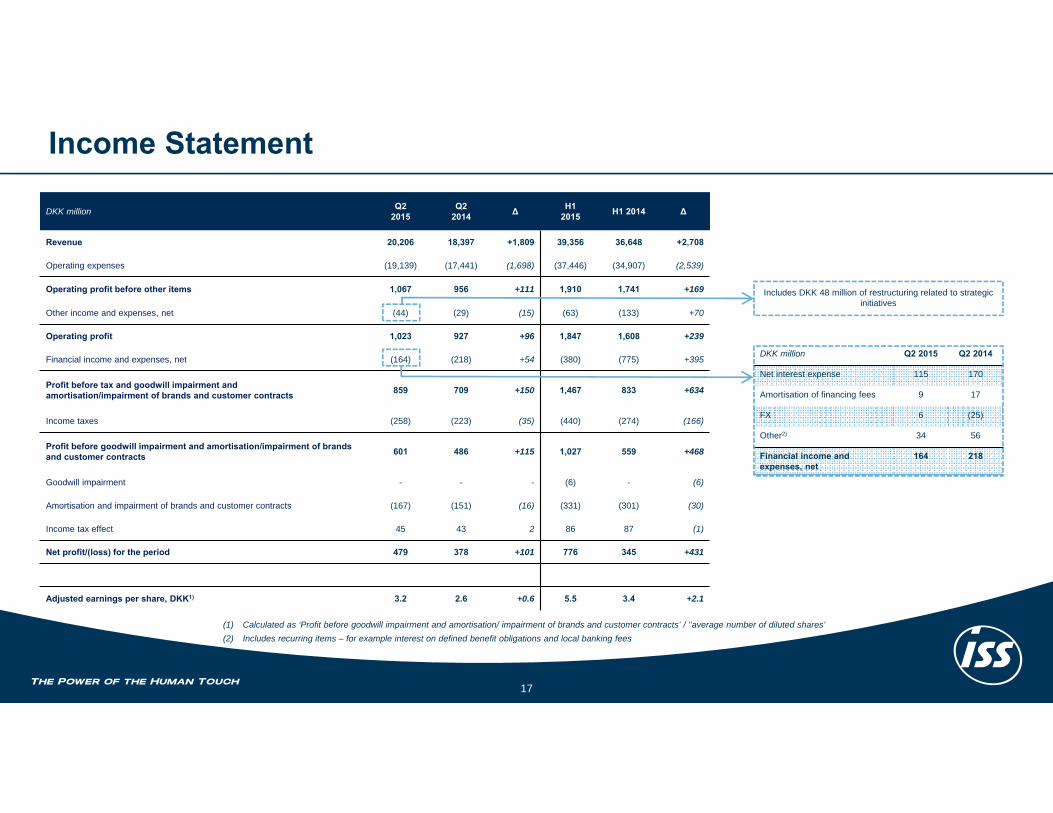
Income Statement
17
DKK million Q2 2015
Q2 2014 ∆ H1
2015 H1 2014 ∆
Revenue 20,206 18,397 +1,809 39,356 36,648 +2,708
Operating expenses (19,139) (17,441) (1,698) (37,446) (34,907) (2,539)
Operating profit before other items 1,067 956 +111 1,910 1,741 +169
Other income and expenses, net (44) (29) (15) (63) (133) +70
Operating profit 1,023 927 +96 1,847 1,608 +239
Financial income and expenses, net (164) (218) +54 (380) (775) +395
Profit before tax and goodwill impairment andamortisation/impairment of brands and customer contracts 859 709 +150 1,467 833 +634
Income taxes (258) (223) (35) (440) (274) (166)
Profit before goodwill impairment and amortisation/impairment of brands and customer contracts 601 486 +115 1,027 559 +468
Goodwill impairment - - - (6) - (6)
Amortisation and impairment of brands and customer contracts (167) (151) (16) (331) (301) (30)
Income tax effect 45 43 2 86 87 (1)
Net profit/(loss) for the period 479 378 +101 776 345 +431
Adjusted earnings per share, DKK1) 3.2 2.6 +0.6 5.5 3.4 +2.1
DKK million Q2 2015 Q2 2014
Net interest expense 115 170
Amortisation of financing fees 9 17
FX 6 (25)
Other2) 34 56
Financial income and expenses, net
164 218
Includes DKK 48 million of restructuring related to strategic initiatives
(1) Calculated as ‘Profit before goodwill impairment and amortisation/ impairment of brands and customer contracts’ / ‘’average number of diluted shares’(2) Includes recurring items – for example interest on defined benefit obligations and local banking fees
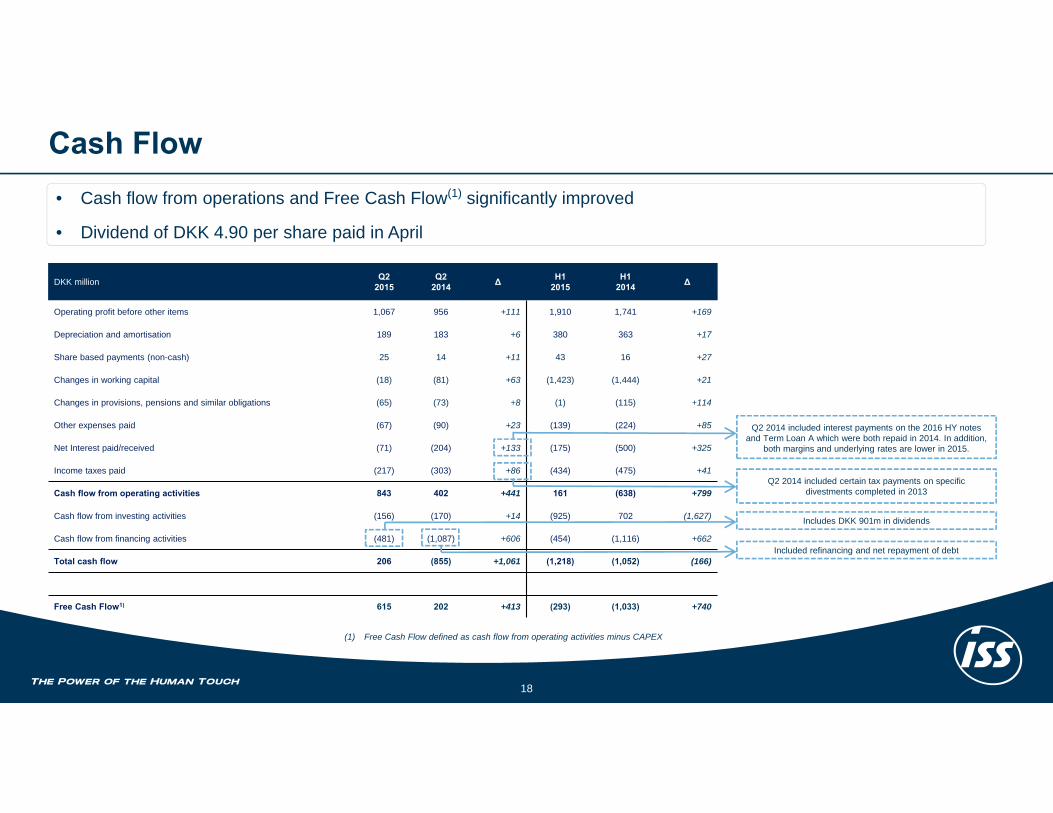
Cash Flow
18
DKK million Q22015
Q2 2014 ∆ H1
2015H1
2014 ∆
Operating profit before other items 1,067 956 +111 1,910 1,741 +169
Depreciation and amortisation 189 183 +6 380 363 +17
Share based payments (non-cash) 25 14 +11 43 16 +27
Changes in working capital (18) (81) +63 (1,423) (1,444) +21
Changes in provisions, pensions and similar obligations (65) (73) +8 (1) (115) +114
Other expenses paid (67) (90) +23 (139) (224) +85
Net Interest paid/received (71) (204) +133 (175) (500) +325
Income taxes paid (217) (303) +86 (434) (475) +41
Cash flow from operating activities 843 402 +441 161 (638) +799
Cash flow from investing activities (156) (170) +14 (925) 702 (1,627)
Cash flow from financing activities (481) (1,087) +606 (454) (1,116) +662
Total cash flow 206 (855) +1,061 (1,218) (1,052) (166)
Free Cash Flow1) 615 202 +413 (293) (1,033) +740
Q2 2014 included interest payments on the 2016 HY notes and Term Loan A which were both repaid in 2014. In addition,
both margins and underlying rates are lower in 2015.
Q2 2014 included certain tax payments on specific divestments completed in 2013
Includes DKK 901m in dividends
Included refinancing and net repayment of debt
• Cash flow from operations and Free Cash Flow(1) significantly improved
• Dividend of DKK 4.90 per share paid in April
(1) Free Cash Flow defined as cash flow from operating activities minus CAPEX

6.0
4.9 5.0 4.5
3.2
2.6 2.9
0.00
1.00
2.00
3.00
4.00
5.00
6.00
7.00
0
5,000
10,000
15,000
20,000
25,000
30,000
35,000
Q112 Q312 Q113 Q313 Q114 Q314 Q115
Net debt (DKKm) Leverage
Leverage
19
Net debt and leverage(1)
(1) Net debt / Pro forma adjusted EBITDA (LTM)
DKK million Q2 2015 Q2 2014 Δ Q2 2015 Q4 2014 Δ
Net debt 14,668 15,278 ‐610 14,668 12,647 +2.021
Leverage(1) 2.9 3.2 ‐0.3 2.9 2.6 +0.3

Organisational Structure
20
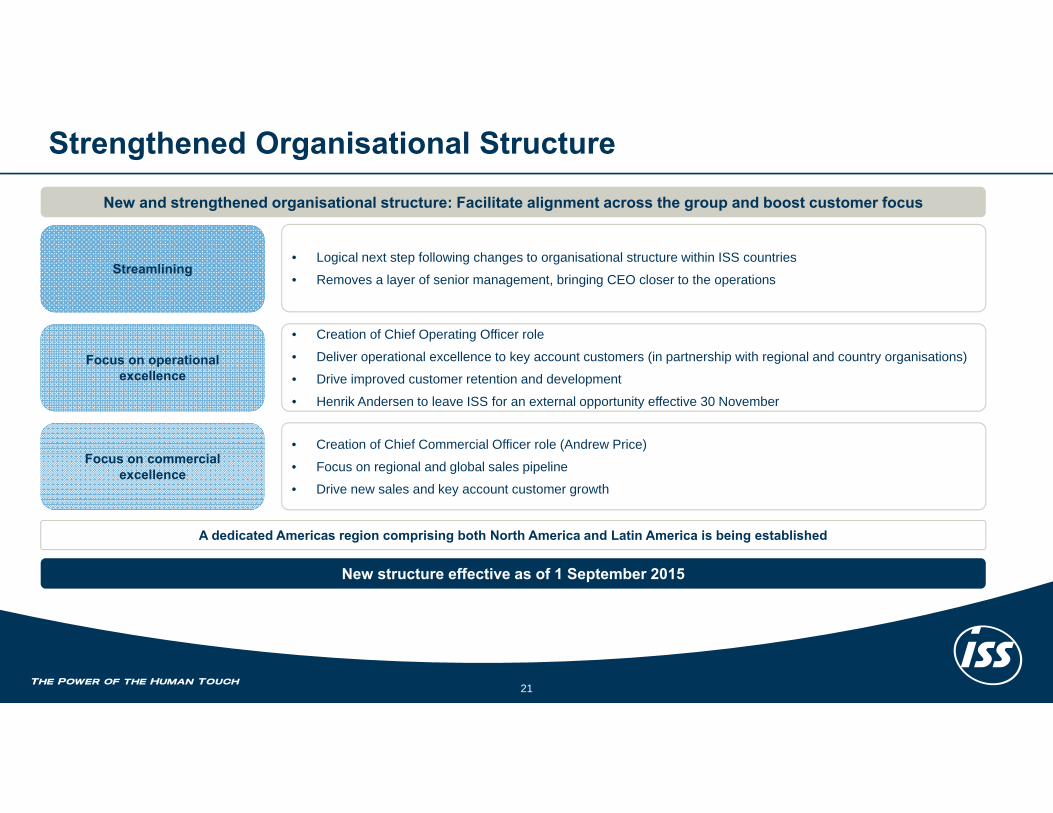
Strengthened Organisational Structure
21
New and strengthened organisational structure: Facilitate alignment across the group and boost customer focus
New structure effective as of 1 September 2015
Streamlining
Focus on operationalexcellence
Focus on commercialexcellence
• Creation of Chief Operating Officer role
• Deliver operational excellence to key account customers (in partnership with regional and country organisations)
• Drive improved customer retention and development
• Henrik Andersen to leave ISS for an external opportunity effective 30 November
• Creation of Chief Commercial Officer role (Andrew Price)
• Focus on regional and global sales pipeline
• Drive new sales and key account customer growth
• Logical next step following changes to organisational structure within ISS countries
• Removes a layer of senior management, bringing CEO closer to the operations
A dedicated Americas region comprising both North America and Latin America is being established
Outlook
22
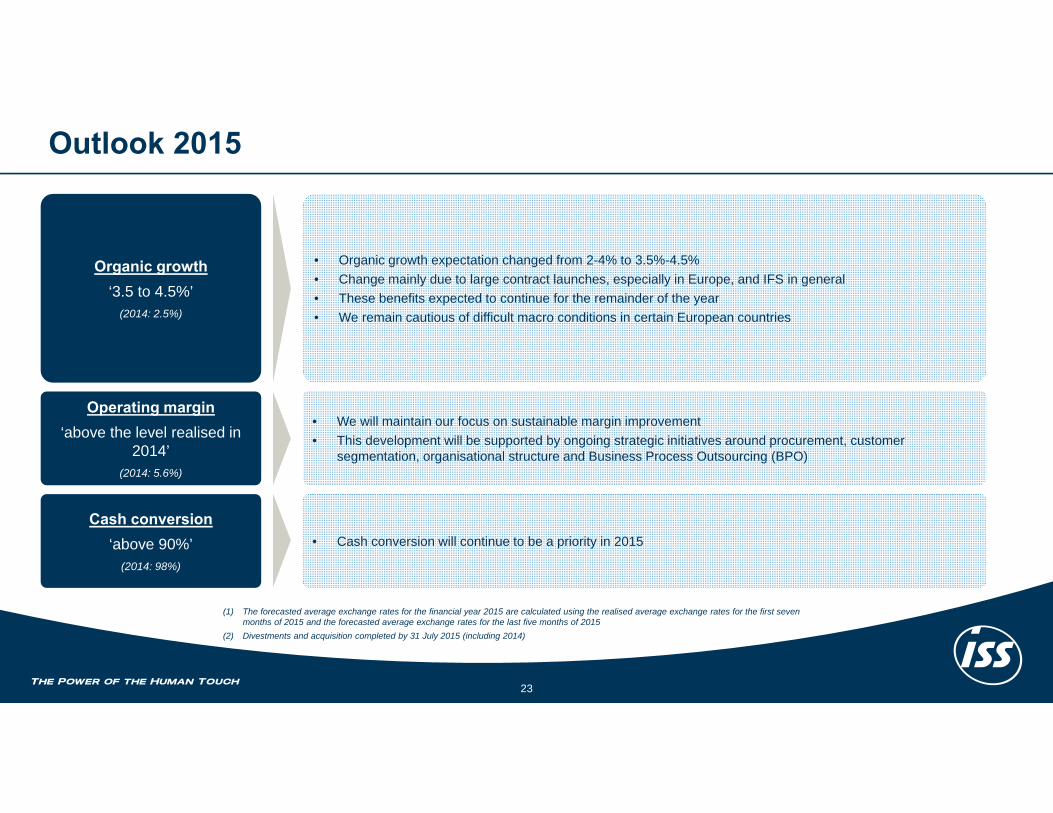
Outlook 2015
23
Operating margin‘above the level realised in
2014’(2014: 5.6%)
Cash conversion‘above 90%’
(2014: 98%)
• Cash conversion will continue to be a priority in 2015
• We will maintain our focus on sustainable margin improvement• This development will be supported by ongoing strategic initiatives around procurement, customer
segmentation, organisational structure and Business Process Outsourcing (BPO)
Organic growth‘3.5 to 4.5%’
(2014: 2.5%)
• Organic growth expectation changed from 2-4% to 3.5%-4.5%• Change mainly due to large contract launches, especially in Europe, and IFS in general• These benefits expected to continue for the remainder of the year• We remain cautious of difficult macro conditions in certain European countries
(1) The forecasted average exchange rates for the financial year 2015 are calculated using the realised average exchange rates for the first sevenmonths of 2015 and the forecasted average exchange rates for the last five months of 2015
(2) Divestments and acquisition completed by 31 July 2015 (including 2014)

Q&A
24