Investor presentation - Nordecon presentation_3m_2015.pdfInvestor Presentation 3m 2015 ... •...
19
Investor Presentation 3m 2015 Investor presentation
Transcript of Investor presentation - Nordecon presentation_3m_2015.pdfInvestor Presentation 3m 2015 ... •...

Investor Presentation
3m 2015
Investor presentation
Investor Presentation
Nordecon overview

Investor Presentation
KEY FACTS
• Nordecon is a group of construction companies whose core business is construction project management and general contracting in the buildings and infrastructures segment
• Geographically the Group operates currently in Estonia, Ukraine and Finland. The parent of the Group is Nordecon AS, a company registered and located in Tallinn, Estonia. In addition to the parent company, there are more than 10 subsidiaries in the Group
• Currently Nordecon employs more than 710 people
• Since 18 May 2006, the company's shares have been quoted in the main list of the NASDAQ OMX Tallinn Stock Exchange
Nordecon in brief
Investor Presentation
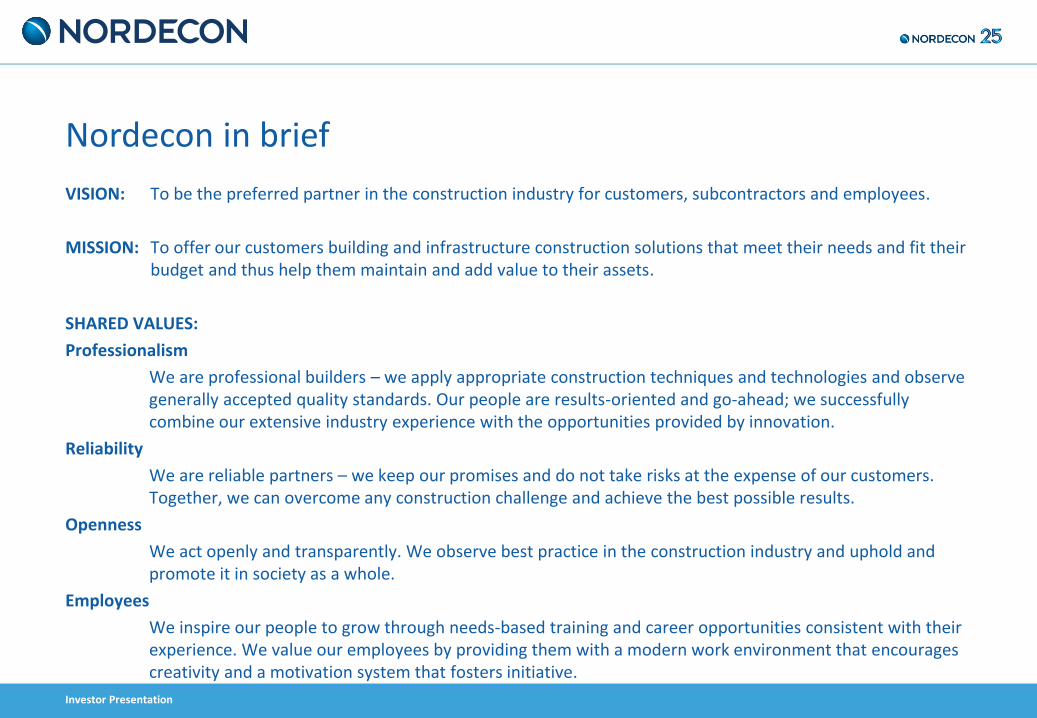
Nordecon in brief
VISION: To be the preferred partner in the construction industry for customers, subcontractors and employees.
MISSION: To offer our customers building and infrastructure construction solutions that meet their needs and fit their budget and thus help them maintain and add value to their assets.
SHARED VALUES:
Professionalism
We are professional builders – we apply appropriate construction techniques and technologies and observe generally accepted quality standards. Our people are results-oriented and go-ahead; we successfully combine our extensive industry experience with the opportunities provided by innovation.
Reliability
We are reliable partners – we keep our promises and do not take risks at the expense of our customers. Together, we can overcome any construction challenge and achieve the best possible results.
Openness
We act openly and transparently. We observe best practice in the construction industry and uphold and promote it in society as a whole.
Employees
We inspire our people to grow through needs-based training and career opportunities consistent with their experience. We value our employees by providing them with a modern work environment that encourages creativity and a motivation system that fosters initiative.

Investor Presentation
Strategic agenda for 2014-2017
Business activities
• Our business operations in Estonia will be equally divided between two segments, building and infrastructure construction, where we will compete in all major sub-segments.
• Our chosen foreign markets are Finland, Ukraine, Latvia and Lithuania. In the first two, we will conduct our business through local subsidiaries. Entering the Latvian and Lithuanian construction market through local subsidiaries assumes an economic rationale and the earliest time for this will be 2015. Where economic rationale exists, we may also deliver construction services in our neighbouring countries (Latvia, Lithuania and Sweden) on a project basis.
• We will focus on our real estate development operations in Estonia (in Tallinn, Tartu, Pärnu and Narva).
• We will develop our energy efficiency and building information modelling (BIM) competencies as developments in these areas are likely to lead to a new quality standard in the construction market.
• We will build strategic alliances in areas where we lack competence.

Investor Presentation
Strategic agenda for 2014-2017
Group structure and organisation
• The Group’s structure is optimal and we are not going to change it unless significant changes take place in the construction market.
• We will continue consistent investment in our IT-capabilities and -integration both at the level of the organisation and the employee.
• We will apply additional measures for improving cooperation between Group entities and structural units.
Financial targets
• By 2017 our gross margin will be at least 8% and EBITDA margin at least 6%.
• Administrative expenses will not exceed 4% of annual revenue.
• We will distribute, whenever possible, at least 15% of profit before tax for the year as dividends.
• In Estonia, our own real estate development operations will generate up to 5% of total revenue.

Investor Presentation
Business model
Industrial buildings Commercial buildings Public buildings Residential buildings
BUILDINGS
INFRASTRUCTURE
Road construction and maintenance
- road construction
- road maintenance
Specialist engineering
- bridges, viaducts
- port construction
- rail construction
Other infrastructure
- environmental engineering
- utility networks
OPERATIONAL ACTIVITIES

Investor Presentation
Road construction and maintenance
Environmental construction
Other infrastructure Industrial, civil and
commercial buildings Real estate
development
Core Competencies
• An organisation with shareholders oriented towards long-term profitable growth
• A flexible, horizontally integrated business model across the Group
• Experienced management
• Professional and loyal employees
• Relative conservatism in risk-taking
• Selected support services centralised group wide (e.g. IT, legal) to streamline costs
• Revenue base aimed at dividing activities between buildings and infrastructure segments equally to minimise volume risk
• Group covers all main sub-segments in the construction markets
Group’s strengths

Investor Presentation
Nordecon financial information
and key facts
3m 2015

Investor Presentation
Period in brief
• Revenue above 2014 comparative figure by 15%. Most of the revenue growth resulted from the buildings segment that has been less affected by the contraction in public sector spending. Revenue growth in the infrastructure segment was underpinned by slight growth in road construction volumes; however, the rise in road construction is not comparable to the level achieved a few years ago.
• Gross margin decreased compared to previous period (1.5% vs 5.0%), as is operating margin (-2.8% vs -0.7%). Compared with the same period last year, gross margin declined in both of the main operating segments, buildings and infrastructure. The strongest impact on the Group’s overall performance had the loss of the infrastructure segment that resulted from a sharp decrease in major self-performed winter works (large-scale earthworks) and a large proportion of uncovered fixed costs.
• Administrative expenses in general remained under control at 3.4% (12 months rolling) to revenue (2014: 2.9%) and are well below the strategic target of 4%.
• Exchange rate losses from Ukrainian subsidiaries amounted to 0.516 mEUR as hryvna weakened against the euro by 24% during the period. However, the same exchange loss gave rise to a positive 0.524 mEUR change in the translation reserve reported in equity and the net effect of the exchange loss on the Group’s net assets was 8.0 thEUR.
• Order book decreased by 13% compared to 31.03.2014. Order book of the infrastructure segment has increased but the rise has not compensated for the decline in work secured by the buildings segment.

Investor Presentation
Figure / Ratio 3m 2015 3m 2014
Revenue (tEUR) 27,113 23,544
Revenue growth/decrease, % 15.2% -13.1%
Net profit (tEUR) -1,354 -1,026
Gross margin, % 1.5% 5.0%
EBITDA margin, % -1.1% 1.3%
Net margin, % -5.0% -4.4%
Earnings per share (EUR) -0.04 -0.03
Equity ratio, % 38.8% 38.5%
Administrative expenses to revenue (12 months rolling) 3.4% 2.9%
Key figures / ratios

Investor Presentation
Revenue and profit
• Most of the first-quarter revenue resulted from projects started in 2014 whose margins were affected by the decrease in demand and ensuing rise in competitive pressure that characterised the previous financial year.
• Revenue increase led by buildings segment (+16%) that has been less affected by the contraction in public sector spending.
• Revenue growth in the Infrastructure segment (+14%) resulted from growth in road construction volumes.
• Profit margins fell in the first quarter due to the loss of the Infrastructure segment that resulted from a sharp decrease in major self-performed winter works (large-scale earthworks) and a large proportion of uncovered fixed costs.
• In the following quarters, revenue will increasingly result from contracts secured in the current market and competitive environment.
• The Group’s administrative expenses for the first quarter of 2015 totalled 1.11 mEur, which is comparable to a year ago (Q1 2014: 1,12mEur).
27 081
23 544
27 113
-542
-167
-752
593
1 170
409
-1 000
-500
0
500
1 000
1 500
2 000
0
5 000
10 000
15 000
20 000
25 000
30 000
3m 2013 3m 2014 3m 2015
Profit tEUR Revenue tEUR
Revenue Operating profit Gross profit
Investor Presentation
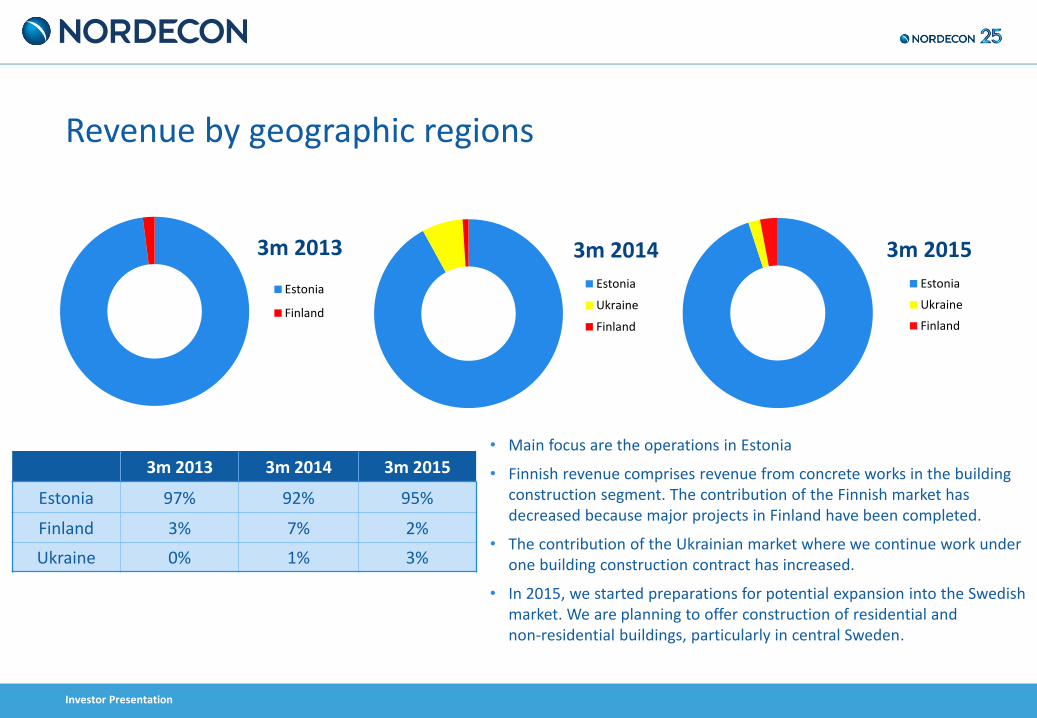
• Main focus are the operations in Estonia
• Finnish revenue comprises revenue from concrete works in the building construction segment. The contribution of the Finnish market has decreased because major projects in Finland have been completed.
• The contribution of the Ukrainian market where we continue work under one building construction contract has increased.
• In 2015, we started preparations for potential expansion into the Swedish market. We are planning to offer construction of residential and non-residential buildings, particularly in central Sweden.
3m 2013 3m 2014 3m 2015
Estonia 97% 92% 95%
Finland 3% 7% 2%
Ukraine 0% 1% 3%
Revenue by geographic regions
3m 2013
Estonia
Finland
3m 2014
Estonia
Ukraine
Finland
3m 2015
Estonia
Ukraine
Finland
Investor Presentation
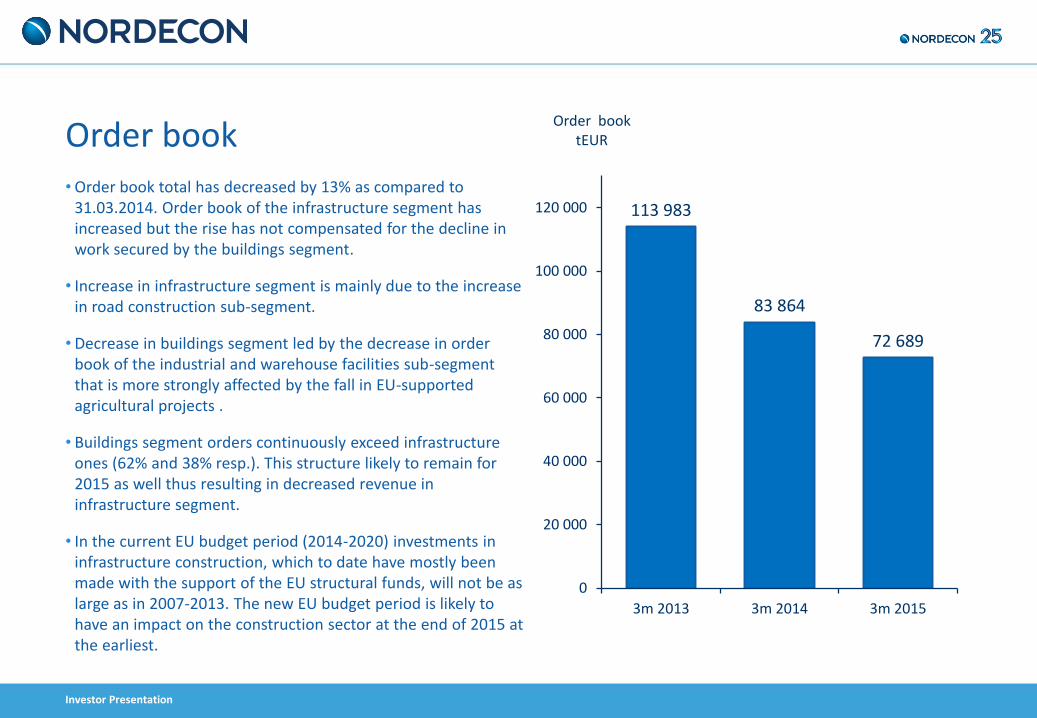
Order book • Order book total has decreased by 13% as compared to
31.03.2014. Order book of the infrastructure segment has increased but the rise has not compensated for the decline in work secured by the buildings segment.
• Increase in infrastructure segment is mainly due to the increase in road construction sub-segment.
• Decrease in buildings segment led by the decrease in order book of the industrial and warehouse facilities sub-segment that is more strongly affected by the fall in EU-supported agricultural projects .
• Buildings segment orders continuously exceed infrastructure ones (62% and 38% resp.). This structure likely to remain for 2015 as well thus resulting in decreased revenue in infrastructure segment.
• In the current EU budget period (2014-2020) investments in infrastructure construction, which to date have mostly been made with the support of the EU structural funds, will not be as large as in 2007-2013. The new EU budget period is likely to have an impact on the construction sector at the end of 2015 at the earliest.
113 983
83 864
72 689
0
20 000
40 000
60 000
80 000
100 000
120 000
3m 2013 3m 2014 3m 2015
Order book tEUR

Investor Presentation
Revenue distribution by segments
• We strive to maintain the revenues of our operating segments (buildings and infrastructure) in balance as this helps disperse risks and provides better opportunities for continuing construction operations also in stressed circumstances where one segment experiences noticeable shrinkage.
• However, finishing of major road construction projects in 2013 and overall decrease of EU backed public investments to infrastructure led to sharp decrease of infrastructure segment revenue.
• Both segments experienced an increase in the first quarter of 2015 – buildings +16% and infrastructure +14%.
• Due to larger share in the revenues, growth is led by the buildings segment which is less affected by the contraction in the public spending.
• Structure likely to remain at this in 2015 as order book similarly structured.
46
80 78
54
20 22
0
10
20
30
40
50
60
70
80
90
100
3m 2013 3m 2014 3m 2015
% of revenue
Buildings Infrastructure

Investor Presentation
• We expect private sector investment activity to remain robust and the contribution of the sub-segment to remain at a similar or higher level throughout the year.
• Competition in the public buildings sub-segment is particularly challenging.
• In the industrial and warehouse facilities sub-segment most of the revenue resulting from EU-supported projects have been replaced by warehouse and logistics centres that do not counterbalance the decrease in agricultural projects.
• Revenues in apartment buildings sub-segment increased and earned mainly from general contracting.
• Magasini 29 own development (www.magasini.ee) phase I is in sale and phase II under construction with sales ongoing (7 of 13 sold). Development project in Tartu (www.tammelinn.ee) where two new buildings with a total of 35 apartments were completed by the end of 2014 has sold 22 units by the period end. II phase construction of Tammelinn with 20 apartments project started.
Revenue distribution – buildings
47 45
58
28 26
11
7 11 19
18 18 12
0
10
20
30
40
50
60
70
80
90
100
3m 2013 3m 2014 3m 2015
% of revenue
Public buildingsApartment buildingsIndustrial and warehouse facilitiesCommercial buildings

Investor Presentation
• We expect that road construction will remain the main revenue source in the infrastructure segment and, similarly to last year, most of the road construction revenue will result from small or medium-sized reconstruction and repair projects.
• Road maintenance revenues remain stable.
• The revenues of the specialist engineering sub-segment may increase through other complex engineering work than hydraulic engineering but relevant volumes are likely to be irregular.
• The decline in EU support continues to have a strong impact on environmental engineering work whose volumes have decreased more rapidly than those of other sub-segments.
• The contribution of utility network construction (other engineering) has increased slightly but contracts that have been secured are small and continuing growth of the sub-segment is unlikely.
Revenue distribution – infrastructure
44 46
79
32
12
15 10
10
1 14
32
5
0
10
20
30
40
50
60
70
80
90
100
3m 2013 3m 2014 3m 2015
% of revenue
Environmental engineering
Specialist engineering (including hydraulic engineering)
Other engineering
Road construction and maintenance

Investor Presentation
Share and shareholders information Index/share 1.01.2015 31.03.2015 +/-%
OMX Tallinn 755.05 862.86 14.28
NCN1T 1.06 EUR 1.06 EUR 0.00
Shareholder Number of
shares Ownership
interest (%) AS Nordic Contractors 16 507 464 50.99
Luksusjaht AS 3 209 346 9.91 ING Luxembourg S.A. 2 007 949 6.20 Rondam AS 936 567 2.89 SEB Pank AS kliendid 727 727 2.25 ASM Investments OÜ 519 600 1.60 Ain Tromp 478 960 1.48 State Street Bank and Trust Omnibus Account A Fund 447 365 1.38 SEB Elu- ja pensionikindlustus AS 262 000 0.81 Genadi Bulatov 250 600 0.77
Largest shareholders of Nordecon AS at 31 March 2015
Number of shareholders
Ownership interest (%)
Shareholders with interest exceeding 5% 3 67.10 Shareholders with interest between 1% and 5% 5 9.61 Shareholders with interest below 1% 1,709 18.29 Holder of own (treasury) shares 1 5.00 Total 1,718 100.00
Shareholder structure of Nordecon AS by ownership interest at 31 March 2015
1
1,05
1,1
750
770
790
810
830
850
870
1.01.2015 1.02.2015 1.03.2015 1.04.2015
OMX Tallinn NCN1T
OM
X TA
LLIN
N
NC
N1
T

Investor Presentation
Nordecon AS Tel: +372 615 4400 www.nordecon.com Pärnu mnt 158/1 Tallinn 11317 Estonia Head of Investor Relations Andri Hõbemägi Tel: +372 615 4400 [email protected]
Contact Information