INVESTOR PRESENTATION | OCTOBER 2019...Our presentation of Adjusted EBITDA, Adjusted Net Income and...
24
INVESTOR PRESENTATION | OCTOBER 2019
Transcript of INVESTOR PRESENTATION | OCTOBER 2019...Our presentation of Adjusted EBITDA, Adjusted Net Income and...

INVESTOR PRESENTATION | OCTOBER 2019
2
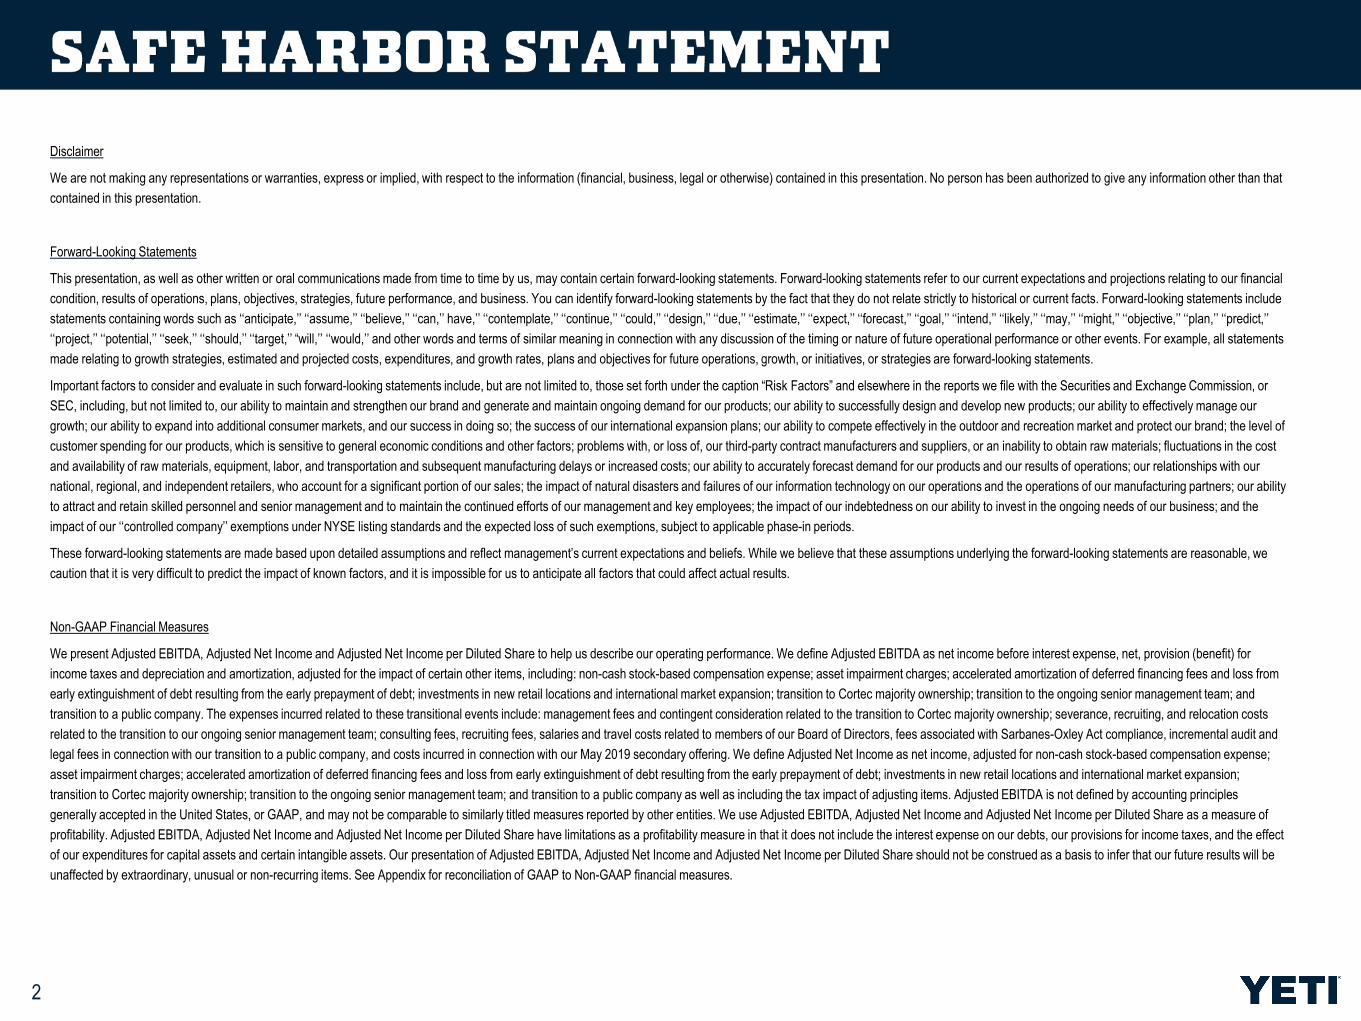
Disclaimer
We are not making any representations or warranties, express or implied, with respect to the information (financial, business, legal or otherwise) contained in this presentation. No person has been authorized to give any information other than that
contained in this presentation.
Forward-Looking Statements
This presentation, as well as other written or oral communications made from time to time by us, may contain certain forward-looking statements. Forward-looking statements refer to our current expectations and projections relating to our financial
condition, results of operations, plans, objectives, strategies, future performance, and business. You can identify forward-looking statements by the fact that they do not relate strictly to historical or current facts. Forward-looking statements include
statements containing words such as ‘‘anticipate,’’ ‘‘assume,’’ ‘‘believe,’’ ‘‘can,’’ have,’’ ‘‘contemplate,’’ ‘‘continue,’’ ‘‘could,’’ ‘‘design,’’ ‘‘due,’’ ‘‘estimate,’’ ‘‘expect,’’ ‘‘forecast,’’ ‘‘goal,’’ ‘‘intend,’’ ‘‘likely,’’ ‘‘may,’’ ‘‘might,’’ ‘‘objective,’’ ‘‘plan,’’ ‘‘predict,’’
‘‘project,’’ ‘‘potential,’’ ‘‘seek,’’ ‘‘should,’’ ‘‘target,’’ “will,’’ ‘‘would,’’ and other words and terms of similar meaning in connection with any discussion of the timing or nature of future operational performance or other events. For example, all statements
made relating to growth strategies, estimated and projected costs, expenditures, and growth rates, plans and objectives for future operations, growth, or initiatives, or strategies are forward-looking statements.
Important factors to consider and evaluate in such forward-looking statements include, but are not limited to, those set forth under the caption “Risk Factors” and elsewhere in the reports we file with the Securities and Exchange Commission, or
SEC, including, but not limited to, our ability to maintain and strengthen our brand and generate and maintain ongoing demand for our products; our ability to successfully design and develop new products; our ability to effectively manage our
growth; our ability to expand into additional consumer markets, and our success in doing so; the success of our international expansion plans; our ability to compete effectively in the outdoor and recreation market and protect our brand; the level of
customer spending for our products, which is sensitive to general economic conditions and other factors; problems with, or loss of, our third-party contract manufacturers and suppliers, or an inability to obtain raw materials; fluctuations in the cost
and availability of raw materials, equipment, labor, and transportation and subsequent manufacturing delays or increased costs; our ability to accurately forecast demand for our products and our results of operations; our relationships with our
national, regional, and independent retailers, who account for a significant portion of our sales; the impact of natural disasters and failures of our information technology on our operations and the operations of our manufacturing partners; our ability
to attract and retain skilled personnel and senior management and to maintain the continued efforts of our management and key employees; the impact of our indebtedness on our ability to invest in the ongoing needs of our business; and the
impact of our ‘‘controlled company’’ exemptions under NYSE listing standards and the expected loss of such exemptions, subject to applicable phase-in periods.
These forward-looking statements are made based upon detailed assumptions and reflect management’s current expectations and beliefs. While we believe that these assumptions underlying the forward-looking statements are reasonable, we
caution that it is very difficult to predict the impact of known factors, and it is impossible for us to anticipate all factors that could affect actual results.
Non-GAAP Financial Measures
We present Adjusted EBITDA, Adjusted Net Income and Adjusted Net Income per Diluted Share to help us describe our operating performance. We define Adjusted EBITDA as net income before interest expense, net, provision (benefit) for
income taxes and depreciation and amortization, adjusted for the impact of certain other items, including: non-cash stock-based compensation expense; asset impairment charges; accelerated amortization of deferred financing fees and loss from
early extinguishment of debt resulting from the early prepayment of debt; investments in new retail locations and international market expansion; transition to Cortec majority ownership; transition to the ongoing senior management team; and
transition to a public company. The expenses incurred related to these transitional events include: management fees and contingent consideration related to the transition to Cortec majority ownership; severance, recruiting, and relocation costs
related to the transition to our ongoing senior management team; consulting fees, recruiting fees, salaries and travel costs related to members of our Board of Directors, fees associated with Sarbanes-Oxley Act compliance, incremental audit and
legal fees in connection with our transition to a public company, and costs incurred in connection with our May 2019 secondary offering. We define Adjusted Net Income as net income, adjusted for non-cash stock-based compensation expense;
asset impairment charges; accelerated amortization of deferred financing fees and loss from early extinguishment of debt resulting from the early prepayment of debt; investments in new retail locations and international market expansion;
transition to Cortec majority ownership; transition to the ongoing senior management team; and transition to a public company as well as including the tax impact of adjusting items. Adjusted EBITDA is not defined by accounting principles
generally accepted in the United States, or GAAP, and may not be comparable to similarly titled measures reported by other entities. We use Adjusted EBITDA, Adjusted Net Income and Adjusted Net Income per Diluted Share as a measure of
profitability. Adjusted EBITDA, Adjusted Net Income and Adjusted Net Income per Diluted Share have limitations as a profitability measure in that it does not include the interest expense on our debts, our provisions for income taxes, and the effect
of our expenditures for capital assets and certain intangible assets. Our presentation of Adjusted EBITDA, Adjusted Net Income and Adjusted Net Income per Diluted Share should not be construed as a basis to infer that our future results will be
unaffected by extraordinary, unusual or non-recurring items. See Appendix for reconciliation of GAAP to Non-GAAP financial measures.
3
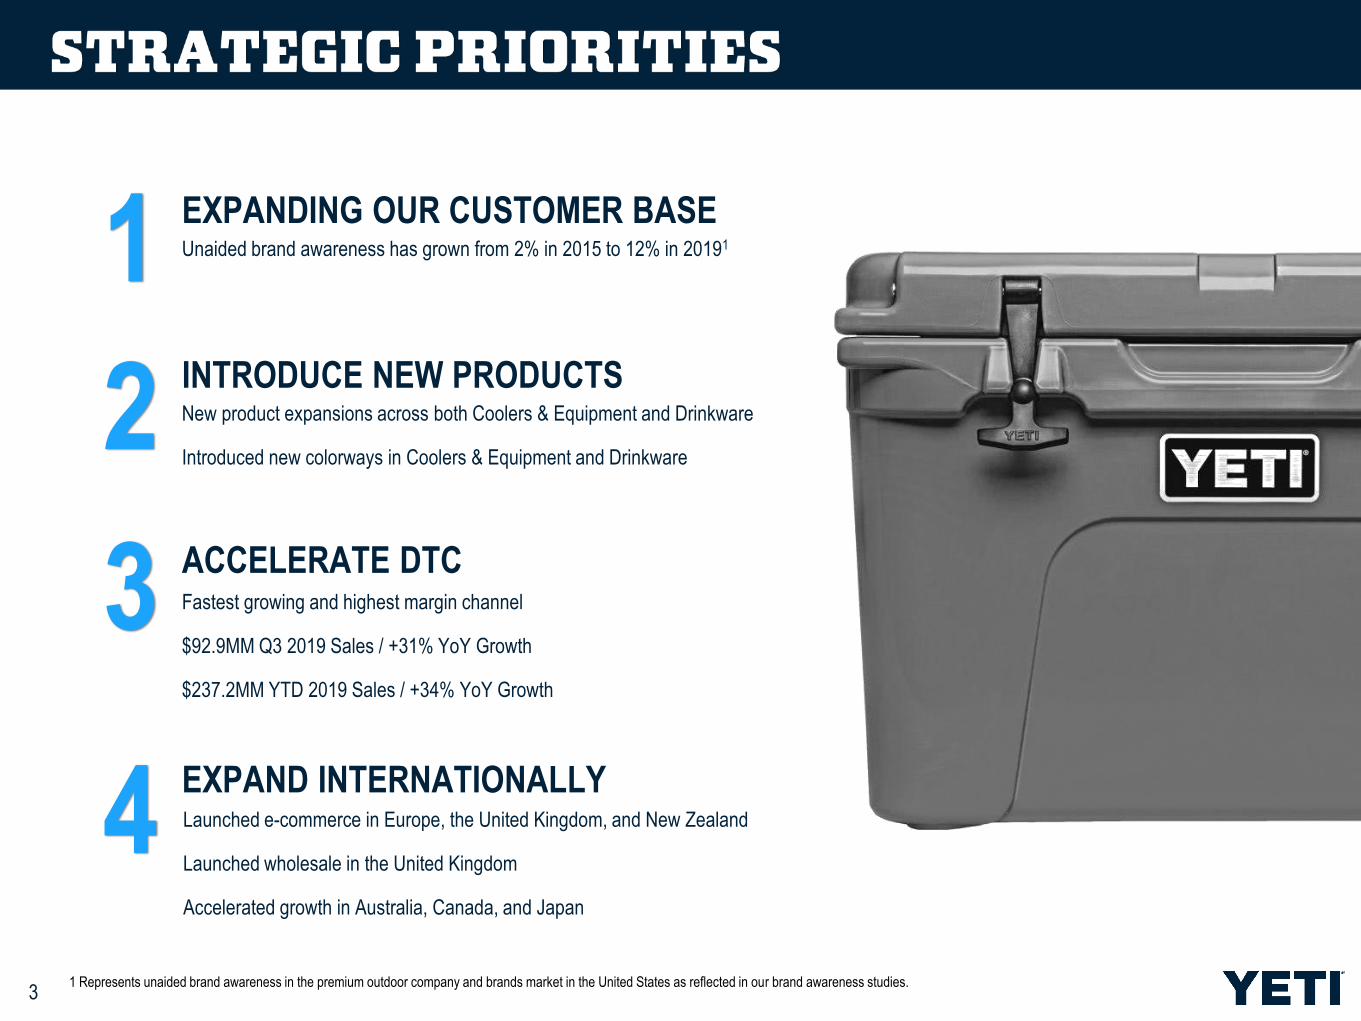
1New product expansions across both Coolers & Equipment and Drinkware
Introduced new colorways in Coolers & Equipment and Drinkware2
Fastest growing and highest margin channel
$92.9MM Q3 2019 Sales / +31% YoY Growth
$237.2MM YTD 2019 Sales / +34% YoY Growth
3
Launched e-commerce in Europe, the United Kingdom, and New Zealand
Launched wholesale in the United Kingdom
Accelerated growth in Australia, Canada, and Japan
4
EXPANDING OUR CUSTOMER BASE
INTRODUCE NEW PRODUCTS
ACCELERATE DTC
EXPAND INTERNATIONALLY
1 Represents unaided brand awareness in the premium outdoor company and brands market in the United States as reflected in our brand awareness studies.
Unaided brand awareness has grown from 2% in 2015 to 12% in 20191
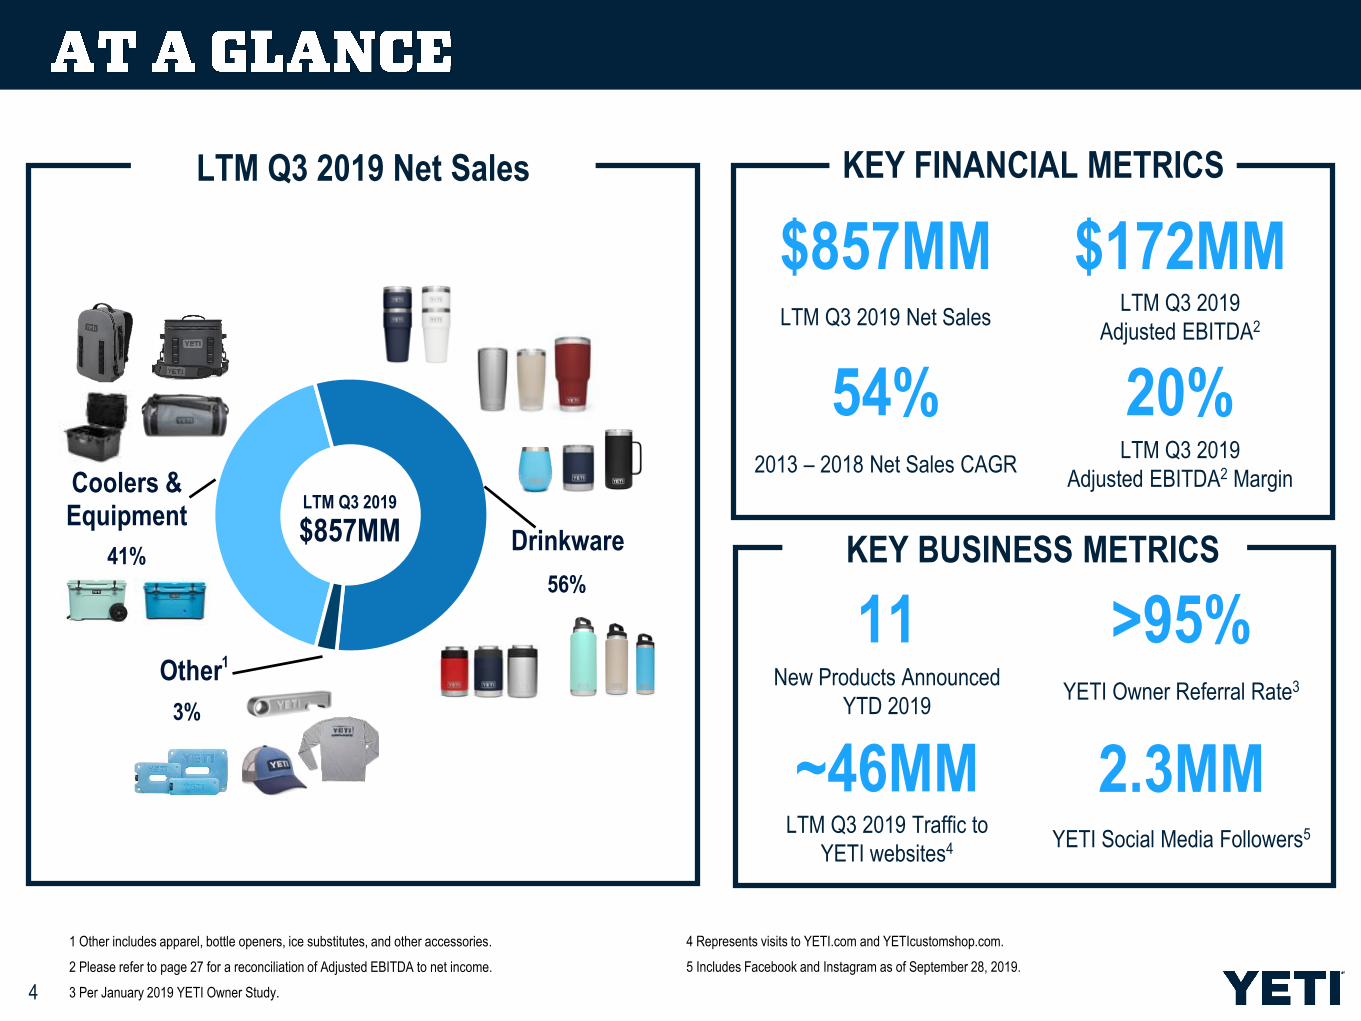
Coolers & Equipment
41% Drinkware56%
Other 3%
4
$857MMLTM Q3 2019
1
11New Products Announced
YTD 2019
>95%YETI Owner Referral Rate3
LTM Q3 2019 Traffic to
YETI websites4
2.3MMYETI Social Media Followers5
KEY BUSINESS METRICS
~46MM
$857MMLTM Q3 2019 Net Sales
$172MMLTM Q3 2019
Adjusted EBITDA2
2013 – 2018 Net Sales CAGR
20%LTM Q3 2019
Adjusted EBITDA2 Margin
54%
KEY FINANCIAL METRICS
1 Other includes apparel, bottle openers, ice substitutes, and other accessories.
2 Please refer to page 27 for a reconciliation of Adjusted EBITDA to net income.
3 Per January 2019 YETI Owner Study.
4 Represents visits to YETI.com and YETIcustomshop.com.
5 Includes Facebook and Instagram as of September 28, 2019.
LTM Q3 2019 Net Sales
41%
3%
56%

5
6
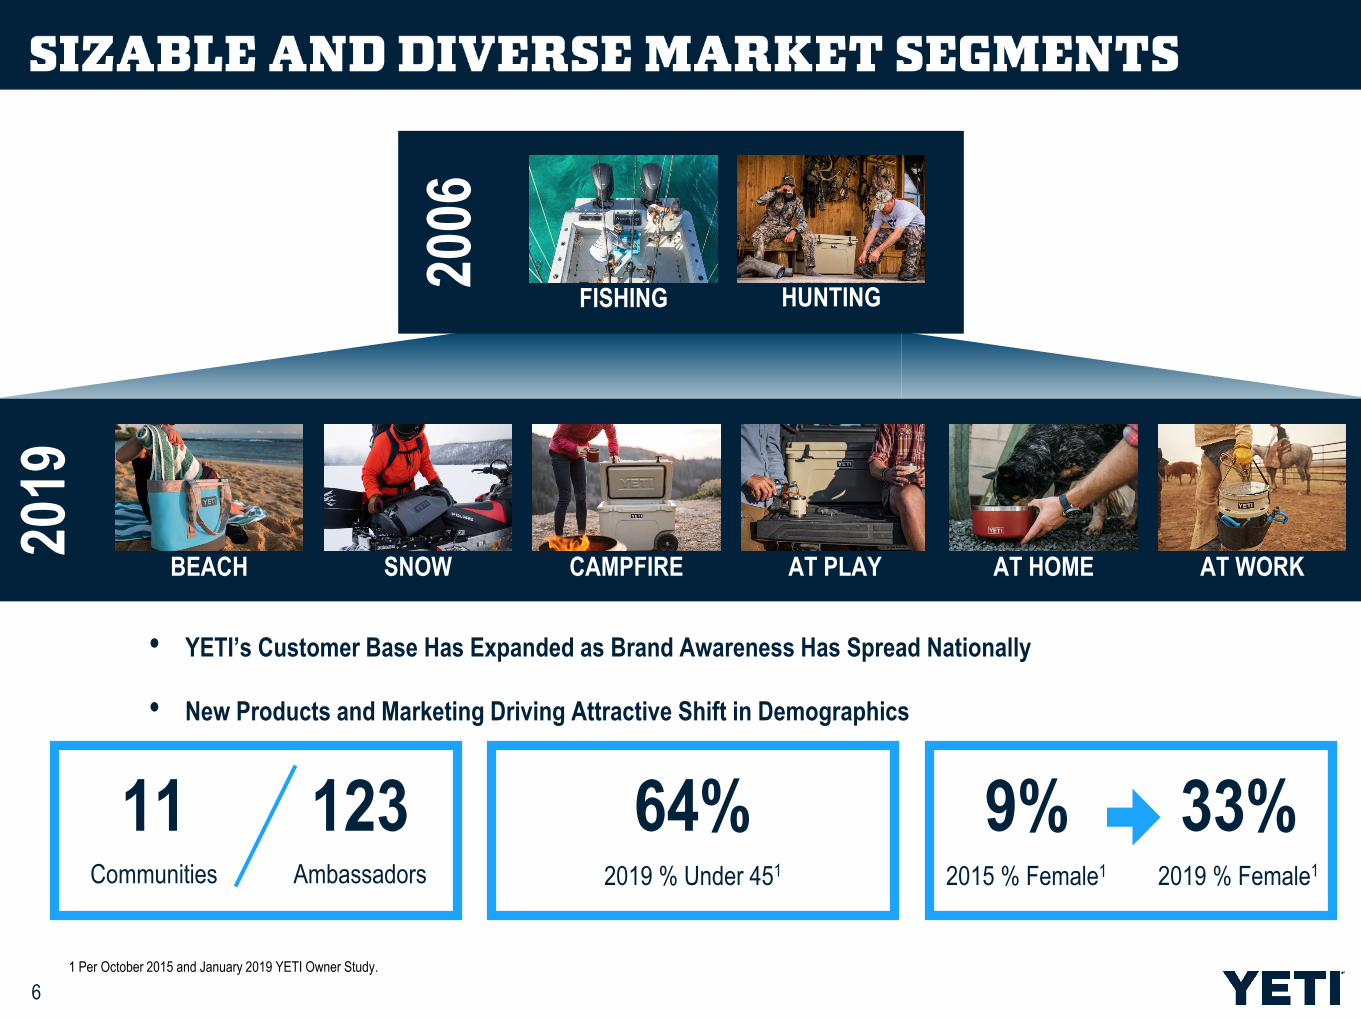
2006
• YETI’s Customer Base Has Expanded as Brand Awareness Has Spread Nationally
• New Products and Marketing Driving Attractive Shift in Demographics
2019
FISHING HUNTING
BEACH SNOW CAMPFIRE AT PLAY AT HOME AT WORK
1 Per October 2015 and January 2019 YETI Owner Study.
9%2015 % Female1
33%2019 % Female1
123Ambassadors
11Communities
64%2019 % Under 451
7
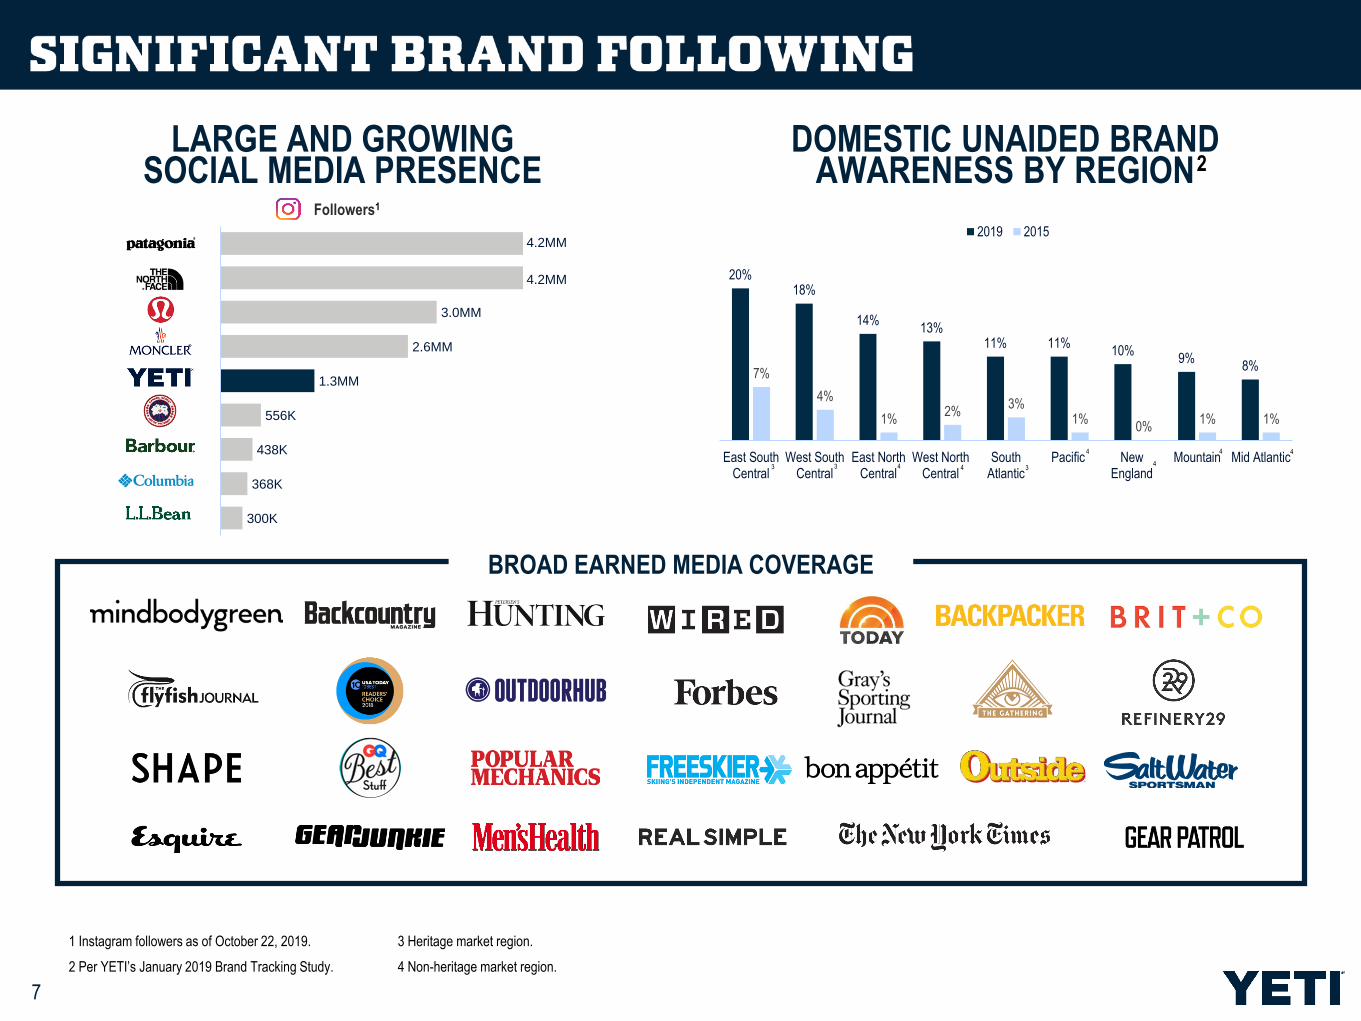
LARGE AND GROWING SOCIAL MEDIA PRESENCE
1 Instagram followers as of October 22, 2019.
2 Per YETI’s January 2019 Brand Tracking Study.
20%18%
14%13%
11% 11%10%
9%8%
7%
4%
1%2%
3%1%
0%1% 1%
East SouthCentral
West SouthCentral
East NorthCentral
West NorthCentral
SouthAtlantic
Pacific NewEngland
Mountain Mid Atlantic
2019 2015
3 3 344
4
4
4 4
DOMESTIC UNAIDED BRAND AWARENESS BY REGION
Followers1
2
3 Heritage market region.
4 Non-heritage market region.
BROAD EARNED MEDIA COVERAGE
300K
368K
438K
556K
1.3MM
2.6MM
3.0MM
4.2MM
4.2MM
8
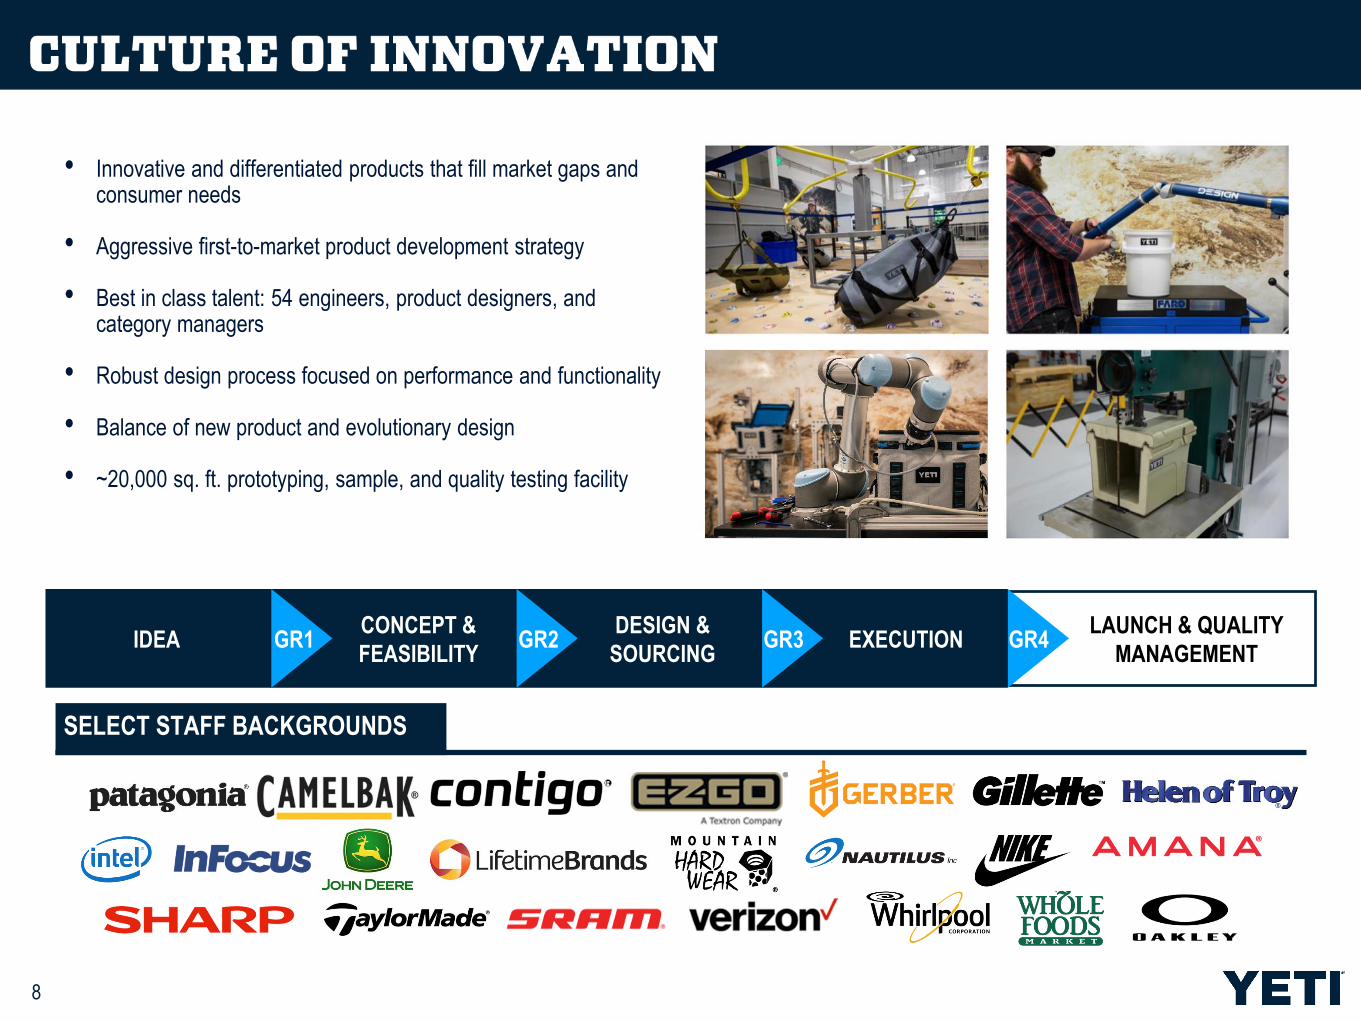
• Innovative and differentiated products that fill market gaps and consumer needs
• Aggressive first-to-market product development strategy
• Best in class talent: 54 engineers, product designers, and category managers
• Robust design process focused on performance and functionality
• Balance of new product and evolutionary design
• ~20,000 sq. ft. prototyping, sample, and quality testing facility
IDEA EXECUTIONCONCEPT &
FEASIBILITY
DESIGN &
SOURCING
LAUNCH & QUALITY
MANAGEMENTGR1 GR2 GR3 GR4
SELECT STAFF BACKGROUNDS
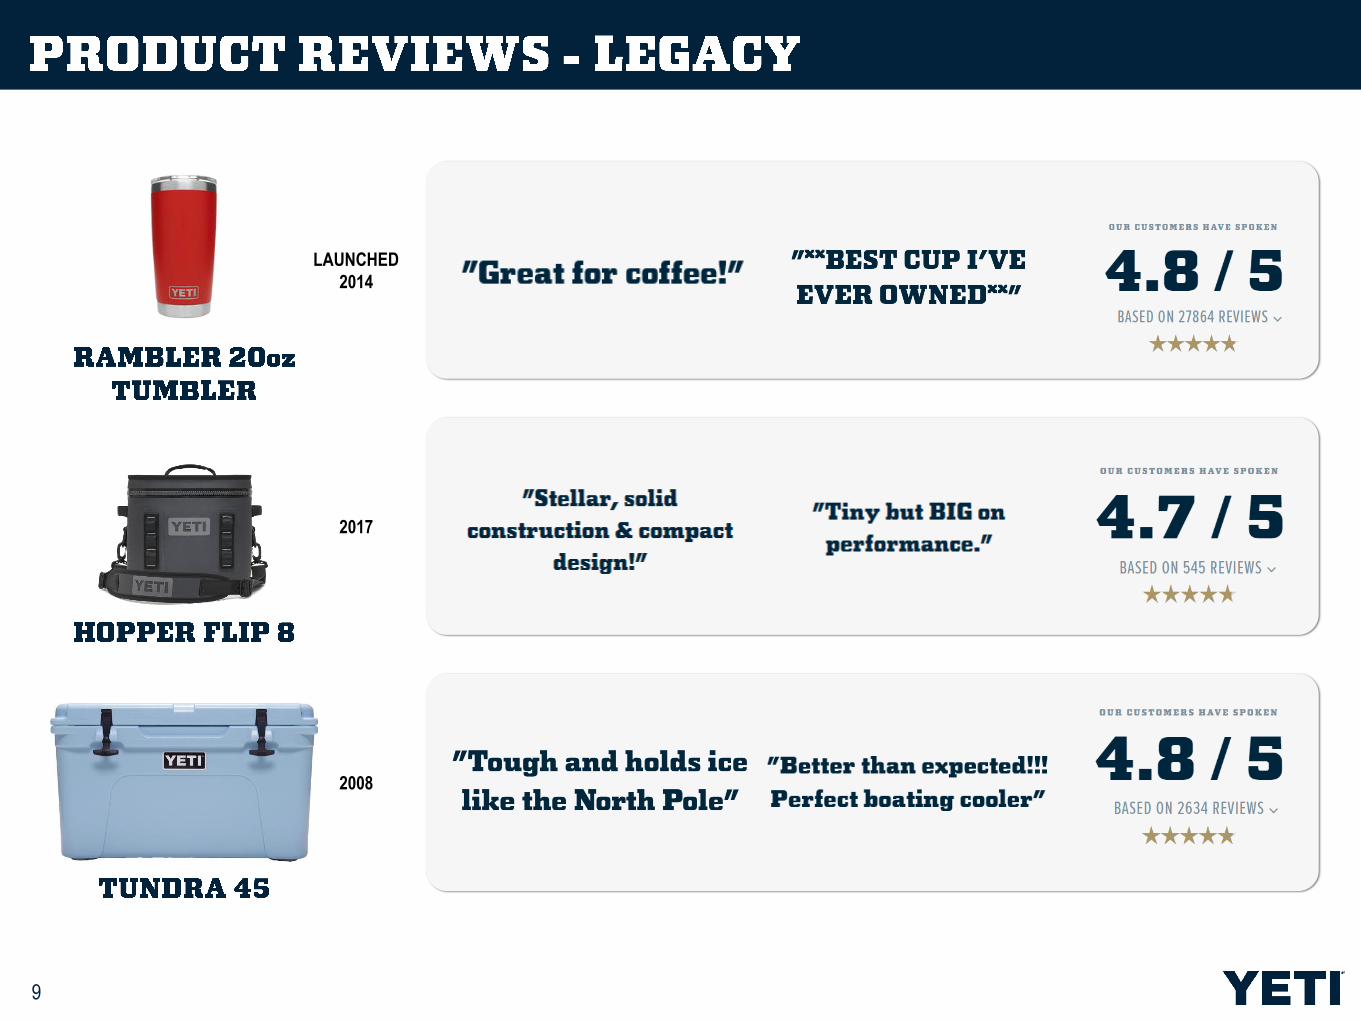
9
LAUNCHED
2014
2017
2008
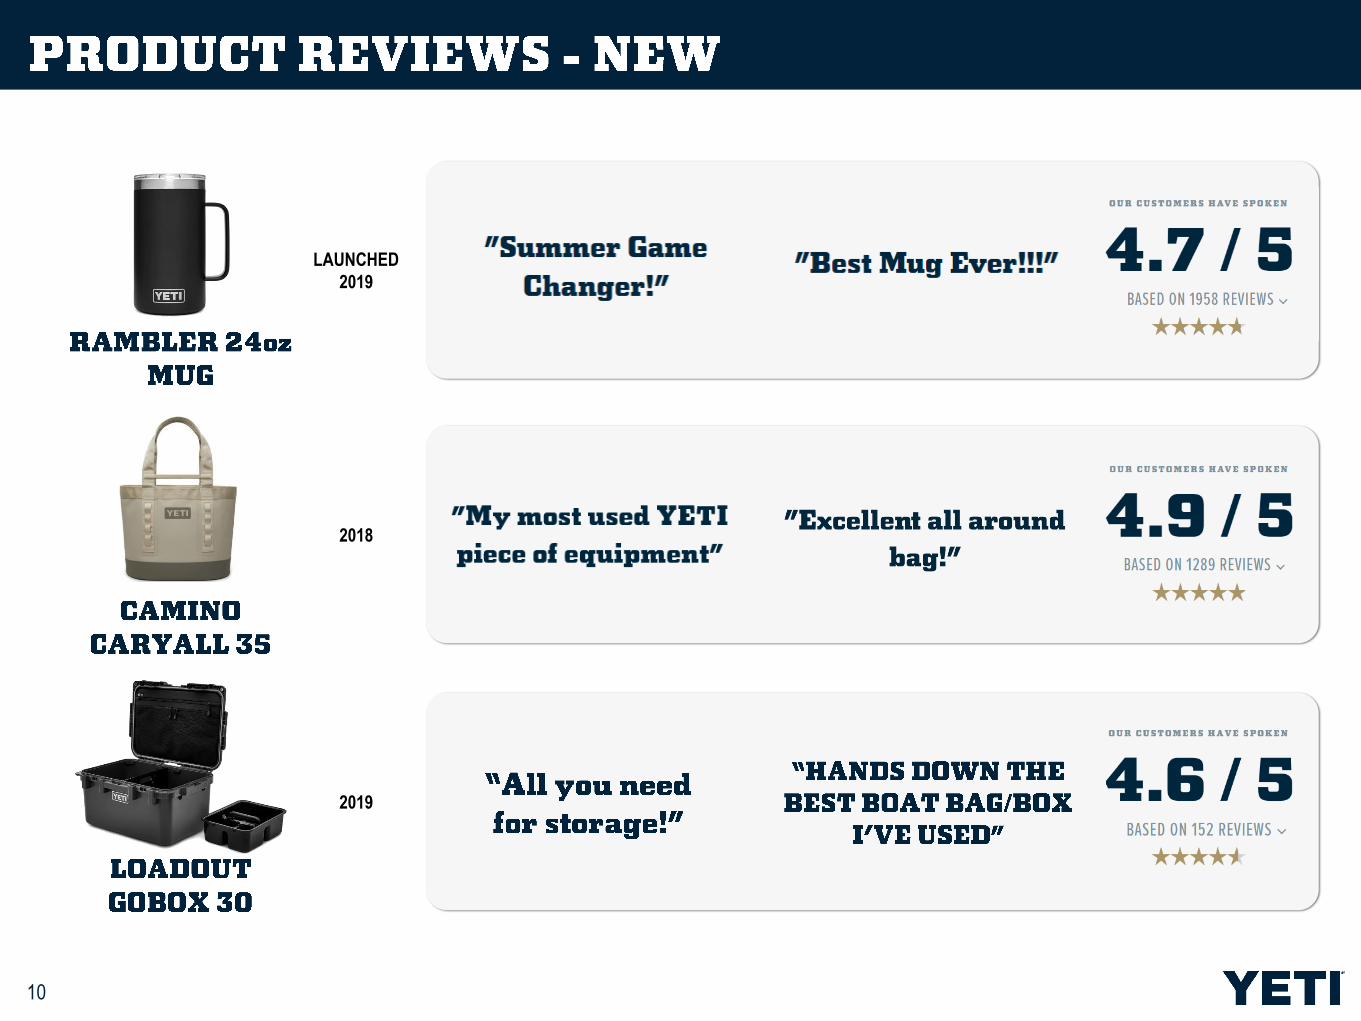
10
LAUNCHED
2019
2019
2018
1H
2017
2H
2017
1H
2018
2H
2018
1H
2019
2H
2019
Co
ole
rs &
Eq
uip
men
t
Hard
Cooler
Soft
Cooler
Bags
Cargo
Outdoor Living
and Pet
Dri
nkw
are
Rambler®
Oth
er
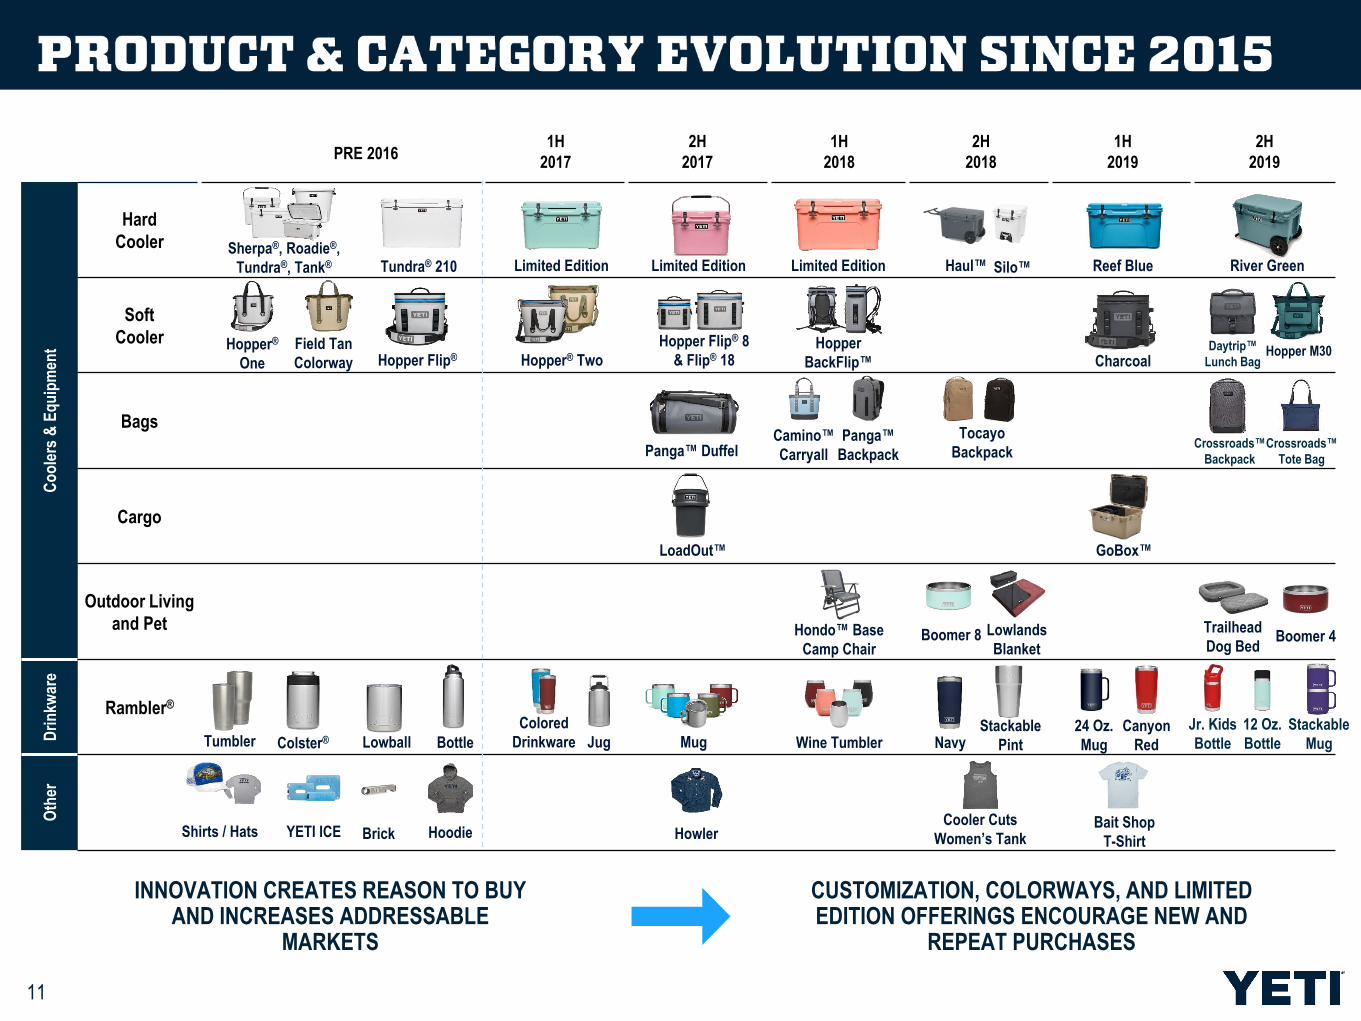
11
INNOVATION CREATES REASON TO BUYAND INCREASES ADDRESSABLE
MARKETS
CUSTOMIZATION, COLORWAYS, AND LIMITEDEDITION OFFERINGS ENCOURAGE NEW AND
REPEAT PURCHASES
Tumbler Bottle Wine TumblerColster® Lowball Mug
Panga™ DuffelCamino™
Carryall
Hopper Flip® Hopper® TwoHopper
BackFlip™
Sherpa®, Roadie®,
Tundra®, Tank®
Hopper®
One
Tundra® 210
Field Tan
Colorway
Jug
Colored
Drinkware
LoadOut™
Panga™
Backpack
Haul™ Silo™Limited Edition
Navy
Hopper Flip® 8
& Flip® 18
Tocayo
Backpack
Stackable
Pint
Lowlands
Blanket
Hondo™ Base
Camp Chair
HowlerShirts / Hats YETI ICE Brick
24 Oz.
Mug
Hoodie
Reef Blue
Canyon
Red
Charcoal
Limited EditionLimited Edition
GoBox™
Bait Shop
T-Shirt
Cooler Cuts
Women’s Tank
Daytrip™
Lunch Bag
Jr. Kids
Bottle
Hopper M30
Trailhead
Dog Bed
Stackable
Mug
PRE 2016
Boomer 4
River Green
Crossroads™
Backpack
Crossroads™
Tote Bag
Boomer 8
12 Oz.
Bottle

12
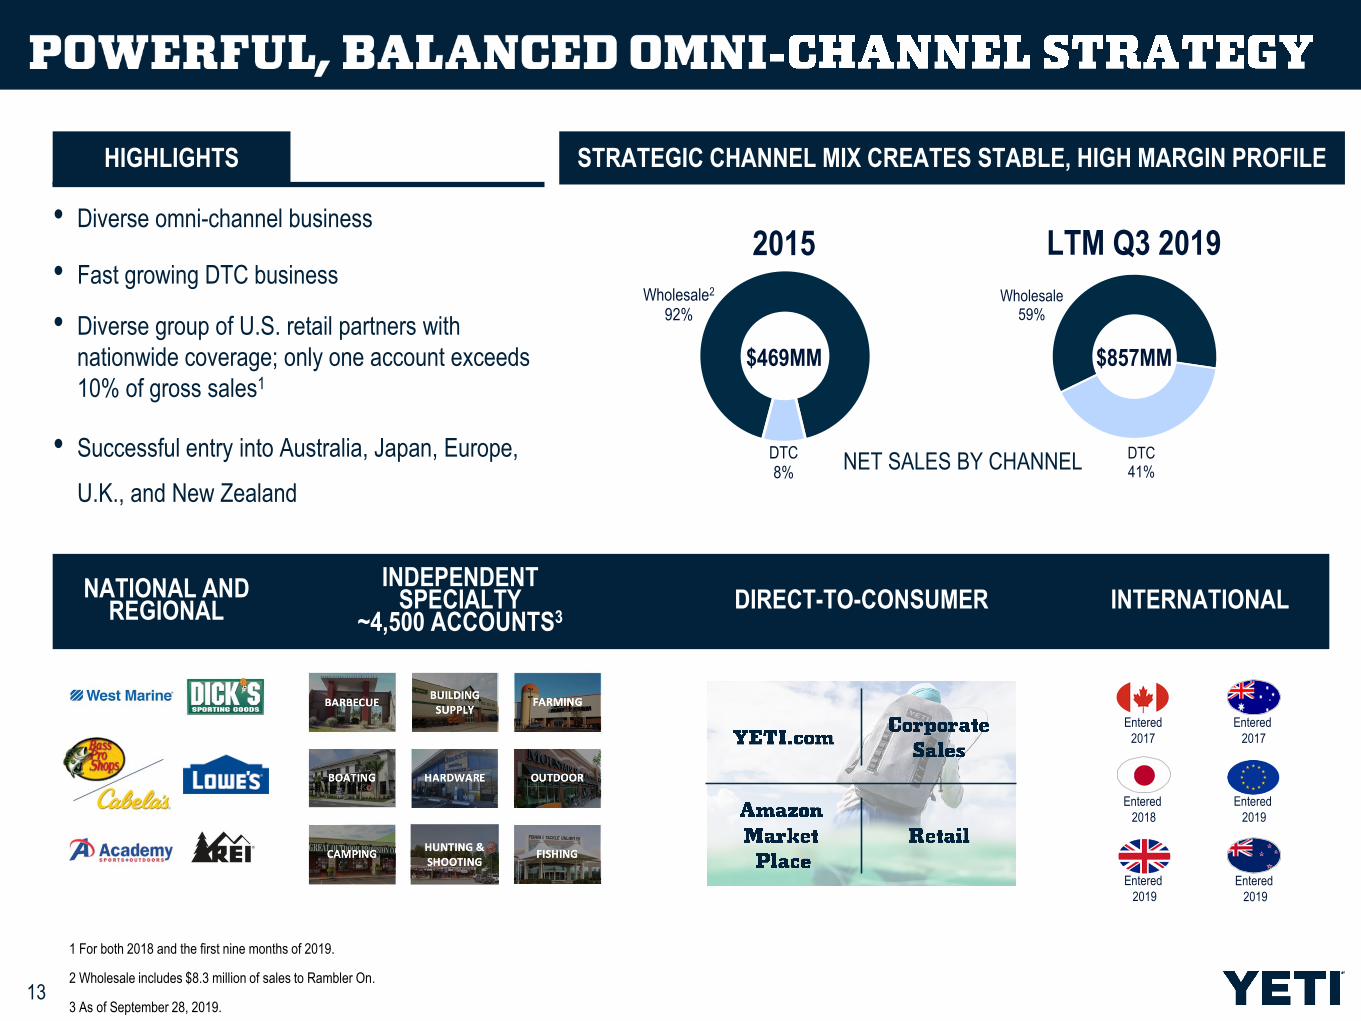
Wholesale59%
DTC 41%
13
HIGHLIGHTS
Wholesale2
92%
DTC 8%
• Diverse omni-channel business
• Fast growing DTC business
• Diverse group of U.S. retail partners with
nationwide coverage; only one account exceeds
10% of gross sales1
• Successful entry into Australia, Japan, Europe,
U.K., and New Zealand
NET SALES BY CHANNEL
NATIONAL AND REGIONAL DIRECT-TO-CONSUMER INTERNATIONAL
STRATEGIC CHANNEL MIX CREATES STABLE, HIGH MARGIN PROFILE
INDEPENDENT SPECIALTY
~4,500 ACCOUNTS3
1 For both 2018 and the first nine months of 2019.
2 Wholesale includes $8.3 million of sales to Rambler On.
3 As of September 28, 2019.
2015
$469MM
LTM Q3 2019
$857MM
Entered
2017
Entered
2017
Entered
2018
Entered
2019
Entered
2019
Entered
2019

14
YETI.COM
YETI AUTHORIZEDCORPORATE SALES
RETAIL
15
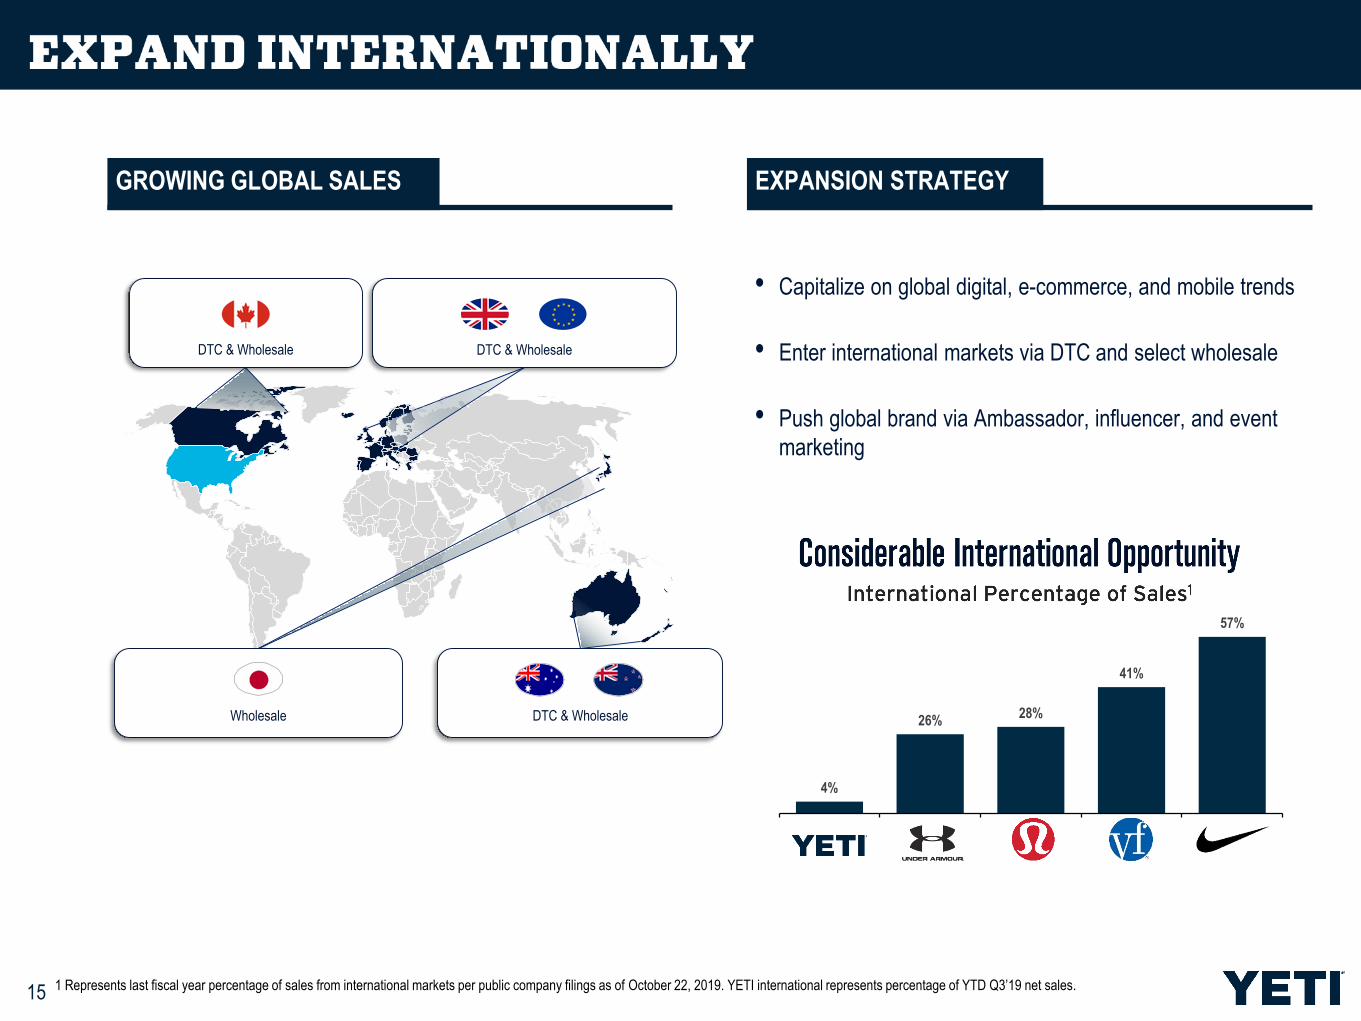
• Capitalize on global digital, e-commerce, and mobile trends
• Enter international markets via DTC and select wholesale
• Push global brand via Ambassador, influencer, and event
marketing
EXPANSION STRATEGYGROWING GLOBAL SALES
DTC & Wholesale DTC & Wholesale
Wholesale
1 Represents last fiscal year percentage of sales from international markets per public company filings as of October 22, 2019. YETI international represents percentage of YTD Q3’19 net sales.
4%
26% 28%
41%
57%
DTC & Wholesale
16
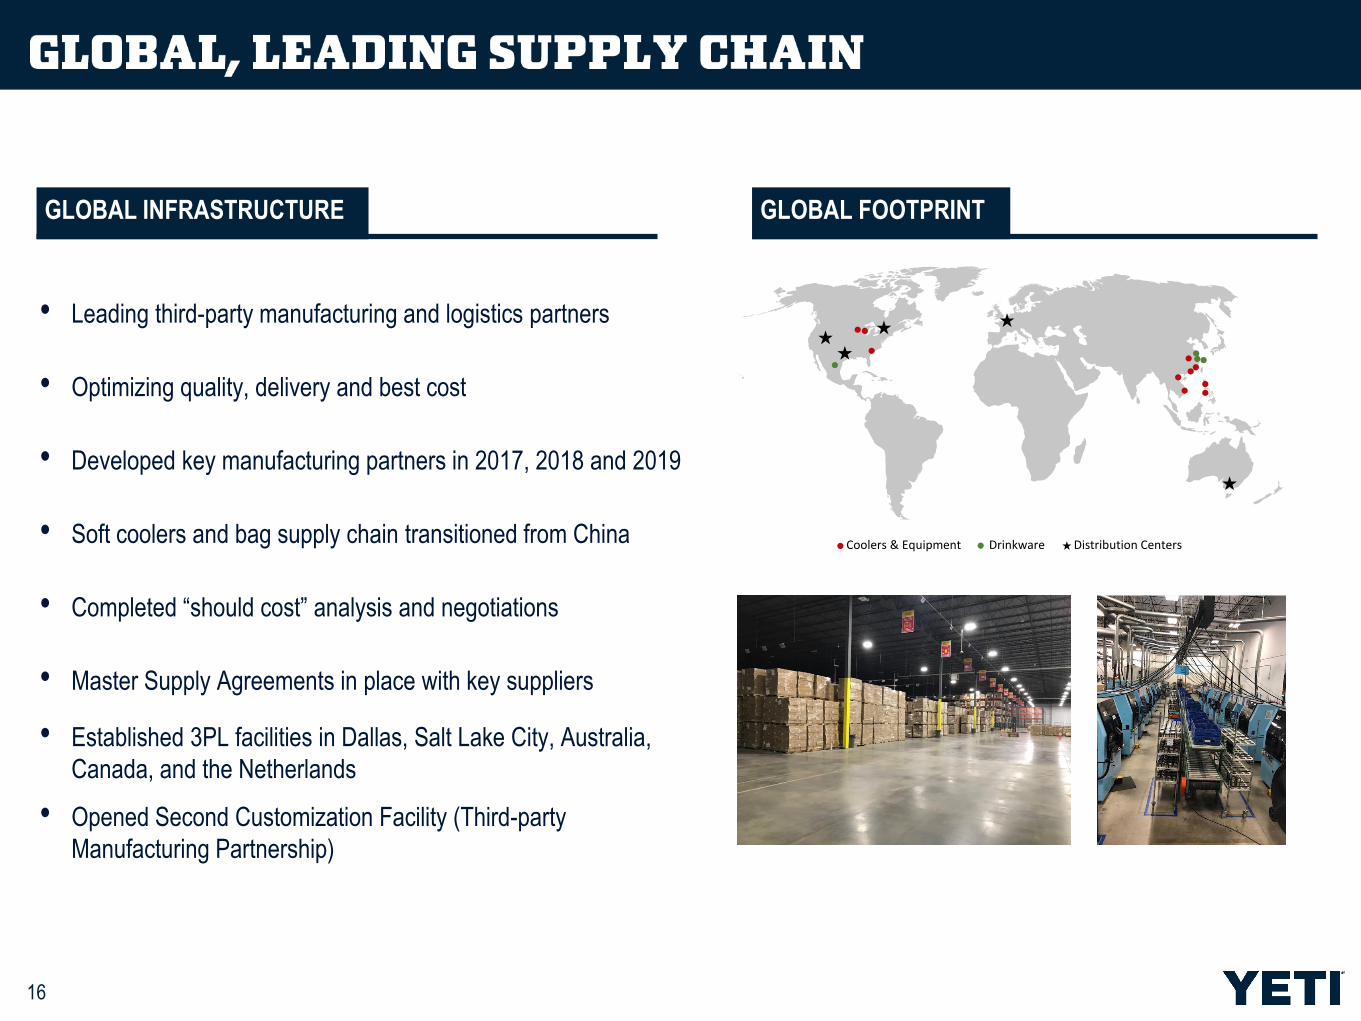
• Leading third-party manufacturing and logistics partners
• Optimizing quality, delivery and best cost
• Developed key manufacturing partners in 2017, 2018 and 2019
• Soft coolers and bag supply chain transitioned from China
• Completed “should cost” analysis and negotiations
• Master Supply Agreements in place with key suppliers
• Established 3PL facilities in Dallas, Salt Lake City, Australia,
Canada, and the Netherlands
• Opened Second Customization Facility (Third-party
Manufacturing Partnership)
GLOBAL INFRASTRUCTURE GLOBAL FOOTPRINT
ll Distribution CentersDrinkwareCoolers & Equipment
l
lll
ll
l
l
ll
l
l l
l
1218818_1.WOR [NY008WXC]

17
18
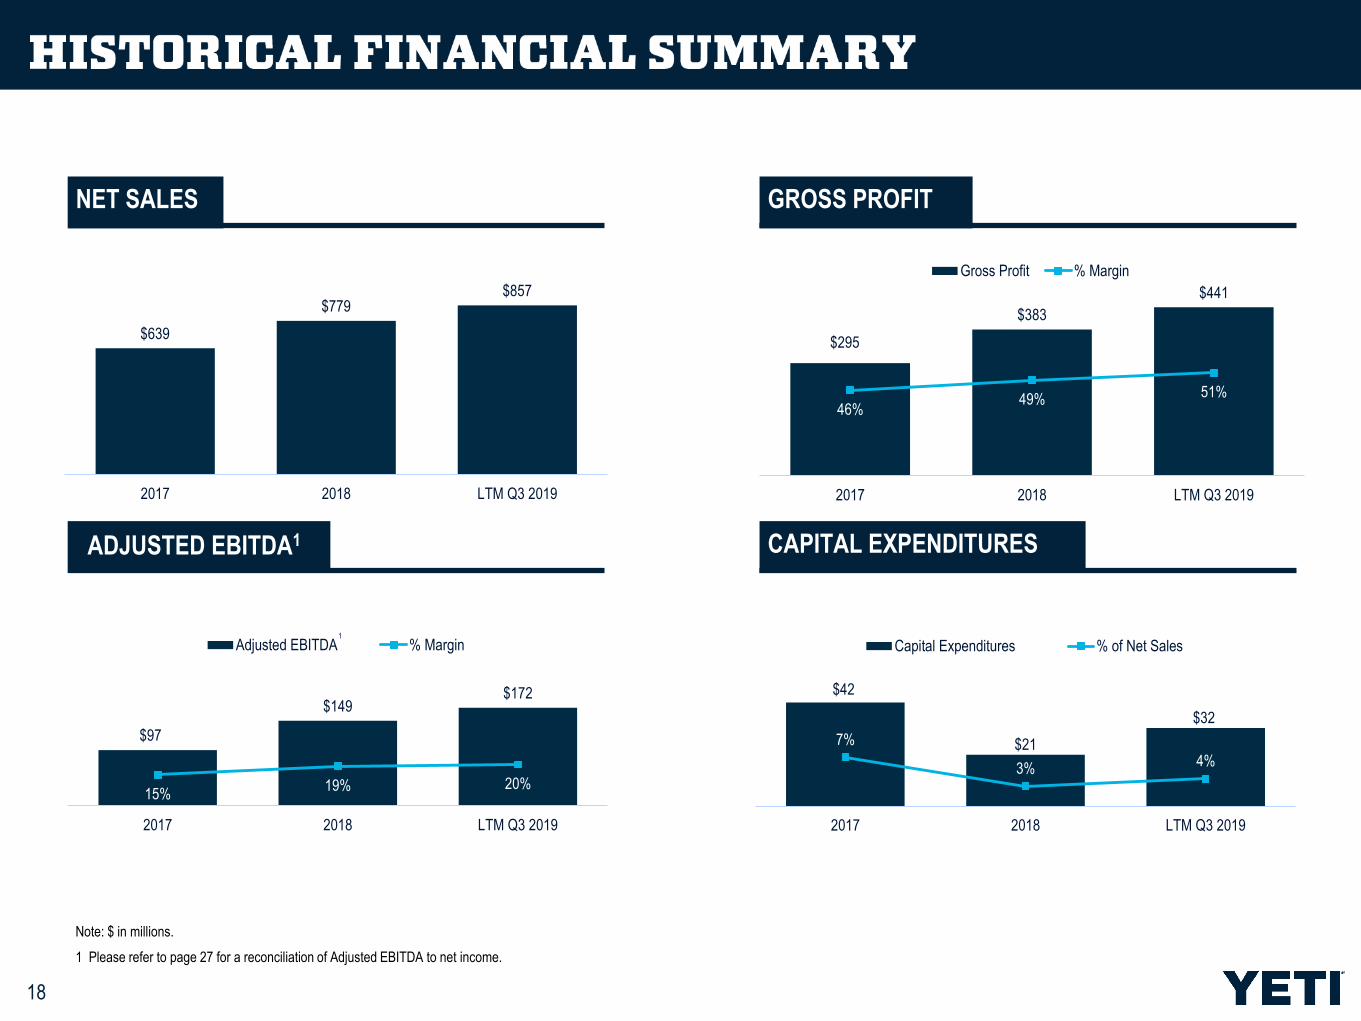
Note: $ in millions.
1 Please refer to page 27 for a reconciliation of Adjusted EBITDA to net income.
NET SALES GROSS PROFIT
CAPITAL EXPENDITURES
$639
$779$857
2017 2018 LTM Q3 2019
$295
$383
$441
46%49% 51%
2017 2018 LTM Q3 2019
Gross Profit % Margin
$97
$149$172
15%19% 20%
2017 2018 LTM Q3 2019
Adjusted EBITDA % Margin1
$42
$21
$32
7%
3%4%
2017 2018 LTM Q3 2019
Capital Expenditures % of Net Sales
ADJUSTED EBITDA1
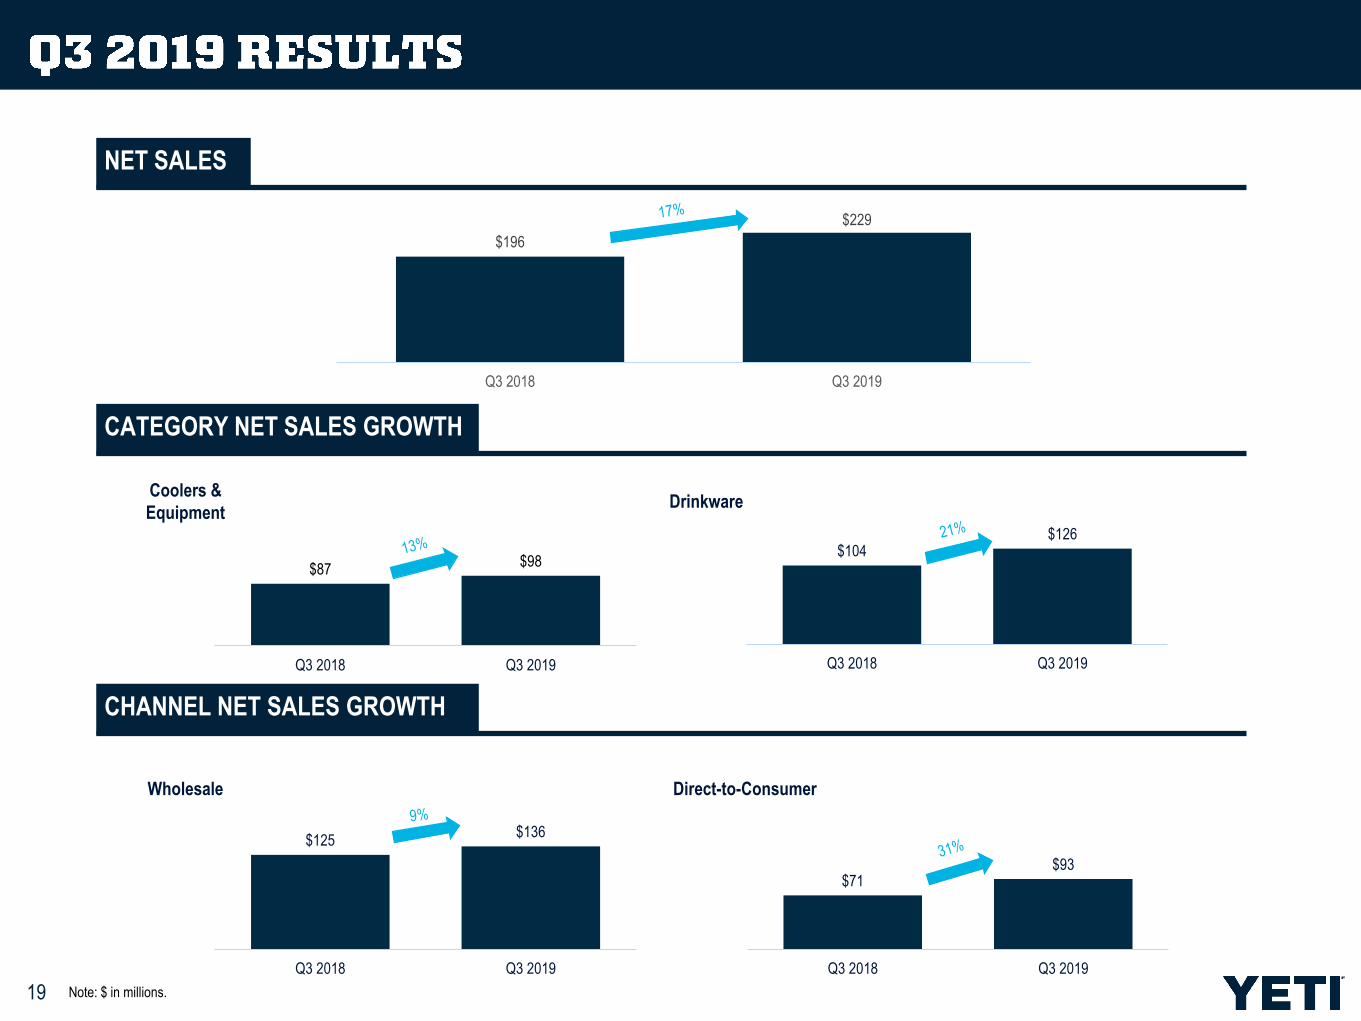
$104$126
Q3 2018 Q3 2019
$196
$229
Q3 2018 Q3 2019
19 Note: $ in millions.
NET SALES
CATEGORY NET SALES GROWTH
CHANNEL NET SALES GROWTH
$87$98
Q3 2018 Q3 2019
Coolers &
EquipmentDrinkware
$125$136
Q3 2018 Q3 2019
$71 $93
Q3 2018 Q3 2019
Wholesale Direct-to-Consumer
20
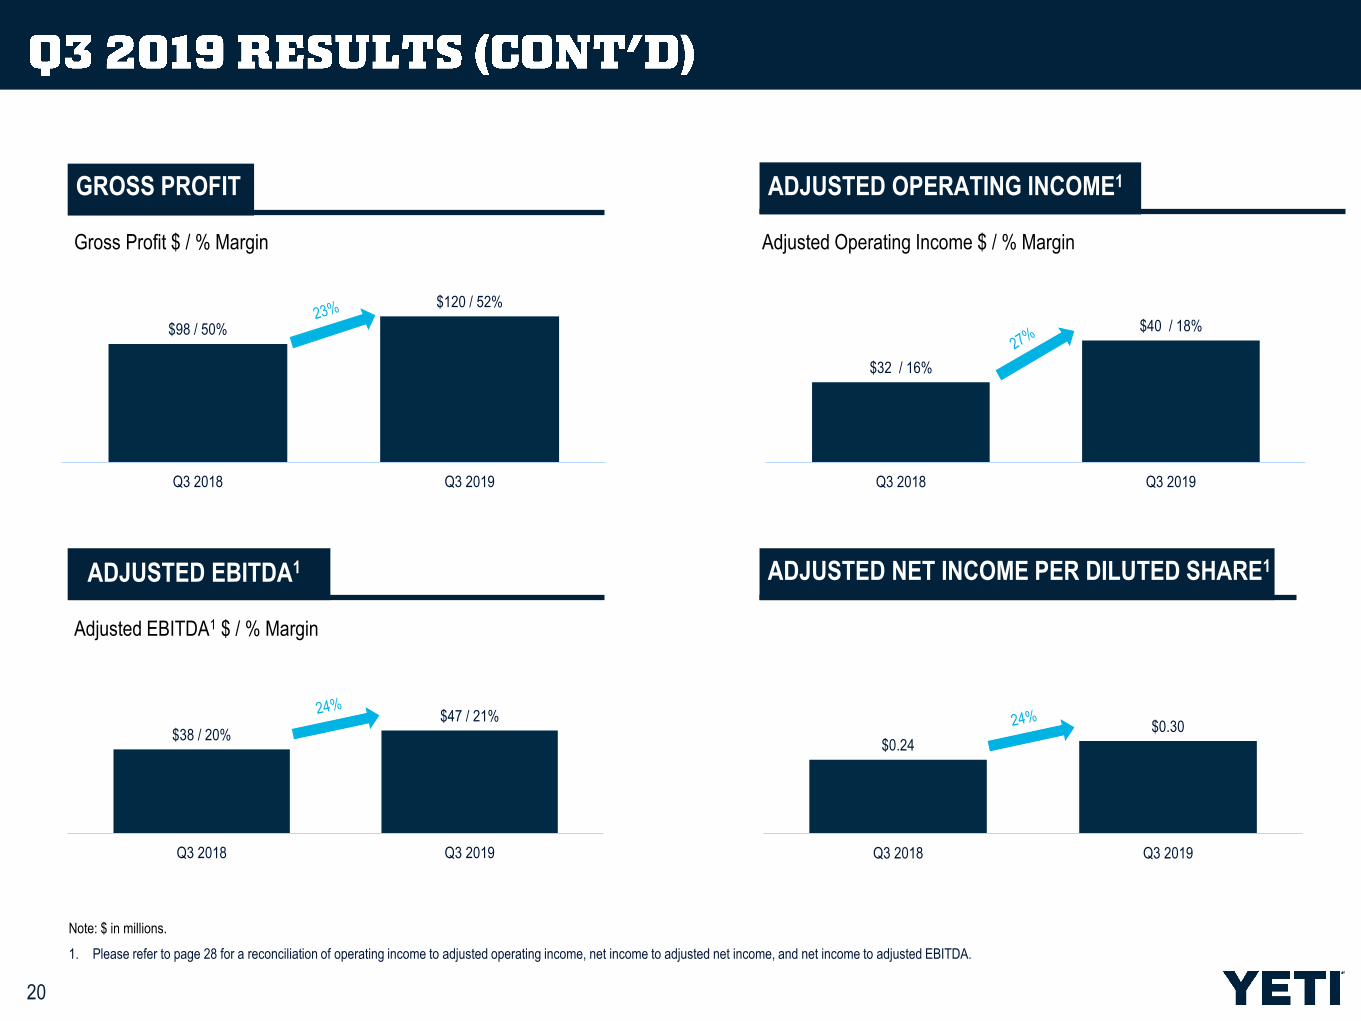
Note: $ in millions.
1. Please refer to page 28 for a reconciliation of operating income to adjusted operating income, net income to adjusted net income, and net income to adjusted EBITDA.
GROSS PROFIT
ADJUSTED NET INCOME PER DILUTED SHARE1ADJUSTED EBITDA1
$0.24 $0.30
Q3 2018 Q3 2019
$38 / 20%
$47 / 21%
Q3 2018 Q3 2019
$98 / 50%
$120 / 52%
Q3 2018 Q3 2019
$32 / 16%
$40 / 18%
Q3 2018 Q3 2019
Gross Profit $ / % Margin
Adjusted EBITDA1 $ / % Margin
Adjusted Operating Income $ / % Margin
ADJUSTED OPERATING INCOME1
21
22
1
2
3
2,5
2,4
2,6
2,7
2
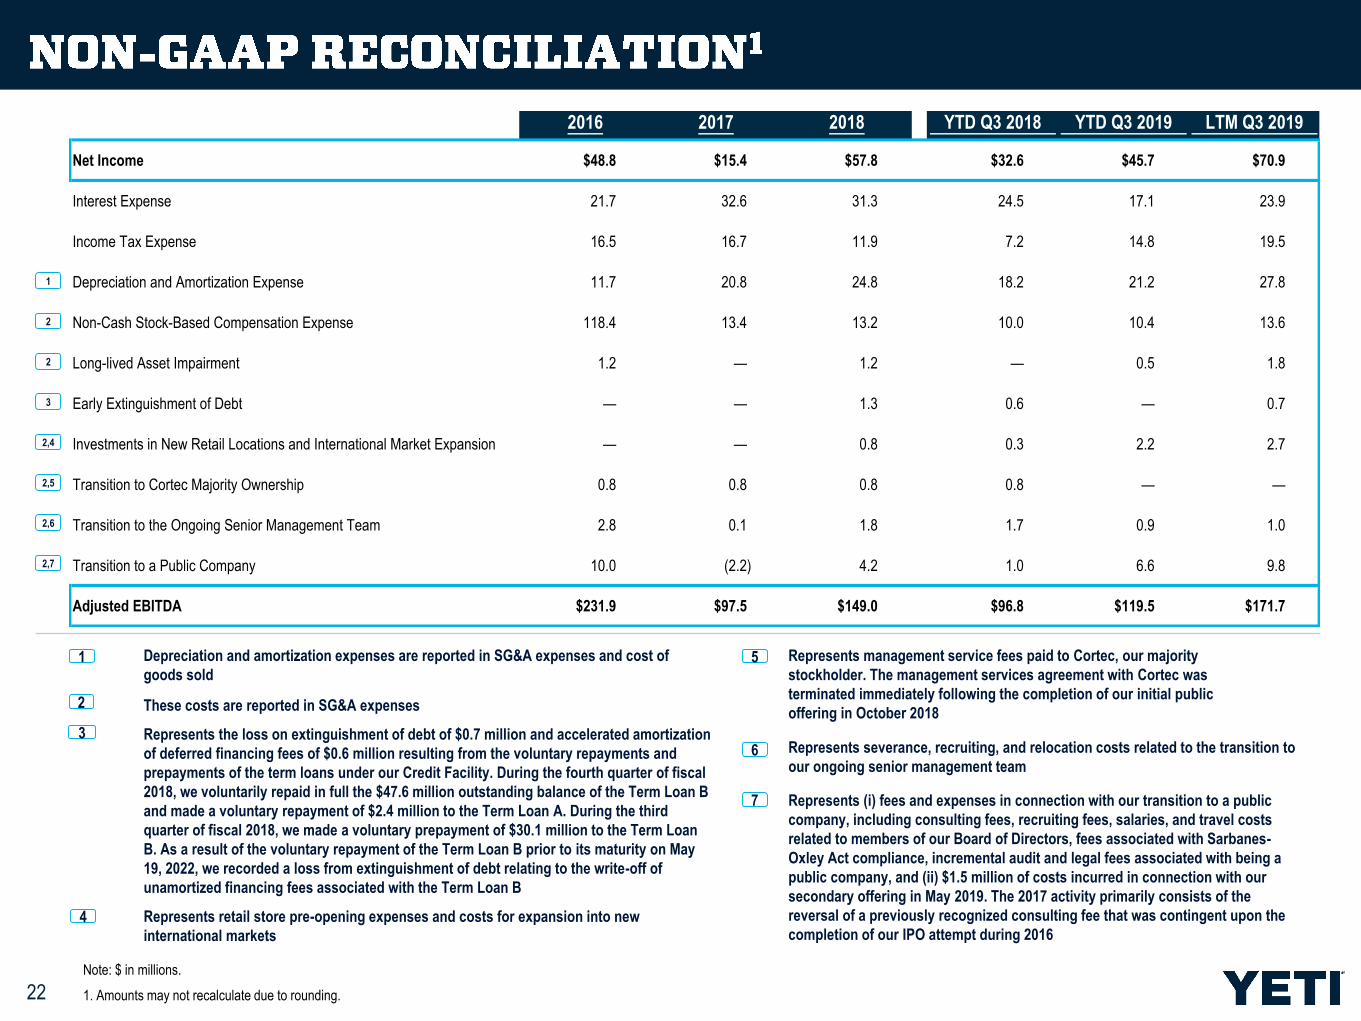
Depreciation and amortization expenses are reported in SG&A expenses and cost of
goods sold1
Represents retail store pre-opening expenses and costs for expansion into new
international markets
4
Represents severance, recruiting, and relocation costs related to the transition to
our ongoing senior management team6
Represents the loss on extinguishment of debt of $0.7 million and accelerated amortization
of deferred financing fees of $0.6 million resulting from the voluntary repayments and
prepayments of the term loans under our Credit Facility. During the fourth quarter of fiscal
2018, we voluntarily repaid in full the $47.6 million outstanding balance of the Term Loan B
and made a voluntary repayment of $2.4 million to the Term Loan A. During the third
quarter of fiscal 2018, we made a voluntary prepayment of $30.1 million to the Term Loan
B. As a result of the voluntary repayment of the Term Loan B prior to its maturity on May
19, 2022, we recorded a loss from extinguishment of debt relating to the write-off of
unamortized financing fees associated with the Term Loan B
3
Represents management service fees paid to Cortec, our majority
stockholder. The management services agreement with Cortec was
terminated immediately following the completion of our initial public
offering in October 2018
5
Represents (i) fees and expenses in connection with our transition to a public
company, including consulting fees, recruiting fees, salaries, and travel costs
related to members of our Board of Directors, fees associated with Sarbanes-
Oxley Act compliance, incremental audit and legal fees associated with being a
public company, and (ii) $1.5 million of costs incurred in connection with our
secondary offering in May 2019. The 2017 activity primarily consists of the
reversal of a previously recognized consulting fee that was contingent upon the
completion of our IPO attempt during 2016
7
These costs are reported in SG&A expenses2
2016 2017 2018 YTD Q3 2018 YTD Q3 2019 LTM Q3 2019
Net Income $48.8 $15.4 $57.8 $32.6 $45.7 $70.9
Interest Expense 21.7 32.6 31.3 24.5 17.1 23.9
Income Tax Expense 16.5 16.7 11.9 7.2 14.8 19.5
Depreciation and Amortization Expense 11.7 20.8 24.8 18.2 21.2 27.8
Non-Cash Stock-Based Compensation Expense 118.4 13.4 13.2 10.0 10.4 13.6
Long-lived Asset Impairment 1.2 — 1.2 — 0.5 1.8
Early Extinguishment of Debt — — 1.3 0.6 — 0.7
Investments in New Retail Locations and International Market Expansion — — 0.8 0.3 2.2 2.7
Transition to Cortec Majority Ownership 0.8 0.8 0.8 0.8 — —
Transition to the Ongoing Senior Management Team 2.8 0.1 1.8 1.7 0.9 1.0
Transition to a Public Company 10.0 (2.2) 4.2 1.0 6.6 9.8
Adjusted EBITDA $231.9 $97.5 $149.0 $96.8 $119.5 $171.7
Note: $ in millions.
1. Amounts may not recalculate due to rounding.
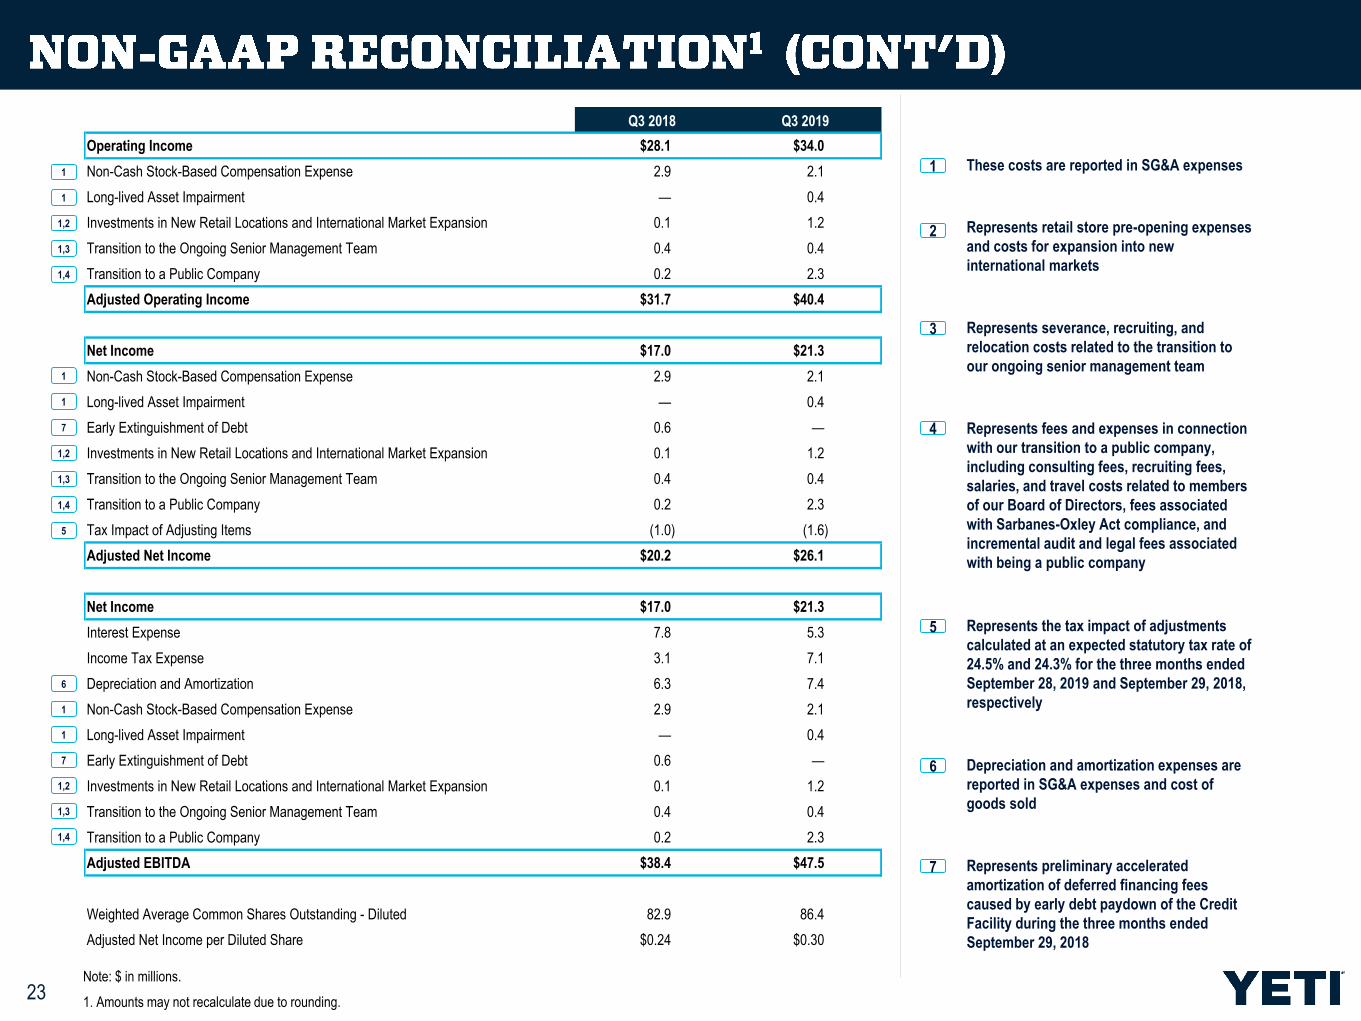
Q3 2018 Q3 2019
Operating Income $28.1 $34.0
Non-Cash Stock-Based Compensation Expense 2.9 2.1
Long-lived Asset Impairment — 0.4
Investments in New Retail Locations and International Market Expansion 0.1 1.2
Transition to the Ongoing Senior Management Team 0.4 0.4
Transition to a Public Company 0.2 2.3
Adjusted Operating Income $31.7 $40.4
Net Income $17.0 $21.3
Non-Cash Stock-Based Compensation Expense 2.9 2.1
Long-lived Asset Impairment — 0.4
Early Extinguishment of Debt 0.6 —
Investments in New Retail Locations and International Market Expansion 0.1 1.2
Transition to the Ongoing Senior Management Team 0.4 0.4
Transition to a Public Company 0.2 2.3
Tax Impact of Adjusting Items (1.0) (1.6)
Adjusted Net Income $20.2 $26.1
Net Income $17.0 $21.3
Interest Expense 7.8 5.3
Income Tax Expense 3.1 7.1
Depreciation and Amortization 6.3 7.4
Non-Cash Stock-Based Compensation Expense 2.9 2.1
Long-lived Asset Impairment — 0.4
Early Extinguishment of Debt 0.6 —
Investments in New Retail Locations and International Market Expansion 0.1 1.2
Transition to the Ongoing Senior Management Team 0.4 0.4
Transition to a Public Company 0.2 2.3
Adjusted EBITDA $38.4 $47.5
Weighted Average Common Shares Outstanding - Diluted 82.9 86.4
Adjusted Net Income per Diluted Share $0.24 $0.30
23
These costs are reported in SG&A expenses1
Represents retail store pre-opening expenses
and costs for expansion into new
international markets
2
Represents fees and expenses in connection
with our transition to a public company,
including consulting fees, recruiting fees,
salaries, and travel costs related to members
of our Board of Directors, fees associated
with Sarbanes-Oxley Act compliance, and
incremental audit and legal fees associated
with being a public company
4
Represents the tax impact of adjustments
calculated at an expected statutory tax rate of
24.5% and 24.3% for the three months ended
September 28, 2019 and September 29, 2018,
respectively
5
Depreciation and amortization expenses are
reported in SG&A expenses and cost of
goods sold
6
1
6
1,2
1
1,3
1,4
5
1
1
1,2
1,3
1,4
Represents severance, recruiting, and
relocation costs related to the transition to
our ongoing senior management team
3
1
1,2
1
1,3
1,4
7
Represents preliminary accelerated
amortization of deferred financing fees
caused by early debt paydown of the Credit
Facility during the three months ended
September 29, 2018
7
7
Note: $ in millions.
1. Amounts may not recalculate due to rounding.