Investor presentation – Morgan Stanley: Off Piste … EXPLORATION, DEVELOPMENT, INCOME, GROWTH...
31
0 September 2015 EXPLORATION, DEVELOPMENT, INCOME, GROWTH www.sephakuholdings.com INVESTOR PRESENTATION MORGAN STANLEY: OFF PISTE CONFERENCE CAPE TOWN 30 SEPTEMBER 2015
Transcript of Investor presentation – Morgan Stanley: Off Piste … EXPLORATION, DEVELOPMENT, INCOME, GROWTH...

0September 2015 EXPLORATION, DEVELOPMENT, INCOME, GROWTH www.sephakuholdings.com
INVESTOR PRESENTATION
MORGAN STANLEY:
OFF PISTE CONFERENCE
CAPE TOWN
30 SEPTEMBER 2015

1September 2015 EXPLORATION, DEVELOPMENT, INCOME, GROWTH www.sephakuholdings.com
This presentation includes certain forward-looking information. All statements other than statements of historical fact are, or may
be deemed to be, forward-looking statements, including, without limitation, those concerning: Sephaku Holdings’ strategy; the
economic outlook for the industry; production; cash costs and other operating results; growth prospects and outlook for Sephaku
Holdings’ operations, individually or in the aggregate; liquidity and capital resources and expenditure; and the outcome and
consequences of any pending litigation proceedings. These forward-looking statements are not based on historical facts, but
rather reflect Sephaku Holdings’ current expectations concerning future results and events and generally may be identified by
the use of forward-looking words or phrases such as “believe”, “aim”, “expect”, “anticipate”, “intend”, “foresee”, “forecast”, “likely”,
“should”, “planned”, “may”, “estimated”, “potential” or similar words and phrases. Similarly, statements concerning Sephaku
Holdings’ objectives, plans or goals are or may be forward-looking statements. These forward-looking statements involve known
and unknown risks, uncertainties and other factors that may affect Sephaku Holdings’ actual results, performance or
achievements expressed or implied by these forward-looking statements. Although Sephaku Holdings believes that the
expectations reflected in these forward-looking statements are reasonable, no assurance can be given that such expectations
will prove to have been correct.
DISCLAIMER

2September 2015 EXPLORATION, DEVELOPMENT, INCOME, GROWTH www.sephakuholdings.com
□ Strategic company overview Dr Lelau Mohuba: Chief executive officer
□ SA cement industry overview
□ Financial performance highlights Neil Crafford-Lazarus: Financial director
□ Investment case
□ Outlook
AGENDA

3September 2015 EXPLORATION, DEVELOPMENT, INCOME, GROWTH www.sephakuholdings.com
STRATEGIC COMPANY OVERVIEW

4September 2015 EXPLORATION, DEVELOPMENT, INCOME, GROWTH www.sephakuholdings.com
THE SEPHAKU HOLDINGS STRUCTURE

5September 2015 EXPLORATION, DEVELOPMENT, INCOME, GROWTH www.sephakuholdings.com
LOCATION OF ASSETS
Note: Project locations not actual but indicative for illustrative purposes

6September 2015 EXPLORATION, DEVELOPMENT, INCOME, GROWTH www.sephakuholdings.com
KEY MILESTONES

7September 2015 EXPLORATION, DEVELOPMENT, INCOME, GROWTH www.sephakuholdings.com
The group is anchored by the following cornerstones
DRIVERS FOR SUCCESS
Deep technical,
project management
and marketing skills
Experienced key
management with
comprehensive
industry knowledge
and experience in
cement and
concrete
manufacturing
Leading
technologies that
facilitate the
production of high
quality cement and
mixed concrete
Modern, highly
efficient cement
plants with
state-of-the-art
equipment and
infrastructure
Compact mixed
concrete production
plants
Customer focus
through service
excellence
Métier has built
brand equity through
its innovative
specialised
concretes and
superior service
offering
Strategic
relationships
and deal-making
abilities
The group has
developed robust
relationships with
the key stakeholders
including the retail
distribution channel,
communities,
funders and
suppliers
8September 2015 EXPLORATION, DEVELOPMENT, INCOME, GROWTH www.sephakuholdings.com
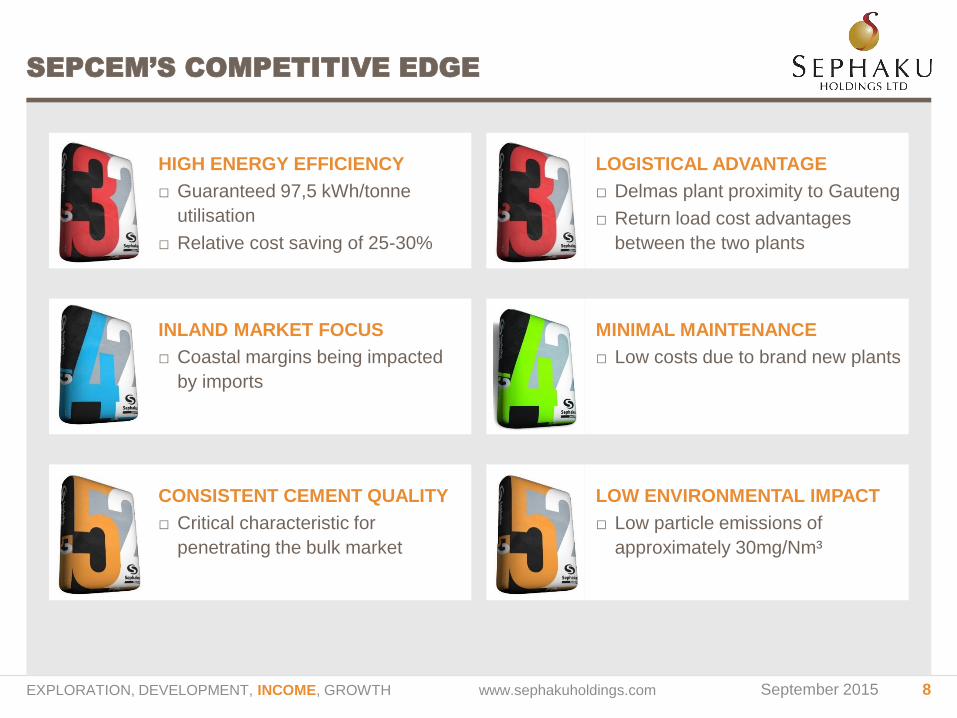
SEPCEM’S COMPETITIVE EDGE
MINIMAL MAINTENANCE
□ Low costs due to brand new plants
HIGH ENERGY EFFICIENCY
□ Guaranteed 97,5 kWh/tonne
utilisation
□ Relative cost saving of 25-30%
LOGISTICAL ADVANTAGE
□ Delmas plant proximity to Gauteng
□ Return load cost advantages
between the two plants
CONSISTENT CEMENT QUALITY
□ Critical characteristic for
penetrating the bulk market
INLAND MARKET FOCUS
□ Coastal margins being impacted
by imports
LOW ENVIRONMENTAL IMPACT
□ Low particle emissions of
approximately 30mg/Nm³

9September 2015 EXPLORATION, DEVELOPMENT, INCOME, GROWTH www.sephakuholdings.com
0
10
20
30
40
50
32,5Sephaku
32,5Producer A
32,5Producer B
42,5Sephaku
42,5Producer B
42,5Producer A
42,5RProducer A
42,5Producer C
42,5RProducer C
Me
ga
pa
sca
l
1 day 3 days 7 days 28 days
CEMENT STRENGTH PERFORMANCE –
CONCRETE COMPARATIVE
Source: Results from tests done by an independent technical consultancy commissioned by Sephaku Cement – 2014

10September 2015 EXPLORATION, DEVELOPMENT, INCOME, GROWTH www.sephakuholdings.com
SepCem
□ Aganang integrated and Delmas milling plants at steady state production
□ Production of clinker from Aganang commenced in August 2014 improving cost efficiencies
by 50%
□ SepCem supplying approximately 80% of the production output into inland markets
Balance supplied into the second largest market of KZN
Métier
□ Métier sales continued to grow in spite of a highly competitive environment
Fleet increased by 23% and pumping capacity by 20% in the past financial year
□ Secured four anchor contracts for an 18-month period from April 2015
□ All eleven plants located in the main markets of KZN and Gauteng operating well
HISTORICAL PERFORMANCE HIGHLIGHTS

11September 2015 EXPLORATION, DEVELOPMENT, INCOME, GROWTH www.sephakuholdings.com
Main focus for the medium term is the creation of shareholder value through sustainable
earnings and growth by:
□ ensuring that the operations adhere to their respective action plans to strengthen their balance
sheets by reducing debt in order to increase free cash flow in preparation
for the distribution of dividends to the shareholders
□ ensuring that the operations become leaders in producing high-quality products and implement
effective marketing activities that secure market share and maximise margins
□ ensuring that the operational focus areas include strategically optimising logistics between plants
and market to improve cost efficiencies
STRATEGIC DIRECTION

12September 2015 EXPLORATION, DEVELOPMENT, INCOME, GROWTH www.sephakuholdings.com
OVERVIEW OF THE SA CEMENT INDUSTRY

13September 2015 EXPLORATION, DEVELOPMENT, INCOME, GROWTH www.sephakuholdings.com
10
79
7 9
00
11
40
0 0
99
11
54
1 6
40
12
02
7 6
23
12
45
5 1
62
0.0%
1.5%
3.0%
4.5%
6.0%
2011 2012 2013 2014 2015
Sa
les (
ton
ne
s)
MAT YOY % ch
CEMENT SALES VOLUME PERFORMANCE
□ In 2014 imports estimated
at 1,3 million tonnes and
domestic sales at 12,1 million
tonnes
Implied total demand at
approximately 13,4 million
tonnes
□ Total demand for 2015 to be
relatively flat at 3,5% to
13,8 million tonnes based on
sales volume quarterly data
and projected imports
Source: Data from the quarterly cementitious sales data as published by Levitt Kirson
in July 2015 based on local producers for Q1 2015. Volumes do not include Botswana,
Lesotho, Swaziland, Namibia and imported volumes
5,6%YOY % ch 1,2% 4,2% 3,6%

14September 2015 EXPLORATION, DEVELOPMENT, INCOME, GROWTH www.sephakuholdings.com
□ Increasing volumes of imports from approximately 500 000 tonnes in 2011 to 1,3 million tonnes
in 2014 resulted in downward pricing pressure
□ ITAC imposed tariffs have resulted in an immediate reduction in import activity with no imports
into KZN in August 2015
All importers have halted imports except for Lucky Cement who had the least tariff rate
of 14,29% imposed
Lucky Cement prices have since increased to approximate the level of local producers
□ Ultimate impact on imports will depend on
Final ITAC decision on the duties expected in November
USD/ZAR exchange rate trend
□ A new entrant with cement capacity of 1 million tonnes per annum expected to place additional
pressure on producers with older and inefficient capacity
The entrant has disclosed that the planned commencement of operations is Q1 2016
Downward pricing pressure to continue until CY 2017
□ SepCem well positioned to defend its market share because of superior cost efficiencies
CEMENT IMPORTS & NEW ENTRANT

15September 2015 EXPLORATION, DEVELOPMENT, INCOME, GROWTH www.sephakuholdings.com
IMPORTED VOLUMES ON A DOWNWARD TREND
Source: SARS, Sephaku Cement research – July 2015
0.0
0.1
0.2
0.3
0.4
0.5
Q1 2014 Q2 2014 Q3 2014 Q4 2014 Q1 2015 Q2 2015
Quarterly actual 266 000 386 000 248 000 410 000 295 000 207 000
Monthly average 89 000 129 000 83 000 137 000 98 000 69 000
Sa
les v
olu
me
s (
mill
ion
to
nn
es)
16September 2015 EXPLORATION, DEVELOPMENT, INCOME, GROWTH www.sephakuholdings.com
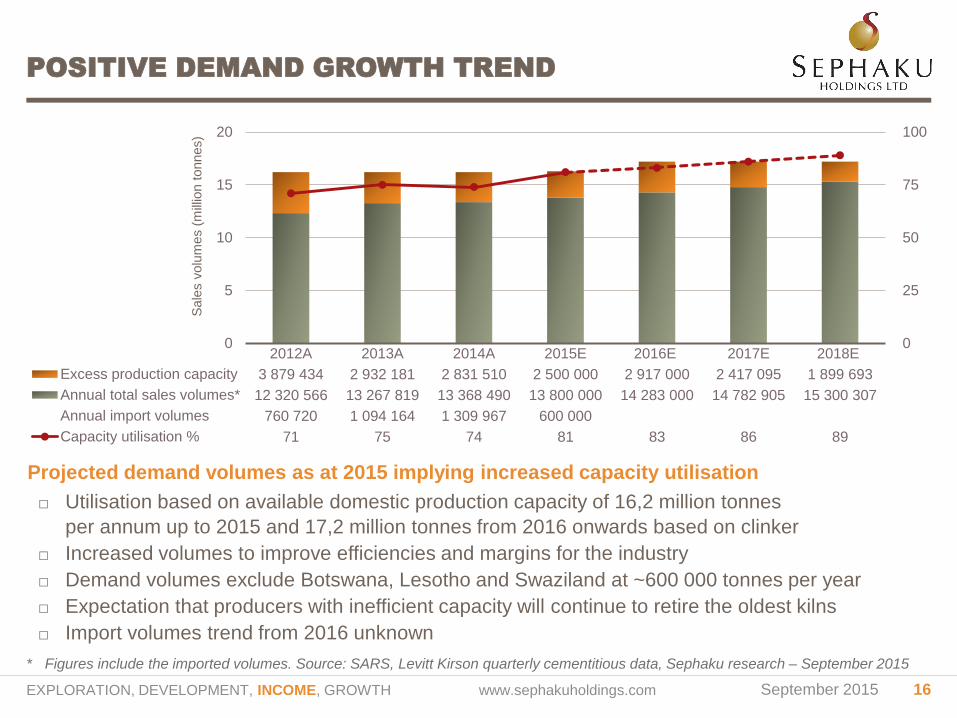
* Figures include the imported volumes. Source: SARS, Levitt Kirson quarterly cementitious data, Sephaku research – September 2015
POSITIVE DEMAND GROWTH TREND
0
25
50
75
100
0
5
10
15
20
2012A 2013A 2014A 2015E 2016E 2017E 2018E
Excess production capacity 3 879 434 2 932 181 2 831 510 2 500 000 2 917 000 2 417 095 1 899 693
Annual total sales volumes* 12 320 566 13 267 819 13 368 490 13 800 000 14 283 000 14 782 905 15 300 307
Annual import volumes 760 720 1 094 164 1 309 967 600 000
Capacity utilisation % 71 75 74 81 83 86 89
Sale
s v
olu
mes (
mill
ion t
onnes)
Projected demand volumes as at 2015 implying increased capacity utilisation
□ Utilisation based on available domestic production capacity of 16,2 million tonnes
per annum up to 2015 and 17,2 million tonnes from 2016 onwards based on clinker
□ Increased volumes to improve efficiencies and margins for the industry
□ Demand volumes exclude Botswana, Lesotho and Swaziland at ~600 000 tonnes per year
□ Expectation that producers with inefficient capacity will continue to retire the oldest kilns
□ Import volumes trend from 2016 unknown
17September 2015 EXPLORATION, DEVELOPMENT, INCOME, GROWTH www.sephakuholdings.com
FINANCIAL PERFORMANCE OVERVIEW
Above: Aganang integrated plant Below: Delmas milling plant

18September 2015 EXPLORATION, DEVELOPMENT, INCOME, GROWTH www.sephakuholdings.com
¹ SepCem has a December year-end as a subsidiary of Dangote Cement Plc
□ Métier stellar performance persisted to the end of financial year 2015
Revenue ▲ by 36% from R571,5 million to R775,4 million
EBITDA ▲ by 39% from R100,0 million to R139,1 million
Operating profit ▲ by 44% from R75,5 million to R108,9 million
– Consistently performing better than peers at an average EBIT margin of 14%
Profit after tax ▲ by 57% from R41,3 million to R64,7 million
□ ¹SepCem successful penetration of the market demonstrated by exceptional growth
Cumulative revenue of R2 billion in 18 months since January 2014
Successful market penetration strategies ensured ramp up of sales to R919 million
in 12 months to the end of December 2014
Six-months revenue to end of June 2015 at R1 billion in a highly competitive environment
EBITDA margin has continued to increase to 21% for the interim period 2015 with industry
average estimated at 25%
KEY HIGHLIGHTS TO DATE

19September 2015 EXPLORATION, DEVELOPMENT, INCOME, GROWTH www.sephakuholdings.com
SEPCEM REVENUE AND PROFITABILITY PROFILE
□ SepCem Q2 2015
revenue of
R490 million and
EBITDA at 18% due
to kiln downtime at
Aganang
□ Cumulative revenue
in 18 months to
end of June 2015
at ~ R2 billion
□ Total volume sold
of 780 000 tonnes
for the year ended
December 2014
(35
)
(2)
15
26
23
18
55
206
515
919
1 440
1 930
(40)
(30)
(20)
(10)
0
10
20
30
40
0
200
400
600
800
1 000
1 200
1 400
1 600
1 800
2 000
Q1 2014 Q2 2014 Q3 2014 Q4 2014 Q1 2015 Q2 2015
Qu
art
erly E
BIT
DA
Cum
ula
tive
reve
nu
e (
Rm
)
EBITDA % Sales

20September 2015 EXPLORATION, DEVELOPMENT, INCOME, GROWTH www.sephakuholdings.com
FOCUS ON EARNINGS GROWTH (R’000)
(2 818)
13 425
51 153
252 389
(319 156)
571 545
47 161
72 060
59 288
340 995
(434 431)
775 425
(500 000) (250 000) 0 250 000 500 000 750 000 1000 000
Total comprehensive income (loss)/profit
Profit before taxation
Operating profit
Gross profit
Cost of sales
Revenue
31 March 2015 - Audited 31 March 2014 - Audited

21September 2015 EXPLORATION, DEVELOPMENT, INCOME, GROWTH www.sephakuholdings.com
STRONG BALANCE SHEET (R’000)
□ Net asset value increased by
6,6% to 419,79 cents per share
at the end March 2015
□ Tangible net asset value at
304,86 cents representing an
increase of 12,6%
□ Net reduction of R10,1 million
in financial liabilities
□ Fixed asset turnover at 6x in
2015 financial period compared
to 4,6x in FY 2014 due to
Métier increase in revenue
□ Current ratio at end of FY 2015
at 1,9x from 0,5x due to an
increase in cash and trade
receivables
990 253
116 560
1 106 812
747 724
159 350
199 738
1 106 812
1 015 419
204 070
1 219 489
844 720
265 831
108 938
1 219 489
0 250 000 500 000 750 000 1 000 000 1 250 000
Non-current assets
Current assets
Total assets
Shareholder equity
Non-current liabilities
Current liabilities
Total equity and liabilities
31 March 2015 - Audited 31 March 2014 - Audited

22September 2015 EXPLORATION, DEVELOPMENT, INCOME, GROWTH www.sephakuholdings.com
INCREASING NET OPERATING CASH FLOW (R’000)
□ Net cash from
operations increased
by 76% year on year
at the end of March
2015 to ~ R71 million
Growth in
profitable concrete
sales
Métier sustaining
an EBIT of 14%
since acquisition
26
00
1
70
92
5
(26
77
7)
76
5
70
91
4
22
33
8
40
38
5
(27
25
3)
(9 9
19
)
26
00
1
(30 000)
(15 000)
0
15 000
30 000
45 000
60 000
75 000
Cash as atbeginningof period
Net cash flowfrom operating
activities
Net cash flowfrom investing
activities
Net cash flowfrom financing
activities
Cash as atend ofperiod
31 March 2015 - Audited 31 March 2014 - Audited

23September 2015 EXPLORATION, DEVELOPMENT, INCOME, GROWTH www.sephakuholdings.com
SHARE INFORMATION
Share ticker: JSE (MAIN)
Sector Construction and Materials – JSE
Listing 2009
Issued shares 201 224 508
Closing price as at 25 September 2015 700 cents
Average value traded per week 12 months to 25 September 2015 R9 930 210
Average volume traded per week 12 months to 25 September 2015 1 336 840
Market capitalisation as at 25 September 2015 R1,4 billion
Total number of shareholders as at 31 August 2015 2 489
Free-float as at 31 March 2015 164 033 446
Number of ordinary shares issued in the year ended 31 March 2015 11 351 529
□ Highest price in the 12 months to 28 September at R10,22 on 7 April 2015
Lowest price of R5,15 on 14 October 2014
Source 1: JSE Limited
Source 2: Company Annual Report

24September 2015 EXPLORATION, DEVELOPMENT, INCOME, GROWTH www.sephakuholdings.com
INVESTMENT PROPOSITION AND OUTLOOK

25September 2015 EXPLORATION, DEVELOPMENT, INCOME, GROWTH www.sephakuholdings.com
OUR INVESTMENT PROPOSITION

26September 2015 EXPLORATION, DEVELOPMENT, INCOME, GROWTH www.sephakuholdings.com
OUR INVESTMENT PROPOSITION

27September 2015 EXPLORATION, DEVELOPMENT, INCOME, GROWTH www.sephakuholdings.com
OUR INVESTMENT PROPOSITION

28September 2015 EXPLORATION, DEVELOPMENT, INCOME, GROWTH www.sephakuholdings.com
OUR INVESTMENT PROPOSITION

29September 2015 EXPLORATION, DEVELOPMENT, INCOME, GROWTH www.sephakuholdings.com
INCREASE FREE CASH FLOW
SepCem
□ Increase sales focus to gain market share
□ Ensure sufficient and optimised logistics between plants and market
□ Further increase production efficiency to optimise operating costs
Métier
□ Exploring further expansion opportunities to grow earnings and market share
□ Short-term strategy
Generate positive earnings
Reduce gearing
Increase operating cash flows

30September 2015 EXPLORATION, DEVELOPMENT, INCOME, GROWTH www.sephakuholdings.com
CONTACT
Sakhile Ndlovu
Investor relations officer
Tel: + 27 12 612 0210
Email: [email protected]
Website: www.sephakuholdings.com