
INVESTOR PRESENTATION...Key Investment Highlights Substantial Internal and External Growth...
26
Fall 2019 INVESTOR PRESENTATION Rochelle, IL Lula, GA
Transcript of INVESTOR PRESENTATION...Key Investment Highlights Substantial Internal and External Growth...

Fall 2019
INVESTOR PRESENTATION
Rochelle, IL
Lula, GA

Disclaimer
This presentation contains statements about future events and expectations that constitute forward-looking statements. Forward-looking statements are basedon our beliefs, assumptions and expectations of our future financial and operating performance and growth plans, taking into account the information currentlyavailable to us. These statements are not statements of historical fact. Forward-looking statements involve risks and uncertainties that may cause our actualresults to differ materially from the expectations of future results we express or imply in any forward-looking statements, and you should not place unduereliance on such statements. Factors that could contribute to these differences include adverse economic or real estate developments in our geographicmarkets or the temperature-controlled warehouse industry; general economic conditions; risks associated with the ownership of real estate and temperature-controlled warehouses in particular; defaults or non-renewals of contracts with customers; potential bankruptcy or insolvency of our customers; uncertainty ofrevenues, given the nature of our customer contracts; increased interest rates and operating costs; our failure to obtain necessary outside financing; risksrelated to, or restrictions contained in, our debt financing; decreased storage rates or increased vacancy rates; risks related to current and potentialinternational operations and properties; our failure to realize the intended benefits from our recent acquisitions, including synergies, or disruptions to our plansand operations or unknown or contingent liabilities related to our recent acquisitions; our failure to successfully integrate and operate acquired or developedproperties or businesses, including but not limited to: Cloverleaf Cold Storage, Lanier Cold Storage and PortFresh Holdings, LLC; difficulties in identifyingproperties to be acquired and completing acquisitions; acquisition risks, including the failure of such acquisitions to perform in accordance with projections;risks related to expansions of existing properties and developments of new properties, including failure to meet budgeted or stabilized returns in respectthereof; acquisition risks, including the failure of such acquisitions to perform in accordance with projections; difficulties in expanding our operations into newmarkets, including international markets; our failure to maintain our status as a REIT; our operating partnership’s failure to qualify as a partnership for federalincome tax purposes; uncertainties and risks related to natural disasters and global climate change; possible environmental liabilities, including costs, fines orpenalties that may be incurred due to necessary remediation of contamination of properties presently or previously owned by us; financial market fluctuations;actions by our competitors and their increasing ability to compete with us; labor and power costs; changes in real estate and zoning laws and increases in realproperty tax rates; the competitive environment in which we operate; our relationship with our employees, including the occurrence of any work stoppages orany disputes under our collective bargaining agreements; liabilities as a result of our participation in multi-employer pension plans; losses in excess of ourinsurance coverage; the cost and time requirements as a result of our operation as a publicly traded REIT; changes in foreign currency exchange rates; thepotential dilutive effect of our common share offerings; the impact of anti-takeover provisions in our constituent documents and under Maryland law, whichcould make an acquisition of us more difficult, limit attempts by our shareholders to replace our trustees and affect the price of our common shares; and risksrelated to our forward sale agreements, including substantial dilution to our earnings per share or substantial cash payment obligations.
Words such as “anticipates,” “believes,” “continues,” “estimates,” “expects,” “goal,” “objectives,” “intends,” “may,” “opportunity,” “plans,” “potential,” “near-term,” “long-term,” “projections,” “assumptions,” “projects,” “guidance,” “forecasts,” “outlook,” “target,” “trends,” “should,” “could,” “would,” “will” andsimilar expressions are intended to identify such forward-looking statements. Examples of forward-looking statements included in this presentation include,among others, statements about our expected expansion and development pipeline and our targeted return on invested capital on expansion and developmentopportunities. We qualify any forward-looking statements entirely by these cautionary factors. Other risks, uncertainties and factors, including those discussedunder “Risk Factors” in our Annual Report on Form 10-K for the year ended December 31, 2018 and our other reports filed with the Securities and ExchangeCommission, could cause our actual results to differ materially from those projected in any forward-looking statements we make. We assume no obligation toupdate or revise these forward-looking statements for any reason, or to update the reasons actual results could differ materially from those anticipated inthese forward-looking statements, even if new information becomes available in the future.
1

Key Investment Highlights
Substantial Internal and External Growth Opportunities Expected to Drive Attractive Risk-Adjusted Returns
Investment Grade, Flexible Balance Sheet Positioned for Growth
Experienced Management Team, Alignment of Interest and Best-In-Class Corporate Governance
Important First Mover Advantage as the Only Publicly Traded REIT Focused on Temperature-Controlled Warehouses
Infrastructure Supported by Best-in-Class IT and Operating Platforms Provides a Significant Competitive Advantage
Global Market Leader with Integrated Network of Strategically-Located, High-Quality, “Mission-Critical” Warehouses
Strong and Stable Food Industry Fundamentals Drive Growing Demand for Our Business
1
2
3
4
5
6
7
2

Note: Figures as of June 30, 2019, unless otherwise indicated. (1) Includes seven ground leased assets(2) GCCA and IARW Top Companies in USA and North America, August 2019(3) Segment contribution refers to segment’s revenues less segment specific operating expenses (excludes any depreciation, depletion and amortization, impairment charges and corporate level SG&A).
Contribution for our warehouse segment equates to net operating income (“NOI”)
Company Snapshot
Warehouses 178
Ownership Type141 Owned (1),25 capital / operating leased, 12 managed
Total Capacity 1.1bn cubic feet / 45mm square feet
Average Facility Size 6mm cubic feet / 252K square feet
Countries of OperationU.S., Australia, New Zealand, Argentina and Canada
Estimate of U.S. Market Share
26% (2)
Number of Customers ~2,600
Number of Pallet Positions
3.8mm
($ in millions)2017A 2018A
LTM 2019
Revenue $1,544 $1,604 $1,640
Segment Contribution / NOI
$374 $406 $430
Core EBITDA $287 $307 $326
Financial OverviewPortfolio Overview
World’s largest publicly traded REIT focused on the ownership, operation, development and acquisition of temperature-controlled warehouses
3
LTM 6/30/19 Segment Breakdown
Revenue Contribution / NOI (3)
93%
3% 4%
Warehouse
Third-Party Managed
Transportation
75% 16%
9%
Warehouse
Third-Party Managed
Transportation
LTM 6/30/19 TOTAL
REVENUE
$1,640mm
LTM 6/30/19 TOTAL
CONTRIBUTION (NOI)
$430mm

Largest Fully Integrated Network of Temperature-Controlled Warehouses
Farm ProductionAdvantaged Warehouse
Public Warehouse
DistributionCenter
Retail Distribution Center
Supermarket
Fork
Food Producers Americold Realty Trust Food Distribution + Retailers
An indispensable component of food infrastructure from “farm to fork"
e-Commerce Fulfillment
Delhi, LA LaPorte, TX Atlanta, GA Phoenix, AZ
Gouldsboro Distribution Center – Gouldsboro, PA
4

Transportation
Warehouse
Third-Party Managed
WarehouseNOI
Third-Party Managed
Transportation
Integrated Operations Overview
(1) LTM figures as of June 30, 2019 and excludes the quarry business segment
Thir
d-P
arty
Man
aged
War
eho
use
(Sto
rage
an
d H
and
ling)
Mission-critical, temperature-controlled real estate infrastructure generates rent and storage income
Comprehensive value-add services
Strategic locations, network breadth, scale, reliable temperature integrity and best-in-class customer IT interface distinguish our warehouses from our competitors
Management of customer-owned warehouses
Warehouse management services provided at customer-owned facilities
Operating costs passed through to customers
Asset-light consolidation, management and brokerage services
Complements warehouse segment
Enhances customer retention and drives warehouse storage and occupancy
Supplementary offering that improves supply chain efficiency and reduces cost by leveraging Americold’s scale
Overview Select Customers % of Contribution (1)
Tran
spo
rtat
ion
3%
Real estate value is driven by the critical nature of our infrastructure, strategic locations and integrated, full-service strategy
4%
93%
Tradewater Distribution Facility – Atlanta, GA
5

Strategically Located, “Mission-Critical” Temperature-Controlled Warehouses
6Note: Americold portfolio figures as of June 30, 2019, inclusive of the acquisition of Cloverleaf and Lanier(1) Figures include ambient facility, except for cubic feet metric
# Facilities 160
Square Feet (000s) 41,879
Cubic feet (mm) 975.7
# Facilities 2
Square Feet (000s) 232
Cubic feet (mm) 9.7
# Facilities 6
Square Feet (000s) 1,644
Cubic feet (mm) 47.6
Canada United States (1) Argentina (1)Australia (1) New Zealand
# Facilities 3
Square Feet (000s) 471
Cubic Feet (mm) 14.3
# Facilities 7
Square Feet (000s) 604
Cubic feet (mm) 22.8
NY008V6E / 1157235_1.worNY008V6E / 1157235_1.worNY008V6E / 1157235_1.worNY008V6E / 1157235_1.worNY008V6E / 1157235_1.worNY008V6E / 1157235_1.worNY008V6E / 1157235_1.worNY008V6E / 1157235_1.worNY008V6E / 1157235_1.worNY008V6E / 1157235_1.worNY008V6E / 1157235_1.worNY008V6E / 1157235_1.worNY008V6E / 1157235_1.worNY008V6E / 1157235_1.worNY008V6E / 1157235_1.worNY008V6E / 1157235_1.worNY008V6E / 1157235_1.worNY008V6E / 1157235_1.worNY008V6E / 1157235_1.worNY008V6E / 1157235_1.worNY008V6E / 1157235_1.worNY008V6E / 1157235_1.worNY008V6E / 1157235_1.worNY008V6E / 1157235_1.worNY008V6E / 1157235_1.worNY008V6E / 1157235_1.worNY008V6E / 1157235_1.worNY008V6E / 1157235_1.worNY008V6E / 1157235_1.worNY008V6E / 1157235_1.worNY008V6E / 1157235_1.worNY008V6E / 1157235_1.worNY008V6E / 1157235_1.worNY008V6E / 1157235_1.worNY008V6E / 1157235_1.worNY008V6E / 1157235_1.worNY008V6E / 1157235_1.worNY008V6E / 1157235_1.worNY008V6E / 1157235_1.worNY008V6E / 1157235_1.worNY008V6E / 1157235_1.worNY008V6E / 1157235_1.worNY008V6E / 1157235_1.worNY008V6E / 1157235_1.worNY008V6E / 1157235_1.worNY008V6E / 1157235_1.worNY008V6E / 1157235_1.worNY008V6E / 1157235_1.worNY008V6E / 1157235_1.worNY008V6E / 1157235_1.worNY008V6E / 1157235_1.worNY008V6E / 1157235_1.worNY008V6E / 1157235_1.worNY008V6E / 1157235_1.worNY008V6E / 1157235_1.worNY008V6E / 1157235_1.worNY008V6E / 1157235_1.worNY008V6E / 1157235_1.worNY008V6E / 1157235_1.worNY008V6E / 1157235_1.worNY008V6E / 1157235_1.worNY008V6E / 1157235_1.worNY008V6E / 1157235_1.worNY008V6E / 1157235_1.worNY008V6E / 1157235_1.worNY008V6E / 1157235_1.worNY008V6E / 1157235_1.worNY008V6E / 1157235_1.worNY008V6E / 1157235_1.worNY008V6E / 1157235_1.worNY008V6E / 1157235_1.worNY008V6E / 1157235_1.worNY008V6E / 1157235_1.worNY008V6E / 1157235_1.worNY008V6E / 1157235_1.worNY008V6E / 1157235_1.worNY008V6E / 1157235_1.worNY008V6E / 1157235_1.worNY008V6E / 1157235_1.worNY008V6E / 1157235_1.worNY008V6E / 1157235_1.worNY008V6E / 1157235_1.worNY008V6E / 1157235_1.worNY008V6E / 1157235_1.worNY008V6E / 1157235_1.worNY008V6E / 1157235_1.worNY008V6E / 1157235_1.worNY008V6E / 1157235_1.worNY008V6E / 1157235_1.worNY008V6E / 1157235_1.worNY008V6E / 1157235_1.worNY008V6E / 1157235_1.worNY008V6E / 1157235_1.worNY008V6E / 1157235_1.worNY008V6E / 1157235_1.worNY008V6E / 1157235_1.worNY008V6E / 1157235_1.worNY008V6E / 1157235_1.wor
NY008V6E / 1157235_1.worNY008V6E / 1157235_1.worNY008V6E / 1157235_1.worNY008V6E / 1157235_1.worNY008V6E / 1157235_1.worNY008V6E / 1157235_1.worNY008V6E / 1157235_1.worNY008V6E / 1157235_1.worNY008V6E / 1157235_1.worNY008V6E / 1157235_1.worNY008V6E / 1157235_1.worNY008V6E / 1157235_1.worNY008V6E / 1157235_1.worNY008V6E / 1157235_1.worNY008V6E / 1157235_1.worNY008V6E / 1157235_1.worNY008V6E / 1157235_1.worNY008V6E / 1157235_1.worNY008V6E / 1157235_1.worNY008V6E / 1157235_1.worNY008V6E / 1157235_1.worNY008V6E / 1157235_1.worNY008V6E / 1157235_1.worNY008V6E / 1157235_1.worNY008V6E / 1157235_1.worNY008V6E / 1157235_1.worNY008V6E / 1157235_1.worNY008V6E / 1157235_1.worNY008V6E / 1157235_1.worNY008V6E / 1157235_1.worNY008V6E / 1157235_1.worNY008V6E / 1157235_1.worNY008V6E / 1157235_1.worNY008V6E / 1157235_1.worNY008V6E / 1157235_1.worNY008V6E / 1157235_1.worNY008V6E / 1157235_1.worNY008V6E / 1157235_1.worNY008V6E / 1157235_1.worNY008V6E / 1157235_1.worNY008V6E / 1157235_1.worNY008V6E / 1157235_1.worNY008V6E / 1157235_1.worNY008V6E / 1157235_1.worNY008V6E / 1157235_1.worNY008V6E / 1157235_1.worNY008V6E / 1157235_1.worNY008V6E / 1157235_1.worNY008V6E / 1157235_1.wor
NY008V6E / 1157235_1.wor
NCNCNCNCNCNCNCNCNCNCNCNCNCNCNCNCNCNCNCNCNCNCNCNCNCNCNCNCNCNCNCNCNCNCNCNCNCNCNCNCNCNCNCNCNCNCNCNCNC
WVWVWVWVWVWVWVWVWVWVWVWVWVWVWVWVWVWVWVWVWVWVWVWVWVWVWVWVWVWVWVWVWVWVWVWVWVWVWVWVWVWVWVWVWVWVWVWVWVVAVAVAVAVAVAVAVAVAVAVAVAVAVAVAVAVAVAVAVAVAVAVAVAVAVAVAVAVAVAVAVAVAVAVAVAVAVAVAVAVAVAVAVAVAVAVAVAVA DCDCDCDCDCDCDCDCDCDCDCDCDCDCDCDCDCDCDCDCDCDCDCDCDCDCDCDCDCDCDCDCDCDCDCDCDCDCDCDCDCDCDCDCDCDCDCDCDC
SCSCSCSCSCSCSCSCSCSCSCSCSCSCSCSCSCSCSCSCSCSCSCSCSCSCSCSCSCSCSCSCSCSCSCSCSCSCSCSCSCSCSCSCSCSCSCSCSC
OHOHOHOHOHOHOHOHOHOHOHOHOHOHOHOHOHOHOHOHOHOHOHOHOHOHOHOHOHOHOHOHOHOHOHOHOHOHOHOHOHOHOHOHOHOHOHOHOH
MIMIMIMIMIMIMIMIMIMIMIMIMIMIMIMIMIMIMIMIMIMIMIMIMIMIMIMIMIMIMIMIMIMIMIMIMIMIMIMIMIMIMIMIMIMIMIMIMI
INININININININININININININININININININININININININININININININININININININININININININININININININ
KYKYKYKYKYKYKYKYKYKYKYKYKYKYKYKYKYKYKYKYKYKYKYKYKYKYKYKYKYKYKYKYKYKYKYKYKYKYKYKYKYKYKYKYKYKYKYKYKY
ARARARARARARARARARARARARARARARARARARARARARARARARARARARARARARARARARARARARARARARARARARARARARARARARAR
COCOCOCOCOCOCOCOCOCOCOCOCOCOCOCOCOCOCOCOCOCOCOCOCOCOCOCOCOCOCOCOCOCOCOCOCOCOCOCOCOCOCOCOCOCOCOCOCO
MNMNMNMNMNMNMNMNMNMNMNMNMNMNMNMNMNMNMNMNMNMNMNMNMNMNMNMNMNMNMNMNMNMNMNMNMNMNMNMNMNMNMNMNMNMNMNMNMN WIWIWIWIWIWIWIWIWIWIWIWIWIWIWIWIWIWIWIWIWIWIWIWIWIWIWIWIWIWIWIWIWIWIWIWIWIWIWIWIWIWIWIWIWIWIWIWIWI
FLFLFLFLFLFLFLFLFLFLFLFLFLFLFLFLFLFLFLFLFLFLFLFLFLFLFLFLFLFLFLFLFLFLFLFLFLFLFLFLFLFLFLFLFLFLFLFLFL
TXTXTXTXTXTXTXTXTXTXTXTXTXTXTXTXTXTXTXTXTXTXTXTXTXTXTXTXTXTXTXTXTXTXTXTXTXTXTXTXTXTXTXTXTXTXTXTXTX LALALALALALALALALALALALALALALALALALALALALALALALALALALALALALALALALALALALALALALALALALALALALALALALALA
IAIAIAIAIAIAIAIAIAIAIAIAIAIAIAIAIAIAIAIAIAIAIAIAIAIAIAIAIAIAIAIAIAIAIAIAIAIAIAIAIAIAIAIAIAIAIAIAIA
TNTNTNTNTNTNTNTNTNTNTNTNTNTNTNTNTNTNTNTNTNTNTNTNTNTNTNTNTNTNTNTNTNTNTNTNTNTNTNTNTNTNTNTNTNTNTNTNTN
CACACACACACACACACACACACACACACACACACACACACACACACACACACACACACACACACACACACACACACACACACACACACACACACACA
NVNVNVNVNVNVNVNVNVNVNVNVNVNVNVNVNVNVNVNVNVNVNVNVNVNVNVNVNVNVNVNVNVNVNVNVNVNVNVNVNVNVNVNVNVNVNVNVNV
AZAZAZAZAZAZAZAZAZAZAZAZAZAZAZAZAZAZAZAZAZAZAZAZAZAZAZAZAZAZAZAZAZAZAZAZAZAZAZAZAZAZAZAZAZAZAZAZAZ
GAGAGAGAGAGAGAGAGAGAGAGAGAGAGAGAGAGAGAGAGAGAGAGAGAGAGAGAGAGAGAGAGAGAGAGAGAGAGAGAGAGAGAGAGAGAGAGAGA
ALALALALALALALALALALALALALALALALALALALALALALALALALALALALALALALALALALALALALALALALALALALALALALALALAL
NYNYNYNYNYNYNYNYNYNYNYNYNYNYNYNYNYNYNYNYNYNYNYNYNYNYNYNYNYNYNYNYNYNYNYNYNYNYNYNYNYNYNYNYNYNYNYNYNY
VTVTVTVTVTVTVTVTVTVTVTVTVTVTVTVTVTVTVTVTVTVTVTVTVTVTVTVTVTVTVTVTVTVTVTVTVTVTVTVTVTVTVTVTVTVTVTVTVT
CTCTCTCTCTCTCTCTCTCTCTCTCTCTCTCTCTCTCTCTCTCTCTCTCTCTCTCTCTCTCTCTCTCTCTCTCTCTCTCTCTCTCTCTCTCTCTCTCT
NHNHNHNHNHNHNHNHNHNHNHNHNHNHNHNHNHNHNHNHNHNHNHNHNHNHNHNHNHNHNHNHNHNHNHNHNHNHNHNHNHNHNHNHNHNHNHNHNH
MDMDMDMDMDMDMDMDMDMDMDMDMDMDMDMDMDMDMDMDMDMDMDMDMDMDMDMDMDMDMDMDMDMDMDMDMDMDMDMDMDMDMDMDMDMDMDMDMD
DEDEDEDEDEDEDEDEDEDEDEDEDEDEDEDEDEDEDEDEDEDEDEDEDEDEDEDEDEDEDEDEDEDEDEDEDEDEDEDEDEDEDEDEDEDEDEDEDE
MAMAMAMAMAMAMAMAMAMAMAMAMAMAMAMAMAMAMAMAMAMAMAMAMAMAMAMAMAMAMAMAMAMAMAMAMAMAMAMAMAMAMAMAMAMAMAMAMA
RIRIRIRIRIRIRIRIRIRIRIRIRIRIRIRIRIRIRIRIRIRIRIRIRIRIRIRIRIRIRIRIRIRIRIRIRIRIRIRIRIRIRIRIRIRIRIRIRI
IDIDIDIDIDIDIDIDIDIDIDIDIDIDIDIDIDIDIDIDIDIDIDIDIDIDIDIDIDIDIDIDIDIDIDIDIDIDIDIDIDIDIDIDIDIDIDIDID
BCBCBCBCBCBCBCBCBCBCBCBCBCBCBCBCBCBCBCBCBCBCBCBCBCBCBCBCBCBCBCBCBCBCBCBCBCBCBCBCBCBCBCBCBCBCBCBCBC ABABABABABABABABABABABABABABABABABABABABABABABABABABABABABABABABABABABABABABABABABABABABABABABABAB
NSNSNSNSNSNSNSNSNSNSNSNSNSNSNSNSNSNSNSNSNSNSNSNSNSNSNSNSNSNSNSNSNSNSNSNSNSNSNSNSNSNSNSNSNSNSNSNSNSQCQCQCQCQCQCQCQCQCQCQCQCQCQCQCQCQCQCQCQCQCQCQCQCQCQCQCQCQCQCQCQCQCQCQCQCQCQCQCQCQCQCQCQCQCQCQCQCQCONONONONONONONONONONONONONONONONONONONONONONONONONONONONONONONONONONONONONONONONONONONONONONONONON
MBMBMBMBMBMBMBMBMBMBMBMBMBMBMBMBMBMBMBMBMBMBMBMBMBMBMBMBMBMBMBMBMBMBMBMBMBMBMBMBMBMBMBMBMBMBMBMBMBSKSKSKSKSKSKSKSKSKSKSKSKSKSKSKSKSKSKSKSKSKSKSKSKSKSKSKSKSKSKSKSKSKSKSKSKSKSKSKSKSKSKSKSKSKSKSKSKSK
ILILILILILILILILILILILILILILILILILILILILILILILILILILILILILILILILILILILILILILILILILILILILILILILILIL
KSKSKSKSKSKSKSKSKSKSKSKSKSKSKSKSKSKSKSKSKSKSKSKSKSKSKSKSKSKSKSKSKSKSKSKSKSKSKSKSKSKSKSKSKSKSKSKSKS
MEMEMEMEMEMEMEMEMEMEMEMEMEMEMEMEMEMEMEMEMEMEMEMEMEMEMEMEMEMEMEMEMEMEMEMEMEMEMEMEMEMEMEMEMEMEMEMEME
MSMSMSMSMSMSMSMSMSMSMSMSMSMSMSMSMSMSMSMSMSMSMSMSMSMSMSMSMSMSMSMSMSMSMSMSMSMSMSMSMSMSMSMSMSMSMSMSMS
MOMOMOMOMOMOMOMOMOMOMOMOMOMOMOMOMOMOMOMOMOMOMOMOMOMOMOMOMOMOMOMOMOMOMOMOMOMOMOMOMOMOMOMOMOMOMOMOMO
MTMTMTMTMTMTMTMTMTMTMTMTMTMTMTMTMTMTMTMTMTMTMTMTMTMTMTMTMTMTMTMTMTMTMTMTMTMTMTMTMTMTMTMTMTMTMTMTMT
NENENENENENENENENENENENENENENENENENENENENENENENENENENENENENENENENENENENENENENENENENENENENENENENENE
NMNMNMNMNMNMNMNMNMNMNMNMNMNMNMNMNMNMNMNMNMNMNMNMNMNMNMNMNMNMNMNMNMNMNMNMNMNMNMNMNMNMNMNMNMNMNMNMNM
NDNDNDNDNDNDNDNDNDNDNDNDNDNDNDNDNDNDNDNDNDNDNDNDNDNDNDNDNDNDNDNDNDNDNDNDNDNDNDNDNDNDNDNDNDNDNDNDND
OKOKOKOKOKOKOKOKOKOKOKOKOKOKOKOKOKOKOKOKOKOKOKOKOKOKOKOKOKOKOKOKOKOKOKOKOKOKOKOKOKOKOKOKOKOKOKOKOK
OROROROROROROROROROROROROROROROROROROROROROROROROROROROROROROROROROROROROROROROROROROROROROROROROR
PAPAPAPAPAPAPAPAPAPAPAPAPAPAPAPAPAPAPAPAPAPAPAPAPAPAPAPAPAPAPAPAPAPAPAPAPAPAPAPAPAPAPAPAPAPAPAPAPA
SDSDSDSDSDSDSDSDSDSDSDSDSDSDSDSDSDSDSDSDSDSDSDSDSDSDSDSDSDSDSDSDSDSDSDSDSDSDSDSDSDSDSDSDSDSDSDSDSD
UTUTUTUTUTUTUTUTUTUTUTUTUTUTUTUTUTUTUTUTUTUTUTUTUTUTUTUTUTUTUTUTUTUTUTUTUTUTUTUTUTUTUTUTUTUTUTUTUT
WAWAWAWAWAWAWAWAWAWAWAWAWAWAWAWAWAWAWAWAWAWAWAWAWAWAWAWAWAWAWAWAWAWAWAWAWAWAWAWAWAWAWAWAWAWAWAWAWA
WYWYWYWYWYWYWYWYWYWYWYWYWYWYWYWYWYWYWYWYWYWYWYWYWYWYWYWYWYWYWYWYWYWYWYWYWYWYWYWYWYWYWYWYWYWYWYWYWY
AKAKAKAKAKAKAKAKAKAKAKAKAKAKAKAKAKAKAKAKAKAKAKAKAKAKAKAKAKAKAKAKAKAKAKAKAKAKAKAKAKAKAKAKAKAKAKAKAK
NJNJNJNJNJNJNJNJNJNJNJNJNJNJNJNJNJNJNJNJNJNJNJNJNJNJNJNJNJNJNJNJNJNJNJNJNJNJNJNJNJNJNJNJNJNJNJNJNJ
NBNBNBNBNBNBNBNBNBNBNBNBNBNBNBNBNBNBNBNBNBNBNBNBNBNBNBNBNBNBNBNBNBNBNBNBNBNBNBNBNBNBNBNBNBNBNBNBNBPEPEPEPEPEPEPEPEPEPEPEPEPEPEPEPEPEPEPEPEPEPEPEPEPEPEPEPEPEPEPEPEPEPEPEPEPEPEPEPEPEPEPEPEPEPEPEPEPE
Strategic locations and extensive geographic presence provide an integratedwarehouse network that is fundamental to customers’ ability to optimize their distribution networks
Public
Production Advantaged
Facility Leased
Third-Party Managed
Distribution
NY008V6E / 1157235_1.worNY008V6E / 1157235_1.worNY008V6E / 1157235_1.worNY008V6E / 1157235_1.worNY008V6E / 1157235_1.worNY008V6E / 1157235_1.worNY008V6E / 1157235_1.worNY008V6E / 1157235_1.worNY008V6E / 1157235_1.worNY008V6E / 1157235_1.worNY008V6E / 1157235_1.worNY008V6E / 1157235_1.worNY008V6E / 1157235_1.worNY008V6E / 1157235_1.worNY008V6E / 1157235_1.worNY008V6E / 1157235_1.worNY008V6E / 1157235_1.worNY008V6E / 1157235_1.worNY008V6E / 1157235_1.worNY008V6E / 1157235_1.worNY008V6E / 1157235_1.worNY008V6E / 1157235_1.worNY008V6E / 1157235_1.worNY008V6E / 1157235_1.worNY008V6E / 1157235_1.worNY008V6E / 1157235_1.worNY008V6E / 1157235_1.worNY008V6E / 1157235_1.worNY008V6E / 1157235_1.worNY008V6E / 1157235_1.worNY008V6E / 1157235_1.worNY008V6E / 1157235_1.worNY008V6E / 1157235_1.worNY008V6E / 1157235_1.worNY008V6E / 1157235_1.worNY008V6E / 1157235_1.worNY008V6E / 1157235_1.worNY008V6E / 1157235_1.worNY008V6E / 1157235_1.worNY008V6E / 1157235_1.worNY008V6E / 1157235_1.worNY008V6E / 1157235_1.worNY008V6E / 1157235_1.worNY008V6E / 1157235_1.worNY008V6E / 1157235_1.worNY008V6E / 1157235_1.worNY008V6E / 1157235_1.worNY008V6E / 1157235_1.worNY008V6E / 1157235_1.wor

7
A Global Market Leader in Temperature-Controlled Warehousing
Position as a global market leader allows us to realize economies of scale, reduce operating costs and lower our overall
cost of capital. Ideally positioned to compete for customers and external growth opportunities
RankMarket Share
Cubic Ft (mm) Rank
Market Share
Cubic Ft (mm)
Lineage Logistics #1 29.3% 1,083 Lineage Logistics #1 6.0% 1,334
#2 26.4% 976 #2 4.8% 1,070
US Cold Storage, Inc. #3 8.5% 312 US Cold Storage, Inc. #3 1.4% 312
AGRO Merchants Group #4 3.1% 115 AGRO Merchants Group #4 1.2% 256
Interstate Warehousing, Inc. #5 2.7% 100 Nichirei Logistics Group, Inc. #5 0.8% 181
Burris Logistics #6 1.9% 72 Kloosterboer B.V. #6 0.8% 171
Henningsen Cold Storage Co. #7 1.7% 65NewCold Advanced Cold
Logistics#7 0.8% 170
NewCold Advanced Cold Logistics
#8 1.3% 48 VersaCold Logistics Services #8 0.6% 133
Hanson Logistics #9 1.2% 44 Emergent Cold Storage #9 0.5% 121
Seafrigo Logistics #10 0.8% 30 VX Cold Chain Logistics #10 0.5% 103
Global Market (2)U.S. Market (1)
TOTAL (3) 77.0% 2,844 17.4% 3,851
Note: Americold portfolio figures provided by the Company as of June 30, 2019. As of January 2018, USDA has changed the definition surrounding the capacity of domestic refrigerated warehouses. Warehouses must meet additional criteria to be included in the publication. Figures may not sum due to rounding(1) IARW Top Companies in USA and North America, August 2019 and USDA National Agricultural Statistics Service, “Refrigerated Space: By Type of Warehouse” chart(2) GCCA and IARW Top Companies in USA and North America, August 2019(3) The remaining 23.0% and 82.6% of the U.S. and global markets consist of ~848.1mm cubic feet and ~18.3bn cubic feet, respectively

33%28%
27%30%
WestEast
CentralSoutheast
Retail ⁽²⁾Packaged Foods ⁽³⁾
Poultry
Potatoes
OtherDairy
Fruits & Vegetables
Pork
Beef
Bakery
Distributors ⁽⁴⁾
Seafood
22%
16%
13%
10%
9% 8%
6%
6%
3%
3%
3%2%
United States
Australia
New Zealand
Argentina
86%
11%
2%
1%
Highly Diversified Business Model Produces Stable Cash Flows
Note: Figures may not sum due to rounding. Figures pro forma for the acquisition of Cloverleaf and Lanier, including 2 months of COLD ownership and 10 months of prior ownership(1) Diversification based on warehouse segment revenues for the twelve months ended June 30, 2019(2) Retail reflects a broad variety of product types from retail customers(3) Packaged food reflects a broad variety of temperature-controlled meals and foodstuffs(4) Distributors reflects a broad variety of product types from distribution customers
Pro Forma Commodity (1) Pro Forma Global Geographic Diversity (1)
Diversification helps reduce revenue volatility associated with seasonality and changing commodity trends
Pro Forma Warehouse Type (1)
U.S. WarehouseGlobal Warehouse
52%
21%
26%
1%
DistributionProduction Advantaged
Public Warehouse
Facility Leased
8
47%
22%
30%
1%
Distribution
Production Advantaged
Public Warehouse
Facility Leased
LTM 6/30/19 WAREHOUSE
REVENUE
LTM 6/30/19 WAREHOUSE
REVENUE
LTM 6/30/19TOTAL U.S.
WAREHOUSEREVENUE
LTM 6/30/19 WAREHOUSE
REVENUE
LTM 6/30/19 WAREHOUSE
CONTRIBUTION (NOI)

Long Standing Relationships with Top 25 Customers
9(1) Represents long-term issuer ratings as published in August 2019(2) Based on LTM warehouse revenues as of June 30, 2019. Figures pro forma for the acquisition of Cloverleaf and Lanier, including 2 months of COLD ownership and 10 months of prior ownership
Scope and scale of network coupled with long-standing relationships position the Company
to grow market share organically and through acquisitions
25 largest customers account for approximately 60% (2) of warehouse revenues, with no customer generating more than 8% (2) of revenues
Have been with Americold for an average of
30+ years
14 customers are investment grade (1)
100% utilize multiple facilities
100% utilize technology integration
88% utilize value-add services
88% utilize committed contracts or leases
56% are in fully dedicated sites
44% utilize transportation and consolidation
services
Top 25 CustomersRepresentative Food Producers / CPG Companies
Representative Retailers / Distributors

75%
78%
76%
75% 74%
76% 74%
73%
77% 77% 77%
81% 82% 81%
76% 78%
77% 76%
80% 79%
77% 77%
81%
84%
80%
'16 '17 '18 '19 '16 '17 '18 '19 '16 '17 '18 '16 '17 '18 '16 '17 '18 LTM
7,0006,800
7,000 7,1007,350
7,6007,850
8,300
8,5009,000 8,800
8,3008,500
5,000
6,000
7,000
8,000
9,000
10,000 Physical Occupancy Economic Occupancy
Economic Occupancy Driving Improved Returns
Physical Occupancy Average Physical and Economic Occupancy Trend
Optimal physical occupancy across our temperature-controlled warehouse portfolio is ~85%
– Varies based on several factors, including intended customer base, throughput maximization, seasonality and leased but unoccupied pallets
Illustrative Economic Occupancy (1)
X X X X
X X
X X
X X X X
Warehouse Pallets
X
Contractually Reserved Pallets
Implementation of our standard underwriting procedures has contributed to consistent occupancy growth over the last three years
(1) Example assumes 10,000 pallet positions and is for illustrative purposes only
Illustrative Economic Occupancy: 85% vs.
Illustrative Physical Occupancy: 78%
10
Economic Occupancy
Significantly increased fixed commitment contracts in our portfolio
Economic occupancy reflects the aggregate number of physically occupied pallets and any additional pallets otherwise contractually committed for a given period, without duplication
Currently Occupied
1Q 2Q 3Q 4Q Annual
6/30/19
Note: Dotted lines represent incremental average economic occupancy percentage

Growing Committed Revenue in Warehouse Portfolio
(1) Based on the annualized committed rent and storage revenues attributable to fixed storage commitment contracts and leases as of LTM June 30, 2019(2) Based on total warehouse segment revenue generated by contracts with fixed storage commitments and leases for LTM June 30, 2019(3) Represents weighted average term for contracts featuring fixed storage commitments and leases as of June 30, 2019(4) Figures pro forma for the acquisition of Cloverleaf and Lanier, including 2 months of COLD ownership and 10 months of prior ownership
43% 44% 44% 45% 49% 45%
57% 56% 56% 55% 51%
55%
$1,156mm $1,162mm $1,169mm $1,177mm $1,178mm
$1,424mm
1Q18 2Q18 3Q18 4Q18 1Q19 2Q19 ⁽⁴⁾
39% 40% 42% 43% 43% 38%
61% 60% 58% 57% 57% 62%
$508mm $511mm $513mm $515mm $515mm
$605mm
1Q18 2Q18 3Q18 4Q18 1Q19 2Q19 ⁽⁴⁾
LTM Rent & Storage Warehouse Revenue
LTM Total Warehouse Segment Revenue
Significant improvement transitioning from as-utilized, on demand contracts to fixed storage committed contracts and leases
Fixed storage committed contracts and leases currently represent:
– 38% of warehouse rent and storage revenues (1) and
– 45% of total warehouse segment revenues (2)
6-year weighted average stated term (3)
3-year weighted average remaining term (3)
As of June 30, 2019, we had entered into at least one fixed commitment contract or lease with 22 of our top 25warehouse customers
The scope and breadth of our network positions us to continue to increase our fixed storage commitments
The addition of the Cloverleaf portfolio served to reduce the committed rent and storage revenue as a percentage of total revenue and represents an opportunity going forward
11
Annualized Committed Rent & Storage Revenue (1)Other Rent & Storage Revenue
Warehouse Segment Revenue Generated by Fixed Commitment Contracts or Leases (2)
Other Warehouse Segment Revenue

Warehouse Financial Summary
Warehouse Revenue ($mm) Warehouse NOI ($mm)
Rent and Storage Revenue CAGR: 3.7% Rent and Storage NOI CAGR: 5.4%
Actual $ Actual $
Warehouse Services Revenue CAGR: 5.0% Warehouse Services NOI CAGR: 40.0%
Total 2015A – LTM 6/30/2019 CAGR: 4.4% Total 2015A – LTM 6/30/2019 CAGR: 7.7%
$469 $477 $502 $515 $532
$588 $604 $644 $662 $698
$1,057 $1,081 $1,146 $1,177
$1,231
2015A 2016A 2017A 2018A LTM 6/30/19
Rent & Storage Warehouse Services
Contribution (NOI) Margin
29% 29% 30% 32% 32%
2015A – LTM 6/30/19 margin expansion: 329 bps
Margin expansion has been driven by improved commercialization and customer mix, contractual rate increases, occupancy growth and operational improvements
12
$294 $303 $324 $338 $353
$14 $11 $24
$37 $45
$308 $314 $348
$375 $399
2015A 2016A 2017A 2018A LTM 6/30/19
Rent & Storage Warehouse Services
2.3%
CC $
3.2%
2.8%
4.1%
CC $
36.1%
6.3%
Same Store Rent & Storage Revenue per Occupied Pallet Growth
0.9% 2.5% 4.1% 5.0% 4.1%
2015A – LTM 6/30/19 Average Growth: 3.3%

Labor ($0.45)
OtherFacilityCosts
Substantially All Warehouse NOI Driven by Rental & Storage RevenueEx
pe
nse
sR
eve
nu
es
Rent & Storage Warehouse Services Total Warehouse
=
$0.43 $0.57 $1.00
OtherServices
Costs($0.09)
($0.06)
($0.09)
($0.45)
($0.09)
+
$0.29 $0.04 $0.32
=+
Power and utilities
Real Estate Related Costs: facilitymaintenance, property taxes, insurance,
rent, security, sanitation, etc.
Direct labor, overtime, contract labor, indirect labor, workers’
compensation and benefits
MHE (1), warehouse operations (pallets, shrink wrap, OS&D and D&D (2))
and warehouse administration
REIT: Rent & StorageTRS: Warehouse Services
Commentary
Power ($0.06)
($0.09)
Note: Based on LTM warehouse segment as of June 30, 2019. Future results may vary. Figures may not sum due to rounding(1) Material Handling Equipment(2) OS&D and D&D refer to Over Short & Damaged and Detentioned & Demurrage, respectively
66% 6% 32%NO
I
--
--
--
--
Margin:
% WH Total: 89% 11% 100%
13

Positioned for Multiple Avenues of Growth
14
Global warehouse network, operating systems, scalable information technology platform and economies of scale provide a significant advantage over competitors with respect to organic and external growth opportunities
External Growth and Expansion Opportunities
Expand Presence in Other
Temperature Sensitive Products in the Cold Chain
Customer-Specific Build-to-Suit
& Market-Driven Development
Redevelopment & Existing Site
Expansion
Industry Consolidation
Global Food Producers
Outsourcing &Sale-Leaseback Opportunities
Underwriting& Contract
StandardizationRate Escalations
/ Occupancy Increases
1
2
4
5
6
7
8
OperationalEfficiencies
& CostContainment
3
Organic Growth Opportunities Development and Redevelopment
Signifies COLD has capitalized on growth opportunity

6.1%
2.9%
9.5%
7.4%
3.9% 5.1% ⁽¹⁾
2015 2016 2017 2018 YTD 2019
137
23
6
83%
14%
4%
Organic Growth Initiatives Have Driven Same Store Growth
15
Constant Currency $ Growth %
Actual $ Growth %
Note: Figures as of June 30, 2019, unless otherwise indicatedNote: Constant currency growth represents year-over-year growth based on the same foreign exchange rates relative to the comparable prior year periodNote: NOI growth represents year-over-year growth to the comparable prior period(1) YTD 2019 growth rate reflects adjustments for certain workers compensation expense benefit in 2018(2) Figures are pro forma for the acquisition of Cloverleaf and Lanier
Total Same Store Warehouse NOI GrowthSame Store Warehouse Revenue Growth
Same store performance is the culmination of replacing legacy customer agreements with new contracts implementing our Commercial Business Rules, active asset management and leveraging integrated network, scale and market position
Same Store NOI MarginYTD Same Store Portfolio (2)
TOTAL COLD WAREHOUSE
FACILITIES
166
Constant Currency $ Growth %
Actual $ Growth %
2.9%6.1%3.2% 6.9%9.8%2.1%1.0% 2.6%1.6%
Total SS Warehouse
SS Rent & Storage
SS Warehouse Services
3.2%
Same store warehouse revenue growth expected to range between 2% - 4% on a constant currency basis and same store NOI growth to be 100 to 200 basis points higher than the associated revenue
29.5% 29.8% 30.9% 32.1% 32.1%
63.0% 64.5% 65.5% 66.2% 66.9%
2.5% 2.0% 4.0% 5.8% 5.8%
0.0%
20.0%
40.0%
60.0%
80.0%
2015 2016 2017 2018 YTD 2019
4.9% 4.1%
5.8%
3.9% 3.1%
2015 2016 2017 2018 YTD 2019
Legacy COLD Same Store
Acquired Non-Same Store
Legacy COLD Non-Same Store
Non-Same Store
Same Store

Customer-Specific
Build-to-Suit for High Quality Tenant
Investment Grade Customer
Within Targeted Return Range
Growth Strategy – Expansion, Development and Acquisitions
35.8mm Cu Ft~124,000 Pallets
Completed
Since 2014
Expect to initiate on average 2 to 3 expansion / development opportunities annually,with aggregate invested capital of $75 million to $200 million
Existing Sites for Future Expansion
Development of New Sites
700+ acres landadjacent to
60+ warehouses
Customer-Specific
Market-Demand +
Estimated Costs ⁽²⁾
~$261mm42.3mm Cu Ft126,000 Pallets
Includes both customer-specificand market-demand
Estimated Investment (6)
$1bn+
Under Construction
FuturePipeline (5)
4 Expansions / 1 New Build
Expansion and Development Opportunities (1)
85+ acres landadjacent to
9 warehouses
Estimated Costs (4)
~$600mmAustralian Development (3)
3 DevelopmentsBrisbane, QueenslandMelbourne, Victoria
Sydney, New South Wales Target Completion Date (2): 2022 to 2024
16
Phoenix, AZ
Leesport, PA
East Point, GA
Clearfield, UT
Middleboro, MA Incurred Cost
$180mm
Savannah, GA
Atlanta, GA
Rochelle, IL
North Little Rock, AR
Columbus, OH
Chesapeake, VA
(1) As of June 30, 2019; no assurance can be given that the actual cost or completion dates of any expansions or developments will not exceed our estimate(2) Reflects management’s estimate of cost of completion as of June 30, 2019(3) The Letter of Intent is not a binding agreement and the planned transactions are subject to negotiation of definitive documentation, receipt of any necessary approvals by us and customer, and
other conditions. The consummation of these transactions may not be completed at all, or may not be completed in the time frame, on the terms or in the manner currently anticipated. There are a number of risks and uncertainties relating to the transactions
(4) Based on management’s preliminary estimates; there is no assurance that the actual cost or completion dates will not exceed our estimate(5) These future pipeline opportunities are at various stages of discussion and consideration and, based on historical experiences, many of them may not be pursued or completed as contemplated or
at all and there is no assurance that our budgeted unlevered stabilized returns will be achieved(6) Estimated investment excludes costs related to the current under construction development projects
Acquired land in Sydney, NSW for $43mm
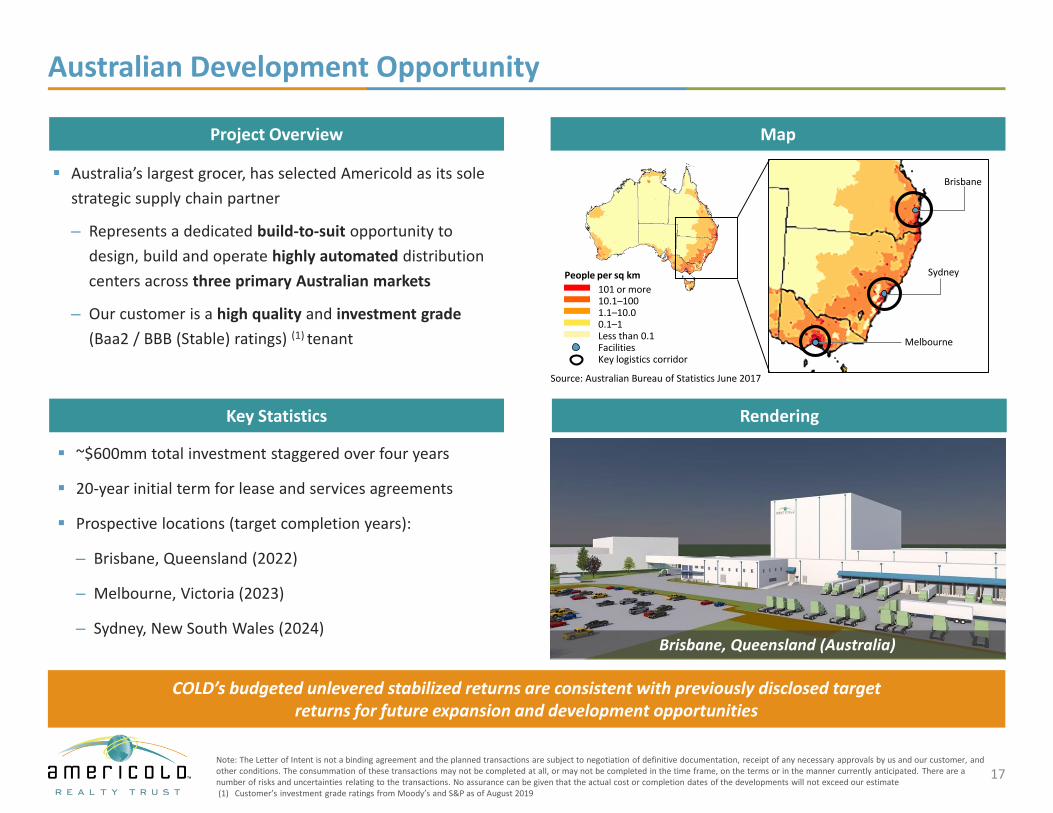
Australian Development Opportunity
Australia’s largest grocer, has selected Americold as its sole
strategic supply chain partner
– Represents a dedicated build-to-suit opportunity to
design, build and operate highly automated distribution
centers across three primary Australian markets
– Our customer is a high quality and investment grade
(Baa2 / BBB (Stable) ratings) (1) tenant
~$600mm total investment staggered over four years
20-year initial term for lease and services agreements
Prospective locations (target completion years):
– Brisbane, Queensland (2022)
– Melbourne, Victoria (2023)
– Sydney, New South Wales (2024)Brisbane, Queensland (Australia)
MapProject Overview
RenderingKey Statistics
COLD’s budgeted unlevered stabilized returns are consistent with previously disclosed targetreturns for future expansion and development opportunities
People per sq km
101 or more
0.1–11.1–10.010.1–100
FacilitiesLess than 0.1
Key logistics corridor
Source: Australian Bureau of Statistics June 2017
Sydney
Brisbane
Melbourne
17Note: The Letter of Intent is not a binding agreement and the planned transactions are subject to negotiation of definitive documentation, receipt of any necessary approvals by us and our customer, and other conditions. The consummation of these transactions may not be completed at all, or may not be completed in the time frame, on the terms or in the manner currently anticipated. There are a number of risks and uncertainties relating to the transactions. No assurance can be given that the actual cost or completion dates of the developments will not exceed our estimate(1) Customer’s investment grade ratings from Moody’s and S&P as of August 2019

Atlanta Major Market (Atlanta MM) Expansion
18
Americold’s Atlanta MM campus includes several facilities in the market’s core distribution hub
~$126mm-136mm total capital required
Strong market demand is driving the need to expand our Atlanta footprint to meet our customers’ increasing demands
Automation, re-racking and new material handling equipment will allow for customer mix optimization
We expect the returns for this expansion to be within our previously disclosed targeted range for expansion projects
Tradewater
Gateway
Westgate
Southgate
Semi-automatic expansion to be added to the existing site
Fully-automated expansion to be added to the existing site
For efficiency purposes, a portion of the facility is to be re-racked in order to locate Walmart Multi-Vendor and COLD Consolidation Program within a single facility to improve operational efficiency
Preliminary investments in material handling equipment and driver amenities to support new business
Preliminary investments in material handling equipment and driver amenities as a means of positioning Skygate as a future Multi-Vendor Consolidation dedicated site
1173037_1.wor (NY008V6E)
Atlanta, GA
Transaction Overview
Skygate
Note: The consummation of this expansion may not be completed at all, or may not be completed in the time frame, on the terms or in the manner currently anticipated. There are a number of risks and uncertainties relating to this expansion. No assurance can be given that the actual cost or completion dates of the developments will not exceed our estimate
19
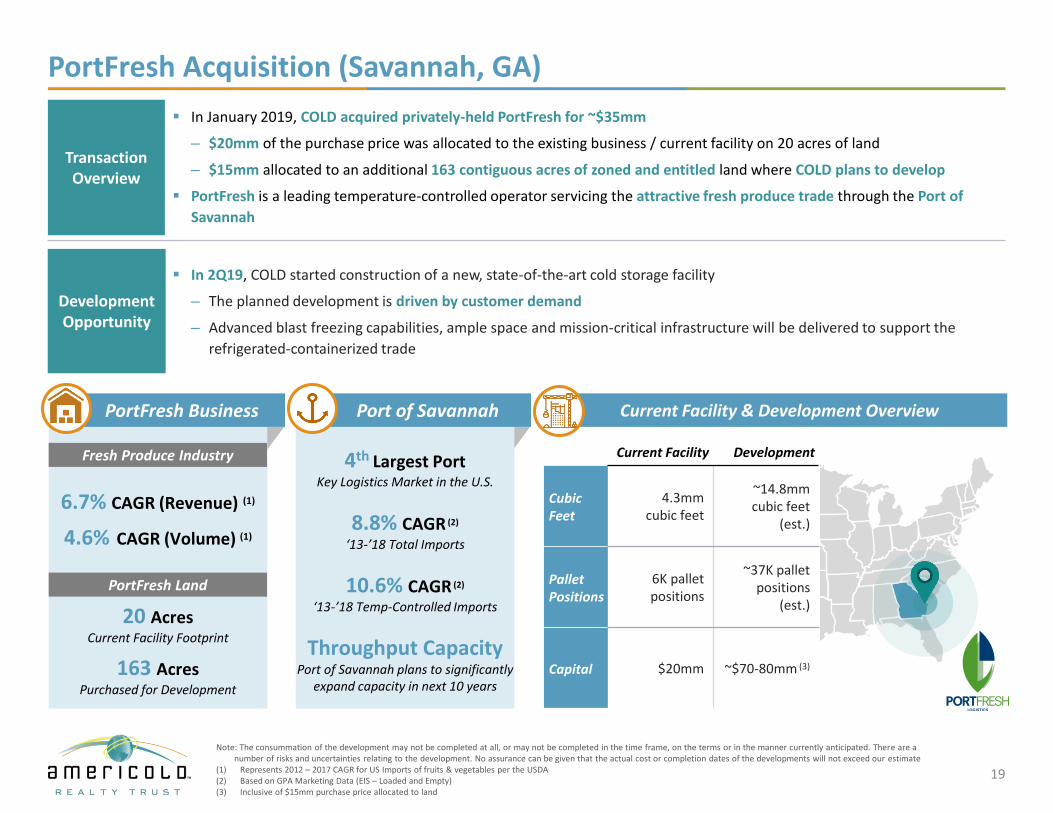
PortFresh Acquisition (Savannah, GA)
Note: The consummation of the development may not be completed at all, or may not be completed in the time frame, on the terms or in the manner currently anticipated. There are a number of risks and uncertainties relating to the development. No assurance can be given that the actual cost or completion dates of the developments will not exceed our estimate
(1) Represents 2012 – 2017 CAGR for US Imports of fruits & vegetables per the USDA(2) Based on GPA Marketing Data (EIS – Loaded and Empty)(3) Inclusive of $15mm purchase price allocated to land
Current Facility Development
CubicFeet
4.3mm cubic feet
~14.8mm cubic feet
(est.)
PalletPositions
6K pallet positions
~37K pallet positions
(est.)
Capital $20mm ~$70-80mm (3)
Current Facility & Development Overview
4th Largest PortKey Logistics Market in the U.S.
8.8% CAGR (2)
‘13-’18 Total Imports
10.6% CAGR (2)
‘13-’18 Temp-Controlled Imports
Throughput Capacity Port of Savannah plans to significantly
expand capacity in next 10 years
6.7% CAGR (Revenue) (1)
4.6% CAGR (Volume) (1)
20 AcresCurrent Facility Footprint
163 AcresPurchased for Development
Port of SavannahPortFresh Business
Fresh Produce Industry
PortFresh Land
In January 2019, COLD acquired privately-held PortFresh for ~$35mm
– $20mm of the purchase price was allocated to the existing business / current facility on 20 acres of land
– $15mm allocated to an additional 163 contiguous acres of zoned and entitled land where COLD plans to develop
PortFresh is a leading temperature-controlled operator servicing the attractive fresh produce trade through the Port of
Savannah
Development Opportunity
In 2Q19, COLD started construction of a new, state-of-the-art cold storage facility
– The planned development is driven by customer demand
– Advanced blast freezing capabilities, ample space and mission-critical infrastructure will be delivered to support the
refrigerated-containerized trade
Transaction Overview

20
Cloverleaf Cold Storage Acquisition
9 STATES22 FACILITIES
TOTALFACILITIES 22
REFRIGERATEDCUBIC FEET 132mm
BUILDINGSQUARE FEET 5.2mm
TOP 10 CUSTOMERS(100% Overlap with COLD Customers)
NUMBER OF CUSTOMERS 360+
Asset locations denoted by bubbles of relative size, approximating facility size
based on refrigerated cubic feet
LEGEND
Fifth largest temperature-controlled warehouse company in the United States (1)
Total purchase price of approximately $1.24bn
Immediately accretive (pre-COLD synergies and leverage neutral)
Cloverleaf acquisition enhances the Company’s integrated warehouse network while expanding relationships with overlapping customers, with additional synergy opportunities available through integration
Current expansion opportunities (3)
Acquired land being considered for a new ground-up development
Note: Does not include expansions and potential new build(1) Based on GCCA data as of the transaction announcement date. Lineage Logistics’ announced acquisition of Preferred Freezer Services had not yet closed and was not reflected in the industry rankings

21
Lanier Cold Storage Acquisition (Gainesville, GA)
In May 2019, COLD announced the acquisition of privately-held Lanier Cold Storage for ~$82mm
– Consists of two temperature-controlled storage facilities served by major highways and railways
– Less than 12 miles from COLD’s Gainesville location
Designed to supply poultry and other products to markets across the U.S.
Potential synergies to be achieved through COLD’s commercialization platform and the Americold Operating System
Facilities“Lanier North” Lula, GA
“Lanier South” Gainesville, GA
Cubic Feet ~14mm cubic feet
PalletPositions
~51K pallet positions “Lanier North”Lula, GA
Lanier Cold Storage acquisition further strengthens the Company’sposition as the leading global owner and operator of temperature-controlled infrastructure
Lanier at a Glance
Transaction Overview

$475
$287
$350$400
$200 -- -- -- -- -- -- --
Series A 4.68% Unsecured NotesSeries B 4.86% Unsecured NotesSeries C 4.10% Unsecured NotesUndrawn Revolver2013 Mortgage LoansUnsecured Term Loan A
% of Debt Maturing
– –45% – 12% – – –– – 23% 20%
Flexible Balance Sheet Positioned for Growth
Capitalization
Debt Maturity (6)
Significant Liquidity: ~$1,466mm (4)
– $800mm Undrawn Senior Unsecured Revolving Credit Facility
Interest Rate: L + 145 bps
Minimal near term debt maturities
Debt Profile
Note: Dollars in millions except per share figures. Figures based on book value as of June 30, 2019. Capitalization excludes net proceeds from 6mm forward equity issued in September 2018 with an outstanding settlement date of no later than September 2020 and 8mm forward equity issued in April 2019 with an outstanding settlement date of no later than April 2020. The Company may settle the forward shares by issuing new shares or may instead elect to cash settle or net share settle all or a portion of the forward shares. Figures may not sum due to rounding
(1) Diluted Shares Outstanding based on closing share price on August 26, 2019, which was $36.47(2) Figures pro forma for the acquisition of Cloverleaf and Lanier, including 2 months of COLD ownership and 10 months of prior ownership(3) Assumes the issuance of ~6mm and ~8mm common shares upon the full physical settlement of the 2018 and 2019 forward sale agreements, respectively(4) Figure reflects cash, forward proceeds and the capacity available under the Senior Unsecured Revolving Credit Facility less ~$30mm in letters of credit(5) Reflects impact of swap agreement for $100mm (2.48%; effective January 31, 2019) and for $225mm (1.30%; effective August 30, 2019) of the Unsecured Term Loan principal(6) Reflects the principal due each period and does not adjust for amortization of principal balances
22
22%
9%
16%
53%
Cash$321
2018 Forward Proceeds
$138
2019 Forward Proceeds
$236
Revolver Availability
$771
$150 Floating
$1,748 Fixed
8%
92%
25%
75%
$473 Secured
$1,425 Unsecured
Rate Type (5) Debt Type
Liquidity (3)
Investment grade ratings (BBB) from Fitch and Morningstar($ in millions) As of 6/30/19
Share Price (as of 8/26/2019) $36.47
Fully Diluted Shares Outstanding (1) 197.149
Equity Market Capitalization $7,190
Debt
Senior Unsecured Revolver ($800mm Capacity) $–
Senior Unsecured Term Loan A 475
Series A 4.68% Unsecured Notes due 2026 200
Series B 4.86% Unsecured Notes due 2029 400
Series C 4.10% Unsecured Notes due 2030 350
2013 Mortgage Loans 287
New Market Tax Credit (NMTC) 13
Sale Leaseback Financing Obligations 117
Capitalized Lease Obligations 55
Total Debt $1,898
Less: Cash and Cash Equivalents (321)
Net Debt $1,577
Total Enterprise Value ("TEV") $8,767
Leverage Metrics
Net Debt / PF LTM Core EBITDA ⁽²⁾ 4.1x
Net Debt / TEV 18.0%
TOTAL LIQUIDITY
$1,466mm
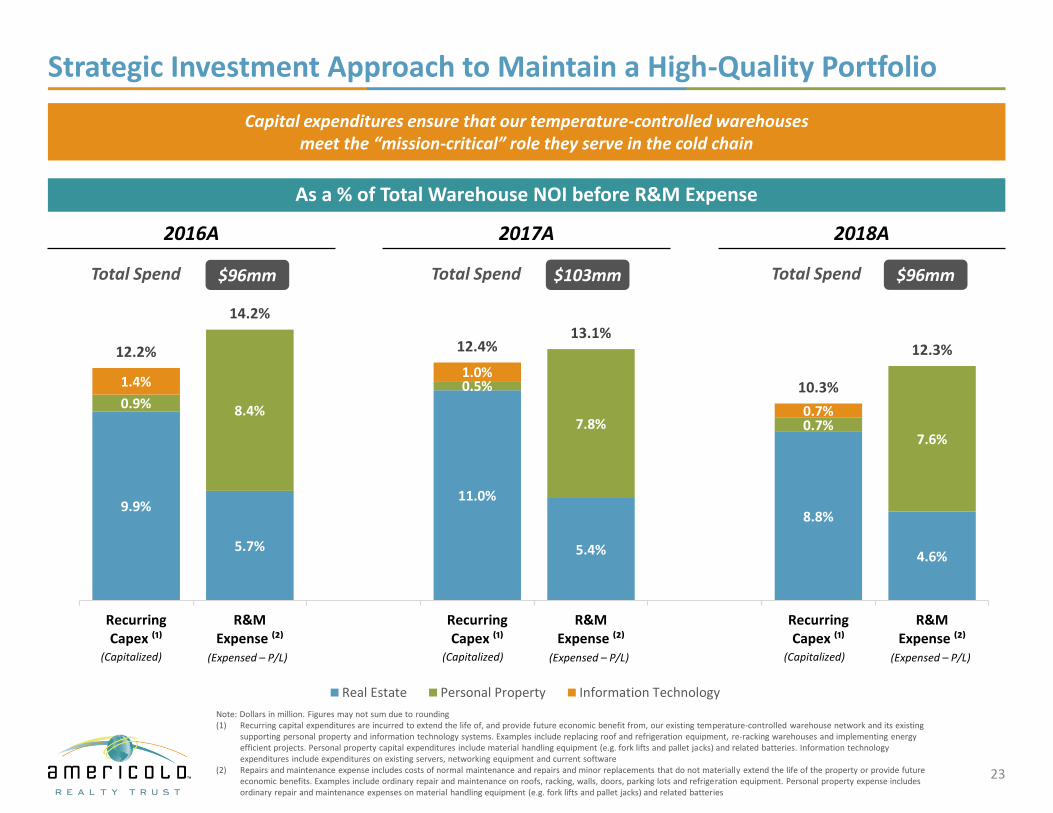
Strategic Investment Approach to Maintain a High-Quality Portfolio
23
Capital expenditures ensure that our temperature-controlled warehousesmeet the “mission-critical” role they serve in the cold chain
As a % of Total Warehouse NOI before R&M Expense
2016A 2017A 2018A
(Capitalized) (Expensed – P/L)
Note: Dollars in million. Figures may not sum due to rounding(1) Recurring capital expenditures are incurred to extend the life of, and provide future economic benefit from, our existing temperature-controlled warehouse network and its existing
supporting personal property and information technology systems. Examples include replacing roof and refrigeration equipment, re-racking warehouses and implementing energy efficient projects. Personal property capital expenditures include material handling equipment (e.g. fork lifts and pallet jacks) and related batteries. Information technology expenditures include expenditures on existing servers, networking equipment and current software
(2) Repairs and maintenance expense includes costs of normal maintenance and repairs and minor replacements that do not materially extend the life of the property or provide future economic benefits. Examples include ordinary repair and maintenance on roofs, racking, walls, doors, parking lots and refrigeration equipment. Personal property expense includes ordinary repair and maintenance expenses on material handling equipment (e.g. fork lifts and pallet jacks) and related batteries
Total Spend $96mm
(Capitalized) (Expensed – P/L) (Capitalized) (Expensed – P/L)
Total Spend $103mm Total Spend $96mm
9.9%
5.7%
11.0%
5.4%
8.8%
4.6%
0.9% 8.4%
0.5%
7.8% 0.7% 7.6%
1.4% 1.0%
0.7%
12.2%
14.2%
12.4% 13.1%
10.3%
12.3%
Recurring Capex ⁽¹⁾
R&M Expense ⁽²⁾
Recurring Capex ⁽¹⁾
R&M Expense ⁽²⁾
Recurring Capex ⁽¹⁾
R&M Expense ⁽²⁾
Real Estate Personal Property Information Technology

Commitment to energy excellence and efficiency
Recognized under the Global Cold Chain Alliance’s (GCCA) new Energy Excellence Recognition Program with Gold and Silver certifications at 56 facilities
Completed LED lighting conversions at 48 facilities since 2011
Noteworthy fast door implementation savings
Food Logistics magazine’s Top Green Service provider for last three years
Strong Approach to Environmental, Social and Governance Initiatives
Social initiatives through various charities
Matching gifts programs through which we encourage our employees to give back to the community
Corporate contributions / support to various charities, such as Feed the Children, Susan G. Komen and HeroBox
Shareholder-friendly corporate governance
Eight of nine board members independent
All committees comprised of independents
Gender diversity at board level
Cannot opt into MUTA without shareholder vote
No poison pill
Non-classified board
Shareholder “Say on Pay”
Environmental
Social
Governance
Awards & Recognition
Charitable Organizations
24

Conclusion
25
Substantial Internal and External Growth Opportunities Expected to Drive Attractive Risk-Adjusted Returns
Experienced Management Team, Alignment of Interest and Best-In-Class Corporate Governance
Important First Mover Advantage as the Only Publicly Traded REIT Focused on Temperature-Controlled Warehouses
Infrastructure Supported by Best-in-Class IT and Operating Platforms Provides a Significant Competitive Advantage
Global Market Leader with Integrated Network of Strategically-Located, High-Quality, “Mission-Critical” Warehouses
Strong and Stable Food Industry Fundamentals Drive Growing Demand for Our Business
1
2
3
4
5
6
7 Investment Grade, Flexible Balance Sheet Positioned for Growth