Investor Presentation January - 2017 - South Indian Bank Investor... · looking...
57
Experience Next Generation Banking Investor Presentation January - 2017
Transcript of Investor Presentation January - 2017 - South Indian Bank Investor... · looking...

Experience Next Generation Banking
Investor PresentationJanuary - 2017

2
Safe Harbor
No representation or warranty, express or implied is made as to, and no relianceshould be placed on, the fairness, accuracy, completeness or correctness of suchinformation or opinions contained herein. The information contained in thispresentation is only current as of its date. Certain statements made in thispresentation may not be based on historical information or facts and may be “forwardlooking statements”, including those relating to the Company’s general business plansand strategy, its future financial condition and growth prospects, and futuredevelopments in its industry and its competitive and regulatory environment. Actualresults may differ materially from these forward-looking statements due to a numberof factors, including future changes or developments in the Company’s business, itscompetitive environment and political, economic, legal and social conditions in India.This communication is for general information purpose only, without regard tospecific objectives, financial situations and needs of any particular person. Thispresentation does not constitute an offer or invitation to purchase or subscribe forany shares in the Company and neither any part of it shall form the basis of or berelied upon in connection with any contract or commitment whatsoever. TheCompany may alter, modify or otherwise change in any manner the content of thispresentation, without obligation to notify any person of such revision or changes. Thispresentation can not be copied and/or disseminated in any manner.

3
Contents
About Us
Q3 FY17 Highlights
Performance Matrix
Next Generation Bank
An Inflection Point
Business Strategy
4
Q3 FY17 Highlights
5
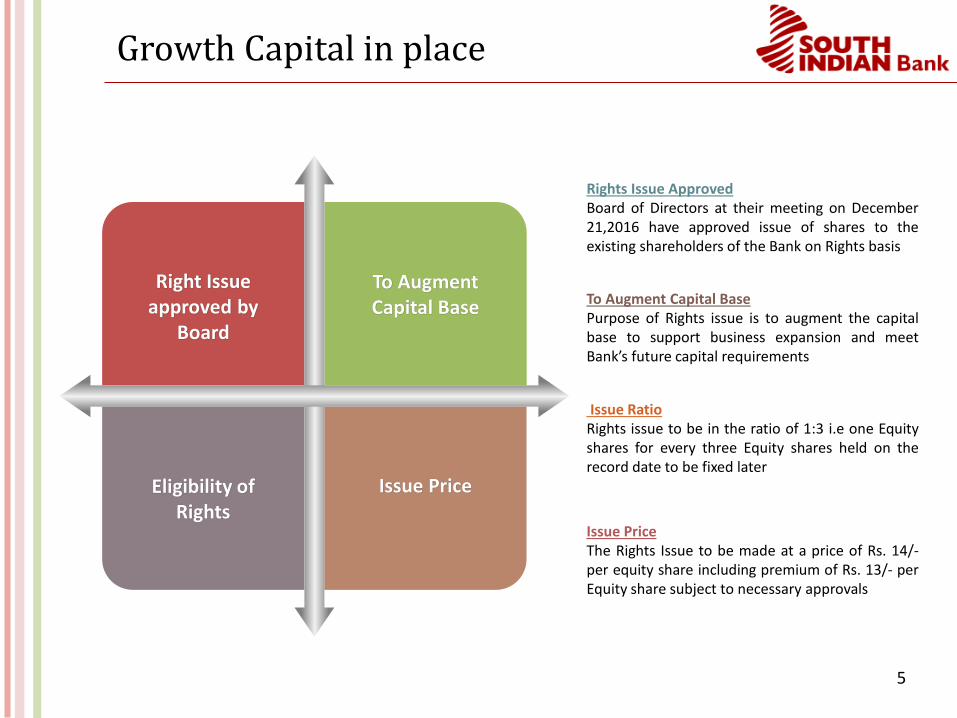
Growth Capital in place
Right Issue approved by
Board
To Augment Capital Base
Eligibility of Rights
Issue Price
Rights Issue ApprovedBoard of Directors at their meeting on December21,2016 have approved issue of shares to theexisting shareholders of the Bank on Rights basis
Issue RatioRights issue to be in the ratio of 1:3 i.e one Equityshares for every three Equity shares held on therecord date to be fixed later
Issue PriceThe Rights Issue to be made at a price of Rs. 14/-per equity share including premium of Rs. 13/- perEquity share subject to necessary approvals
To Augment Capital BasePurpose of Rights issue is to augment the capitalbase to support business expansion and meetBank’s future capital requirements

6
Representative Office in Dubai, UAE
01
02
03
RBI Approval Received foropening RepresentativeOffice in Dubai, UAE
Representative office is inaddition to extensivearrangements with leadingexchange houses
Representative office willboost NRI Banking effortsfor the Bank and expandNRI Customer base

7
Key Performance Highlights- Q3 FY17
Rs in Crores Q3 FY17 Q3 FY16 Growth
PPOP 377 263 43.3%
EBIDTA 17 41 26%Deposits 63,595 53,441 19.0%
Advances 45,234 40,601 11.4%
CASA 16,486 12,307 34.0%
PAT 111.4 101.6 9.6%
8
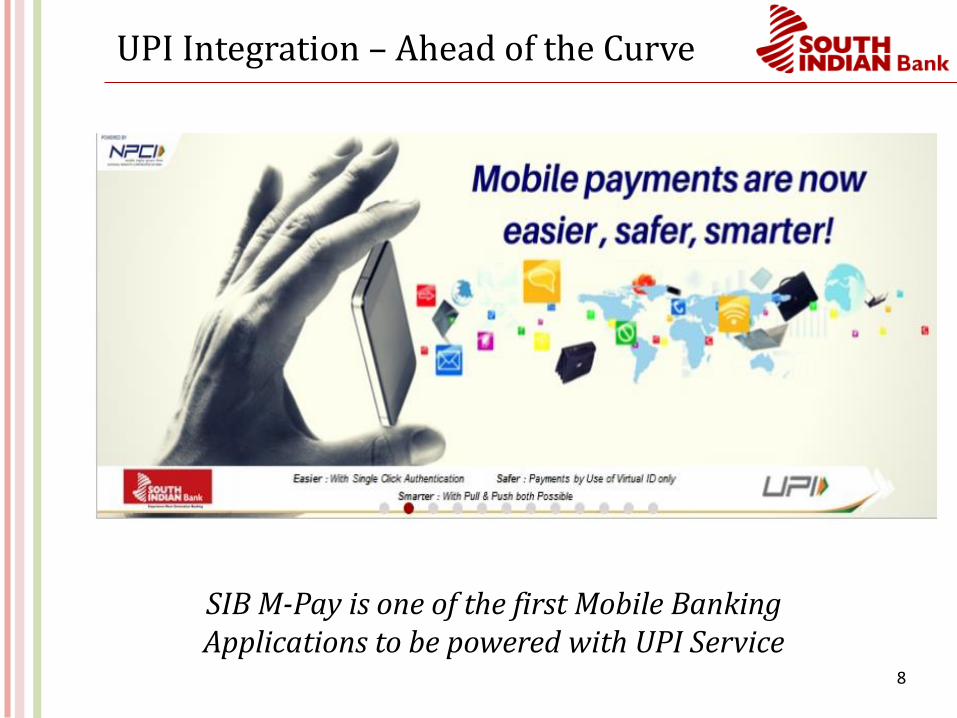
UPI Integration – Ahead of the Curve
SIB M-Pay is one of the first Mobile Banking Applications to be powered with UPI Service

9
Recent Awards
South Indian Bank receives the FIEO Export Excellence Award 2014-15 in the Best Financial Institution Category (Southern Region) from Smt. Nirmala Sitharaman, Hon’ble Minister of State
(Independent Charge) for Commerce & Industry, Govt of India
10
Business Strategy
11
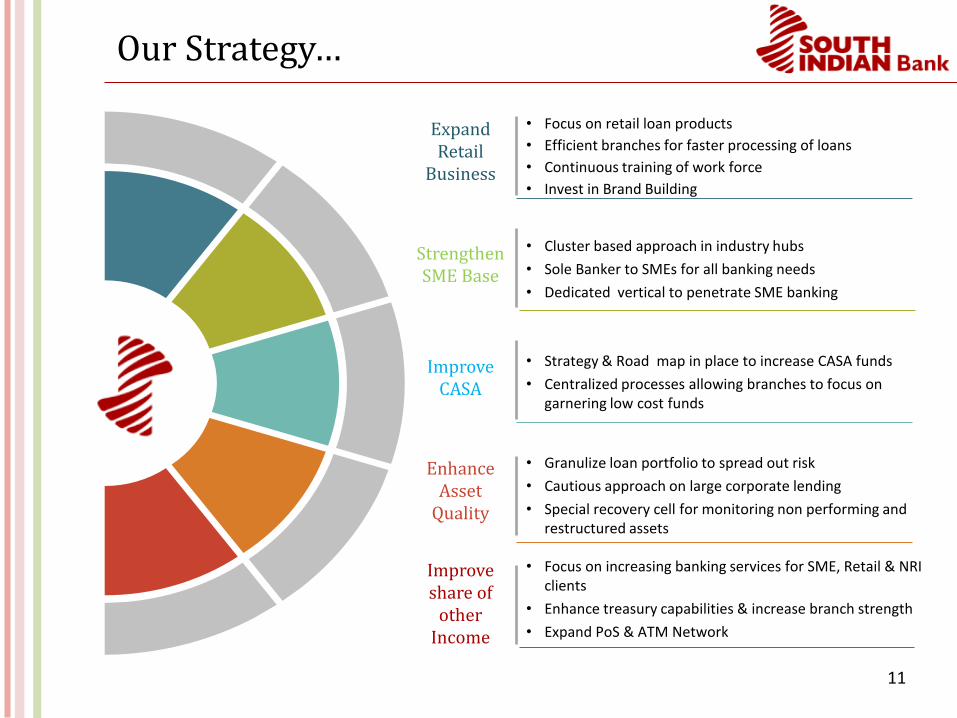
Our Strategy…
• Focus on retail loan products
• Efficient branches for faster processing of loans
• Continuous training of work force
• Invest in Brand Building
Expand Retail
Business
• Cluster based approach in industry hubs
• Sole Banker to SMEs for all banking needs
• Dedicated vertical to penetrate SME banking
Strengthen SME Base
• Strategy & Road map in place to increase CASA funds
• Centralized processes allowing branches to focus on garnering low cost funds
Improve CASA
• Granulize loan portfolio to spread out risk
• Cautious approach on large corporate lending
• Special recovery cell for monitoring non performing and restructured assets
Enhance Asset
Quality
• Focus on increasing banking services for SME, Retail & NRI clients
• Enhance treasury capabilities & increase branch strength
• Expand PoS & ATM Network
Improve share of
other Income
12
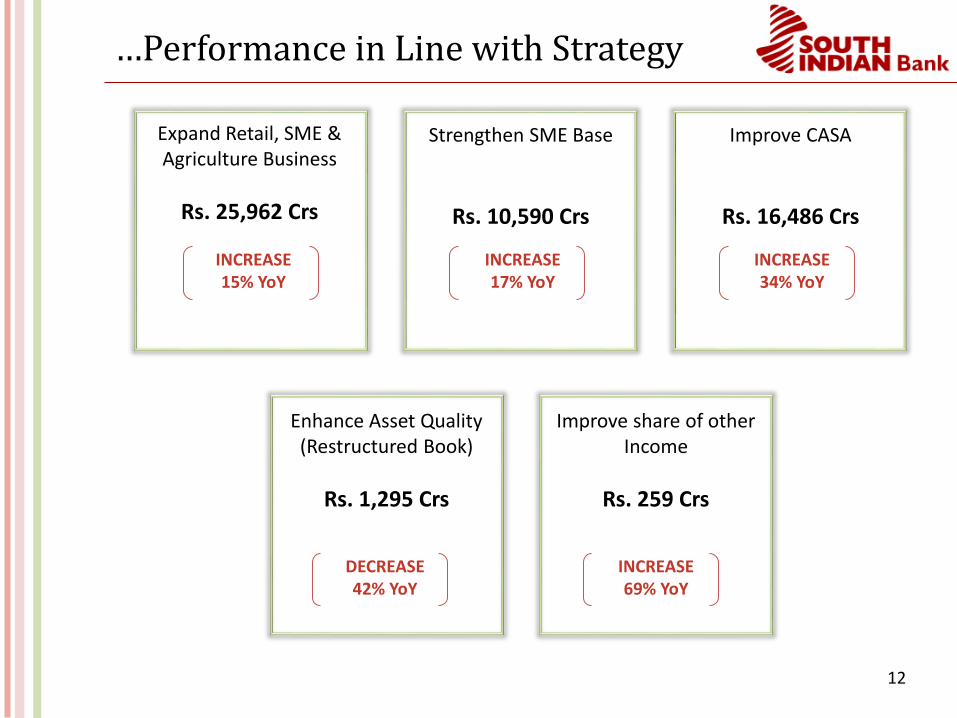
…Performance in Line with Strategy
INCREASE15% YoY
Expand Retail, SME & Agriculture Business
Rs. 25,962 Crs
Strengthen SME Base
Rs. 10,590 Crs
Improve CASA
Rs. 16,486 Crs
Enhance Asset Quality(Restructured Book)
Rs. 1,295 Crs
Improve share of other Income
Rs. 259 Crs
INCREASE17% YoY
INCREASE34% YoY
DECREASE42% YoY
INCREASE69% YoY

13
Shall continue to focus on Core Strengths
01 Increase …
CASA
02 Retail Business …
More Products
03 SME Business …
Sole Banker
04 Improve
NIM
05 Increase…
Fee Income
06 Sustainable…
Asset Quality
RetailRelationships
SMERelationships
14
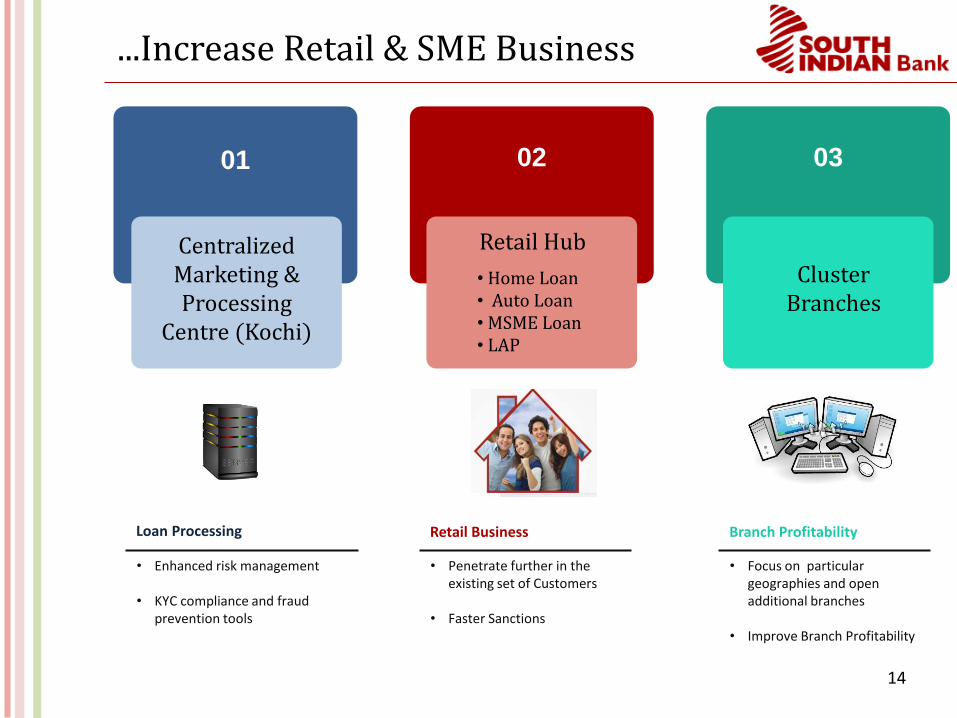
...Increase Retail & SME Business
• Enhanced risk management
• KYC compliance and fraud prevention tools
Loan Processing
• Penetrate further in the existing set of Customers
• Faster Sanctions
Retail Business
• Focus on particular geographies and open additional branches
• Improve Branch Profitability
Branch Profitability
Centralized Marketing & Processing
Centre (Kochi)
01 02 03
Retail Hub
• Home Loan• Auto Loan• MSME Loan• LAP
Cluster Branches

15
…by focus on Housing Loans in Retail
2,499 2,614 2,677 2,756
1,455 1,371 1,417 1,432
1,501 1,564 1,510 1,535
1,9982,521 2,410 2,446
872
973 9251,0941,057
1,049 1,0631,094
2,828
1,290
1,606
2,622
909
1,154
10,358 10,409
Jun-16
10,002
Mar-16 Dec-16Sep-16
9,382
Dec-15
10,093
Retail Breakup
Others
HousingLAD* Manufacturing
Service & Traders Gold
Housing: Key Initiatives
• Retail hub in Kochi to increase focus on housing finance
• Two more hubs to be set up – one in South India and one in North India
• Branch staff being given specific training to market mortgage loans
• Marketing initiative through TVCs
• Tailor made products for different segments
Oct to Dec 2016
• Housing Loans Sanctioned : 807 Nos.
• Amount of Housing Loans Sanctioned – 182 Crs
Rs Crs
*LAD = Loan against deposits

16
…becoming a Banker of Choice to SMEs
Loan Book by Geography – Q3 FY17
• Dedicated DGM appointed to ensure focus and better coordination with regions
• Focused ‘Green Channel’ branches to drive faster loan growth to SMEs
• Target to become banker of choice to SMEs thereby getting other business as well –liabilities, vehicle finance, etc.
• Ongoing training (in-house as well as external)
SME Highlights
Average SME Loan / Account
16.1015.7615.5615.3315.26
Jun-16Dec-15 Sep-16 Dec-16Mar-16
Kerala43%
South (Ex-Kerala)
34%
Rest of India23%
Rs Lakhs

17
…with the help of our Branch Network
Branch Location*No of
Branches
Kerala 455
South India (Ex-Kerala) 245
Rest of India 140
Total 840
Total Branch Network
Total ATM Network
840834822794738688
FY13FY12 9M FY17FY16FY15FY14
+4.1%
1,3131,2871,200
1,000800
663
FY12 FY13 9M FY17FY16FY14 FY15
+14.6%
*Map for illustration purpose only

18
… and our Experienced Employees
Total Employees: 6,983*
3% 5%
37%
31%
24%
< 1 Year 1-2 Years 2-5 Years
5-10 Years > 10 Years
Employee Addition
41
32 53
Sep-16Jun-16 Dec-16 Closing
6,983
Mar-16Dec-15
7,048
*Employees include full-time officers and clerks.
19
Performance Matrix
20
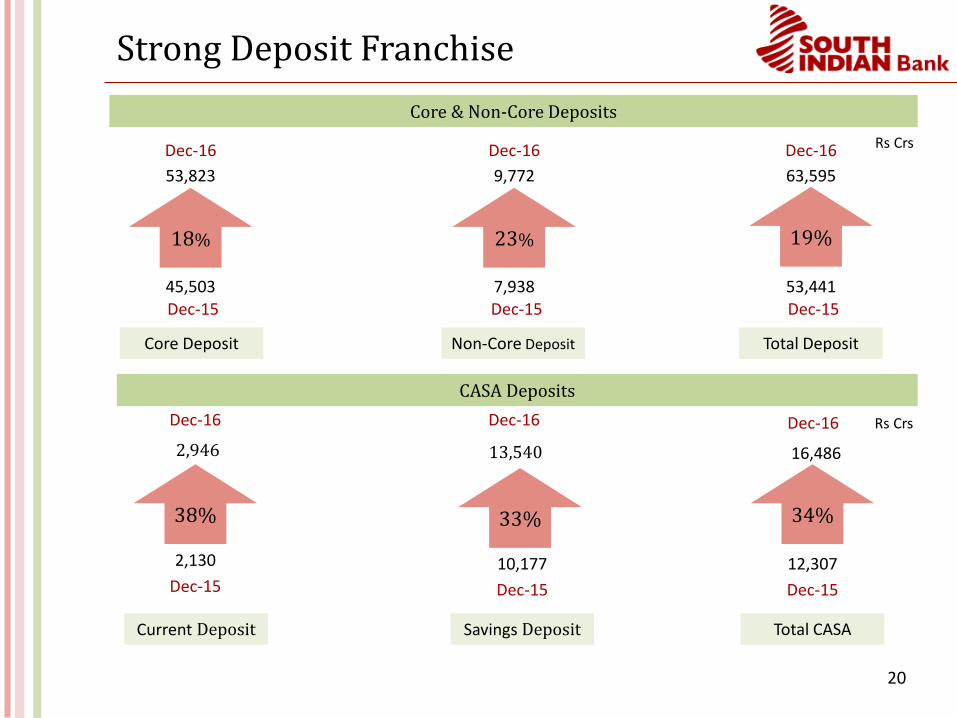
Strong Deposit Franchise
Core & Non-Core Deposits
CASA Deposits
18%
Core Deposit Non-Core Deposit Total Deposit
Dec-16 Dec-16
Dec-15 Dec-1545,503
53,823
53,441
63,595
19%
Current Deposit Savings Deposit Total CASA
Dec-16 Dec-16 Dec-16
Dec-15 Dec-15 Dec-15
2,130 10,177
13,540
12,307
16,486
38% 33% 34%
2,946
Rs Crs
Rs Crs
23%
Dec-16
Dec-157,938
9,772

21
Core Deposits Growing...
Breakup of Deposits
7,930 9,203 9,205 10,215 9,693
10,177 10,476 11,267 11,299 13,540
33,20434,059
35,23036,279
37,415
2,946
Dec-16Sep-16Jun-16
2,187 2,399
60,19257,889
Mar-16
53,441
2,130 1,983
55,721
Dec-15
63,595
Term Others*CurrentSavings
CASA Deposit
12,3072,130
Dec-15 Dec-16
10,177
16,486
13,540
2,946
+34%
Term Deposits
37,41533,204
Dec-15
+13%
Dec-16
Rs Crs Rs Crs
SavingsCurrent
Rs Crs
*Others includes: Bulk, Certificates of Deposits

22
NRI Deposits Growing…
23.0 22.4
23.2 22.8
25.9
Dec-15 Mar-16 Jun-16 Sept-16 Dec-16
CASA NRI Deposits
16,31715,476
15,02514,303
13,566
Mar-16Dec-15 Jun-16 Dec-16Sep-16
+20%
In (%)Rs Crs
23
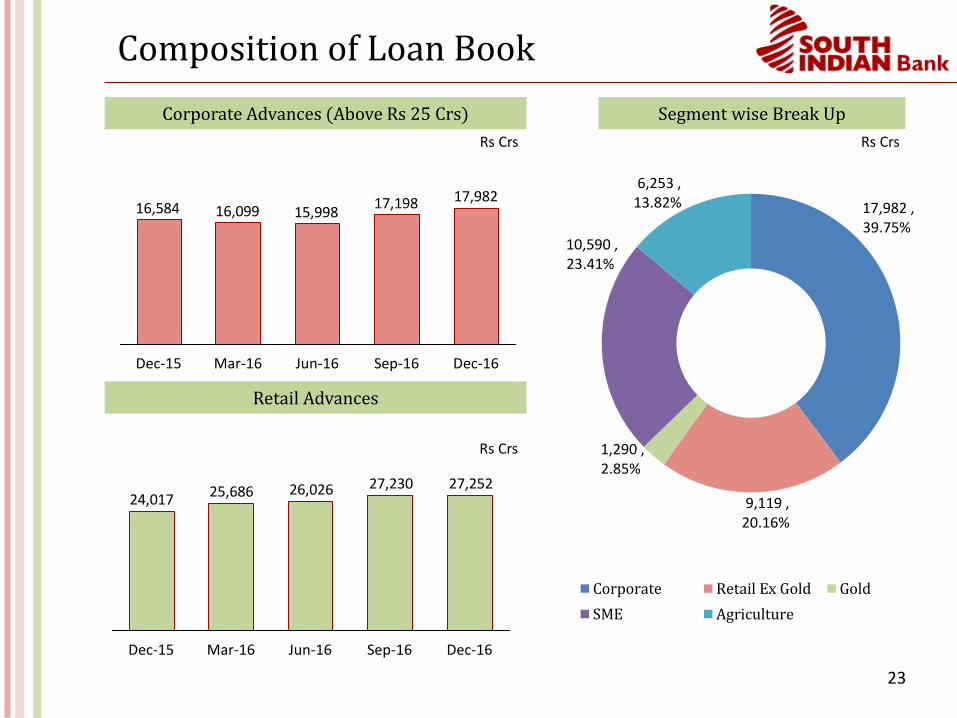
17,982 , 39.75%
9,119 , 20.16%
1,290 , 2.85%
10,590 , 23.41%
6,253 , 13.82%
Corporate Retail Ex Gold Gold
SME Agriculture
Composition of Loan Book
27,25227,23026,02625,68624,017
Dec-16Dec-15 Jun-16Mar-16 Sep-16
Segment wise Break UpCorporate Advances (Above Rs 25 Crs)
Rs Crs Rs Crs
17,98217,19815,99816,09916,584
Sep-16Mar-16Dec-15 Jun-16 Dec-16
Retail Advances
Rs Crs
24
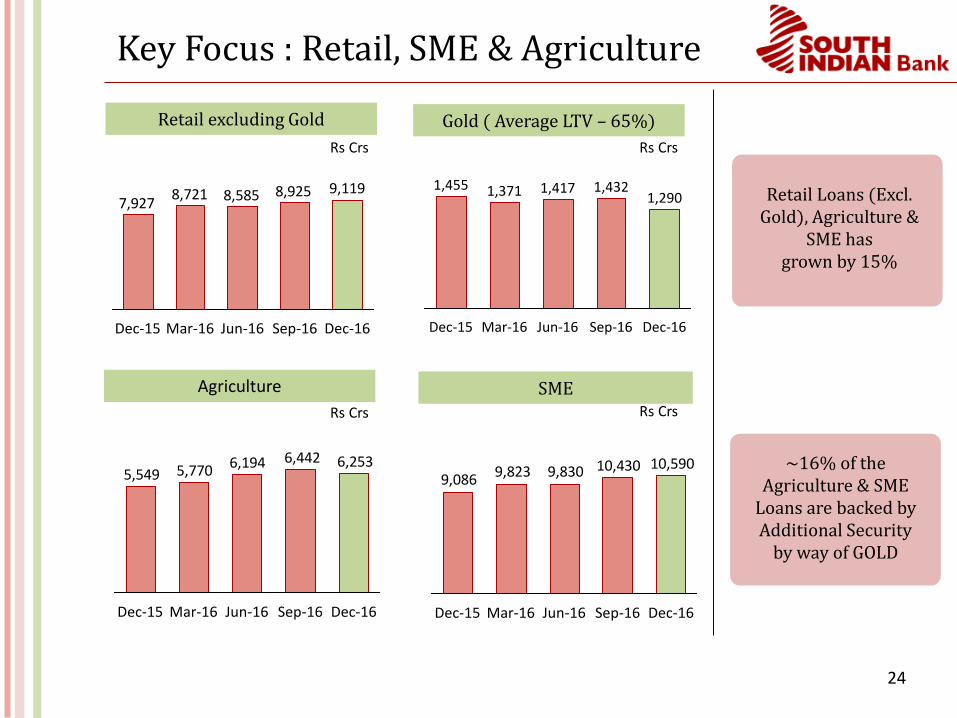
Key Focus : Retail, SME & Agriculture
Retail excluding Gold Gold ( Average LTV – 65%)
SMEAgriculture
8,9258,5858,7217,927
9,119
Dec-16Sep-16Jun-16Mar-16Dec-15
1,4321,3711,455
Mar-16
1,417
Dec-15 Dec-16Sep-16Jun-16
1,290
10,4309,8309,8239,08610,590
Dec-16Sep-16Jun-16Mar-16Dec-15
6,4426,1945,7705,5496,253
Sep-16 Dec-16Mar-16 Jun-16Dec-15
~16% of the Agriculture & SME
Loans are backed byAdditional Security
by way of GOLD
Retail Loans (Excl. Gold), Agriculture &
SME has grown by 15%
Rs Crs
Rs Crs
Rs Crs
Rs Crs

25
Advances growing across Regions
14,983 15,680 15,994 17,092 17,548
13,17813,556 13,315
13,923 14,054
12,44012,549 12,715
13,413 13,632
44,428
Dec-16Sep-16
40,60142,02441,785
Dec-15 Mar-16
45,234
Jun-16
South Ex- KeralaRest of India Kerala
Rs Crs
26
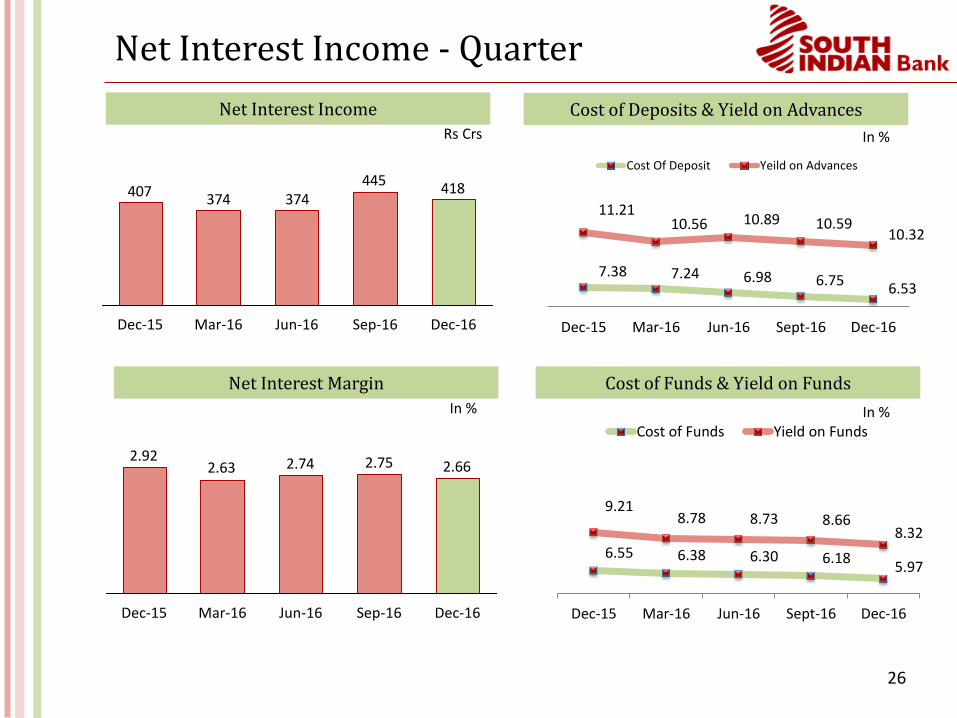
Net Interest Income - Quarter
Net Interest Income
418445
374374407
Sep-16Mar-16 Jun-16Dec-15 Dec-16
Cost of Deposits & Yield on Advances
Net Interest Margin
2.662.752.742.632.92
Sep-16Jun-16 Dec-16Mar-16Dec-15
Cost of Funds & Yield on Funds
Rs Crs
In %
In %
6.55 6.38 6.30 6.185.97
9.218.78 8.73 8.66
8.32
Dec-15 Mar-16 Jun-16 Sept-16 Dec-16
Cost of Funds Yield on FundsIn %
7.38 7.24 6.98 6.75 6.53
11.21 10.56 10.89 10.59
10.32
Dec-15 Mar-16 Jun-16 Sept-16 Dec-16
Cost Of Deposit Yeild on Advances

27
Net Interest Income - Cumulative
Net Interest Income
1,236
819
374
1,510
1,135
Dec-16Sep-16Jun-16Mar-16Dec-15
7.58 7.526.98 6.86 6.75
11.3611.18 10.89 10.73
10.59
Dec-15 Mar -16 Jun -16 Sept -16 Dec -16
Cost of Deposits Yield on Advances
Cost of Deposits & Yield on Advances
Net Interest Margin
2.722.752.742.732.76
Sep-16Dec-15 Mar-16 Dec-16Jun-16
Cost of Funds & Yield on Funds
Rs Crs
In %
In %
6.77 6.69 6.30 6.32 6.20
9.29 9.18 8.73 8.80 8.63
Dec-15 Mar -16 Jun -16 Sept-16 Dec-16
Cost of Funds Yield on FundsIn %

28
Improving Operating Efficiency
56.60 56.62
52.5751.08
48.53
Dec-15 Mar -16 Jun -16 Sept -16 Dec -16
C/I Ratio
Business per Employee Business per Branch
13.513.213.012.011.9
Dec-15 Dec-16Jun-16Mar-16 Sep-16
119117115108108
Mar-16 Dec-16Dec-15 Jun-16 Sep-16
Employee Additions
-75
-41-32
3 5
Dec-15 Mar -16 Jun -16 Sept -16 Dec -16
In %
Rs Crs Rs Crs

29
Sustainable Other Income
…Sustainable : Transaction Fees + Technology
23 23 25 26
44 52 54 48
22
45
Dec-16
74
Jun-16 Sep-16Mar-16
7976
Dec-15
67 67
Total Other Income led by ….
TechnologyTransaction Fees
Investment Book as on Dec-16
Rs Crs Rs Crs
50 57 5123
30
1271314
57
5102422
Dec-16Jun-16 Sep-16
16
8
Mar-16Dec-15
OtherForex Profit on Sale of Investments
Profit on Sale of Investments, Forex & Others
Rs Crs
259
146173
139153
Dec-15 Jun-16Mar-16 Sep-16 Dec-16
Details Rs. Crs M Duration
HTM 13,492 5.61
AFS 4,161 4.38
HFT 1 -
Total 17,654 5.36
30
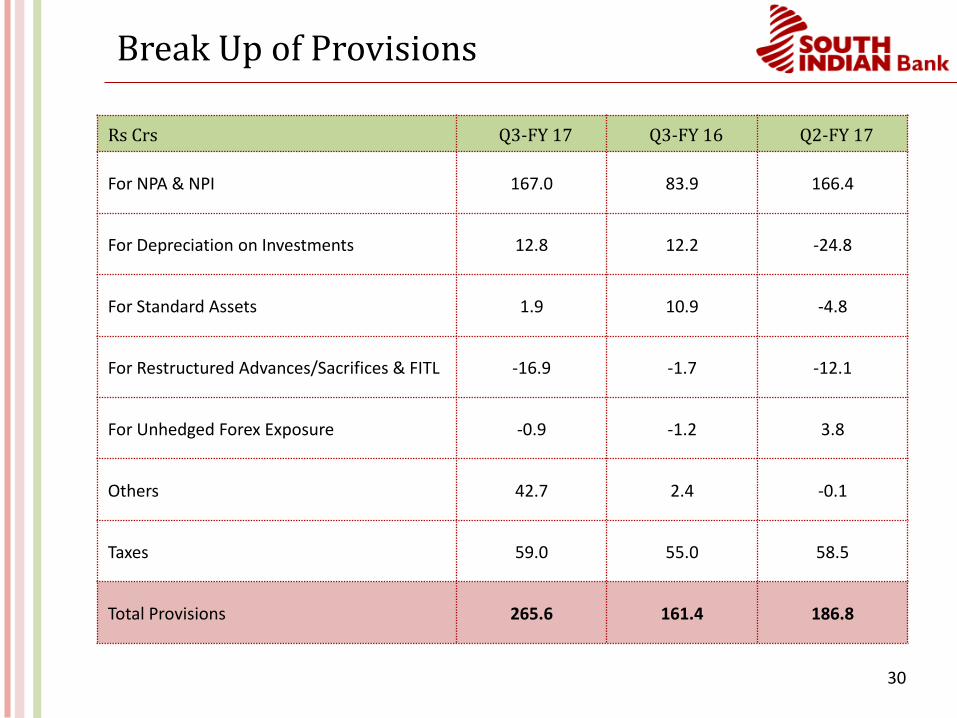
Break Up of Provisions
Rs Crs Q3-FY 17 Q3-FY 16 Q2-FY 17
For NPA & NPI 167.0 83.9 166.4
For Depreciation on Investments 12.8 12.2 -24.8
For Standard Assets 1.9 10.9 -4.8
For Restructured Advances/Sacrifices & FITL -16.9 -1.7 -12.1
For Unhedged Forex Exposure -0.9 -1.2 3.8
Others 42.7 2.4 -0.1
Taxes 59.0 55.0 58.5
Total Provisions 265.6 161.4 186.8

31
Non Performing Assets
Net NPA
1.80%
2.89% 2.89% 2.77%2.52%
Dec-15 Mar-16 Jun-16 Sept-16 Dec-16
Gross NPA
2.75%
3.77% 3.96% 3.96% 3.98%
Dec-15 Mar-16 Jun-16 Sept-16 Dec-16
Net NPA MovementGross NPA Movement
Rs Crs Dec-15 Mar-16 Jun-16 Sept-16 Dec-16
Opening 892 1,108 1,562 1,651 1,745
Additions 367 845 125 226 197
Deductions 151 391 36 132 155
Closing 1,108 1,562 1,651 1,745 1,787
Rs Crs Dec-15 Mar-16 Jun-16 Sept -16 Dec -16
Opening 550 716 1,185 1,192 1,206
Additions 311 664 105 135 125
Deductions 145 195 98 121 216
Closing 716 1,185 1,192 1,206 1,116

32
Restructured Advances Breakup
Restructured Assets Break-up
949 945761
642
306
443 442
532653
2,236
1,930
Dec-16Sep-16
1,293 1,2951,387
Mar-16
1,392
Jun-16Dec-15
Restructured Standard Advance
Restructured NPA
Sector Standard Restructure – Q3FY17
17%
49%
34%
Power DiscomsConstruction EPCOthers
Rs Crs
*Other includes IT, Bullion, etc.
Government’s Uday Scheme
targeted towards power Discomsbenefiting SIB
Benefits of Udaygetting reflected in Restructured
Book
UDAY Scheme to Benefit

33
Restructured Standard Advance
Restructured Standard Asset BookRs Crs
113 0 0
411 0 0
237 1 0
DISCOMS
OpeningIncrease in
Existing Balance
Uday – SDLInvestments
Construction EPC
Others
0
-98
-16
Slippages to NPA
761 1 0Total -114
111
313
218
Closing Balance
642
0
0
0
Fresh Addition
0
-2
0
-4
Decrease in Balance
-6

34
Movement in Restructured Accounts
Movement in Restructured Accounts
1,2951,293
Upgradation in Standard
Category
ClosingClosure incl
write-off
Dec. in Balance
6
Inc. in Balance
20
Opening Fresh Additions
00 12
Shift of focus from Large Corporate
toSMEs
Defocusing from Power & Infra Sectors
Special Recovery Cell &
Asset Monitoring Cell
Rs Crs
35
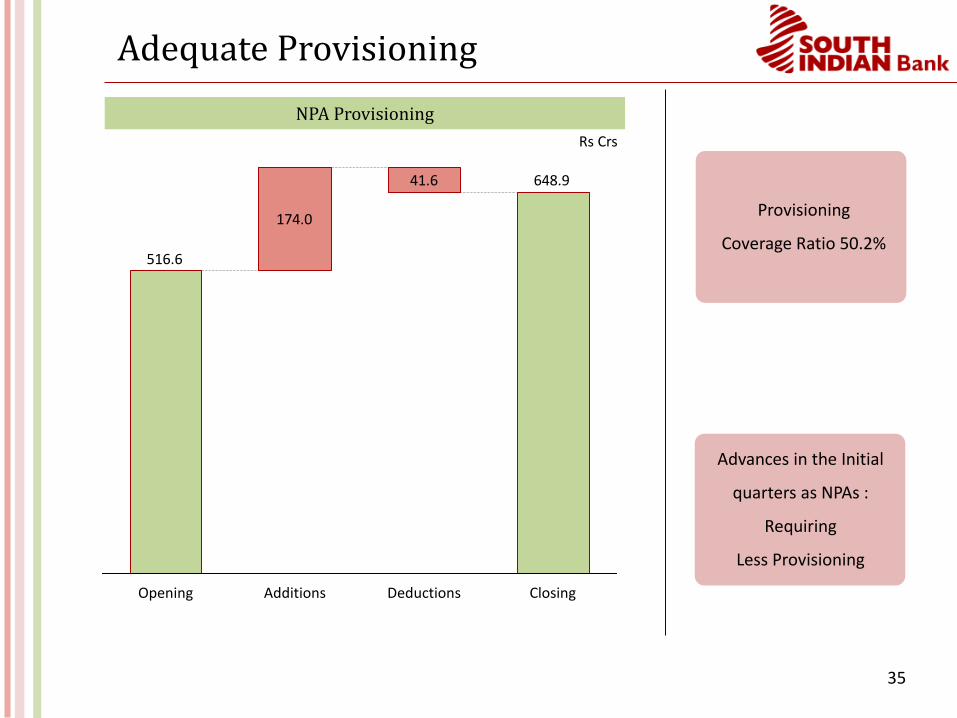
Adequate Provisioning
NPA Provisioning
174.0
516.6
648.941.6
DeductionsAdditions ClosingOpening
Provisioning
Coverage Ratio 50.2%
Advances in the Initial
quarters as NPAs :
Requiring
Less Provisioning
Rs Crs
36
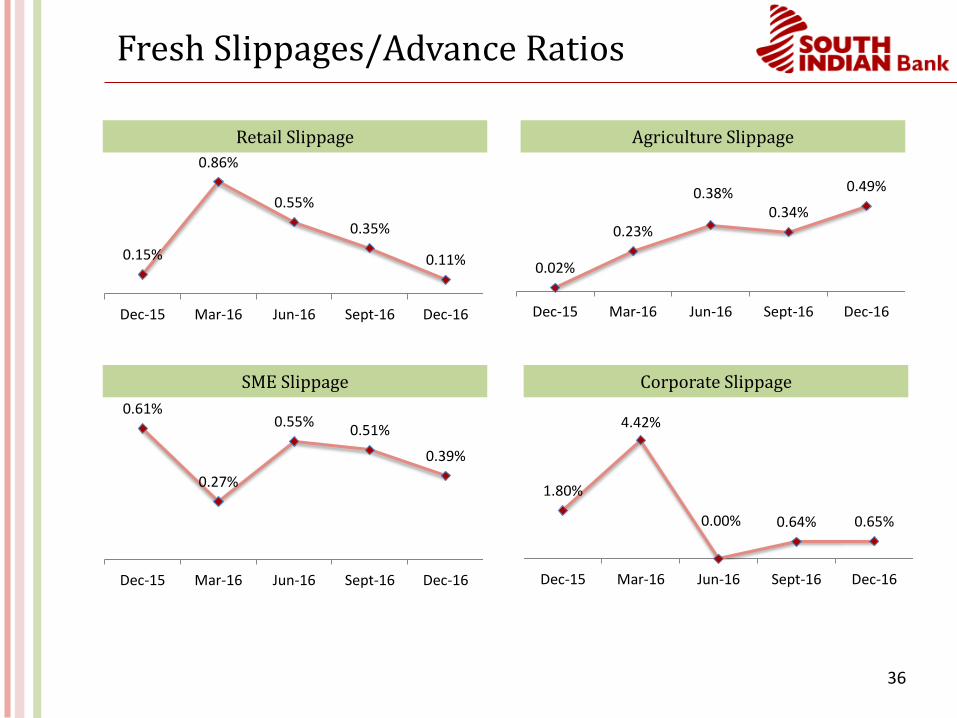
Fresh Slippages/Advance Ratios
SME Slippage
Retail Slippage
Corporate Slippage
0.15%
0.86%
0.55%
0.35%
0.11%
Dec-15 Mar-16 Jun-16 Sept-16 Dec-16
Agriculture Slippage
0.02%
0.23%
0.38%0.34%
0.49%
Dec-15 Mar-16 Jun-16 Sept-16 Dec-16
0.61%
0.27%
0.55%0.51%
0.39%
Dec-15 Mar-16 Jun-16 Sept-16 Dec-16
1.80%
4.42%
0.00% 0.64% 0.65%
Dec-15 Mar-16 Jun-16 Sept-16 Dec-16
37
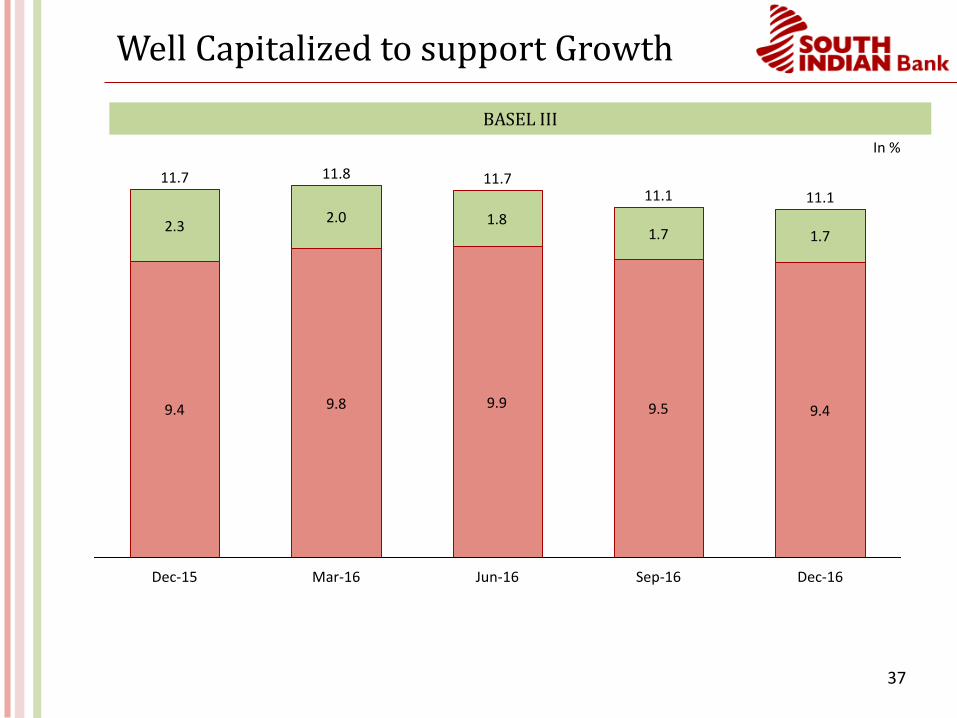
Well Capitalized to support Growth
BASEL III
9.4 9.8 9.9 9.5
2.32.0 1.8
1.7
9.4
1.7
Dec-15
11.811.711.1
Dec-16Sep-16Mar-16
11.7
Jun-16
11.1
In %

38
Balance Sheet Overview- Q3 FY17
Rs Crs Q3-FY 17 Q3-FY 16 Y-o-Y (%) Q2-FY 17 Q-o-Q (%)
Capital & Liabilities 71,446 60,269 18.55% 67,054 6.55%
Capital 135 135 0.12% 135 0.08%
Reserves and Surplus 4,141 3,715 11.48% 4,027 2.85%
Deposits 63,595 53,441 19.00% 60,192 5.65%
Borrowings 2,205 1,665 32.45% 1,499 47.13%
Other Liabilities & Provisions 1,369 1,312 4.34% 1,201 14.00%
Assets 71,446 60,269 18.55% 67,054 6.55%
Cash & Balances with RBI 3,576 2,367 51.10% 2,832 26.28%
Balances with Banks 1,420 249 471.30% 404 251.18%
Investments 17,576 13,259 32.56% 15,777 11.40%
Advances 44,256 39,909 10.89% 43,548 1.63%
Fixed Assets 595 485 22.51% 598 -0.57%
Other Assets 4,023 4,000 0.59% 3,894 3.32%
Business (Advances + Deposits) 107,850 93,350 15.53% 103,740 3.96%
Current Accounts 2,946 2,130 38.32% 2,399 22.83%
Savings Accounts 13,540 10,177 33.04% 11,299 19.83%
CASA Ratio 25.92% 23.03% 289 bps 22.76% 317 bps

39
Profit & Loss Overview- Q3 FY17
Rs Crs Q3-FY17 Q3-FY 16 Y-o-Y (%) Q2-FY17 Q-o-Q (%)
Net Interest Income 417.52 406.72 2.66% 445.18 -6.21%
Other Income 258.51 153.32 68.61% 145.90 77.18%
Total Income 676.03 560.04 20.71% 591.08 14.37%
Operating Expenses 299.06 296.97 0.70% 293.74 1.81%
Operating Profit 376.97 263.07 43.30% 297.34 26.78%
Provisions (Ex-Tax) & Contingencies
206.63 106.39 94.22% 128.33 61.01%
Profit Before Tax 170.34 156.68 8.72% 169.01 0.79%
Provision for Tax 58.96 55.05 7.10% 58.49 0.80%
Profit After Tax 111.38 101.63 9.59% 110.52 0.78%
40
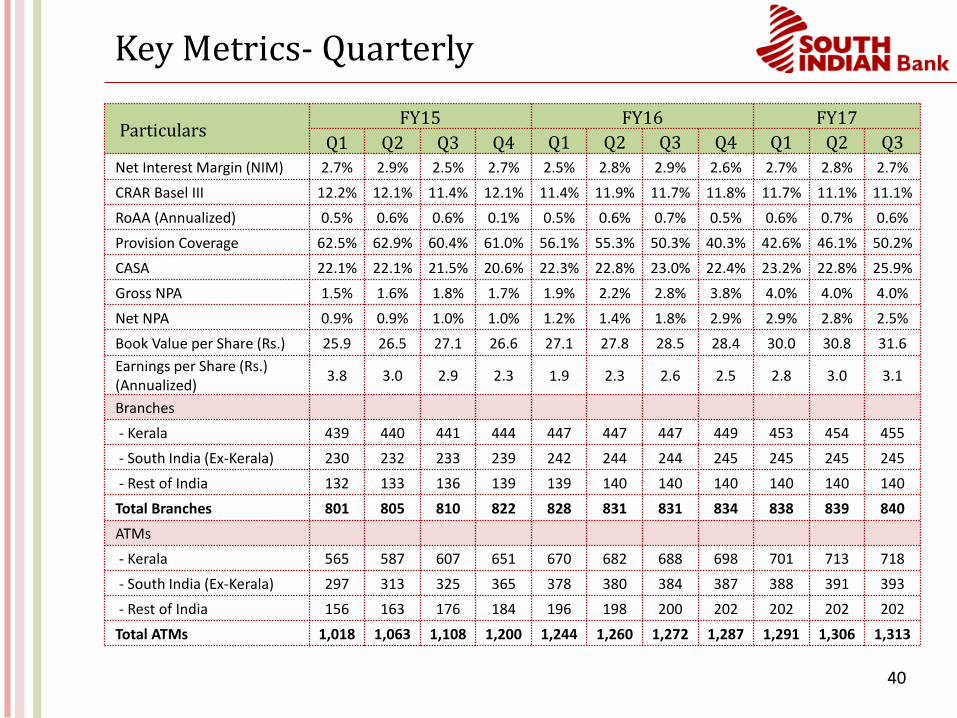
Key Metrics- Quarterly
Particulars FY15 FY16 FY17
Q1 Q2 Q3 Q4 Q1 Q2 Q3 Q4 Q1 Q2 Q3
Net Interest Margin (NIM) 2.7% 2.9% 2.5% 2.7% 2.5% 2.8% 2.9% 2.6% 2.7% 2.8% 2.7%
CRAR Basel III 12.2% 12.1% 11.4% 12.1% 11.4% 11.9% 11.7% 11.8% 11.7% 11.1% 11.1%
RoAA (Annualized) 0.5% 0.6% 0.6% 0.1% 0.5% 0.6% 0.7% 0.5% 0.6% 0.7% 0.6%
Provision Coverage 62.5% 62.9% 60.4% 61.0% 56.1% 55.3% 50.3% 40.3% 42.6% 46.1% 50.2%
CASA 22.1% 22.1% 21.5% 20.6% 22.3% 22.8% 23.0% 22.4% 23.2% 22.8% 25.9%
Gross NPA 1.5% 1.6% 1.8% 1.7% 1.9% 2.2% 2.8% 3.8% 4.0% 4.0% 4.0%
Net NPA 0.9% 0.9% 1.0% 1.0% 1.2% 1.4% 1.8% 2.9% 2.9% 2.8% 2.5%
Book Value per Share (Rs.) 25.9 26.5 27.1 26.6 27.1 27.8 28.5 28.4 30.0 30.8 31.6
Earnings per Share (Rs.) (Annualized)
3.8 3.0 2.9 2.3 1.9 2.3 2.6 2.5 2.8 3.0 3.1
Branches
- Kerala 439 440 441 444 447 447 447 449 453 454 455
- South India (Ex-Kerala) 230 232 233 239 242 244 244 245 245 245 245
- Rest of India 132 133 136 139 139 140 140 140 140 140 140
Total Branches 801 805 810 822 828 831 831 834 838 839 840
ATMs
- Kerala 565 587 607 651 670 682 688 698 701 713 718
- South India (Ex-Kerala) 297 313 325 365 378 380 384 387 388 391 393
- Rest of India 156 163 176 184 196 198 200 202 202 202 202
Total ATMs 1,018 1,063 1,108 1,200 1,244 1,260 1,272 1,287 1,291 1,306 1,313
41
Next Generation Bank

42
Present across Customer Touch Points
Mobile Banking Mobile Banking
Point of SaleInternet Banking
ATMs
1,313 ATMs across India
Branches
840 Branches & 45 Extension Counters
Traditional & Alternate Channels

43
Technology Initiatives
SIB Mirror is a mobile-led platform with instant account access, balance retrieval, immediate fund transfers, all account intimations, and much more
SIB-er Net is a suite of comprehensive internet banking services positioning SIB as a technology-driven bank offering superior services to retail customers
Retail branches now interconnected with single-window service and providing real-time online, real-time transactions to customers
SIB offers Visa, MasterCard, and RuPay debit cards with online access to users for secure domestic and international transactions
Centralized Processing Center allows enhanced risk management and customer creation with complete KYC compliance and fraud prevention tools
SIB has offered new initiatives such as Co-branded Credit Cards with SBI and is amongst the 1st to introduce M-Pay a mobile banking application powered with UPI Service

44
Personal Banking: Technology Banking
Active Internet Users
133 134 141 157
175
Dec-15 Mar-16 Jun-16 Sep-16 Dec-16
Mobile Transaction Volume
Internet Transaction Volume Internet Transaction Value
Mobile Transaction Value
785663611591
1,254
Dec-16Dec-15 Sep-16Mar-16 Jun-16
3,2933,054
2,5512,5152,385
Dec-16Sep-16Dec-15 Jun-16Mar-16
1,175
913
748670
507
Dec-16Sep-16Jun-16Mar-16Dec-15
599
350
233170
124
Sep-16 Dec-16Dec-15 Jun-16Mar-16
(000)’s (000)’s
(000)’s
Rs Crs
Rs Crs
45
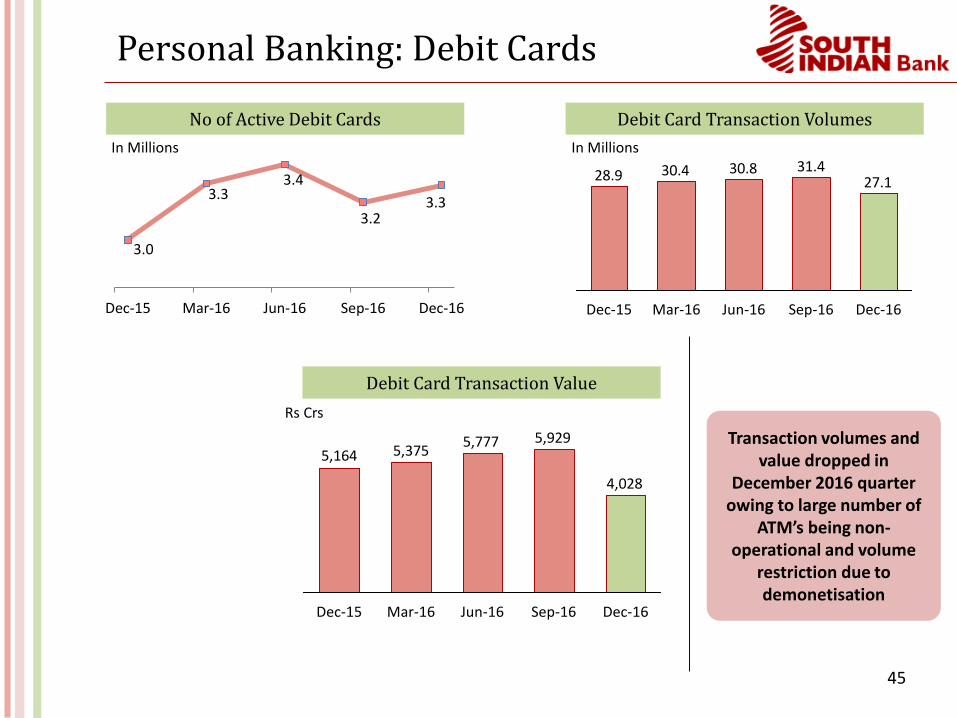
Personal Banking: Debit Cards
3.0
3.3 3.4
3.2 3.3
Dec-15 Mar-16 Jun-16 Sep-16 Dec-16
No of Active Debit Cards Debit Card Transaction Volumes
Debit Card Transaction Value
27.131.430.830.428.9
Jun-16Mar-16 Sep-16Dec-15 Dec-16
4,028
5,9295,7775,3755,164
Mar-16 Jun-16Dec-15 Sep-16 Dec-16
In Millions In Millions
Rs Crs
Transaction volumes and value dropped in
December 2016 quarter owing to large number of
ATM’s being non-operational and volume
restriction due to demonetisation
46
An Inflection Point
47
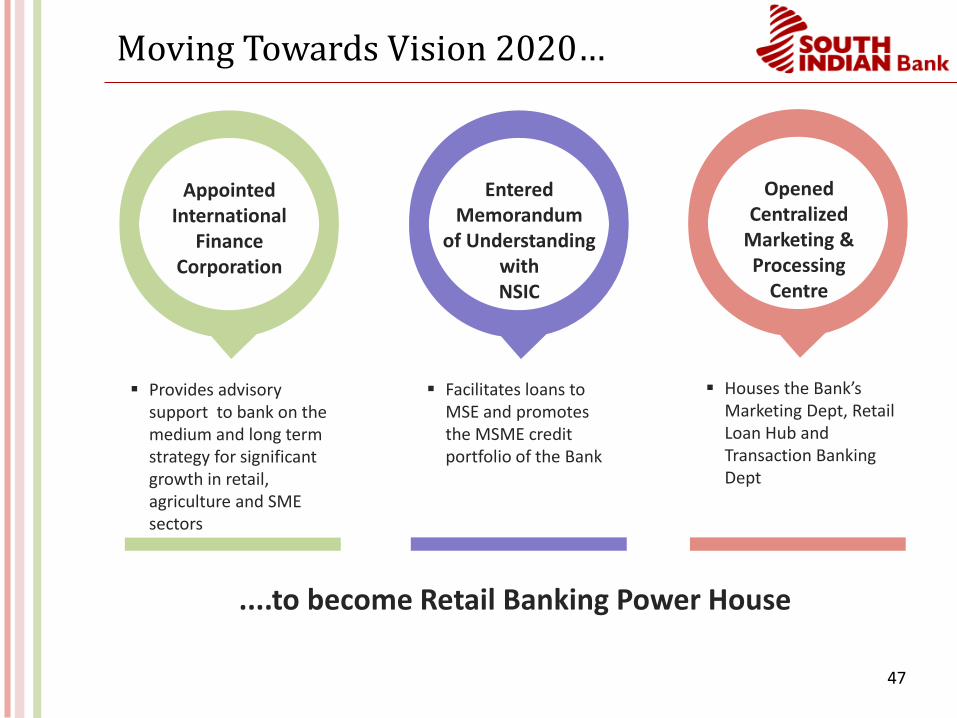
Moving Towards Vision 2020…
Provides advisory support to bank on the medium and long term strategy for significant growth in retail, agriculture and SME sectors
Appointed International
Finance Corporation
Facilitates loans to MSE and promotes the MSME credit portfolio of the Bank
Entered Memorandum
of Understanding with NSIC
Houses the Bank’s Marketing Dept, Retail Loan Hub and Transaction Banking Dept
Opened Centralized
Marketing & Processing
Centre
....to become Retail Banking Power House

48
About Us

49
Milestones
FIRST among the private sector banks in Kerala to
become a scheduled bank in 1946 under the RBI Act
FIRST bank in the private sector in India to open a
Currency Chest on behalf of the RBI in April 1992
FIRST private sector bank to open a NRI branch in
November 1992
FIRST bank in the private sector to start Industrial Finance
Branch in March 1993
FIRST among the private sector banks in Kerala to open an "Overseas Branch" to cater
exclusively to the export and import business in June 1993
FIRST bank in Kerala to develop an in-house, a fully integrated branch automation software in addition to
the in-house partial automation solution operational since 1992
The FIRST Kerala based bank to implement Core Banking System

50
Expansion over a Decade
Branch Network
140121
245263
449
56
FY16FY06
440
~2X
834
Kerala South Ex-Kerala Others (Rest of India)
ATM Network
698
202
387
66
1,287
144
40
~9x
FY16FY06
38
51
Performance over a Decade
1,510
310
CAGR : 17%
FY16FY06
Net Interest Income
96,806
15,949
FY06 FY16
CAGR : 20%
Business (Advances + Deposits)
333
51
FY06 FY16
CAGR : 21%
Profit After Tax
3.77
4.99
FY06
122bps
FY16
Gross NPA
Rs Crs Rs Crs
Rs Crs In %

52
Leadership Team
Mr. V. G Mathew , MD & CEO
Post Graduate in Physics and CAIIB with over 37 years of experience
Joined SIB in January, 2014 as Executive Vice President and appointed as MD & CEO in October, 2014
Significant experience in Retail & Corporate Credit, Technology and Risk Management
Joined SBI as a probationary officer in the Ahmadabad Circle in 1978 and was Chief General Manager before joining SIB
The major assignments handled by Mr. Mathew in SBI are
Dy. General Manager (IT Networking Project)
Dy. General Manager and Branch Head, (Overseas Branch, Bangalore)
General Manager, (Corporate Accounts Group-Mumbai Branch)
Chief General Manager (Risk Management)
Chief General Manager (Corporate Accounts Group)
He has served on various committees at Corporate Center of SBI such as Wholesale Banking Credit Committee,
Investment Committee, Corporate Centre Credit Committee and was a Director on the Board of SBI Macquarie
Infrastructure Trustee (P) Limited
53
Leadership Team
Mr. Thomas Joseph K, EVP (Administration)
• Bachelors Degree in Engineering and Diploma in Management & CAIIB
• He is associated with SIB since 1984 and heads Departments such as Risk Management, Technology, Marketing, Corporate Financial Management, Human Resource and Inspection & Vigilance
• He was Head of Credit handling a portfolio of Rs.40,000 crores and was instrumental in the execution of the Retail Strategy of the Bank which saw significant growth in the MSME & Agriculture Sectors
Mr. G Sivakumar, EVP (Credit)
• Postgraduate in Chemistry and holds Masters Degree in Business Administration & CAIIB
• He heads Credit and Legal Departments
• He has over 35 Years of Experience in Domestic and International Banking in India and Abroad
• Before joining SIB, he was the General Manager and Head of Private Equity Vertical in State Bank of India where he was
responsible for Private Equity and Venture Capital Investments made by the Bank
• He was also a nominee director on the Board of Directors of four companies and Investment Committee of more than
ten Alternative Investment Funds
Mr. K N Reghunathan, EVP (Treasury)
• Commerce Graduate & CAIIB
• He is responsible for Treasury Operations of the Bank along with International Banking Division
• Before joining SIB, he was associated with Union Bank of India and was General Manager of Treasury and International
Banking Division.
• He was the Bank’s nominee on the Board of FIMMDA and SBI Global Factors and Member of the Advisory Committee
of Metropolitan Stock Exchange of India, IDFC Investment Fund, TATA Growth Fund, TATA Innovative Fund, India
Advantage Fund I & II

54
Management Team
Mr. John Thomas, Senior General Manager (Business Development Department)
• Bachelors Degree in Science, MBA and CAIIB
Mr. Raphael T.J., Senior General Manager (Marketing & Information Technology)
• Bachelors Degree in Commerce, Masters in EXIM,
Diploma in Financial Management and CAIIB
• Bachelors Degree in Arts & Masters Degree in Business
Administration and CAIIB
Mr. Anto George T., General Manager (Delhi Regional Office)
• Bachelors Degree in Arts & Post Graduate Diploma in
Computer Application, Certification in RDBMS & Oracle
8i and JAIIB
Mr. Bobby James , Senior General Manager (Inspection & Vigilance)
• Bachelors Degree in Commerce, C.A. (Inter) and JAIIB
Mr. Benoy Varghese, Senior General Manager(Credit Department)
Mr. Paul V.L., General Manager (Administration)
• Masters Degree in Arts and Post Graduate Diploma in
Personnel Management & JAIIB
55
Management Team
Mr. C.P. Gireesh, Chief Financial Officer
• Bachelors Degree in Mathematics
• Fellow member of the Institute of Chartered Accountants of India and Certified Associate of the Indian Institute of
Banking & Finance
Mr. Jacob EA, Chief Compliance Officer
• Bachelors Degree in Science & CAIIB - I
Mr. Jimmy Mathew, Company Secretary
• Bachelors Degree in Commerce, Associate Member of
Institute of Company Secretary of India and Institute of
Cost & Management Accountants of India. Also a
Certified Associate of the Indian Institute of Banking &
Finance
56
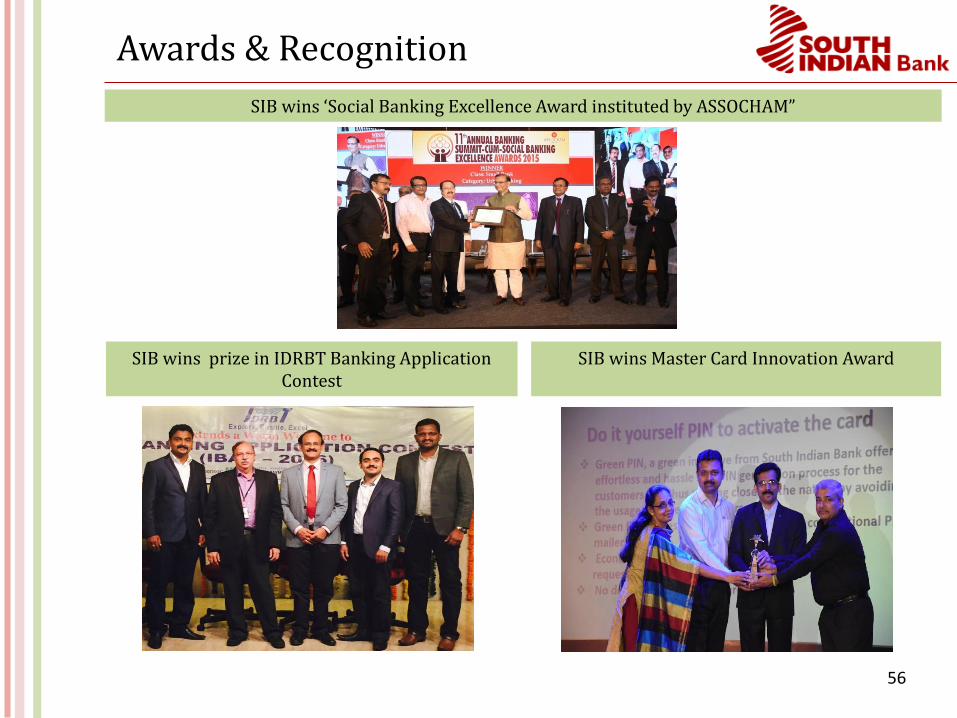
Awards & Recognition
SIB wins prize in IDRBT Banking Application Contest
SIB wins Master Card Innovation Award
SIB wins ‘Social Banking Excellence Award instituted by ASSOCHAM”
57
Company: Investor Relations Advisors:
The South Indian Bank Ltd.CIN – L65191KL1929PLC001017Mr. C. P. Gireesh, [email protected]
www.southindianbank.com
Strategic Growth Advisors Pvt. Ltd.CIN - U74140MH2010PTC204285Ms. Payal Dave / Mr. Shogun [email protected] / [email protected]+91 98199 16314 / +91 77383 77756www.sgapl.net
For further information, please contact: