Investor Presentation - ir.kindermorgan.com · b) KMI consolidates all of the Trans Mountain (TM)...
40
Investor Presentation December 2018
Transcript of Investor Presentation - ir.kindermorgan.com · b) KMI consolidates all of the Trans Mountain (TM)...

Investor PresentationDecember 2018

Disclosure
General – The information contained in this presentation does not purport to be all‐inclusive or to contain all information that prospective investors may require. Prospective investors are encouraged toconduct their own analysis and review of the information contained in this presentation as well as important additional information through the SEC’s EDGAR system at www.sec.gov and on our websiteat www.kindermorgan.com.
Forward-Looking Statements – This presentation includes forward-looking statements within the meaning of the U.S. Private Securities Litigation Reform Act of 1995 and Section 21E of the Securitiesand Exchange Act of 1934. Forward-looking statements include any statement that does not relate strictly to historical or current facts and include statements accompanied by or using words such as“anticipate,” “believe,” “intend,” “plan,” “projection,” “forecast,” “strategy,” “outlook,” “continue,” “estimate,” “expect,” “may,” or “long-term”. In particular, statements, express or implied, concerning futureactions, conditions or events, future operating results or the ability to generate revenues, income or cash flow or to pay dividends are forward-looking statements. Forward-looking statements are notguarantees of performance. They involve risks and uncertainties and are based on the beliefs and assumptions of management based on information currently available to them. There is no assurancethat any of the actions, events or results described in the forward-looking statements will occur, or if any of them do, what impact they will have on our results of operations or financial condition. Becauseof these uncertainties, you are cautioned not to put undue reliance on any forward-lookingstatement.
Future actions, conditions or events and future results of operations may differ materially from those expressed in these forward-looking statements. Many of the factors that will determine these resultsare beyond our ability to control or predict. These statements are necessarily based upon various assumptions involving judgments with respect to the future, including, among others, the timing andextent of changes in the supply of and demand for the products we transport and handle; national, international, regional and local economic, competitive, political and regulatory conditions anddevelopments; the timing and success of business development efforts; the timing, cost, and success of expansion projects; technological developments; condition of capital and credit markets; inflationrates; interest rates; the political and economic stability of oil producing nations; energy markets; income tax legislation; weather conditions; environmental conditions; business, regulatory and legaldecisions; terrorism, including cyber-attacks; and other uncertainties; and with respect to the proposed use of proceeds from the sale of the Trans Mountain Pipeline and related Trans MountainExpansion Project (“TMEP”) by Kinder Morgan Canada Limited (“KML”), our anticipated receipt and use of such proceeds, including the timing thereof. Important factors that could cause actual results todiffer materially from those expressed in or implied by forward-looking statements include the risks and uncertainties described in our most recent Annual Report on Form 10-K and subsequently filedExchange Act reports filed with the Securities Exchange Commission, or “SEC” (including under the headings "Risk Factors," "Information Regarding Forward-Looking Statements" and “Management’sDiscussion and Analysis of Financial Condition and Results of Operations” and elsewhere), which are available through the SEC’s EDGAR system at www.sec.gov and on our website atwww.kindermorgan.com.
GAAP – Unless otherwise stated, all historical and estimated future financial and other information and the financial statements included in this presentation have been prepared in accordance withgenerally accepted accounting principles in theUnited States ("GAAP").
Non-GAAP – In addition to using financial measures prescribed by GAAP, we use non-generally accepted accounting principles (“non-GAAP”) financial measures in this presentation. Our reconciliationof non-GAAP financial measures to comparable GAAP measures can be found in the Appendix to this presentation. These non-GAAP measures do not have any standardized meaning under GAAP andtherefore may not be comparable to similarly titled measures presented by other issuers. As such, they should not be considered as alternatives to GAAP financial measures. See “Use of Non-GAAPFinancial Measures” below.
KML United States Matters – KML’s securities have not been and will not be registered under the United States Securities Act of 1933, as amended (the U.S. Securities Act), or any state securitieslaws. Accordingly, these securities may not be offered or sold within the United States unless registered under the U.S. Securities Act and applicable state securities laws or except pursuant toexemptions from the registration requirements of the U.S. Securities Act and applicable state securities laws. This presentation does not constitute an offer to sell or a solicitation of an offer to buy any ofKML’s securities in the United States.
2
Forward looking statements / non-GAAP financial measures

A Core Energy Infrastructure Holding
Natural Gas Pipelines
Largest natural gas transmission network in North America
Own or operate ~70,000 miles of natural gas pipelines
Connected to every important U.S. natural gas resource play
Products Pipelines
Largest independent transporter of petroleum products in North America (~2.1 mmbbld)
Own or operate ~10,000 miles of liquids pipelines
Terminals
Largest independent terminals operator in North America (152 terminals, 16 Jones Act vessels)
~147 mmbbls of liquids storage capacity
Handle ~59 mmtpa of dry bulk products
CO2
Largest transporter of CO2 in North America (~1.2 Bcfd)
~48 mbbld of net liquids production and Wink crude oil pipeline in Permian Basin
3
Unparalleled asset footprint: one of the largest energy infrastructure companies in North America
Note: Capacity and volumes are company-wide per 2018 budget.
a) 2018 budgeted Segment EBDA before Certain Items and including KM-share of Certain Equity Investee DD&A (non-GAAP measure). See Appendix for defined terms and reconciliations of non-GAAP measures. KM Canada
segment, including the Trans Mountain system and related expansion project, was sold on 8/31/2018.
56%
15%
15%
7% 4% 3%
Natural
Gas
Pipelines
Terminals
Products
Pipelines
CO2 EOR
CO2 S&T KM Canada
$8,093mm
EBDA(a)
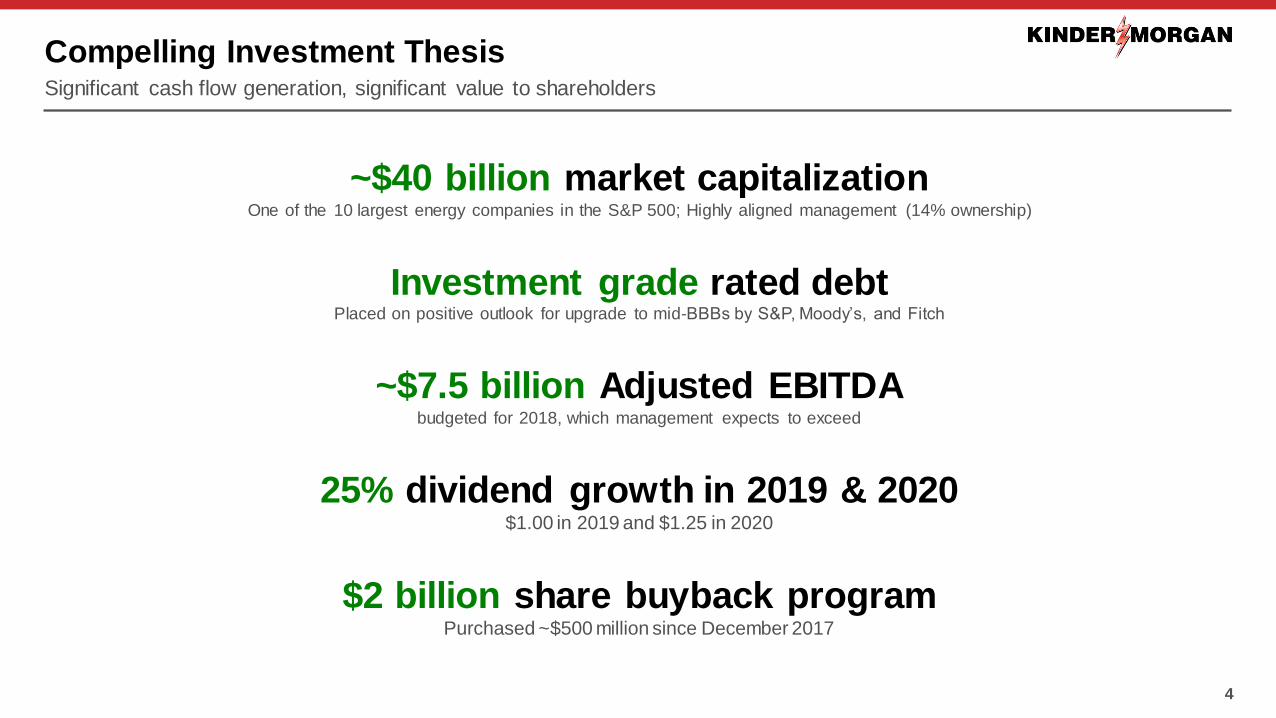
Compelling Investment Thesis
4
Significant cash flow generation, significant value to shareholders
~$40 billion market capitalizationOne of the 10 largest energy companies in the S&P 500; Highly aligned management (14% ownership)
Investment grade rated debtPlaced on positive outlook for upgrade to mid-BBBs by S&P, Moody’s, and Fitch
~$7.5 billion Adjusted EBITDAbudgeted for 2018, which management expects to exceed
25% dividend growth in 2019 & 2020$1.00 in 2019 and $1.25 in 2020
$2 billion share buyback programPurchased ~$500 million since December 2017

Delivering on Objectives
De-lever balance sheet
― Reduced net debt by close to $8 billion since Q3 2015
― Finished Q3 2018 at 4.6x net debt / EBITDA(a)
― Ratio excludes ~$0.9 billion of cash proceeds expected to be distributed to KML’s public shareholders(b)
― KML distribution of Trans Mountain sale proceeds expected on January 3, 2019
― Achieved long-term leverage target of around 4.5x net debt / EBITDA
Invest in high-return capital projects
― Over $6 billion of commercially secured capital projects underway
― Forecast $2.5 billion of growth capex in 2018
― Expect $2 to $3 billion per year of ongoing organic investment opportunities
Return cash to shareholders
― 60% year-over-year increase in 2018 dividend and 25% increases expected for 2019 and 2020
― Repurchased $500 million of KMI shares during Q4 2017 and Q1 2018 out of $2 billion buyback program
5
Key milestones reached
Note: See Appendix for definitions of non-GAAP measures.
a) See Appendix slide “KMI LTM Net Debt / Adjusted EBITDA Reconciliation” for more detail.
b) KMI consolidates all of the Trans Mountain (TM) sale cash proceeds on its balance sheet, but only owns a ~70% interest in KML.
c) Segment EBDA before Certain Items and including KM’s share of certain equity investees’ DD&A (non -GAAP measure). In some cases, JV contributions are after interest and tax expenses.
d) A non-GAAP measure consisting of 2018 budgeted DCF less dividends of ~$1.8bn less growth capex of ~$2.2bn.
Published Budget 2018B
∆ from
2017
Segment EBDA incl. JV DD&A(c) $8,093 million 5%
Adjusted EBITDA $7,485 million 4%
DCF $4,567 million 2%
DCF per Share $2.05 3%
Dividend per Share $0.80 60%
Discretionary Free Cash Flow(d) $568 million 49%
Given strong operational performance,
we expect to exceed 2018 financial targets

6
Supported by diversified, fee-based cash flow
2019 Guidance – Published Budget
KMI KML
Published Budget 2019B ∆ from 2018B 2019B
Adjusted EBITDA $7.8 billion 4% C$213 million
DCF $5.0 billion 10%Meaningful increases despite the sale of our Trans Mountain asset C$109 million
DCF per Share $2.20 7% C$0.90(b)
Dividend per Share $1.00 25%Returning additional value to shareholders via dividend increase C$0.65(b)
Growth Capex & Contributions to JVs $3.1 billion(a) 39% C$32 million
Year-end Net Debt / Adj. EBITDA 4.5xWell-positioned for upgrade to credit ratings; currently on positive outlook at all three rating agencies
1.3x(c)
Note: See Appendix for definitions of non-GAAP measures.
a) Excludes capital spending by KML.
b) Figures are per split-adjusted restricting voting share.
c) Taking into account 50% debt treatment of the existing outstanding preferred shares.
KMI expects to use internally generated cash flow to fully fund 2019B dividend
payment and vast majority of 2019B growth capex. No need to access equity markets.

$586
$380
$568
2016 2017 2018B
Financial Flexibility from Significant Cash Flow
Early mover in industry shift to self-funding, higher dividend coverage and lower leverage
$0 KMI equity issued since 2015 and none expected for the foreseeable future
2018 budgeted dividend coverage of 2.6x(a)
Plan to apply Trans Mountain sale proceeds (expected ~$2 billion) toward debt reduction in January 2019
Achieved long-term leverage target of around 4.5x net debt / Adjusted EBITDA(b)
Strong balance sheet provides financial flexibility to pursue multiple value-enhancing opportunities
Placed on positive outlook for upgrade by S&P, Moody’s, and Fitch
S&P has stated that it expects to upgrade KMI to BBB in January 2019
Manageable future debt maturities ($4.5 billion of credit facilities)
7
Prioritizing a healthy balance sheet
a) 2018B DCF per share divided by 2018B dividend per share.
b) KMI owns ~70% of KML, with the public owning the remaining ~30%. This ratio excludes ~$0.9 bil lion of cash proceeds expected to be distributed to KML’s public shareholders from the Trans Mountain sale transaction.
c) DCF less dividends of ~$1.1bn, ~$1.1bn, and ~$1.8bn in 2016, 2017, and budgeted for 2018, respectively; and less growth capex of ~$2.8bn, ~$3.0bn, and ~$2.2bn in 2016, 2017, and budgeted for 2018, respectively.
d) 5-year maturity schedule of KMI’s debt and its consolidated subsidiaries, excludes immaterial capital lease obligations. 2018 future debt maturity as of 9/30/2018.
$2,800
$2,184 $2,400 $2,450
2018 2019 2020 2021 2022
$0
EXCESS CASH FLOW GENERATION(c)
FUTURE DEBT MATURITIES(d)
$ Millions
$ Millions
Excess 2018B cash flow used for incremental growth projects
and share buybacks ($250mm of shares repurchased YTD)

Kinder Morgan’s Commitment to Shareholders
Diversified, highly contracted asset base core to North American economy
– ~96% of cash flows from take-or-pay and other fee-based contracts or hedged(a)
Market leader in each of our business segments
8
Generate predictable, fee-based cash flows and leverage footprint to deliver growth
Note: See appendix for defined terms and reconciliations of non-GAAP measures.
a) Based on 2018 budgeted Segment EBDA before Certain Items and including KM-share of Certain Equity Investee DD&A (non-GAAP measure).
b) Revolver balance is as of 9/30/18 and includes commercial paper balance and outstanding letters of credit. Revolver capacity is pro forma for new $4bn credit facility that closed on 11/16/18.
c) See Appendix slide “KMI LTM Net Debt / Adjusted EBITDA Reconciliation” for more detail.
Stable, fee-based
assets
Safe and efficient
operator
Leverage footprint
for growth
Aligned and
transparent with
investors
Financial flexibility
Target zero incidents and continuous improvement
Consistently perform better than industry asset integrity and safety averages
Control costs; it’s investors’ money, not management’s – treat it that way
Leverage expansive footprint to connect growing North American supply with critical demand markets
Ability to capture synergies with existing assets, through both expansions and acquisitions
Over $6 billion of commercially secured capital projects underway and expect ongoing organic investment opportunities of
$2 to 3 billion per year
Investment grade rated with near-term opportunity for upgrade
~$3.5bn revolver capacity(b) with Q3 2018 leverage of 4.6x net debt / EBITDA(c)
Early adopter of simplified c-corp. structure (no IDRs), higher dividend coverage and lower leverage
All investment needs funded with internally generated cash flow since 2016
Management’s 14% equity stake ensures alignment with shareholders
– CEO receives $1 salary and no cash bonus
Management compensation tied to achievement of financial and/or operational targets
Long-standing commitment to provide a high level of transparency and accountability

Sector 2017 2027E
Growth
Bcfd %
LNG Exports 2 15 13 650%
Power 25 32 7 28%
Industrial 22 26 4 18%
Residential 12 14 2 17%
Net Mexico Exports 4 6 2 50%
Other 15 20 5 33%
Total U.S. Natural Gas Demand 81 114 33 41%
9
U.S. NATURAL GAS SUPPLYBcfd
U.S. NATURAL GAS DEMANDBcfd
Positioned to Support Future of Natural Gas
Source: WoodMackenzie, North America Gas Markets Long-Term Outlook, Fall 2018.
Kinder Morgan transports ~40% of all natural gas consumed in the U.S.
Projected U.S. demand growth of ~40% primarily driven by
LNG exports +13 bcfd and power +7 bcfdU.S. production projected to grow by >30 bcfd or >40%
over next 10 years from four key basins
Marc./Utica, 23
Marc./Utica, 39
Permian, 7
Permian, 16
Haynesville, 6
Haynesville, 13
Eagle Ford, 4
Eagle Ford, 7
Other U.S., 36
Other U.S., 33
2017
2027E

Unmatched Natural Gas Network and Deliverability
10
Strong fundamentals drive value on existing assets and create investment opportunities
Source: WoodMackenzie, North America Gas Markets Long-Term Outlook, Fall 2018.
Permian
Eagle Ford
Haynesville
Exports to Mexico
LNG
Power
LNG, industrial, power and exports
to Mexico
DJ
Bakken
Power
Marcellus / Utica
Power
Power
Our network connects growing supply with key demand centers
= Growing supply area
= Key areas of demand growth
NGPL and EPNG
benefitting from
surging Permian
activity
TGP benefitting from
higher throughput
from projects
recently placed in
service and power
demand
Increased drilling
and production in
the Bakken,
Haynesville, and
Eagle Ford driving
greater G&P activity
Gas transport
volumes were up
4 Bcfd or 14%
in 3Q18 vs. 3Q17
Gas gathering
volumes were up
0.5 Bcfd or 20%
in 3Q18 vs. 3Q17
CIG throughput
benefitting from
growing DJ
production
TX Intrastates
benefitting from
higher utilization and
incremental
contracts to deliver
into Mexico, LNG
export facilities, and
Texas Gulf Coast
industrial markets
(Bcfd) 2017 2018E 2019E
U.S. Natural Gas Demand 81 90 95
Volume Growth 9 5
% Growth 11% 6%

$6.5bn of Commercially Secured Capital Projects Underway
Other segments’ backlog includes: $1.3 billion for CO2 EOR, $0.4 billion for CO2 S&T, $0.1 billion for Terminals and $0.1 billion for Products
Pipelines
– Primarily liquids-related opportunities
Beyond the backlog, expect $2 to $3 billion per year of ongoing organic investment opportunities :
– Predominantly natural gas opportunities related to LNG export (supply and liquefaction), Marcellus/Utica takeaway capacity, additional power
generation and incremental Gulf Coast deliverability
11
Significant opportunities primarily resulting from expansive natural gas footprint
Commercially Secured Capital Projects
Demand Pull /
Supply Push
KMI Capital
($ billion)
Estimated
In-Service Date Capacity
Natural Gas
Permian takeaway projects (GCX, PHP, EPNG, NGPL, Sierrita) $ 1.3 Q4 2018 – 2020 6.4 Bcfd
Elba liquefaction and related terminal facilities 1.2 2019 350 mDthd
Expansions to supply LNG export (NGPL, TGP, KMLP, EEC, Tejas) 0.6 Various 3.0 Bcfd
Bakken G&P expansions (Hiland Williston Basin) 0.6 Q4 2018 – 2019 Various
Marcellus southbound capacity (TGP Broad Run expansion) 0.5 Q4 2018 200 mDthd
Power generation supply projects (SNG, FGT) 0.2 Various 550 mDthd
Other natural gas 0.4 Various > 2.2 Bcfd
Total Natural Gas $ 4.6 ~71% of total at 5.4x EBITDA multiple
Other segments 1.9
Total Backlog $ 6.5

3.5 3.5
8.610.0
18.0
4.5
Today YE2018 YE2019 YE2020 2021+
U.S. Liquefaction Capacity(a) (Bcfd)
Growth Driver: Buildout of U.S. LNG Exports
Global demand driving significant buildout of LNG export capabilities in the U.S.
U.S. LNG exports reached over 3.1 Bcfd in July 2018 vs. 0.5 Bcfd in 2016 as incremental
capacity came online
18.0 Bcfd of fully-approved U.S. LNG export projects
10.7 Bcfd of projects already with FID, under construction or in-service
Multiple KM projects underway and opportunities ahead
18-year average term on ~4.5 Bcfd of contracted LNG export supply
Elba Island LNG terminal and related export facilities under construction
GCX and PHP to provide significant Permian supply
Additional infrastructure to meet next wave of LNG demand, including direct supply as well
as upstream capacity for 3rd party deliveries
12
Multiple liquefaction and natural gas transport opportunities across KM footprint
a) Source: EIA (released 10/18/2018) and company disclosures.
b) Based on LNG export capacity currently operating, under construction or FID. Includes firm transport to: Sabine Pass, Corpus Christi, Elba Island, Cameron, and Freeport.
In-service
Under construction
FID
Fully-approved
KM supplies ~42% of current U.S. liquefaction
capacity under long-term commitments(b)
TGP
KM Asset Contracted Capacity (mDthd) KM Capital ($mm)
TGP 1,200 $304
KMLP 600 $126
NGPL 1,635 $241
Intrastate 590 $134
EEC 436 $100
Total: 4,461 $906
Elba
Express
Intrastates
NGPL
KMLP
GCX
TGP
PHP
KM Network Reaches Multiple Export Facilities

Project Highlight: Elba Island LNG Export Terminal
13
Elba Liquefaction Company (ELC)(a) / Southern LNG Company (SLNG)
a) ELC is a 51/49 joint venture of Kinder Morgan and investment funds managed by EIG Global Energy Partners (EIG).
b) As of January 2018 Analyst Day; excludes non-KM capitalized interest cost.
Project Scope
Liquefaction facilities (10 small-scale modular units)
Ship loading facilities; boil-off gas compression
Located on Elba Island near Savannah, Georgia
Project Statistics
Liquefaction Capacity: 2.5 mtpa or ~350 mmcfd
Capital (100%):
– ELC: ~$1,390 million(b) / $745mm KM share
– SLNG: ~$430 million
In-service: Q1 2019 through Q4 2019 (phased)
Contract term: 20 years
Current Status
FERC certificate issued June 2016
DOE FTA and non-FTA authorizations received
Construction ongoing and expected online in Q1 2019
Fully-contracted under 20-year take-or-pay agreement with Shell
and ~70% of the economics expected with in-service of the first unit

Growth Driver: Surging Permian Production
Existing footprint reaches across Texas with connectivity into all major demand markets
Interconnected systems well-positioned to evacuate surging volume growth
out of the Permian Basin
Deliverability to Houston markets (power, petchem), substantial LNG export
capacity and Mexico
Pursuing a combination of expansions on existing systems, as well as new long-haul pipelines
Secured by long-term, take-or-pay cash flows
Partnered with other market leaders to deliver competitive solutions
Potential to leverage existing assets into long-haul Permian crude oil pipeline projects
KM Crude and Condensate (KMCC) pipeline to facilitate deliverability into the
Houston refining and export markets
Wink crude oil pipeline located in the heart of the Permian basin in proximity
to virtually all major takeaway pipelines in the area
14
KM providing additional takeaway capacity for associated natural gas production
Source: EIA Dril l ing Productivity Report (October 2018), KM internal data
Existing Permian Capacity New-Build Pipeline Projects
4.0 Bcfd aggregate capacity across EPNG,
NGPL and intrastate system
2.4 Bcfd aggregate in-basin de-bottlenecking
opportunities identif ied in the backlog
2.0 Bcfd greenfield capacity on GCX
2.0 Bcfd greenfield capacity on PHP
KM Positioned to Serve Current and Future Production
Oil
+69%+1.5 mmbbld
Dec’16 - Oct’18
Natural Gas
+64%+4.6 BcfdDec’16 - Oct’18
Natural Gas Pipelines
Under Construction
Crude Pipelines
KM delivering substantial Permian takeaway capacity to
Midcontinent, West, and Gulf Coast markets

Project Highlight: Gulf Coast Express (GCX)
Project Scope
Mainline: 447.5 miles of 42” pipeline originating at the Waha Hub
and terminating near Agua Dulce, Texas
Midland lateral: 50 miles of 36” pipeline
214,280 HP of installed compression
KM Texas Pipeline (KMTP) operator and constructor
KM 50%, DCP 25%, and Targa 25% ownership interest(a)
Project Statistics
Initial Capacity: 1.98 Bcfd
Capital (100%): $1.75 billion
In-Service: October 2019
Minimum contract term: 10 years
Current Status
Final investment decision to proceed made December 2017
Capacity fully-subscribed under long-term, binding agreements
Construction commenced and project remains on schedule
15
Permian direct-to-Gulf Coast project satisfying multiple growth drivers
a) Shipper Apache has a 15% equity option, which is expected to reduce KMI’s share to 35% if exercised.
First-to-market Permian takeaway solution leveraging our
expansive existing footprint and deliverability

Project Highlight: Permian Highway Pipeline (PHP)
Project Scope
Mainline: ~430 miles of 42” pipeline from the Waha to Katy, Texas
areas with connections to the U.S. Gulf Coast and Mexico markets
257,450 HP of installed compression
KM Texas Pipeline (KMTP) operator and constructor
KM 50% and EagleClaw Midstream Ventures 50% ownership
interest(a)
Project Statistics
Initial Capacity: 2.0 Bcfd
Capital (100%): ~$2 billion
In-Service: Late 2020
Minimum contract term: 10 years
Current Status
Final investment decision to proceed made September 2018
Capacity fully-subscribed and under long-term, binding agreements
Already secured pipe supply
16
PHP provides broad U.S. Gulf Coast market optionality for Permian production
a) KM and EagleClaw’s ultimate ownership interest may vary between ~27% and 50%, depending on outcome of equity ownership option s held by anchor shippers.
Second Permian solution with unmatched market optionality
expected to drive investment opportunities downstream

0
100
200
300
400
95 97 99 100 102
2015 2016 2017 2018 2019
North America Rest of World
Solid Liquids Fundamentals
17
Attractive opportunities to supply U.S. products to consumers here and abroad
Source: EIA Short Term Energy Outlook (November 2018), KM internal data
GROWTH LED BY CHINA AND INDIA OVER NEXT TWO YEARSGLOBAL LIQUIDS CONSUMPTION EXPECTED TO EXCEED 100 MILLION BARRELS PER DAY BY 2019World Petroleum and Other Liquids Consumption (mmbbld)
EXPORT CAPACITY REQUIRED TO DELIVER U.S. SUPPLIESTO GROWING DEMAND MARKETSKM Liquids Exports from Gulf Coast (mbbld)
+2.3
mmbbld
+0.7
mmbbld
Rest of World
North America

Positioned to Support U.S. Gulf Coast Exports
KM’s HSC position represents the largest independent refined products
terminalling system in U.S.
43 million barrels of total capacity
KM handles ~12% of total U.S. exports of gasoline, gasoline blend stocks and distillates
Unmatched pipeline connectivity
Built for inbound/outbound flexibility
Pipeline, rail, barge, ship and truck capabilities
Highly-contracted, highly-utilized
Record renewal rates
Clearing point for domestic and international markets
Pipeline connectivity to domestic markets in East Coast and Midcontinent
Marine connectivity to global markets
Scale allows for centralized operations to maximize customer optionality
Built to serve the world’s most competitive refining and petrochemical
industry across multiple products
Refined product core focus with complementary chemicals and renewables capabilities
Difficult to replicate
Dominant position drives opportunities to grow with customers and the
market
Export demand for multiple products
Petrochemical / chemicals expansions
18
The Houston Ship Channel is the premier refined products aggregation and market-clearing terminals hub
Integrated Houston Ship Channel Terminal Footprint
Invested nearly $2 billion in HSC since 2010
ExxonMobilBaytown
Deer Park
RefiningShell / Pemex
ExxonMarathonP66Shell
Pasadena
RefiningPetrobras
Houston
RefiningLyondellBasell
ValeroHouston
P66Sweeny
Splitter
Chevron
Jefferson Street
BOSTCO
Galena
Park
Pasadena
KM
Export Terminal
Deepwater
Mont
Belvieu
Colonial
Explorer
Other
KMCC
MarathonTexas City
MarathonGalveston Bay
ValeroTexas City
Galena
Park West
Channelview
Greens Port &
North Docks
Colonial
ExplorerOther Destinations
Pipeline “Colex” Origination Terminals
Texas City Area Refineries
KM terminals and assets
refined product terminals
local refineries and processing
truck racks
rail inbound and outbound
marine docks
# Asset Connectivity
20 Inbound Pipelines 10 Houston area refineries and local chemical plants
15 Outbound Pipelines Texas, Midcontinent, and East Coast markets
14 Cross-Channel Pipelines Interconnecting the system
12 Barge Docks Receipt and delivery of products and blendstocks
11 Ship Docks Serving export and Jones Act markets
9 Bay Truck Rack Averaging ~90 mbbld of local Houston market delivers
3 Unit Train Facilities Crude oil, condensate, and ethanol

Beyond the Backlog
>$400 billion of estimated infrastructure investment required to support North American natural gas growth over next ~20 years(a)
Transport additional supply for LNG exports
Takeaway capacity expansions for significant Marcellus/Utica growth
Storage to support renewable power
generation and LNG exports
Haynesville 2.0
Downstream connectivity for Permian volumes
19
Long-term natural gas fundamentals drive value on existing assets and new projects
a) ICF (June 2018).

25%
11% 11% 9% 9%
7% 6%3% 3%
Med: 8%
KMI WMB PAGP ENB-CN TRP-CN MMP ET EPD SEP
Implied 2020E dividend yield of 7% based on current share price
12.1x 11.9x 11.4x
11.2x 11.1x 10.6x 10.6x9.5x
8.6x
Med: 11.1x
ENB-CN MMP ET SEP EPD TRP-CN WMB KMI PAGP
2.3x2.1x
1.8x 1.6x
1.5x 1.5x 1.5x1.3x
1.1x
Med: 1.5x
KMI TRP-CN WMB PAGP EPD ET ENB-CN MMP SEP
14%13%
12%
11% 11% 10% 10% 10%9%
Med: 10%
ET KMI TRP-CN WMB EPD ENB-CN PAGP SEP MMP
20
Median valuation metrics imply ~30% share price upside for KMI
2019 DCF YIELD(a)
‘18-20E DIVIDEND GROWTH CAGR(c)
2019 EBITDA MULTIPLE(b)
2019 DIVIDEND COVERAGE(d)
Potential Valuation Upside
Notes: Market prices and Bloomberg consensus data as of 11/27/18. Median figures are based on peer group and exclude KMI. Peer group: ENB-CN, EPD, ET, MMP, PAGP, SEP, TRP-CN, and WMB.
a) 2019E DCF per share divided by 11/27/2018 share price.
b) 11/27/2018 enterprise value divided by 2019E EBITDA.
c) Dividend per share CAGR.
d) 2019E DCF per share divided by 2019E dividend per share.

Key Takeaways
21
Run for shareholders, by shareholders
a) Based on market capitalization as of 11/27/2018.
b) 2018B DCF per share divided by 2018B dividend per share.
Diversified energy infrastructure
One of the 10 largest energy companies in the S&P 500(a)
Core to North American economy
Stable, fee based cash flows
Multi-year contracts
Market leader in each segment
Positioned for growth
$6.5bn backlog primarily focused on LNG, Permian and Gulf Coast
Asset footprint and connectivity provide competitive advantage
Upside potential on existing capacity
Supportive underlying long-term fundamentals
Financial flexibility to execute
Commitment to maintaining a healthy balance sheet
Long-term net debt / EBITDA target of around 4.5x achieved
Positioned for rating agency upgrade
No KMI equity issuance since 2015 and none expected for foreseeable future
Delivering shareholder value
Significant cash flow generation
25% dividend growth in 2019 and in 2020
$2 billion buyback program
Best-in-class dividend coverage (2.6x in 2018B(b))
Management owns 14% of KMI
A core holding in any portfolio

Appendix
22

Kinder Morgan Canada Limited (TSX:KML)
On August 31, 2018, KML closed the sale of the Trans Mountain Pipeline and related assets to the Government of Canada for C$4 .5 billion
(subject to customary purchase price adjustments)
– Sold assets include 2.9 mmbbls of regulated tanks, the Puget Sound Pipeline, the Kamloops/Sumas/Burnaby Terminals and the Westridge Marine Terminal
– Net proceeds (after taxes, customary purchase price adjustments and repayment of KML debt) to be used for a special distribution (as a return of capital), resulting in ~C$11.40 per restricted voting share scheduled to be paid on January 3, 2019
– Comprehensive review of KML strategic options underway
Remaining KML assets underpinned by multi-year take-or-pay contracts with high quality customers:
23
Strategic assets positioned to support growing oil sands production
EDMONTON TERMINALS COCHIN PIPELINE VANCOUVER WHARVES TERMINAL
Integrated hub position
12.1 mmbbls tankage
Substantial rail capabilities
Final Base Line Terminal tanks placed in-service in Q3
and early Q4 2018
Delivers ~90 mbbld (per 2018B) of condensate for
bitumen blending under long-term take-or-pay contracts through 2024
Existing footprint extremely valuable as new cross-border
pipeline projects remain challenging
Largest mineral concentrate export/import facility on West
Coast of North America
Majority of capacity under take-or-pay contracts with
remaining average term of ~4 years as of 12/31/17
C$43mm expansion supported by 20-year take-or-pay
contract expected online Q1 2021
COCHIN PIPELINE FACILITY VANCOUVER WHARVES TERMINALEDMONTON HUB

Long-Term Growth Drivers
Natural Gas Pipelines
Exports
LNG exports: liquefaction facilities and pipeline infrastructure
Exports to Mexico
Shale-driven expansions / extensions
Expansions / extensions off existing footprint
Greenfield projects
End-user / LDC demand growth
Gulf Coast industrial growth
Regional power gen. opportunities
Enhanced access to LDC markets
Pipeline conversions
Repurpose assets to achieve greater value
Enhanced deliverability
Support LNG liquefaction
Backstop variable renewable generation and peak summer/winter demand
Products Pipelines
Steady demand for refined
products volumes on strategically
located assets
Annual FERC index rate
adjustments
Expansion of refined products
pipeline systems and terminals
networks
Repurposing portions of existing
footprint in different product uses
Summary
Terminals
North American Logistics Solutions
Crude and NGL growth
Refining and petrochemical growth
Refined Products
Shifts in supply / demand patterns
Export demand growth
Increasing renewables
Petrochemicals
Industry production increases
Logistics solutions
Core Hub Terminal Focus
Increased connectivity
New market access & optionality
Further value-added services
Complementary acquisitions
CO2
CO2 Supply
Demand for scarce supply of CO2
drives volume and price
Trillions of cubic feet of
recoverable CO2 in KM-operated
fields
Enhanced Oil Recovery (EOR)
Billions of barrels of oil still in place
to be recovered in the Permian
Basin
~9 billion barrels Original Oil in
Place (OOIP) in KM-operated
fields
24

Attractive Results on Recent Expansion Projects
25
Projects completed during 2015-2017: capital invested / year-2 EBITDA(a)
Note: Includes certain projects placed in service prior to 2015, but continued to incur project-related costs. Project completion is generally determined when project-related costs are no longer being incurred.
a) Multiple reflects KM share of invested capital divided by project EBITDA generated in its second full year of operations. Excludes CO 2 segment projects.
b) Capital invested is actual, except for 2 projects ($585mm of capex, 6% of total capex), which are partially in service. EBITDA is act ual or current estimate.
6.1x 6.0x 6.0x
5.5x
Total Capital Invested Natural Gas Pipelines
Original Estimate Actual / Current Estimate (b)

$0.3
$0.5
$1.9
$5.4
66% Fee-Based Take-or-Pay: highly dependable cash flow under multi-year contracts
Entitled to payment regardless of throughput for periods of up to 20+ years
24% Other Fee-Based: dependable cash flow, independent from commodity price
Supported by stable volumes, critical infrastructure between major supply hubs and stable end-user demand
Natural Gas Pipelines (10%): G&P cash flow protected by dedications of economically viable acreage
Products Pipelines (9%): competitively advantaged connection between refineries and end markets has resulted in stable or growing refined products piped volumes
Terminals (4%): 88% of fee-based cash flow associated with high-utilization liquids assets and requirements contracts for petcoke and steel
6% Hedged: disciplined approach to managing price volatility
CO2 actual oil volumes produced have been within 1.5% of budget over the past 10 years
CO2 oil production hedge schedule(b):
Stable, Multi-Year Fee-Based Cash Flow
26
~96% of 2018B cash flow are from take-or-pay and other fee-based contracts or hedged(a)
a) Based on 2018 budgeted Segment EBDA before Certain Items and including KM -share of Certain Equity Investee DD&A (non-GAAP measure).
b) Percentages based on currently hedged crude oil and propane volumes as of 9/30/2018 relative to crude oil, propane and heavy NGL (C4+) net equity production projected for 4Q18, and the Ryder Scott reserve report for 2019-
2022 (historically below management expectations).
4% Commodity Based
Year Hedged Vol. % Hedged Avg. Px.
2018 35,459 75% $58
2019 29,272 69% $56
2020 15,800 43% $57
2021 9,100 35% $55
2022 3,300 21% $57

Energy Toll Road
27
Cash flow security with ~90% from take-or-pay and other fee-based contracts
Note: All figures as of 1/1/2018, unless otherwise noted.
a) 2018 budgeted Segment EBDA before Certain Items and including KM-share of Certain Equity Investee DD&A (non-GAAP measure). See Appendix for definitions of non-GAAP measures. KM Canada segment sold on 8/31/2018.
b) Includes term sale portfolio.
c) Based on KMI 2018 budgeted Segment EBDA before Certain Items and including KM -share of Certain Equity Investee DD&A where applicable (non-GAAP measure).
d) Jones Act vessels: average remaining contract term is 2.8 years, or 5.0 years including options to extend.
e) Percentage of 4Q18 budgeted net crude oil, propane and heavy NGL (C4+) net equity production.
f) Terminals not FERC regulated, except portion of CALNEV.
Natural GasPipelines
ProductsPipelines
Terminals CO2
Kinder MorganCanada
’18B EBDA %(a) 56% 15% 15% 11% 3%
Asset Mix (% of Segment EBDA)
73% interstate pipelines
9% intrastate pipelines and storage
18% gathering, processing and treating (G&P)
61% refined products
39% crude / NGLs
80% liquids64% terminals16% Jones Act tankers
20% bulk
66% oil production related
34% source & transportation
Volume Security
Interstate & LNG: ~94% take-or-pay
Intrastate:~76% take-or-pay(b,c)
G&P: ~86% fee-based(c) w ith minimum volume
requirements and/or acreage dedications
Refined products: primarily volume-based
Crude / liquids: primarily take-or-pay
Liquids & Jones Act:primarily take-or-pay
Bulk: primarily minimum volume guarantee or requirements
S&T: primarily minimum volume guarantee
O&G: volume-based
AverageRemainingContract Life
Interstate / LNG: 6.1 / 14.4 yrs.
Intrastate:5.8 yrs.(b)
G&P: 5.6 yrs.
Refined products:generally not applicable
Crude / liquids: 5.0 yrs.
Liquids: 3.4 yrs.
Jones Act: 2.8 yrs.(d)
Bulk: 4.0 yrs.
S&T: 7.6 yrs.
PricingSecurity
Interstate:primarily f ixed based on contract
Intrastate:primarily f ixed margin
G&P: primarily f ixed price
Refined products: annual FERC tariff escalator(PPI-FG + 1.23%)
Crude / NGLs: primarily f ixed based on contract
Based on contract; typically f ixed or tied to PPI
S&T: 78% protected by minimum volumes and floors(c)
O&G: volumes 75% hedged(e)
RegulatorySecurity
Interstate: regulated return
Intrastate:essentially market-based
G&P: market-based
Pipelines: regulated return
Terminals & transmix: not price regulated(f)Not price regulated Primarily unregulated
CommodityPriceExposure
Interstate:no direct exposure
Intrastate: limited exposure
G&P: limited exposure
Minimal, limited to transmix business No direct exposureFull-year 2018: $6mm in DCF per $1/Bbl change in oil price
SO
LD
8/3
1/2
018

28
Prioritizing ESG Everyday ESG-Related Achievements
Environmental, Social and Governance (ESG)
Operations Management System
Intentional, routine risk management activities established to maintain
compliance, to reveal and manage risk and to continually improve our
safety and compliance culture
Board Oversight
KMI and KML Board Environmental, Health and Safety Committees
oversee ESG matters
Multiple policies outlining KM’s approach to Environmental and Social responsibility
EHS Policy Statement – Reinforcement of KM’s Commitment to EHS
principles
Biodiversity – Minimize impacts on biodiversity in areas where we work and operate
Indigenous Peoples and Aboriginal Relations – Commitment to
communicate and cooperate with Indigenous and Aboriginal peoples
Community Relations – Build and maintain healthy relationships throughout the areas where we operate through two-way engagement
and dialogue to build trust and foster collaboration
Published first stand-alone ESG Report in October 2018
Follows the Sustainability Accounting Standards Board (SASB) standards and Task Force
on Climate-related Financial Disclosures (TCFD) guidance
Also informed by the Global Reporting Initiative (GRI) and CDP (formerly the Carbon
Disclosure Project) frameworks
“Kinder Morgan’s ESG report provides a clear example of improved sustainability
disclosure to investors.” - SASB
Publicly reporting ESG metrics since 2007
Employees - including management - bonuses are tied to performing better than industry
averages & our own 3-year averages
Metrics reported: Employee Injury/Illness Rates and Avoidable Vehicle Accidents, KM
Contractor Injuries/Illnesses, Gas Pipeline Incidents, Liquid Releases from Onshore
Pipeline Right-of-Way
Recognized by EDF for moving forward on methane disclosure and establishing quantitative methane targets
Rated in the top quartile of midstream sector for methane disclosures
Leader in Methane Emission Reductions
20+ year involvement in EPA’s voluntary Natural Gas STAR program
– Cumulative methane emission reductions of 108 Bcf, equivalent to the CO2 emissions from the energy used in 5.6 million homes in one year
Founding Member of ONE (Our Nation’s Energy) Future
– KM’s transmission and storage sector emissions intensity target is 0.31% by 2025
Committed to being a good corporate citizen
For consolidated ESG information, please visit
the ESG/sustainability webpage on our KMI and
KML websites

29
OUR SAFETY PERFORMANCE VS. INDUSTRY(a)
# of safety metrics
Asset Integrity and Safety are Top Priorities
Safe operation of our assets is mission critical to our long-term success
We continue to reduce operational risks, which in turn benefits our employees, contractors, assets, the public, and the environment
We strive for improvement in safety and efficiency of existing operations
Additionally, we properly execute expansions and effectively integrate acquired operations
Kinder Morgan’s EHS statistics consistently outperform the industry average
We track 31 safety metrics and post monthly updates to our public website
Currently we are outperforming the industry in 29 of the 31 metrics that we track(a)
a) Based on period-end Kinder Morgan metrics versus most applicable industry performance.
Kinder Morgan’s EHS metrics consistently outperform the industry
31
28
31
2930
2829
0
5
10
15
20
25
30
2012 2013 2014 2015 2016 2017 9M18
KM outperformed industry 31 Total Safety Metrics

KMI Business Risks
Regulatory
– FERC rate cases (Products Pipelines and Natural Gas Pipelines)
– Provincial, state, and local permitting issues
CO2 crude oil production volumes
Throughput on our volume-based assets
Commodity prices
– 2018 budget average strip price assumptions: $56.50/bbl for crude and $3.00/mmbtu for natural gas
– Price sensitivities (full-year):
Project cost overruns / in-service delays
Interest rates
– Sensitivity (full-year): 100-bp change in floating rates = ~$110 million interest expense impact(b)
Foreign exchange rates
– 2018 budget rate assumption of 0.79 USD / CAD
– Sensitivity (full-year): 0.01 ratio change = ~$2 million DCF impact (assumed owned Kinder Morgan Canada segment for full year)
Environmental (e.g. pipeline / asset failures)
Economically sensitive business
Cyber security
30
Summary
a) Natural Gas Midstream sensitivity incorporates current hedges, and assumes ethane recovery for majority of year, constant eth ane frac spread, and assumes other NGL prices maintain same relationship with oil prices.
b) As of 9/30/2018, approximately $11.0 billion of KMI’s long -term debt was floating rate (~30% floating).
Price ∆ Commodity DCF Impact
$1/bbl Oil ~$7mm
$0.10/mmbtu(a) Natural Gas ~$1mm
1% NGL / crude ratio ~$2mm

Natural Gas Segment Outlook and Asset Overview
Project Backlog:
$4.6 billion of identified growth projects over the 2018-2022 time period(a)
Permian takeaway, including de-bottlenecking and new builds
LNG liquefaction (Elba Island)
Transport projects supportingLNG exports
Bakken G&P expansions
Power generation
31
Well-positioned: connecting key natural gas resources with major demand centers
a) Includes KM share of non-wholly owned projects. Includes projects currently under construction.
Asset Summary
Natural Gas Pipelines: 70,000 Miles
U.S. Nat Gas Moved by KM ~40 Bcf
Working Gas Storage Capacity: 658 Bcf

Highly-Contracted Natural Gas Pipelines
Negative figures represent unfavorable re-contracting exposure based on Nov. 2017 market assumptions
Excludes projects currently in the project backlog
32
Contracted capacity and term by region
a) Purchase contracts not included.
Interstate
Transport ContractsAvg. = 6 yr, 1 mo
Region 2019 2020
NORTH 0.1% (0.1%)
SOUTH (0.3%) (0.9%)
WEST (0.1%) 0.0%
MIDSTREAM (0.2%) (0.2%)
Total Natural Gas Pipeline Segment (0.5%) (1.2%)
RegionContractedCapacity
Average TermRemaining
NORTHStorage 326 Bcf 2 yr, 11 mo
Transport 19.3 Bcfd 6 yr, 3 mo
SOUTH
Storage 52 Bcf 1 yr, 8 mo
Transport 13.2 Bcfd 7 yr, 2 mo
LNG 18 Bcf 14 yr, 5 mo
WESTStorage 45 Bcf 6 yr, 8 mo
Transport 17.2 Bcfd 5 yr, 3 mo
MIDSTREAM
Purchases 2.7 Bcfd 2 yr, 0 mo
Sales 2.7 Bcfd 2 yr, 2 mo
Storage 74.3 Bcf 2 yr, 5 mo
Transport(a) 5.6 Bcfd 5 yr, 9 mo
Processing 1.9 Bcfd 5 yr, 6 mo
Net Annual Incremental Re-Contracting Exposure (KM Share): % of $8.1bn Total KMI Segment EBDA

Products Segment Outlook and Asset Overview
Project Backlog:
$0.1 billion of identified growth projects over the 2018-2019 time period(a)
Additional condensate splitter processing capabilities and connectivity for existing throughput
Biodiesel blending
Multiple refined products terminalling projects
33
Products pipelines: stable, strategic assets
a) Includes KM share of non-wholly owned projects. Includes projects currently under construction.
Asset Summary
Pipelines: ~10,000 Miles
2017 Throughput ~2.1 mmbbld
Condensate Processing Capacity 100 mbbld
Transmix 5 facilities
Terminals: 66 Terminals
Terminals Tank Capacity ~43 mmbbls
Pipeline Tank Capacity ~15 mmbbls

Terminals Segment Outlook and Asset Overview
Project Backlog:
$0.1 billion to be completed in 2018-2021(a)
Primarily remaining Base Line tanks
Diesel tank expansion at Van Wharves
Other small investments to expand services at existing terminal facilities in Houston Ship Channel and other locations
34
A diversified system across liquid and bulk hubs and services
a) Includes KM share of non-wholly owned projects. Includes projects currently under construction.
Asset Summary
Total Kinder Morgan Terminals: 152 Terminals
Terminals Segment – Bulk 35 Terminals
Terminals Segment – Liquids 51 Terminals
Products Segment Terminals 66 Terminals
Jones Act: 16 Tankers

CO2 Segment Outlook and Asset Overview
Project Backlog:
$1.7 billion of identified growth projects over the 2018-2023 time period(a)
$1.3 billion related to Enhanced Oil Recovery (EOR) production and $0.4 billion related to Source & Transportation (S&T)
EOR: Tall Cotton, SACROC, and Yates oil production
S&T: Southwest Colorado CO2 production
35
Own and operate CO2 for Enhanced Oil Recovery (EOR)
a) Includes KM share of non-wholly owned projects. Includes projects currently under construction.
Cortez
Asset Summary
Production (2018B): Net
CO2 0.6 Bcfd
Oil 38 mbbld
NGLs 11 mbbld
Pipelines: Capacity
Cortez 1.5 Bcfd
Wink 145 mbbld

CO2 Segment Significant Returns and FCF
36
Generating high returns and ~$6 billion in cumulative free cash flow
a) CO2 Segment Net Income plus DD&A, less capital expenditures (growth and sustaining).
b) 2018 = Budget, 2018 at $56.50/bbl, 2019 at $58/bbl, 2020 at $60/bbl, 2021+ at $65/bbl; cost metrics based on 2017 run rate; develo pment plans may change in different price scenarios.
$2.7 $3.1
$3.7 $4.2
$4.9 $5.3
$5.8
2012 2013 2014 2015 2016 2017 2018B
0%
5%
10%
15%
20%
25%
30%
EOR Total CO2 Segment(incl. S&T)
$-
$250
$500
$750
$1,000
$1,250
$1,500
S&T SACROC Yates Katz Goldsmith Tall Cotton
DISTRIBUTABLE CASH FLOW(b)
$ Millions
CUMULATIVE FCF GENERATION(a)
$ Billions
IRR% 2000-2017

Use of Non-GAAP Financial Measures
The non-generally accepted accounting pr inciples (non-GAAP) financ ial measures of distributable cash flow (DCF), both in the aggregate and per share, segment earnings before deprec iation, depletion, amortization and
amortization of excess cost of equity investments (DD&A) and Certain Items (Segment EBDA before Certain Items), net income before interest expense, taxes, DD&A and Certain Items (Adjusted EBITDA) and Adjusted
Earnings are included in this presentation.
Reconc iliations of DCF, Segment EBDA before Certain Items, Adjusted EBITDA and Adjusted Earnings to their most directly comparable GAA P financial measures are prov ided below . Budgeted Net Income (the GAAP
financial measure most directly comparable to DCF, Adjusted EBITDA and Adjusted Earnings) is not provided due to the inherent diff iculty and impracticability of predicting certain amounts required by GAAP, such as
ineffectiveness on commodity, interest rate and foreign currency hedges, unrealized gains and losses on derivatives marked to market, and potential changes in estimates for certain contingent liabilities.
Certain Items, as used to calculate our Non-GAAP measures, are items that are required by GAAP to be reflected in net income, but typically either (1) do not have a cash impact (for example, asset impairments), or (2) by
their nature are separately identif iable from our normal business operations and in our view are likely to occur only sporadically (for example certain legal settlements, enactment of new tax legislation and casualty losses).
DCF is calculated by adjusting net income available to common stockholders before Certain Items for DD&A, total book and cash taxes, sustaining capital expenditures and other items. DCF is a signif icant performance
measure useful to management and by external users of our f inancial statements in evaluating our performance and to measure and estimate the ability of our assets to generate cash earnings after servicing our debt and
preferred stock dividends, paying cash taxes and expending sustaining capital, that could be used for discretionary purposes such as common stock dividends, stock repurchases, retirement of debt, or expansion capital
expenditures. We believe the GAA P measure most directly comparable to DCF is net income available to common stockholders. A reconciliation of net income available to common stockholders to DCF is provided herein.
DCF per share is DCF divided by average outstanding shares, including restricted stock aw ards that participate in dividends.
Segment EBDA before Certain Items is used by management in its analysis of segment performance and management of our business. General and administrative expenses are generally not under the control of our
segment operating managers, and therefore, are not included w hen w e measure business segment operating performance. We believe Segment EBDA before Certain Items is a signif icant performance metric because it
provides us and external users of our financial statements additional insight into the ability of our segments to generate segment cash earnings on an ongoing basis. We believe it is useful to investors because it is a measure
that management uses to allocate resources to our segments and assess each segment’s performance. We believe the GAAP measure most directly comparable to Segment EBDA before Certain Items is segment earnings
before DD&A and amortization of excess cost of equity investments (Segment EBDA). Segment EBDA before Certain Items is calculated by adjusting Segment EBDA for the Certain Items attr ibutable to a segment, w hich are
specif ically identif ied in the accompanying tables.
Adjusted EBITDA is calculated by adjusting net income before interest expense, taxes, and DD&A (EBITDA) for Certain Items, net income attr ibutable to noncontrolling interests further adjusted for KML noncontrolling
interests, and KMI’s share of certain equity investees’ DD&A (net of consolidating joint venture partners’ share of DD&A) and book taxes, w hich are specif ically identif ied in the footnotes to the accompanying tables. Adjusted
EBITDA is used by management and external users, in conjunction w ith our net debt, to evaluate certain leverage metrics. Therefore, w e believe Adjusted EBITDA is useful to investors. We believe the GAAP measure most
directly comparable to Adjusted EBITDA is net income.
Adjusted Earnings is net income available to common stockholders before Certain Items . Adjusted Earnings is used by certain external users of our financial statements to assess the earnings of our business excluding
Certain Items as another reflection of our business’s ability to generate earnings. We believe the GAAP measure most directly comparable to Adjusted Earnings is net income available to common stockholders. Adjusted
Earnings per share is Adjusted Earnings divided by average adjusted common shares w hich include KMI’s w eighted average common shares outstanding, including restricted stock aw ards that participate in dividends.
Budgeted Net Income (the GAA P financial measure most directly comparable to DCF, Adjusted EBITDA and Adjusted Earnings) is not provided due to the inherent diff iculty and impracticability of predicting certain amounts
required by GAAP, such as ineffectiveness on commodity, interest rate and foreign currency hedges, unrealized gains and losses on der ivatives marked to market, and potential changes in estimates for certain contingent
liabilities.
Our non-GAAP measures described above should not be considered alternatives to GAA P net income or other GAAP measures and have important limitations as analytical tools. Our computations of DCF, Segment EBDA
before Certain Items and Adjusted EBITDA may differ from similarly titled measures used by others. You should not consider these non-GAAP measures in isolation or as substitutes for an analysis of our results as reported
under GAAP. DCF should not be used as an alternative to net cash provided by operating activities computed under GAAP. Management compensates for the limitations of these non-GAA P measures by review ing our
comparable GAAP measures, understanding the differences betw een the measures and taking this information into account in its analysis and its decision making processes.
37

38
KMI: 2018B Adjusted EBITDA($ in millions)
Note: See Appendix for defined terms and reconciliations of non-GAAP measures for the historical period.
(a) Includes deduction for 3rd party share of certain consolidated joint ventures. JV DD&A is not reduced by the noncontrolling interests' portion of KML DD&A of ($37) and ($20) million in 2018
and 2017, respectively.
(b) KMI's share of taxable equity investees' book taxes.
(c) Before Certain Items.
(d) Represents 3rd party share of certain consolidated joint ventures excluding KML noncontrolling interests of ($80) and ($27) million in 2018 and 2017, respectively.
2018 2017 Change
Adjusted EBITDA Budget Actual $ %
Segment EBDA before Certain Items 7,707$ 7,359$ 348$ 5%
Natural Gas Pipelines JV DD&A(a) 375 378 (3) -1%
CO2 JV DD&A 8 8 0 0%
Products Pipelines JV DD&A(a) 8 2 6 300%
Terminals JV DD&A(a) (5) (6) 1 -17%
Segment EBDA before Certain Items plus JV DD&A 8,093 7,741 353 5%
JV book taxes(b) 78 114 (36) -32%
Noncontrolling interests(c,d) (39) (12) (27) 225%
General and administrative and corporate charges (c) (647) (645) (2) 0%
Adjusted EBITDA 7,485$ 7,198$ 287$ 4%

KMI LTM Net Debt / Adjusted EBITDA Reconciliation
39
($ in millions)
a) Amounts exclude: (i) the preferred interest in general partner of KMP; (ii) debt fair value adjustments; and (ii i) the foreign exchange impact o n our Euro denominated debt of $93 million and $143 mill ion as of September 30, 2018
and December 31, 2017, respectively, as we have entered into swaps to convert that debt to U.S.$.
b) Amounts include 50% of KML preferred shares, which is included in noncontrolling interests, of $215 million as of both September 30, 2018 and December 31, 2017. Also, the cash component as of September 30, 2018 has been
reduced by $919 million, representing the portion of cash KML intends to distribute to KML restricted voting shareholders early in 2019 as a return of capital subject to KML shareholder approval.
c) 2018 and 2017 amounts exclude KML noncontrolling interests before certain items of $58 million and $27 million, respectively.
d) 2018 and 2017 amounts include KMI's share of certain equity investees' DD&A of $388 million and $382 million, respectively .
e) 2018 and 2017 amounts include KMI's share of taxable equity investees' book taxes before certain items of $93 million and $11 4 million, respectively.
September 30, December 31,
2018 2017
33,410$ 36,409$
34,544 36,624
September 30, December 31,
Reconciliation of Net Income to Adjusted EBITDA 2018 2017
Net income 425$ 223$
Total certain items 1,933 1,445
Net income attributable to noncontrolling interests (c) (258) (12)
DD&A and amortization of excess investments (d) 2,755 2,704
Income tax expense before certain items (e) 762 967
Interest, net before certain items 1,885 1,871
7,502$ 7,198$
4.5 5.1
4.6 5.1
Adjusted Net Debt (b)
Net Debt (a)
Adjusted EBITDA Twelve Months Ended
Adjusted EBITDA
Net Debt to Adjusted EBITDA
Adjusted Net Debt to Adjusted EBITDA

40
Note: Definitions for defined terms found in the Appendix.
(a) Includes DD&A, amortization of excess cost of equity investments and KMI share of certain equity investee’s DD&A, net of the noncontrolling interests’ portion of KML DD&A and
consolidating joint venture partners’ share of DD&A of $362 million.
(b) Includes KMI share of taxable equity investee’s book taxes, net of the noncontrolling interests’ portion of KML book taxes, of $104 million, and excludes book tax certain items of
$(1,085) million.
(c) Includes KMI share of taxable equity investee’s cash taxes of $(69) million.
(d) Includes non-cash compensation associated w ith restricted stock program and a pension contribution.
(e)
(f) Excludes Kinder Morgan G.P. Inc.'s $100 million preferred stock due 2057 and $143 million non-cash foreign exchange impact on KMI's Euro denominated debt.
(g) Includes KMI share of taxable equity investees' book taxes of $114 million.
(h) Before Certain Items. Represents 3rd party share of certain consolidated joint ventures excluding KML noncontrolling interests of ($27) million.
(i) Includes KMI share of certain equity investee DD&A of $382 million.
Includes KMI share of (i) certain equity investee’s, (ii) KML’s, and (ii) consolidating subsidiaries’ sustaining capital expenditures of $(107) million.
KMI GAAP Reconciliation($ in millions)
Yr. Ended Yr. Ended
Reconciliation of DCF 12/31/17 Reconciliation of Adjusted EBITDA 12/31/17
Net Income Available to Common Stockholders 27$ Net Income 223$
Certain Items 1,445 Certain Items 1,445
Adjusted Earnings 1,472 Income taxes before Certain Items(g) 967
DD&A(a) 2,684 Noncontrolling interests(h) (12)
Book taxes(b) 957 DD&A(i) 2,704
Cash taxes(c) (72) Interest, net before Certain Items 1,871
Other items(d) 29 Adjusted EBITDA 7,198$
Sustaining capex(e) (588)
DCF 4,482 Certain Items
Acquisition and divestiture related costs 8$
Reconciliation of Segment EBDA before Certain Items Fair value amortization (53)
Segment EBDA before DD&A 6,975$ Contract and debt early termination (19)
Certain Items impacting segments 384 Legal and environmental reserves (37)
Segment EBDA before Certain Items 7,359 Change in fair market value of derivative contracts 40
Losses on impairments and divestitures, net 170
Reconciliation of net debt Hurricane damage 27
Long-term debt excluding fair value adjustments (f ) 33,845$ Other 5
Current portion of debt 2,828 Subtotal 141
50% KML preferred equity 215 Book tax Certain Items (77)
Less: cash & equivalents (264) Impact of 2017 Tax Cuts and Jobs Act 1,381
Net debt 36,624$ Total Certain Items 1,445$