Investor Presentation - iec.co.il
41
Investor Presentation Israel Electric Corp. Business update as of 03 / 31 / 2021 July 2021
Transcript of Investor Presentation - iec.co.il

Investor
Presentation
Israel Electric Corp.
Business update as of 03/31/2021
July 2021

Disclaimer
The Company is a public company, with all it entails, and this information provided to you, all or part of it, may constitute “Inside Information” in
accordance with Israel’s Securities Law, 1968 (hereinafter: “Securities Law”), and making use of this information (including, but not only, by way of
carrying out a transaction in a security of IEC, and/or delivering this information, or an opinion regarding a security of IEC, to any third party who
may use this information for purposes of such transaction) may constitute a criminal offence pursuant to Securities Law.
Please treat this information as CONFIDENTIAL and do not disclose, publish or deliver all or any part of this information, directly or indirectly, to
any third party, except for your employees, officers and any person acting for you or on your behalf, strictly on a “need to know” basis, and only
after you have notified the person receiving any of this information that the information is confidential and that making use of this information may
constitute a criminal offence as specified above
This Presentation does not constitute or form part of and should not be construed as an offer to sell or issue, or the solicitation of an offer to buy or
acquire, securities of the Company. This Presentation is solely for informational purposes. The information contained in this presentation regarding
the Company's operations is concise and presented for convenience purposes only. To get a complete picture of the Company's operations, please
refer to the immediate and timely reports of the Company to the Israeli Securities authority and the Tel-Aviv Stock Exchange.
This presentation includes forward-looking information, as per its definition in the Securities Law, including forecasts and other information whose
realization is uncertain and depends on factors that are not under the control of the Company. These factors are based, among other things, on
data that is in the possession of the Company as of this date, internal estimates and expectations of the Company regarding trends in the
Company's fields of activity and regarding the implementation of the company's plans. The Company's forecast and expectations included in this
presentation may not be realized, in whole or in part, or may be realized in a different manner than expected, inter alia due to factors that some of
them are not under the control of the Company, including changes in the market conditions and the Company's business environment, regulatory
changes, or the realization of any of the risk factors of the Company.
The information contained in this presentation is provided as of the date of this presentation. The Company is not under any obligation to
update the information in this presentation or to update the forward-looking statements contained in it.
Investor Relations 2

Agenda
1 Executive Summary
2 Operational Overview
3 Israeli Electricity Sector
4 Financial Overview
5 Sustainability Overview
3Investor Relations

Executive Summary
4

Gas turbine (internal
combustion) /
Combined-cycle
(internal combustion
and steam)
Steam (dual
purpose)
400 kV lines
161 kV lines
Israel Electric Corp. at a Glance
Established in 1923, 98 years of operation, the Israel Electric Corporation Limited (“IEC”) is the
sole vertically integrated electric utility company in Israel and generates, transmits, distributes and
supplies the majority of the electricity used in Israel.
IEC is appx. 99.85% owned by the State of Israel.
IEC had total assets of NIS 85.9 billion and 11,063 employees as of March 31, 2021.
As of March 31, 2021, IEC served 2.9 million residential, commercial, agricultural and industrial
customers throughout the State of Israel, including East Jerusalem and the Palestinian Authority
(PA)
Total electricity sales of 11,670 GWh for the year ended March 31, 2021.
IEC Power Grid
11.6 GWInstalled capacity
15Power stations
Generation (1)
5,715 kmHigh and ultra-high voltage
transmission grid
220 (2)
Switching stations &sub-stations
Transmission (1)
68,344 kmMedium and low
voltage lines
2.9 mnCustomers
Distribution (1)
3M-2021 Key Financials Credit Ratings as of March 31, 2021
Revenues
NIS 5.1 billion
EBITDA
NIS 1.7 billion
IEC GlobalBaa2 / BBB
Positive / Stable(Moody’s / S&P)
IEC Local Aa1 / AA+
Stable / Stable(Midroog / Maalot S&P)
State of Israel (3)
A1 / AA- / A+Stable / Stable / Stable
(Moody’s / S&P / Fitch)
Source: IEC Financial Statements for 2020FY and for 3M-2021 1) As of December 31, 20202) 60 substations are privately owned3) A State of Israel guarantee for the existing loans of IEC are compared to the company’s overall financial debt
Denotes USD figures USD/NIS exchange rate of 3.33 as of March 31, 2021.
Investor Relations
$1.5 $0.5
5

Israel - a Modern Economy
Source: The Israeli Central Bureau of Statistics, Bank of Israel.1) Credit rating refers to long-term foreign currency debt only. A State of Israel guarantee for the existing securities of IEC are negligible compared to the company’s overall Financial debt 2) The Israeli Ministry of Finance and Bank of Israel.
Denotes USD figures USD/NIS exchange rate of 3.22 as of December 31, 2020.
Israel Public Debt to GDP(2)
Israel Rating History(1)
Inflation Environment
1
2
3
2011 2013 2015 2017 2019 2021Moody's S&P Fitch
Nov 2016
Fitch upgrades
Israel to A+
Sep 2011
S&P upgrades
Israel to A+
A2 / A
A1 / A+
Aa3 / AA-
-0.2%-1.0%
-0.2%
0.4%
0.8% 0.6%
-0.7%-2.0%
-1.0%
0.0%
1.0%
2.0%
3.0%
4.0%
5.0%
2014 2015 2016 2017 2018 2019 2020
(YoY Inflation %)
1%-3%
Government
Inflation Target
0.7%
Average inflation in
the last decade
Investor Relations
Key Figures
6
$407 bn
$43,784
Aug 2018
S&P upgrades
Israel to AA-
Area 22,072 km2
Population (March 2021) 9.3 million
GDP (2020) NIS 1.3 trillion
GDP per Capita (2020) NIS 140,985
Avg. GDP Growth (2014-2020) 2.4%
Unemployment (April 2021) 5.4%
Foreign Currency LT Debt Ratings
(Moody’s / S&P / Fitch) (1)A1 / AA- / A+
65.863.7
62.160.5 61.0 60.0
73.1
50
55
60
65
70
75
80
2014 2015 2016 2017 2018 2019 2020
(% of GDP)

Essential
Service Provider
Owned by the
State of Israel
Robust Growth in
Electricity Demand
Fully Regulated
Across all Segments
Efficiency and
Reliability
Financial
Robustness
Natural Gas
Fuel
Independence
IEC is an essential service
provider of electricity in Israel
and the sole vertically
integrated provider in the
electricity chain
Appx. 99.85% owned
by the State of Israel
(A1/AA-/A+)
Strong electricity demand
growth in the Israeli market
Tariff is based on costs and
return on equity
Set by the Electricity Authority
Continuous improvement of
efficiency & reliability
IEC has over 98 years of experience in
developing and managing the electricity
sector in Israel
Rated investment grade by both
S&P (BBB) and Moody’s (Baa2)
IEC total liquidity(1) of NIS 6.5 bn
as of December 31, 2020
Natural gas from Tamar,
Leviathan and other significant
natural gas discoveries in
Israel have paved the way
towards potential fuel
independence
Key Investment Highlights
Investor Relations
1) Source: IEC Financial Statements for 2020FY.IEC defines “Liquidity” as cash and equivalents, short term investments and available credit facilities.
7

Key Strategic Targets
Investor Relations 8
Israel's
Electricity Supplier•Continuing to guarantee reliability of the
electricity supply and maintaining
adequate electricity reserves

IEC’s COVID-19 Implications
Investor Relations
There were no significant delays inthe investments in the transmissionand distribution segments, nor tothe investment in the combinedcycle at Orot Rabin site
Executive Branchof the State
Continuity of service& operations
In cooperation with the Stateauthorities, several steps havebeen taken to provide reliefs forthe electricity consumers such asthe possibility of delaying thepayment of electricity bills andsupport was provided to somevendors
Cash Management & Finance
IEC was prepared in advance, inaccordance with the requirements ofthe Israeli law, for business continuityduring the crisis period and entered thischallenging period with pre-definedwork processes, in order to protectemployees as well as ensuring energysupply and maintenance activities
Maintaining sufficient liquidityabove the BoD’s goals (“safetycushion”) including a Long-term fundraising in May 2020
The fuel supply to IECwas not affected by theCOVID-19 restrictions
Supply Chain Security
Investments
Source : IEC ‘s Financial Statements for 2020FY
9

Operational Overview
10

Source:1) IEC Financial Statements for 2016FY-2020FY and for 3M-2021, IEC Statistical Report for 2010FY.2) The Israeli Central Bureau of Statistics.
Denotes USD figures at USD/NIS exchange rate of 3.47, 3.75, 3.46, 3.22, 3.57 & 3.33 for the end of period of 2017FY, 2018FY, 2019FY ,2020FY ,3M-2020 & 3M-2021 respectively.
Historical Performance
IEC continues to provide most of Israel’s energy requirements
as the sole vertically integrated electric utility in Israel
Comparison of Key Metrics
23.4 23.624.7
23.8
6.45.1
0
10
20
2017 2018 2019 2020 3M-2020 3M-2021
NISbn
$6.7
$1.8$1.5
$7.4
IEC Revenues
Investor Relations
$5.9
11
$6.312/31/2010 12/31/2020
%
Change
Population (mn) (2) 7.7 9.3 20.8%
Number of
Customers (mn)2.5 2.9 16.0%
Electricity Sales
(GWh)51,977 51,991 0%
National Peak
Demand (MW)11,530 14,620 26.8%
IEC Installed
Capacity (MW)12,987 11,615 (10.6%)

Israel Generation Capacity and Demand
Israel Generation Capacity and Demand
Source: IEC’s Financial Statements (2016FY-2020FY) 1) Installed Generation Capacity of Independent Power Producers (“IPPs”)
13,617 13,335 12,752 11,615
3,199 3,334 4,148
5,761
946 1,303 2,023
2,335 17,762 17,972
18,923
19,711
12,746 12,921 13,568
14,620
5,000
8,000
11,000
14,000
17,000
20,000
2017 2018 2019 2020
(MW)
IEC's Installed Generating Capacity Gas Fired IPPs Renewable Energy IPPs National Peak Demand
Investor Relations 12
(1) (1)

Demand for Electricity
National Electricity Peak Demand & Total Electricity Produced in the Entire Sector
Trends
Source: IEC’s Annual Financial Statements (1990FY-2020FY), IEC’s Statistical data.
Investor Relations
The demand for electricity in
Israel is growing at a fast and
steady pace
Demand is driven by both
population growth and the
increase in electricity
consumption per household
IEC’s demand forecast,
which is used for long term
planning of the generation
segment, anticipates an
average annual increase of
3.0% in peak demand in the
years 2021 to 2050
13
Seasonality in Electricity Demand - Average Consumption of Households
0
200
400
600
800
1,000
Q1-2015
Q2-2015
Q3-2015
Q4-2015
Q1-2016
Q2-2016
Q3-2016
Q4-2016
Q1-2017
Q2-2017
Q3-2017
Q4-2017
Q1-2018
Q2-2018
Q3-2018
Q4-2018
Q1-2019
Q2-2019
Q3-2019
Q4-2019
Q1-2020
Q2-2020
Q3-2020
Q4-2020
(KWh)
Base Heating Cooling
54 54 53
58 6064
62 6165
67 68 7073 73
40
45
50
55
60
65
70
75
2,000
4,000
6,000
8,000
10,000
12,000
14,000
1990 1992 1994 1996 1998 2000 2002 2004 2006 2008 2010 2012 2014 2016 2018 2020
(TWh)(MW)
Total Electricity Produced in the Sector National Electricity Peak Demand
Multiplied by 3.8 in 30 years

The IEC Electricity Chain
Source: IEC Financial Statements for 2020FY
Notes
1) 60 substations are privately owned.
Investor Relations 14
Generation DistributionTransmission
2.9Million
Customers
39,121 kmLow Voltage
Lines
29,223 kmMedium
Voltage Lines
209Substations(1)
5,715 kmUltra-High & High
Voltage lines
11Switching Stations
52 Generation Units in 15
Power Stations

The IEC Generation Segment
IEC Generation Facilities
Fuel Mix by Electricity Generated(4)
Source: IEC’s Financial Statements for 2020FY and for 3M-20211) As of December 31, 20202) Units 1-4 at the Orot Rabin Power Station will be transferred to preservation by June 1, 2022. Please see the decision of the Minister of Energy relative to the preservation of units 1-4 of February 8, 2021 published on the EA website3) In accordance with the Minister of Energy's policy principles, which was published on the Ministry of Energy’s website on November 24,2019, it was decided that units 5-6 at Orot Rabin Power Station and units 1-4 at Rutenberg Power
Station will gradually converse using natural gas in order to stop routine coal use until 2025 and no later than 2026.4) As of December 31, 2020, 22.1% of IEC revenues are associated with IEC's coal fired units located in 2 sites.
Electricity Generation Sites(1)
January 1 - December 31, 2020
Coal45.2%
Diesel oil & Fuel oil
0.1%
Natural gas & LNG 54.7%
January 1 - March 31, 2021
Investor Relations
No. of
units
Installed
Capacity (MW)
Steam (dual purpose) (coal and fuel oil) (1;2;3) 10 4,840
Steam (dual-purpose) (natural gas and fuel / diesel oil) 6 1,340
Gas turbine (internal combustion) (industrial gas) 9 914
Gas turbine (internal combustion) (jet engine) 16 504
Combined cycle (internal combustion and steam) 11 4,017
Total 52 11,615
15
15Power stations
sites
11,615Megawatts of
generation
Orot Rabin(2)
7 units / 2,605 MW
Rutenberg
6 units / 2,290 MW
Eshkol
7 units / 1,693 MW
Haifa
4 units / 828 MW
Gezer
6 units / 1,336 MW
Hagit
4 units / 1,394 MW
- Mainly powered by coal
- Mainly powered by gas
Gas turbine (internal
combustion) /
Combined-cycle
(internal combustion
and steam)
Steam (dual purpose)
Coal42.7%
Diesel oil & Fuel oil
0.4%
Natural gas & LNG 56.9%

The IEC Transmission and Distribution Segments(1)
Diversified Customer Base
Total Electricity Consumption by Customer Type
Transformation
System
11Switching stations
Power Lines
149Substations
Transmission
60Private substations
778 km400 kV lines
4,896 km161 kV line (includes
underground lines)
42 km115 kV lines
68,344 kmMedium and low
voltage lines
52,050Distribution
Transformers
2.9 mnCustomers
Distribution
Source: IEC’s Financial Statements for 2020FY
Notes
1) As of December 31, 2020
Residential41%
Industrial16%
Public, commercial, East-Jerusalem &
Palestinaian Authority37%
Water pumping
4%
Agriculture2%
(kWh)
Investor Relations 16

IEC’s Human Capital
As part of the reform in the electricity sector, an efficiency program
is resuming for the years 2021-2025
Streamlining of IEC’s Workforce
Source: IEC’s Financial Statements for 2014FY – 2020FY and for 3M-2021
12,754
12,371
11,908 11,902
11,476 11,391
11,483
11,063
11,000
11,500
12,000
12,500
13,000
2014 2015 2016 2017 2018 2019 2020 3M-2021
IEC’s employees’
Investor Relations 17

The Sector Reform
Source : IEC ‘s Financial Statements for 2020FY and for 3M-2021
Notes:1. In accordance with the IEC’s undertakings adopted by the IEC's BOD on May 10, 2018, to the extent that the Government resolutions and/or the legislative amendments and/or the administrative decisions and/or the arrangements of the
Electricity Authority and/or the aforesaid licenses given by the State of Israel, that will correspond to the (insofar as these are needed according to the State of Israel position), or that the collective agreement IEC and the employeesrepresentatives will not be in force, then all IEC’s undertakings, according to the IEC’s undertaking document, will not be in force and the State of Israel will not be able to file claims and/or complain against IEC with respect to thoseundertakings. On June 3, 2018, the required Government Decision was received, on July 19, 2018 the Knesset approved the Amendment to the Law, and on May 17, 2018, the Principles of the policy of the Minister and the ElectricityAuthority’s Regulation as aforesaid were published. In addition, on November 4, 2018, the Collective Agreement came into effect after all the contingent conditions detailed therein were fulfilled. For the purpose of implementing the fullstructural change outline, it will be required the approval of the regulatory agencies, decisions and regulations of the Electricity Authority and granting licenses which, as of this date, have not yet been received and there is no certaintyregarding the date of determining the agreements or the granting of such licenses and their final terms. As of this date, IEC is unable to reliable estimate the exact implications of the additional regulations and approvals that have not yetbeen formulated or received on its financial position and results.
2. Except of the above, IEC or its generation subsidiary will not construct, replace, operate, plan, strengthen or engage in development of power stations in Israel, whether by itself or as a contractor for a third party, nor will it engage inelectricity generation, including in the framework of micro-generation or renewable energies in Israel, during the years of the reform and afterwards. IEC has undertaken to the State of Israel not to act to obtain new generation licenses or toconstruct new electricity generation stations and replace existing stations, and not to act to obtain permits for the operation of power stations for other parties in Israel.
Investor Relations
Sale of generation sites
and increased
competition in the
generation segment
Transfer of the system
Management and
additional units to a
separate Government
company
Opening the supply
segment market to
competition from other
entities
Essential service
provider in the
transmission and
distribution segments
Organizational change,
efficiency plan and
administrative flexibility
Construction &
operation of two
combined cycle gas
turbines at the ‘Orot
Rabin’ site (2)
Assets arrangement Compliance with
financial targets
Strengthening the
financial stability of IEC
Value added services,
installation of smart
meters, construction
and operation of
storage facilities
Main points of the reform (1)
18

The Sector Reform Timeline(1)
Source : IEC ‘s Financial Statements for 2020FY and for 3M-2021
Notes:1. In accordance with the IEC’s undertakings adopted by the IEC's BOD on May 10, 2018, to the extent that the Government resolutions and/or the legislative amendments and/or the administrative decisions and/or the arrangements of the Electricity Authority and/or the aforesaid licenses given by the State of
Israel, that will correspond to the (insofar as these are needed according to the State of Israel position), or that the collective agreement IEC and the employees representatives will not be in force, then all IEC’s undertakings, according to the IEC’s undertaking document, will not be in force and the State ofIsrael will not be able to file claims and/or complain against IEC with respect to those undertakings. On June 3, 2018, the required Government Decision was received, on July 19, 2018 the Knesset approved the Amendment to the Law, and on May 17, 2018, the Principles of the policy of the Minister andthe Electricity Authority’s Regulation as aforesaid were published. In addition, on November 4, 2018, the Collective Agreement came into effect after all the contingent conditions detailed therein were fulfilled. For the purpose of implementing the full structural change outline, it will be required the approval ofthe regulatory agencies, decisions and regulations of the Electricity Authority and granting licenses which, as of this date, have not yet been received and there is no certainty regarding the date of determining the agreements or the granting of such licenses and their final terms. As of this date, IEC is unableto reliable estimate the exact implications of the additional regulations and approvals that have not yet been formulated or received on its financial position and results.
2. Part of the area at the Rutenberg power station (that was designated in the past for Project which did not carry out) will be transferred pursuant to the assets arrangement agreement as defined in Note 1f in the FY2020 Financial Statements’. As for now, the stage of evacuation of the infrastructure, fencingand preparing part of the area intended for delivery to the Israel Land Authority (ILA), in accordance with the reform outline, was completed. The remaining area evacuation and its delivery is awaiting the completion of examinations by the ILA regarding the economic potential of the after-sale area and to itsdecision. Transfer of the area in practice to the State through the ILA has not been carried out, notice that the Ministry of Energy, the EA and the ILA are expected to make decisions regarding how the area will be transferred, notice for the future use intended for the area, and some other ILA's decisions arerequired on the evacuation of infrastructure facilities from the site and the financing format of evacuation costs eligible for the company. Then, a suitable agreement between the Company and the State will be signed, for the purpose of transferring the area, in accordance with the decisions which beenmade, as aforesaid.
3. The implementation date of the transfer and separation the system management activity to the responsibility of the System Management Company (SMC), which originally set for December 3, 2019, was postponed by the relevant bodies and regulators until June 3, 2020 and then postponed again toDecember 3, 2020. On June 17, 2020, the Electricity Authority decided to grant a license to the SMC, which was approved on June 25, 2020 by the Minister of Energy, and in accordance with its terms, the system management activity will enter into force as soon as possible, and no later than December 3,2020, subject to the approval of the Authority and the Minister of Energy that the SMC is prepared to commence operation of the activity. Due to additional delays, a framework was formulated of transferring the system management activities from the company to the SMC in a graduated manner, so that inthe first stage the activities of the Planning Development Technology Division (PDT) and some of the activities of Statistics and Market Research Department will be transferred from the company to SMC, subject to the amendment of the special collective agreement (reform and structural andorganizational change), and the receipt of approvals from the Electricity Authority and the Minister of Energy regarding the company's readiness for partial activity. On December 1, 2020 the transfer of the activities of the Planning Development Technology Division and the Statistics and Market ResearchDepartment from the Company to SMC has been completed, after given the approval of the Electricity Authority and the Minister of Energy indicating the readiness of SMC for the start of the partial operation, the amendment of SMC's license was approved, accordingly, by the Minister of Energy and acorrecting collective agreement was signed. In addition, a decision to postpone the date for the beginning of operation of SMC for an additional six months (i.e. until June 3, 2021). For further details, please see Note 1e to the 2020FY Financial Statements. To the company’s knowledge, SMC appealed tothe relevant authorities in order to postpone the date of transferring the full activity of the system management unit to and not later than October 31, 2021 since its preparations for the absorption of activity has not yet been completed.
4. On January 10, 2021, the Company appealed to the Ministry of Energy and the EA in order to extent of the production licenses date on the site of Reading and also applied for the postponement of the site sale. As of this date, the issue of Reading's sale was brought to the attention of the relevant parties inIsrael and no decisions have yet been made regarding the future of the site, which include, among other things, the site's promotional format, the creation regulation that supports this process and the various alternatives to ensure a regular power supply to the Tel-Aviv metropolitan area and at the sametime, it is necessary to promote the relevant legislation in the context of the issue of asbestos removal and to adjust the operating dates of the power station. In light of the above, there is no certainty regarding the possibility of the sale of the Reading site on time.
5. On February 11, 2021, the Electricity Authority published a hearing of the production units regulation in Hagit site after their future sale by the Company. For further details, see Note 3 in the 2020FY Financial Statements.
Investor Relations 19

Israeli Electricity Sector
20

The Israeli Electricity Sector
Investor Relations
Nearly 100% of the Switching
Stations and the Ultra-High & High
Voltage lines are owned & operated
by IEC
As of 12/31/2020,
59% of total generating
capacity
Expected to reach
53.6% by the end of
2021
Generation, Transmission and Distribution
IEC’s Main Regulators IEC’s Fuel Suppliers
The Electricity Authority (EA)
Government Companies Authority (GCA)
Antitrust Authority
Israel Securities Authority
Ministry of Energy
Ministry of Finance
Ministry of Interior
Ministry of Environmental Protection (MoEP)
The Concentration Committee
TASE
Natural Gas - Currently from the Tamar & Leviathan Reservoirs.
More reservoirs in the Israeli waters have been discovered
Liquid Natural Gas - Imported from international suppliers
Coal - Imported from international suppliers
IPPs
Source : IEC’s Financial Statements for 2020FY
IEC reached 2.9 million customers
(as of December 31, 2020)
TransmissionGeneration Distribution
21
As of 12/31/2020,
41% of total generating
capacity
Expected to reach
46.4% by the end of
2021
149 of 209 Substations are owned &
operated by IEC
(as of December 31, 2020)

The Electricity Tariff
In accordance with the Electricity Sector Law, the electricity tariff is set by the Electricity Authority (EA) and reformulated from time to time. The outline of the
formula is as follows:
Actual costs are examined every 2 weeks by
the EA (at the time of CPI and fuel prices
changes)
Discrepancies between forecasted costs and
actual cost are reconciled on the earlier of:
A difference of 3.5%, provided that 3
months
have passed since the last update
A difference of 5.5%
The Annual Update
Once a year, The current year's
costs are updated based on
forecasts as well as on previous
years' reckoning - the gap
between the previous year's
forecast components and the
actual costs of the previous year
On December 29, 2020, the EA issued a resolution regarding the
annual 2021 tariff update. According to the EA’s decision, the
average household electricity tariff and the market electricity tariff
will fall by approximately 2.3% and 4.9%, respectively, as of 1/1/21,
mainly due to:
The sale of Ramat Hovav Power Station
Decline in the NG and coal prices
The above was partially offset by:
Increased renewable energy consumption
Entry into force of the excise tax on coal in 2021
Investor Relations
Recognized costs per segment (e.g. fuel costs, operational
costs, depreciation costs and financial costs). Some of the
recognized costs are also attributed to funding the reform costs+ Fair rate of return on equity
per segment
Electricity Tariff
Ongoing Update Annual Update Tariff update as of December 29, 2020
Tariff Structure
Source: IEC’s Financial Statements for 2020FY, Electricity Authority's decision No. 59609 on December 27, 2020 - Annual Update 2021 electricity tariff to IEC’s consumers
22

The Electricity Tariff - Cont’d
Source:
1. World Bank Commodity Price Data (Pink Sheet), May 2021; Calculated as average price of Australia and South Africa coal. Russia is not included in World Bank information, even though it is a significant source of coal for
IEC. The general and Residential Tariffs do not include VAT.
2. The Electricity Authority - Report on State of Electricity Sector Year of 2019.
Tariff vs. Coal Price Development(1)
Investor Relations
0.40
0.45
0.50
0.55
0.60
40
60
80
100
120
140
($/t)
Coal Average General Tariff Residential Tariff
NIS
23
Structure of the Residential Tariff as Divided into Segments(2)
Production and fuel
61%
Transmission 5%
Distribution 17%
Supply 6%
System Management tariff
11%

Financial Overview
24

1.8 1.3 2.9 2.2
0.3 0.6
0.7 0.9
1.1 1.3 1.3 1.5
1.8 1.5
3.88 3.73
5.945.10
0.721.37
0
1
2
3
4
5
6
7
2017 2018 2019 2020 3M-2020 3M-2021
NISbn
Generation Transmission System Manager Distribution Supply
$1.7
$0.2$0.4
Financial Highlights
Revenues EBITDA(1)
Historical Investments by segments (CAPEX) Net Financial Debt/EBITDA(3)
8.1 8.0 7.9 7.5
1.8 1.7
0
3
6
9
12
2017 2018 2019 2020 3M-2020 3M-2021
NISbn
$2.3$2.3
$0.5
23.4 23.6 24.7 23.8
6.4 5.1
0
10
20
30
2017 2018 2019 2020 3M-2020 3M-2021
NISbn $6.7 $6.3 $7.4$7.1
$1.8 $1.5
Source: IEC’s Financial Statements for 2017FY-2020FY and for 3M-20211. IEC defines “EBITDA” as profit (loss) before income taxes, financial expenses, depreciation and amortization.2. CAPEX also include non – cash adjustments in 2019 in accordance with IFRS 16 (Leases) in the sum of appx, Nis 1.4 billon.3. IEC defines “net financial debt” as credit from banks and other credit providers, total long-term debt (including debentures, long-term liabilities to banks, including hedge transactions, lease liabilities, debentures to the State of
Israel and liabilities to the State of Israel), less cash and cash equivalents, short-term investments and other receivables (including receivables for forward contracts and swap transactions, MTM and long-term deposits andregulatory deferral account assets with respect to linkage differentials).
4. In annualized terms, calculation based on LTM EBITDA
Denotes USD figures at USD/NIS exchange rate of 3.47, 3.75, 3.46, 3.22, 3.57 & 3.33 for the end of period of 2017FY, 2018FY, 2019FY, 2020FY, 3M-2020 & 3M-2021 , respectively
5.2x 4.8x 4.4x 4.0x 4.3x 4.1x
5.2x 4.8x4.4x 4.0x 4.3x 4.1x
0
2
4
6
8
2017 2018 2019 2020 3M-2020 3M-2021
State guaranteed Net Financial Debt / EBITDA without State guarantees
(4) (4)
Investor Relations
$2.3 $2.1
$1.1 $1.0
$1.6
25
(2)
$0.5

Historical Cash Flow
Generating sufficient cash flow from operations enables IEC to decrease debt
Source: IEC’s Financial Statements for 2016FY-2020FY and for 3M-2021
1. Investment activities excluding repayment (or deposits) of bank deposits. Total cash from investment activities figures as reported for 2017FY, 2018FY, 2019FY, 2020FY, 3M-2020 & 3M-2021 are NIS (2.2) bn, NIS
(3.1) bn, NIS (1.3) bn, NIS 0.7 bn, NIS, NIS (1.2) bn & NIS (1.4) bn, respectively.
2. IEC defines “liquidity” as cash and cash equivalents, short term investments and available credit facilities.
Denotes USD figures at USD/NIS exchange rate of 3.47, 3.75, 3.46, 3.22, 3.57 & 3.33 for the end of period of 2017FY, 2018FY, 2019FY, 2020FY, 3M-2020 & 3M-2021, respectively
5.8 5.86.5 6.5
2.41.4
(2.7) (3.1)
(1.3)
0.6
(1.3) (1.4)
(3.7) (3.3)
(4.8)
(6.3)
(2.3)(1.7)
6.35.6 5.6
6.5
(12)
(8)
(4)
0
4
8
12
2017 2018 2019 2020 3M-2020 3M-2021
NIS bn
Operating activities Investment activities, net Financing activities Total Liquidity
$1.7
($1.1)
$1.5
($0.8)
($1.4)
($0.4)
($0.9)
$0.2
$1.9 $2.0
($2.0)
$0.7
($0.4)
($0.6)
$0.4
($0.4)($0.5)
Investor Relations
(1)
($0.8)
(2)
26

51.8
50.0
46.9
44.6
43.242.1
38.3
36.1
30.030.6
28
33
38
43
48
2012 2013 2014 2015 2016 2017 2018 2019 2020 3M-2021
NIS, bn
$11.3
$12.1
$11.6
$12.0
$14.4
$10.2
(2)
$10.4
$9.3$9.2
Net Financial Debt (1) Over Time
Source: IEC’s Financial Statements for 2012FY-2020FY and for 3M-2021
1. IEC defines “net financial debt” as credit from banks and other credit providers, total long-term debt (including debentures, long-term liabilities to banks, including hedge transactions, lease liabilities, debentures to the
State of Israel and liabilities to the State of Israel), less cash and cash equivalents, short-term investments and other receivables (including receivables for forward contracts and swap transactions, MTM and long-term
deposits and regulatory deferral account assets with respect to linkage differentials).
2. As from 01/01/2019, “net financial debt” also includes lease liabilities.
D Denotes USD figures at USD/NIS exchange rate of 3.85, 3.47, 3.75, 3.46, 3.22 & 3.33 for the end of period of 2016FY, 2017FY, 2018FY, 2019FY, 2020FY & 3M-2021, respectively
Investor Relations
Prepared According to
Government Companies
RegulationsIFRS
27
$13.9

Fixed96.9%
Floating3.1%
Consolidated Debt Breakdownas of March 31, 2021
Source:1) IEC immediate report on the Corporate Liabilities Status, IEC Financial data.2) IEC Financial data and Bloomberg..
Annual Debt Maturities (Principal in NIS billions)(1)
0.17 0.17 0.17 0.17 0.24
1.91 2.03
3.44
5.84 15.41
2.1 2.2
3.6
6.0
0
2
4
6
First year Second year Third year Forth year Fifth year and thereafter
(NIS bn)
Loans from local and foreign banks Local bonds, private bonds and non-bank loans
Debt by Currency(1)Type of Instrument(1) Debt by Linkage(1)
NIS51.9%
Euro1.5%
USD40.9%
Other5.6%
NIS CPI linked43.6%
NIS non-linked8.4%
Foreign currency48.1%
15.6
Interest Rate Exposure(1)
Investor Relations
Local public bonds34.3%
Private bonds and non-bank
loans 62.6%
Foreign bank loans 3.1%
28
Coupon Outstanding
Amount ($mn) Maturity
6.875%650Jun-23
5.000%1,250Nov-24
7.875%125Dec-26
7.750%300Dec-27
4.250%1,000Aug-28
8.940%40Mar-30
8.100%125Dec-96
Profile of International IEC $ Bonds(2)

Income Statement(NIS millions)
Source: IEC’s Financial Statements for 3M-2021
Investor Relations 29
(NIS millions)
12/31/2020 03/31/2020 03/31/2021
Revenues 23,778 6,353 5,070
Cost of operating the electricity system
Fuels 6,220 1,670 1,118
Purchases of electricity 5,269 1,141 1,407
Operation of the generation system 4,143 1,019 1,021
Operation of the transmission and distribution system and others 2,849 733 694
Total costs 18,481 4,563 4,240
Profit from operating the electricity system 5,297 1,790 830
Other expenses (revenues), net (2,816) 39 5
Sales and marketing expenses 886 226 224
Administrative and general expenses 971 330 201
Expenses (Income) from liabilities to pensioners (24) 2 (18)
Reform agreement and other agreements results 708 28 88
Profit from current operations 5,572 1,165 330
Financial expenses (income), net 511 (533) 464
Income (loss) before income taxes 5,061 1,698 (134)
Expenses (income) Taxes on income 1,189 393 (30)
Income (loss) after income taxes 3,872 1,305 (104)
Company's share of the loss of asociated companies (6) - -
Income (loss) before regulatory deferral accounts 3,866 1,305 (104)
Movement in regulatory deferral accounts balances, net of tax (2,163) (117) 189
Profit for the period 1,703 1,188 85
Profit with respect to cash flow hedging, net of tax 147 286 25
Remeasurement of a defined benefit plan, net of tax 486 1,582 15
Movement in balances of regulatory deferral accounts balances, net of tax (58) (173) 14
Other Comprehensive profit for the period, net of tax 575 1,695 54
Comprehensive income for the period 2,278 2,883 139
For the period:

Balance Sheet(NIS millions)
Source: IEC’s Financial Statements for 3M-2021
Investor Relations 30
(NIS millions)
Assets 12/31/2020 03/31/2020 03/31/2021 Liabilities and Equity 12/31/2020 03/31/2020 03/31/2021
Current assets Current liabilities
Cash and cash equivalents 4,107 2,097 2,286 Credit from banks and other credit providers 3,831 5,178 3,121
Short term investments 358 373 362 Trade payables 2,453 1,760 2,461
Trade receivables for sales of electricity 4,600 4,418 4,487 Other current liabilities 1,391 1,189 1,502
Other current assets 651 914 920 Customer advances, net of work in progress 568 523 620
Inventory - fuel 584 521 753 Provisions 665 673 708
Inventory - stores 142 150 142 Liabillities of disposal groups classified as held for sale 142 298 147
Assets of disposal groups classified as held
for sale
111 1,858 118 Total current liabilities 9,050 9,621 8,559
Total current assets 10,553 10,331 9,068
Non-current liabilities
Debentures 25,817 27,544 25,488
Non-current assets Liabilities to banks 3,278 2,639 3,177
Inventory - fuel 1,742 1,733 1,744 Liabilities with respect to other benefits after employment
termination
6,676 5,688 6,669
Long-term receivables 1,852 2,056 1,896 Deferred taxes, net 6,524 6,897 6,577
Investment in associates 13 19 13 Liability to the State of Israel 1,762 1,776 1,765
Assets with respect to benefits after
employment termination
6,552 6,760 6,775Lease liabilities
709 894 688
Fixed assets, net 58,028 57,164 58,229 Other liabilities 557 547 577
Intangible assets, net 1,217 1,206 1,220 Total non current liabilities 45,323 45,985 44,941
Total non-current assets 69,404 68,938 69,877 Equity 26,728 27,533 26,867
Debit balance of regulatory deferral accounts
6,935 7,766 7,004
Credit balances of regulatory deferral accounts and
deferred taxes with respect to regulatory deferral
accounts 5,791 3,896 5,582
Total assets and debit balance of
regulatory deferral accounts86,892 87,035 85,949
Total liabilities, equity and credit balance of
regulatory deferral accounts86,892 87,035 85,949
Sustainability Overview
31

Environment, sustainability and corporate governance (ESG) (1)
IEC earned the highest ranking in the Maala(2) 2020 Index: Platinum+ (for the sixth consecutive year)
Investor Relations
1) Source: IEC's Corporate Sustainability Report for 2018, Maala's rating for IEC for 2020.
2) Maala is the non-profit CSR standards-setting organization in Israel who serves the needs of some 110 members, comprised of Israel’s large and mid-size companies, committed to
excellence in corporate citizenship. The criteria in the rankings are determined by an independent public committee composed of content experts, academics, heads of social
environmental organizations and representatives of the business sector.
Ethical Aspects
of Business
Conduct
Responsible
Supply Chain
Implementation of Corporate
Governance Code
Effectiveness of the work of
the Board of Directors policy
Prevention of conflicts of
interests, corruption and
embezzlement
A published code of ethics
adapted to IEC’s fields of
operations
Reference to ethical
aspects with stakeholders
Internal communications
on ethics issues
Organizational culture that
respects employee rights
Promotion of health and
ensuring worker safety
Retention and development
of human resources
Work-life balance and
fostering an open culture
Engagements mainly through public tenders or
other competitive procedures. Setting fair rules
and providing equal opportunity to suppliers
Improving dialogue and deepening cooperation
with Israeli industrial enterprises
Securing subcontracted workers' payment terms
and conditions
Diversity of suppliers
Diversified and
humanitarian employment
Diversified employees in
managerial positions
Women in managerial roles
Accessibility for people with
disabilities
Social activity policy
Promotion of regular and
one-off volunteering by
workers and pensioners
in the community
Environmental violations
screening
Environmental policy &
management system
Measurement and setting
objectives: air, energy, waste,
water and sewage
Employee health,
Wellbeing and
working relations
EnvironmentEmployee
Volunteering
Diversity &
Inclusion
Corporate
Governance
32
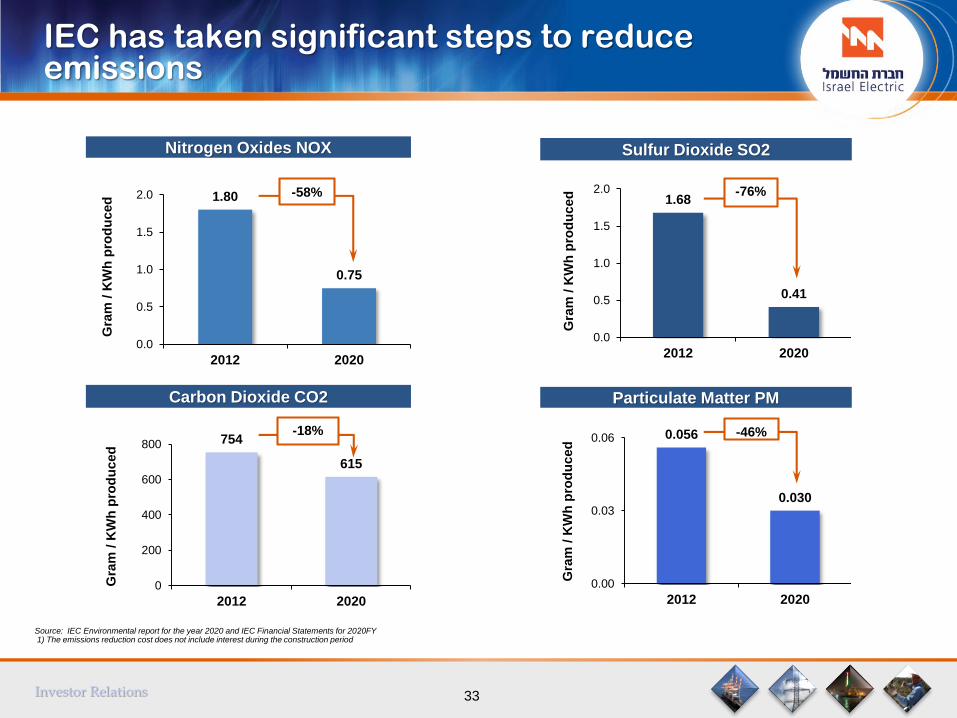
IEC has taken significant steps to reduce emissions
Nitrogen Oxides NOX Sulfur Dioxide SO2
Carbon Dioxide CO2 Particulate Matter PM
1.80
0.75
0.0
0.5
1.0
1.5
2.0
2012 2020
Gra
m /
KW
h p
rod
uced
Source: IEC Environmental report for the year 2020 and IEC Financial Statements for 2020FY1) The emissions reduction cost does not include interest during the construction period
Investor Relations 33
-58%1.68
0.41
0.0
0.5
1.0
1.5
2.0
2012 2020
Gra
m /
KW
h p
rod
uced -76%
754
615
0
200
400
600
800
2012 2020
Gra
m /
KW
h p
rod
uced
0.056
0.030
0.00
0.03
0.06
2012 2020
Gra
m /
KW
h p
rod
uced
-18% -46%

14.0
11.8
10.9 10.7
9.1
8.27.8
8.3
7.2
61%
52%49%
44%
37%
32%30% 30%
24%
0%
10%
20%
30%
40%
50%
60%
70%
0
5
10
15
2012 2013 2014 2015 2016 2017 2018 2019 2020
% of coal out of Total Electricity Market Fuel Mix
Million Ton
Coal Usage Over Time
Source: IEC’s Financial Statements for 2012FY-2020FY, The Electricity Authority - Report on State of Electricity Sector Year of 2019
1) The emissions reduction cost does not include interest during the construction period
* Calculated according to the Electricity Authority Forecast
Investor Relations 34
Implementing Government policies
The State of Israel signed the Paris Agreement in
2016 and has significantly limited the usage of coal
for electricity generation
An emissions reduction project in the larger coal
units was executed at a significant cost of NIS 7.1
billion (1)
Government target of Israel is to be “coal free” by
2030. The Israeli Electricity Market will stop
routine coal use until 2025 and no later than 2026
following the Israeli Minister of Energy's policy
principles on 11/24/2019
IEC is financially protected from change in fuel mix
by the electricity tariff
The Future of Coal
The current coal capacity is 4,840 MW of which:
• 1,440 MW will be mothballed in 2022/23
following the Israeli Minister of Energy decision on
2/8/2021
• 3,400 MW are expected to be converted to NG by
2025 following the Israeli Minister of Energy’s
policy principles on 11/24/2019
*

The Israeli Electricity Sector Fuel Mix
Source: The Electricity Authority - Report on State of Electricity Sector Year of 2019.
* The Electricity Authority Forecast
34.2 35.1 38.732.1 30.1 29.2
24.2 22.0 20.6 21.9 17.5
2.8
22.8 21.0 10.8 27.1 30.4 34.4 41.1 43.2 46.3 46.150.1 70.8
0.9 2.6 9.3
1.5 0.3
-0.2 0.9
1.3 1.8 2.0
3.3 5.6
11.3
58.4 59.8 63.4 61.5 61.4
65.5 65.7 68.3 69.6
72.5 73.2
84.9
0
20
40
60
80
100
2010 2011 2012 2013 2014 2015 2016 2017 2018 2019 2020* 2025*
(TWH)
Coal Natrual Gas Diesel Fuel Other Renewable Energy
Electricity Market Fuel Mix (IEC & IPP)
35
The Israeli Electricity Sector is expected to be “coal free” by 2030 ( target could move forward to 2025)
Investor Relations

Thank youFor questions or additional information, please contact us:
36
Israel Electric Corp. Investor Relations: [email protected]
Investor Relations

Appendices
37

The Reform in the Generation Segment(Selected generation sites)
Investor Relations
Steam - dual purpose: coal and fuel oil
Steam - dual purpose: natural gas and fuel / diesel oil
Gas turbine (internal combustion)
Combined cycle (internal combustion and steam)
A power station planned to
be sold during the reform
A power station which was
sold during the reform
Hagit: will be sold units with a
capacity of 660 megawatts
Source: IEC ‘s Financial Statements for 2020FY and for 3M-2021Note:1. In accordance with the IEC’s undertakings adopted by the IEC's BOD on May 10, 2018, to the extent that the Government resolutions and/or the legislative amendments and/or the administrative decisions and/or the arrangements of
the Electricity Authority and/or the aforesaid licenses given by the State of Israel, that will correspond to the (insofar as these are needed according to the State of Israel position), or that the collective agreement IEC and the employeesrepresentatives will not be in force, then all IEC’s undertakings, according to the IEC’s undertaking document, will not be in force and the State of Israel will not be able to file claims and/or complain against IEC with respect to thoseundertakings. On June 3, 2018, the required Government Decision was received, on July 19, 2018 the Knesset approved the Amendment to the Law, and on May 17, 2018, the Principles of the policy of the Minister and the ElectricityAuthority’s Regulation as aforesaid were published. In addition, on November 4, 2018, the Collective Agreement came into effect after all the contingent conditions detailed therein were fulfilled. For the purpose of implementing the fullstructural change outline, it will be required the approval of the regulatory agencies, decisions and regulations of the Electricity Authority and granting licenses which, as of this date, have not yet been received and there is no certaintyregarding the date of determining the agreements or the granting of such licenses and their final terms. As of this date, IEC is unable to reliable estimate the exact implications of the additional regulations and approvals that have notyet been formulated or received on its financial position and results.
38

The Israeli Electricity Sector Structure
In light of reform in the electricity market, an independent government company established to manage the
system. The share of IEC in the generation segment will be reduced and the supply segment shall be open
to competition. IEC will focus its activity in the T & D segments. The transmission activity and most of the
distribution activity shall remain in IEC as Essential Service ProviderSource: The Electricity Authority - Report on State of Electricity Sector Year of 2019.
* The Electricity Authority Forecast
0% 20% 40% 60% 80% 100%
Generation Capacity
Transmission
Distribution
Supply
System Administrator
2019
IEC IPP Historical Distributers
0% 20% 40% 60% 80% 100%
Generation Capacity
Transmission
Distribution
Supply
System Administrator
*2025
IEC
IPP
Historical Distributers
A new government company
39Investor Relations
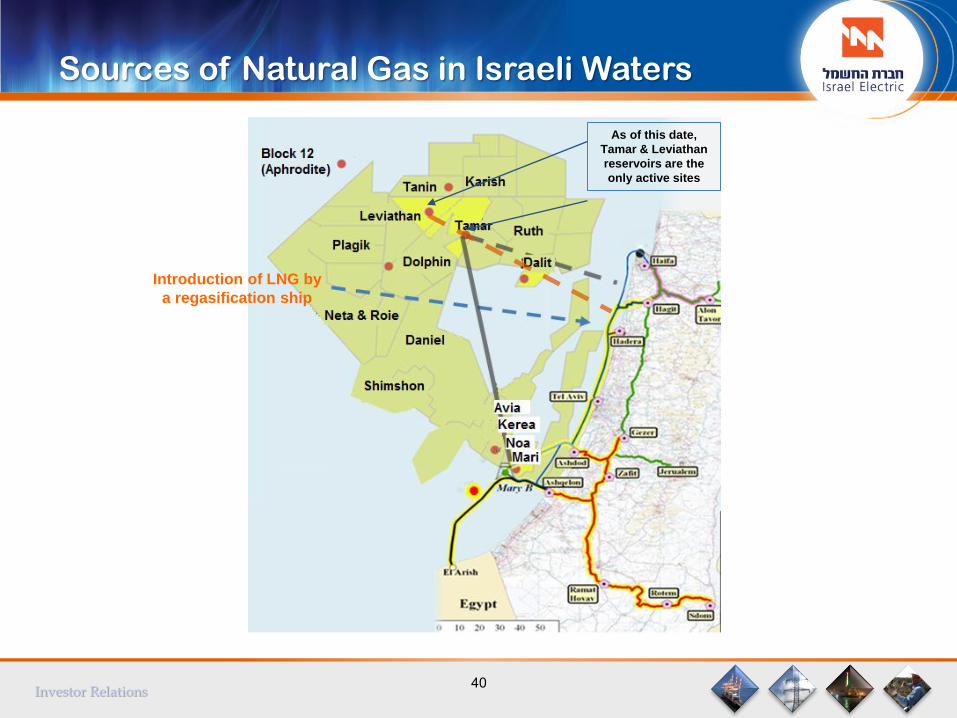
Sources of Natural Gas in Israeli Waters
Introduction of LNG by
a regasification ship
As of this date,
Tamar & Leviathan
reservoirs are the
only active sites
40Investor Relations
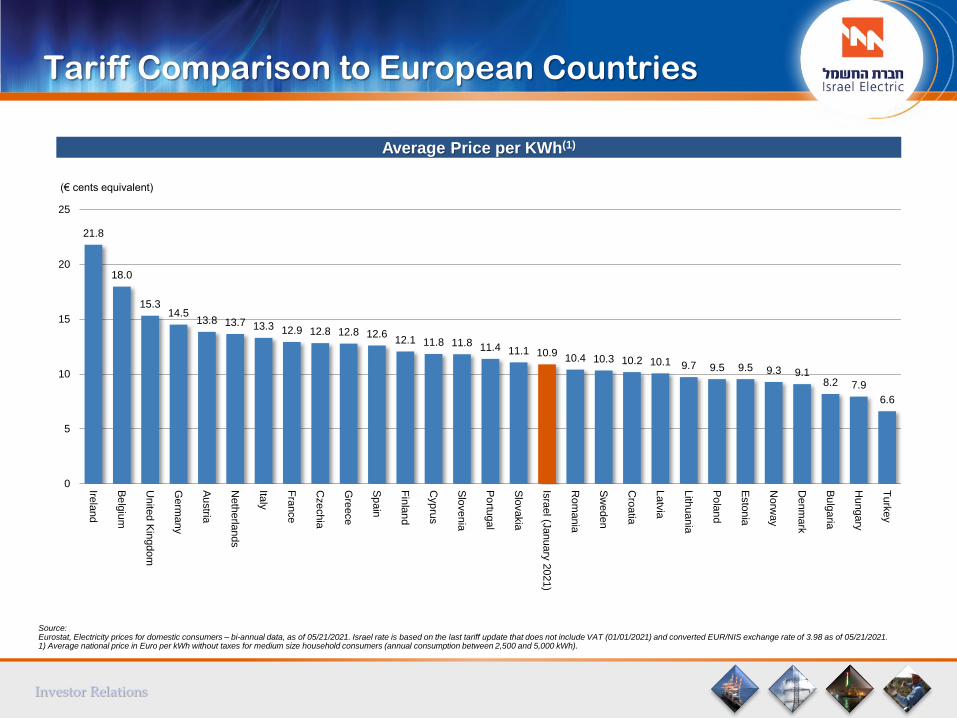
Tariff Comparison to European Countries
Source:Eurostat, Electricity prices for domestic consumers – bi-annual data, as of 05/21/2021. Israel rate is based on the last tariff update that does not include VAT (01/01/2021) and converted EUR/NIS exchange rate of 3.98 as of 05/21/2021.1) Average national price in Euro per kWh without taxes for medium size household consumers (annual consumption between 2,500 and 5,000 kWh).
Average Price per KWh(1)
Investor Relations
21.8
18.0
15.314.5
13.8 13.7 13.3 12.9 12.8 12.8 12.612.1 11.8 11.8 11.4 11.1 10.9
10.4 10.3 10.2 10.1 9.7 9.5 9.5 9.3 9.18.2 7.9
6.6
0
5
10
15
20
25
Irela
nd
Be
lgiu
m
Unite
d K
ingdom
Germ
any
Au
stria
Neth
erla
nds
Italy
Fra
nce
Cze
chia
Gre
ece
Sp
ain
Fin
lan
d
Cyp
rus
Slo
venia
Po
rtuga
l
Slo
vakia
Isra
el (J
anuary
2021)
Rom
ania
Sw
eden
Cro
atia
Latv
ia
Lith
uania
Po
lan
d
Esto
nia
Norw
ay
Denm
ark
Bu
lga
ria
Hungary
Tu
rkey
(€ cents equivalent)