Investor Presentation Highlights · 4 Accord Capital 2,870 6,022 109.8% 4.7% Others ... (Phil),...
27
1
Transcript of Investor Presentation Highlights · 4 Accord Capital 2,870 6,022 109.8% 4.7% Others ... (Phil),...

1
Investor Presentation Highlights
2
FINANCIAL & OPERATING
HIGHLIGHTS
GROWTH
PLANS COMPANY
OVERVIEW

Company Overview
3
Established and licensed by
the SEC in 1999
The leading and fastest-
growing online stockbroker in
the Philippines
Focused on tapping the
underserved retail investor
base in the stock market
Founder (Edward K. Lee)
retains a 20.2% stake and
actively manages the
Company
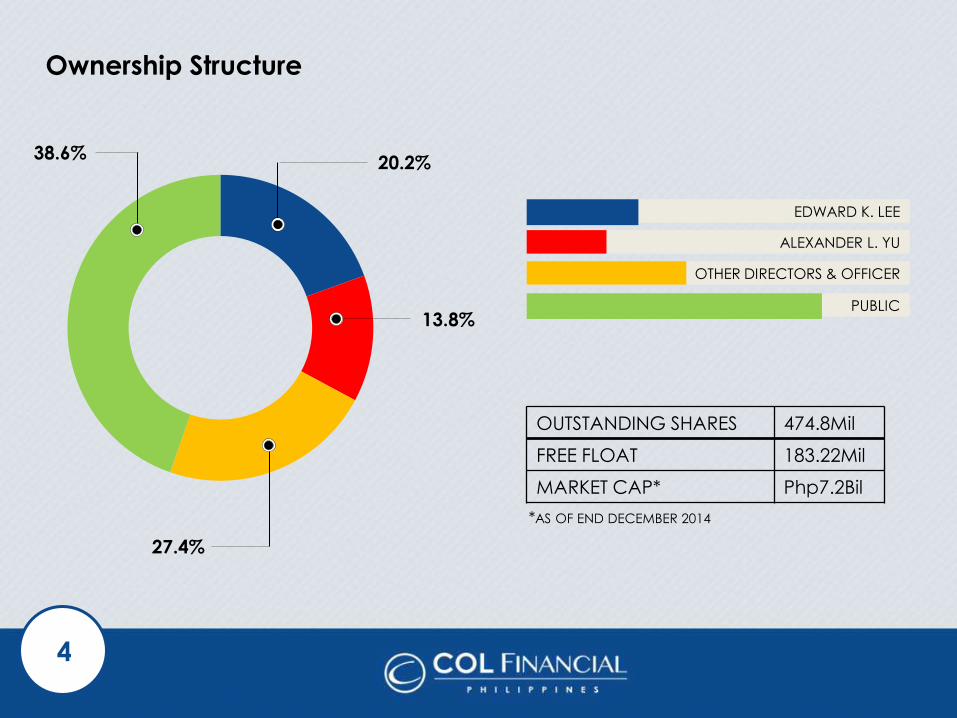
Ownership Structure
4
EDWARD K. LEE
OUTSTANDING SHARES 474.8Mil
FREE FLOAT 183.22Mil
MARKET CAP* Php7.2Bil
ALEXANDER L. YU
OTHER DIRECTORS & OFFICER
PUBLIC 13.8%
27.4%
38.6% 20.2%
*AS OF END DECEMBER 2014
Business Objective
5
To be the preferred source of financial services, a trusted
provider of guidance and investment and a strong
organization committed to delivering great value to its
customers.
Our goal is to be the
Champion of the Filipino Investor
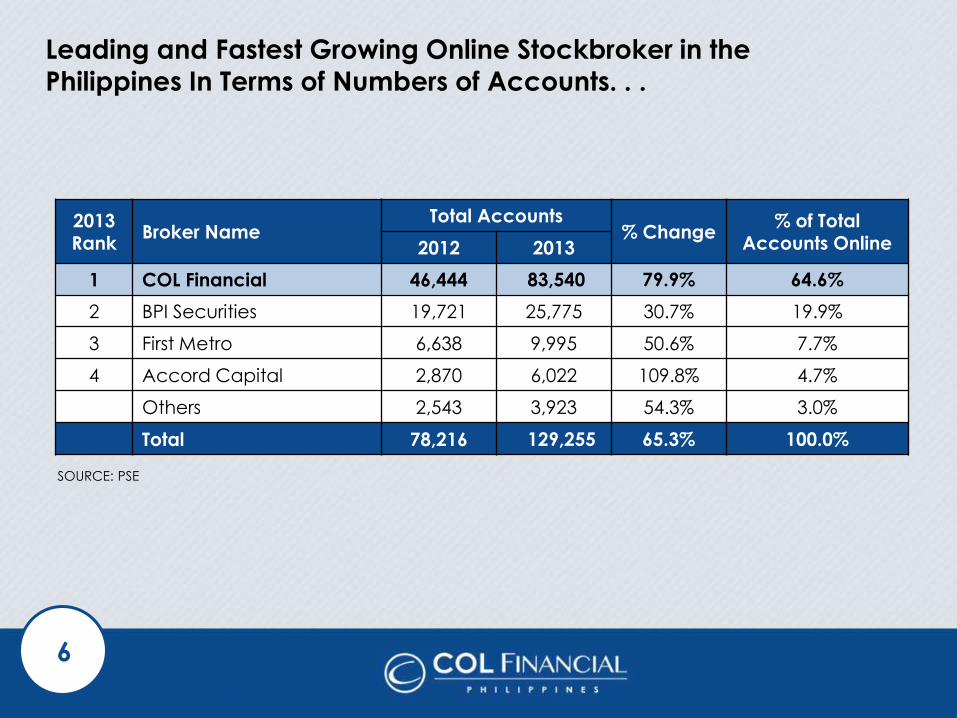
Leading and Fastest Growing Online Stockbroker in the
Philippines In Terms of Numbers of Accounts. . .
6
2013 Rank
Broker Name Total Accounts
% Change % of Total
Accounts Online 2012 2013
1 COL Financial 46,444 83,540 79.9% 64.6%
2 BPI Securities 19,721 25,775 30.7% 19.9%
3 First Metro 6,638 9,995 50.6% 7.7%
4 Accord Capital 2,870 6,022 109.8% 4.7%
Others 2,543 3,923 54.3% 3.0%
Total 78,216 129,255 65.3% 100.0%
SOURCE: PSE
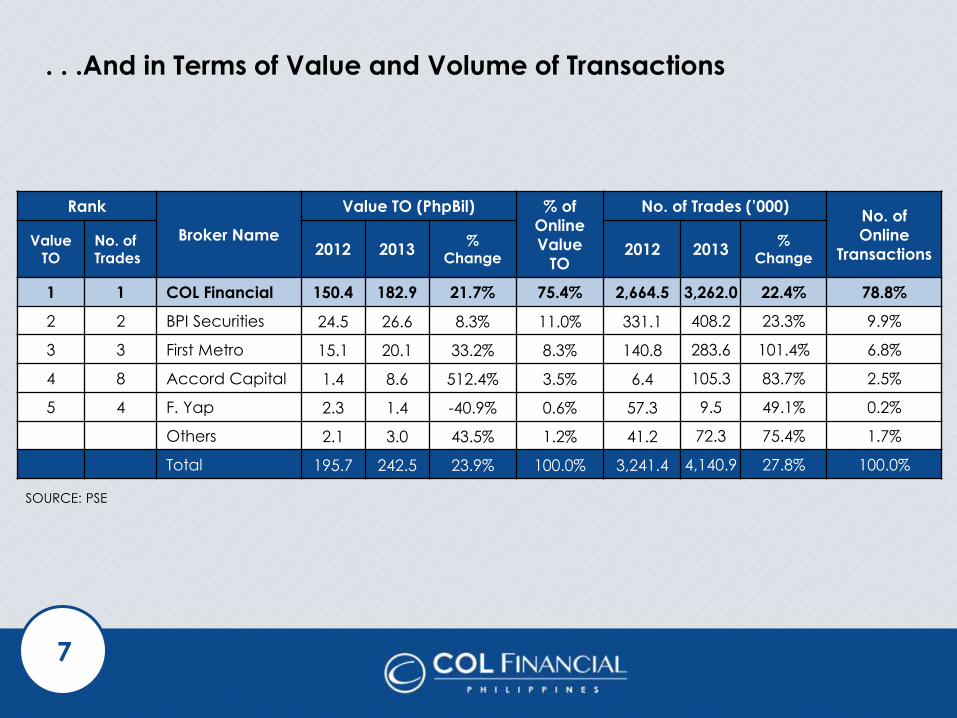
. . .And in Terms of Value and Volume of Transactions
7
Rank
Broker Name
Value TO (PhpBil) % of
Online
Value
TO
No. of Trades (’000) No. of
Online
Transactions Value
TO No. of Trades
2012 2013 %
Change 2012 2013
% Change
1 1 COL Financial 150.4 182.9 21.7% 75.4% 2,664.5 3,262.0 22.4% 78.8%
2 2 BPI Securities 24.5 26.6 8.3% 11.0% 331.1 408.2 23.3% 9.9%
3 3 First Metro 15.1 20.1 33.2% 8.3% 140.8 283.6 101.4% 6.8%
4 8 Accord Capital 1.4 8.6 512.4% 3.5% 6.4 105.3 83.7% 2.5%
5 4 F. Yap 2.3 1.4 -40.9% 0.6% 57.3 9.5 49.1% 0.2%
Others 2.1 3.0 43.5% 1.2% 41.2 72.3 75.4% 1.7%
Total 195.7 242.5 23.9% 100.0% 3,241.4 4,140.9 27.8% 100.0%
SOURCE: PSE
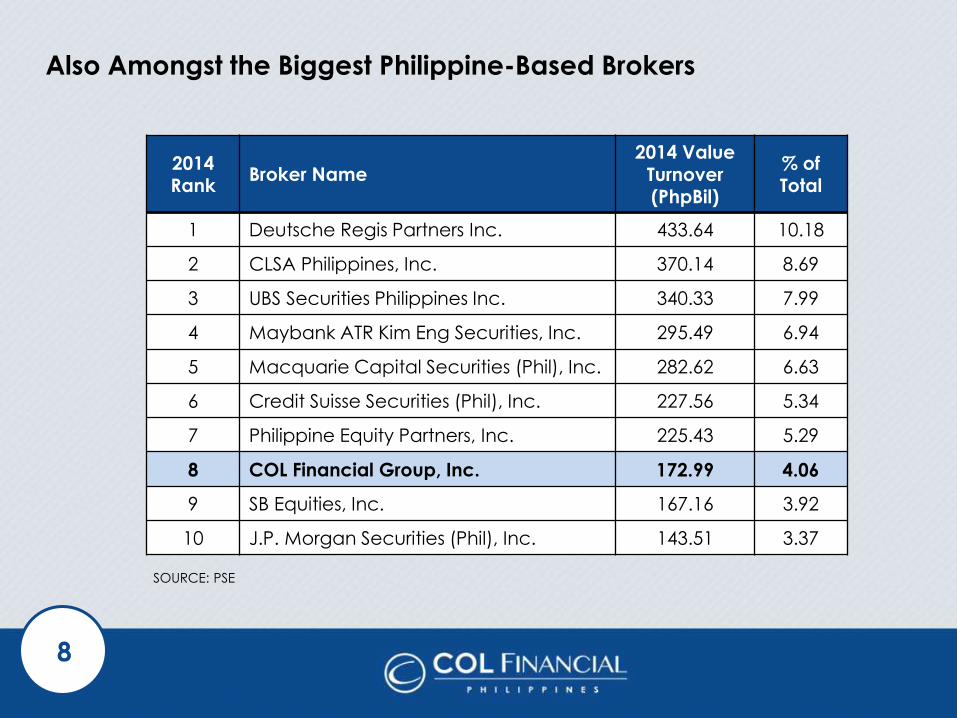
Also Amongst the Biggest Philippine-Based Brokers
8
2014 Rank
Broker Name 2014 Value
Turnover (PhpBil)
% of Total
1 Deutsche Regis Partners Inc. 433.64 10.18
2 CLSA Philippines, Inc. 370.14 8.69
3 UBS Securities Philippines Inc. 340.33 7.99
4 Maybank ATR Kim Eng Securities, Inc. 295.49 6.94
5 Macquarie Capital Securities (Phil), Inc. 282.62 6.63
6 Credit Suisse Securities (Phil), Inc. 227.56 5.34
7 Philippine Equity Partners, Inc. 225.43 5.29
8 COL Financial Group, Inc. 172.99 4.06
9 SB Equities, Inc. 167.16 3.92
10 J.P. Morgan Securities (Phil), Inc. 143.51 3.37
SOURCE: PSE
9
0%
10%
20%
30%
40%
50%
60%
70%
80%
90%
100%
FY14
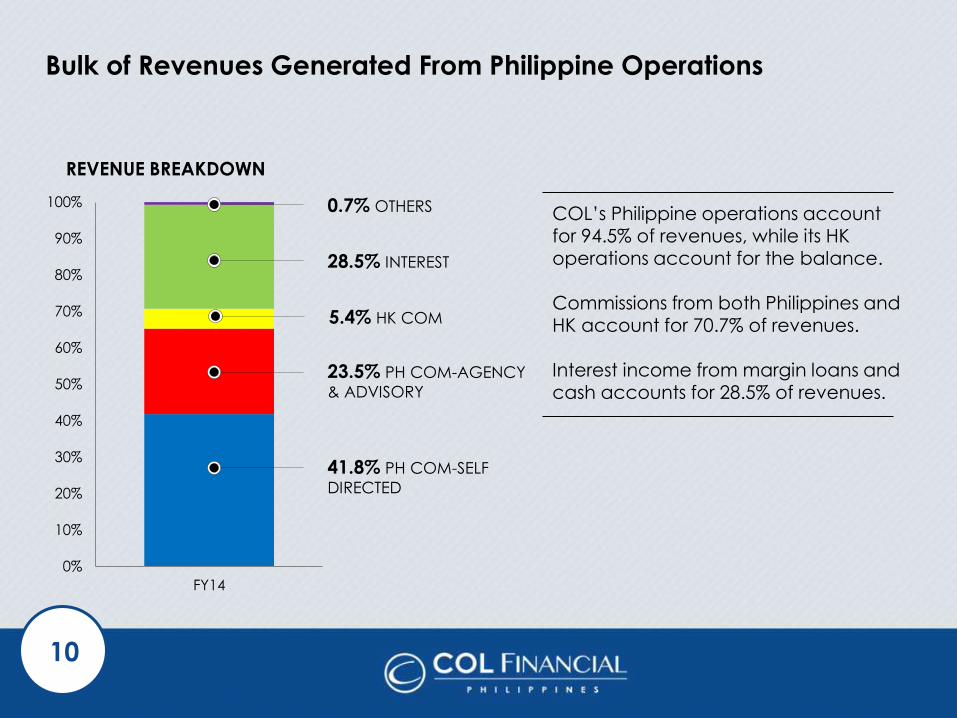
Bulk of Revenues Generated From Philippine Operations
10
COL’s Philippine operations account for 94.5% of revenues, while its HK
operations account for the balance. Commissions from both Philippines and HK account for 70.7% of revenues.
Interest income from margin loans and cash accounts for 28.5% of revenues.
REVENUE BREAKDOWN
0.7% OTHERS
28.5% INTEREST
5.4% HK COM
23.5% PH COM-AGENCY
& ADVISORY
41.8% PH COM-SELF
DIRECTED
Investor Presentation Highlights
11
FINANCIAL & OPERATING
HIGHLIGHTS
GROWTH
PLANS COMPANY
OVERVIEW
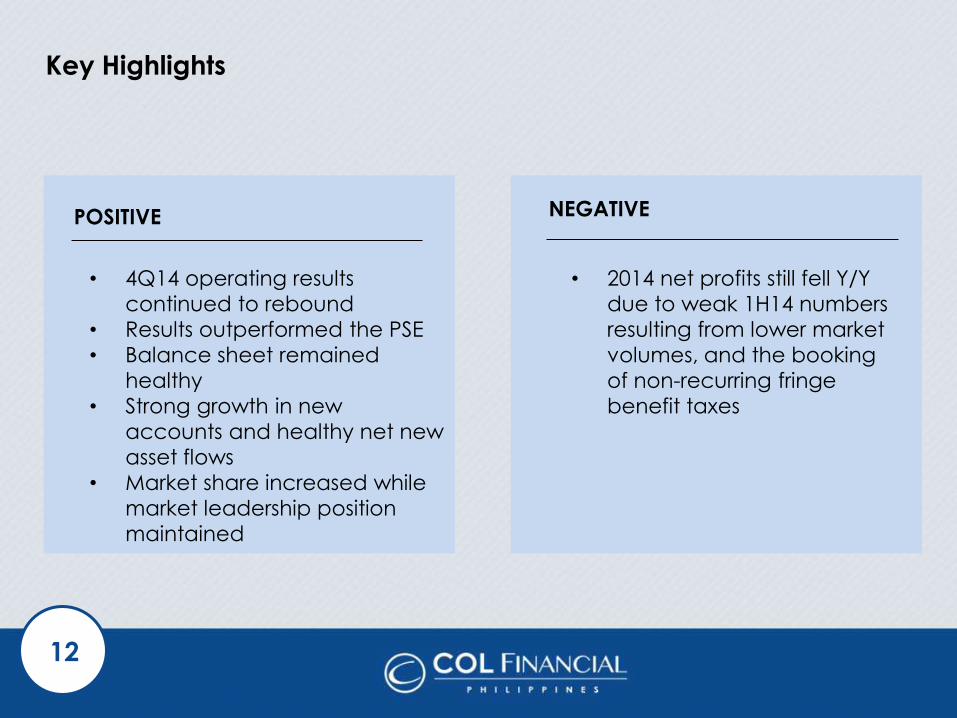
Key Highlights
12
• 4Q14 operating results
continued to rebound
• Results outperformed the PSE
• Balance sheet remained
healthy
• Strong growth in new
accounts and healthy net new
asset flows
• Market share increased while
market leadership position
maintained
• 2014 net profits still fell Y/Y
due to weak 1H14 numbers
resulting from lower market
volumes, and the booking
of non-recurring fringe
benefit taxes
POSITIVE NEGATIVE
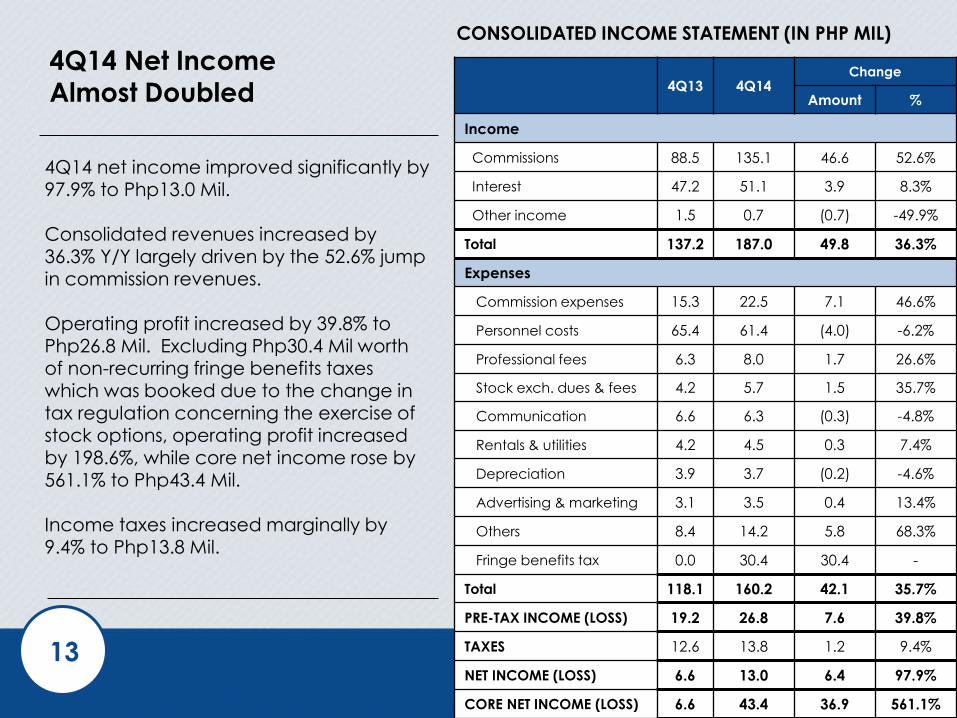
4Q14 Net Income Almost Doubled
13
4Q14 net income improved significantly by
97.9% to Php13.0 Mil. Consolidated revenues increased by 36.3% Y/Y largely driven by the 52.6% jump in commission revenues.
Operating profit increased by 39.8% to Php26.8 Mil. Excluding Php30.4 Mil worth of non-recurring fringe benefits taxes which was booked due to the change in tax regulation concerning the exercise of stock options, operating profit increased
by 198.6%, while core net income rose by 561.1% to Php43.4 Mil. Income taxes increased marginally by 9.4% to Php13.8 Mil.
4Q13 4Q14 Change
Amount %
Income
Commissions 88.5 135.1 46.6 52.6%
Interest 47.2 51.1 3.9 8.3%
Other income 1.5 0.7 (0.7) -49.9%
Total 137.2 187.0 49.8 36.3%
Expenses
Commission expenses 15.3 22.5 7.1 46.6%
Personnel costs 65.4 61.4 (4.0) -6.2%
Professional fees 6.3 8.0 1.7 26.6%
Stock exch. dues & fees 4.2 5.7 1.5 35.7%
Communication 6.6 6.3 (0.3) -4.8%
Rentals & utilities 4.2 4.5 0.3 7.4%
Depreciation 3.9 3.7 (0.2) -4.6%
Advertising & marketing 3.1 3.5 0.4 13.4%
Others 8.4 14.2 5.8 68.3%
Fringe benefits tax 0.0 30.4 30.4 -
Total 118.1 160.2 42.1 35.7%
PRE-TAX INCOME (LOSS) 19.2 26.8 7.6 39.8%
TAXES 12.6 13.8 1.2 9.4%
NET INCOME (LOSS) 6.6 13.0 6.4 97.9%
CORE NET INCOME (LOSS) 6.6 43.4 36.9 561.1%
CONSOLIDATED INCOME STATEMENT (IN PHP MIL)
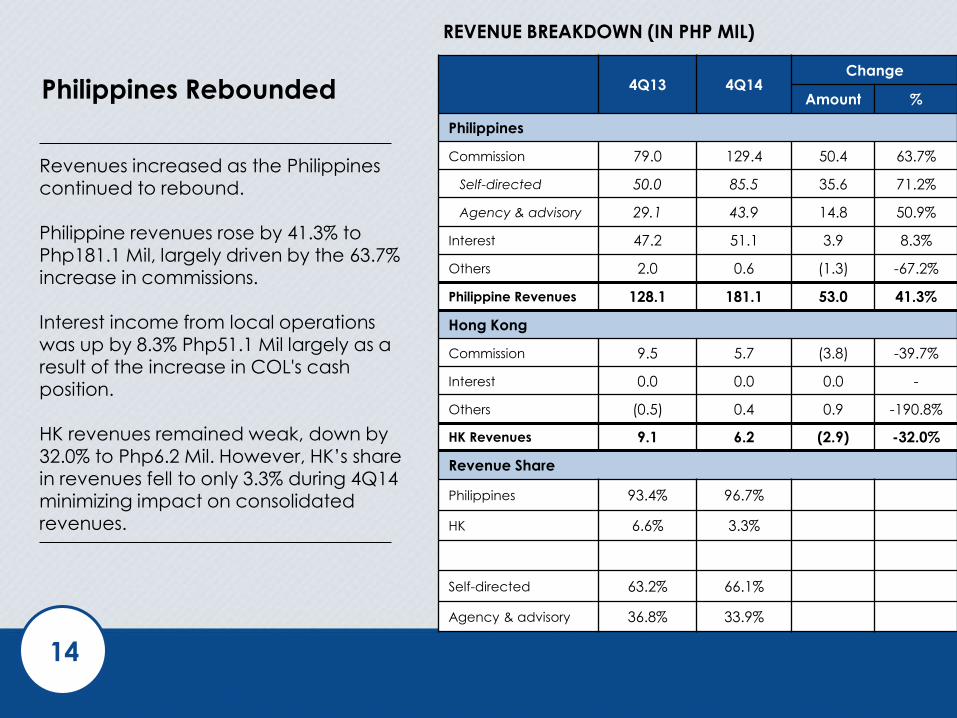
4Q13 4Q14 Change
Amount %
Philippines
Commission 79.0 129.4 50.4 63.7%
Self-directed 50.0 85.5 35.6 71.2%
Agency & advisory 29.1 43.9 14.8 50.9%
Interest 47.2 51.1 3.9 8.3%
Others 2.0 0.6 (1.3) -67.2%
Philippine Revenues 128.1 181.1 53.0 41.3%
Hong Kong
Commission 9.5 5.7 (3.8) -39.7%
Interest 0.0 0.0 0.0 -
Others (0.5) 0.4 0.9 -190.8%
HK Revenues 9.1 6.2 (2.9) -32.0%
Revenue Share
Philippines 93.4% 96.7%
HK 6.6% 3.3%
Self-directed 63.2% 66.1%
Agency & advisory 36.8% 33.9%
Philippines Rebounded
14
Revenues increased as the Philippines continued to rebound.
Philippine revenues rose by 41.3% to Php181.1 Mil, largely driven by the 63.7% increase in commissions. Interest income from local operations
was up by 8.3% Php51.1 Mil largely as a result of the increase in COL's cash position. HK revenues remained weak, down by 32.0% to Php6.2 Mil. However, HK’s share
in revenues fell to only 3.3% during 4Q14 minimizing impact on consolidated revenues.
REVENUE BREAKDOWN (IN PHP MIL)
2014 Net Income Fell 13.6% Y/Y
15
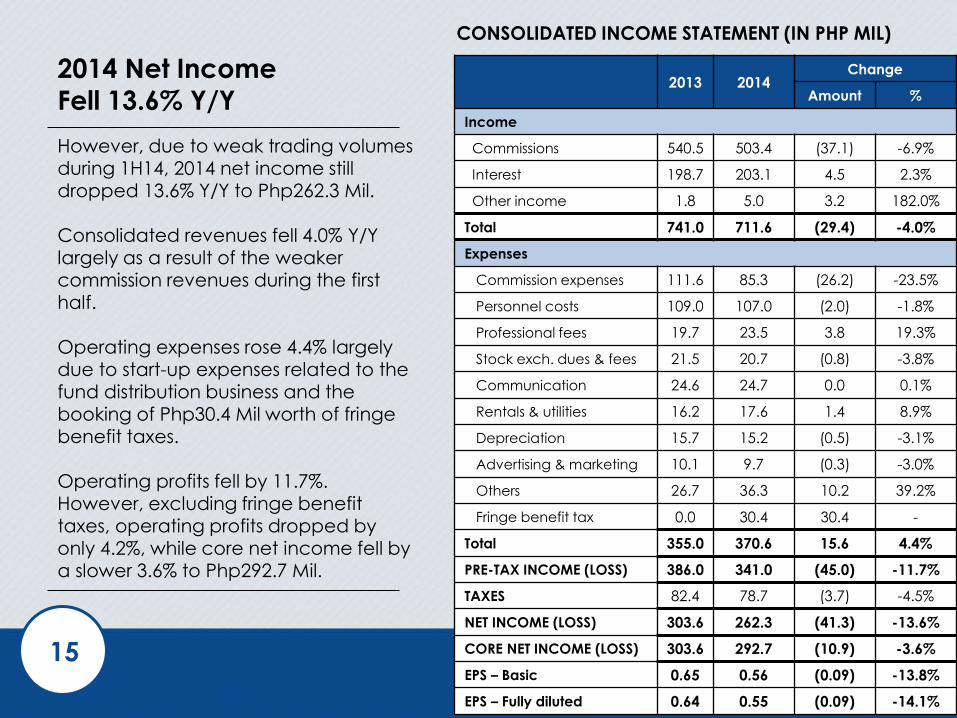
However, due to weak trading volumes during 1H14, 2014 net income still dropped 13.6% Y/Y to Php262.3 Mil. Consolidated revenues fell 4.0% Y/Y largely as a result of the weaker
commission revenues during the first half. Operating expenses rose 4.4% largely due to start-up expenses related to the fund distribution business and the
booking of Php30.4 Mil worth of fringe benefit taxes. Operating profits fell by 11.7%. However, excluding fringe benefit taxes, operating profits dropped by
only 4.2%, while core net income fell by a slower 3.6% to Php292.7 Mil.
2013 2014 Change
Amount %
Income
Commissions 540.5 503.4 (37.1) -6.9%
Interest 198.7 203.1 4.5 2.3%
Other income 1.8 5.0 3.2 182.0%
Total 741.0 711.6 (29.4) -4.0%
Expenses
Commission expenses 111.6 85.3 (26.2) -23.5%
Personnel costs 109.0 107.0 (2.0) -1.8%
Professional fees 19.7 23.5 3.8 19.3%
Stock exch. dues & fees 21.5 20.7 (0.8) -3.8%
Communication 24.6 24.7 0.0 0.1%
Rentals & utilities 16.2 17.6 1.4 8.9%
Depreciation 15.7 15.2 (0.5) -3.1%
Advertising & marketing 10.1 9.7 (0.3) -3.0%
Others 26.7 36.3 10.2 39.2%
Fringe benefit tax 0.0 30.4 30.4 -
Total 355.0 370.6 15.6 4.4%
PRE-TAX INCOME (LOSS) 386.0 341.0 (45.0) -11.7%
TAXES 82.4 78.7 (3.7) -4.5%
NET INCOME (LOSS) 303.6 262.3 (41.3) -13.6%
CORE NET INCOME (LOSS) 303.6 292.7 (10.9) -3.6%
EPS – Basic 0.65 0.56 (0.09) -13.8%
EPS – Fully diluted 0.64 0.55 (0.09) -14.1%
CONSOLIDATED INCOME STATEMENT (IN PHP MIL)
2013 2014 Change
Amount %
Philippines
Commission 496.1 464.6 (31.4) -6.3%
Self-directed 298.0 297.6 (0.4) -0.1%
Agency & advisory 198.1 167.0 (31.0) -15.7%
Interest 198.7 203.1 4.5 2.3%
Others 1.7 4.7 3.0 177.9%
Philippine Revenues 696.4 672.4 (24.0) -3.4%
Hong Kong
Commission 44.5 38.8 (5.7) -12.8%
Interest 0.0 0.0 0.0
Others 0.1 0.4 0.3 248.3%
HK Revenues 44.6 39.1 (5.5) -12.2%
Revenue Share
Philippines 94.0% 94.5%
HK 6.0% 5.5%
Self-directed 60.1% 64.1%
Agency & advisory 39.9% 35.9%
Philippines & HK Down
16
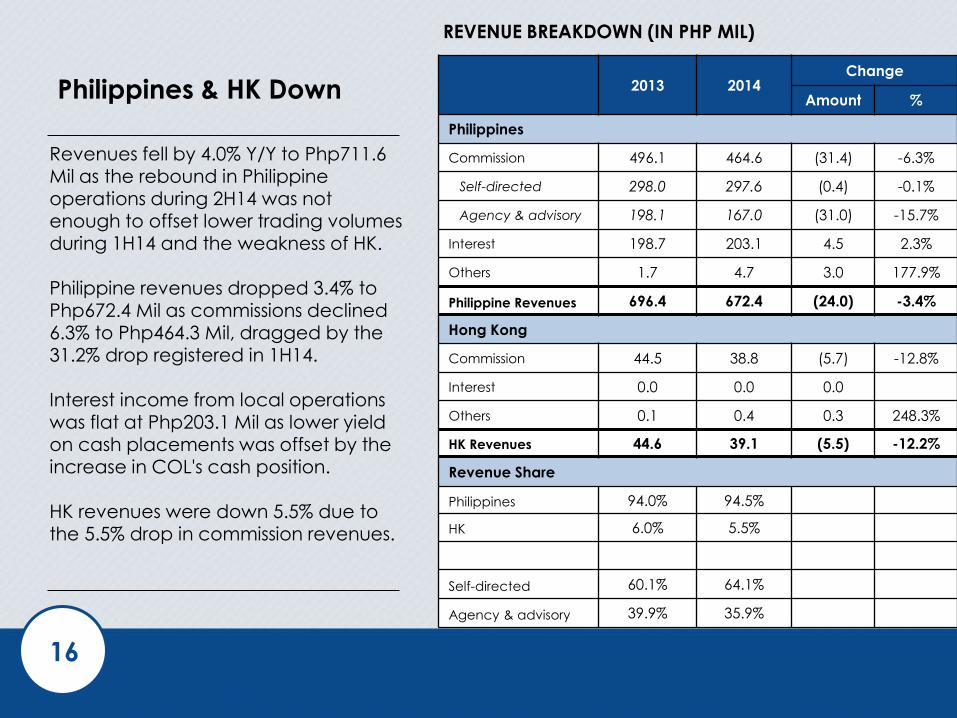
Revenues fell by 4.0% Y/Y to Php711.6 Mil as the rebound in Philippine operations during 2H14 was not enough to offset lower trading volumes during 1H14 and the weakness of HK.
Philippine revenues dropped 3.4% to Php672.4 Mil as commissions declined 6.3% to Php464.3 Mil, dragged by the 31.2% drop registered in 1H14.
Interest income from local operations was flat at Php203.1 Mil as lower yield on cash placements was offset by the increase in COL's cash position. HK revenues were down 5.5% due to
the 5.5% drop in commission revenues.
REVENUE BREAKDOWN (IN PHP MIL)
ROAE Remained Healthy
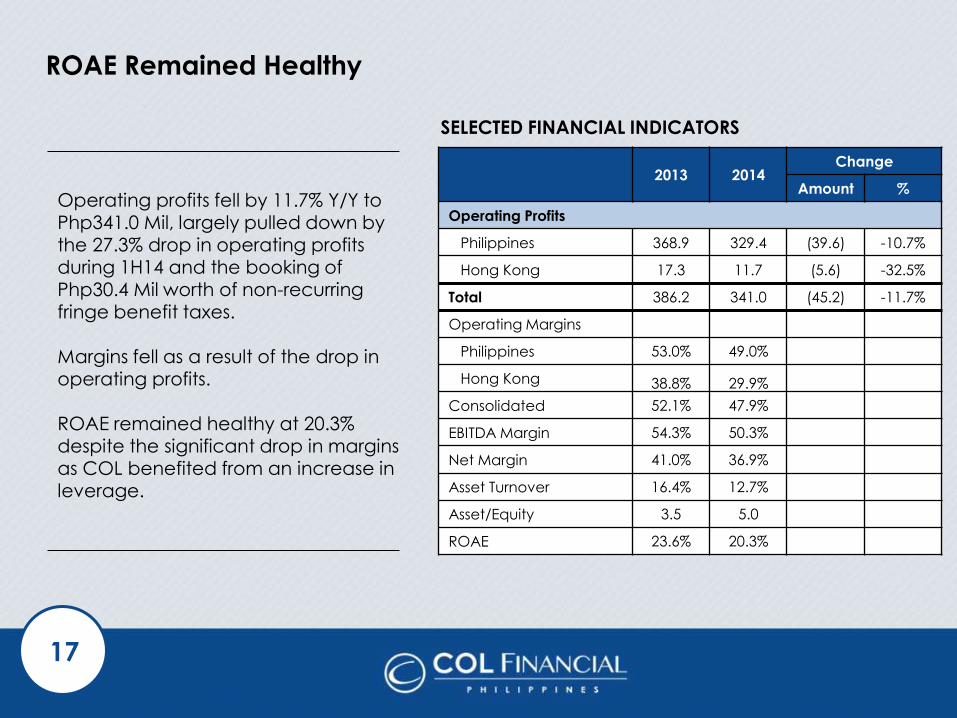
Operating profits fell by 11.7% Y/Y to Php341.0 Mil, largely pulled down by the 27.3% drop in operating profits during 1H14 and the booking of
Php30.4 Mil worth of non-recurring fringe benefit taxes. Margins fell as a result of the drop in operating profits.
ROAE remained healthy at 20.3% despite the significant drop in margins as COL benefited from an increase in leverage.
2013 2014 Change
Amount %
Operating Profits
Philippines 368.9 329.4 (39.6) -10.7%
Hong Kong 17.3 11.7 (5.6) -32.5%
Total 386.2 341.0 (45.2) -11.7%
Operating Margins
Philippines 53.0% 49.0%
Hong Kong 38.8% 29.9%
Consolidated 52.1% 47.9%
EBITDA Margin 54.3% 50.3%
Net Margin 41.0% 36.9%
Asset Turnover 16.4% 12.7%
Asset/Equity 3.5 5.0
ROAE 23.6% 20.3%
17
SELECTED FINANCIAL INDICATORS
Strong and Highly Liquid Balance Sheet
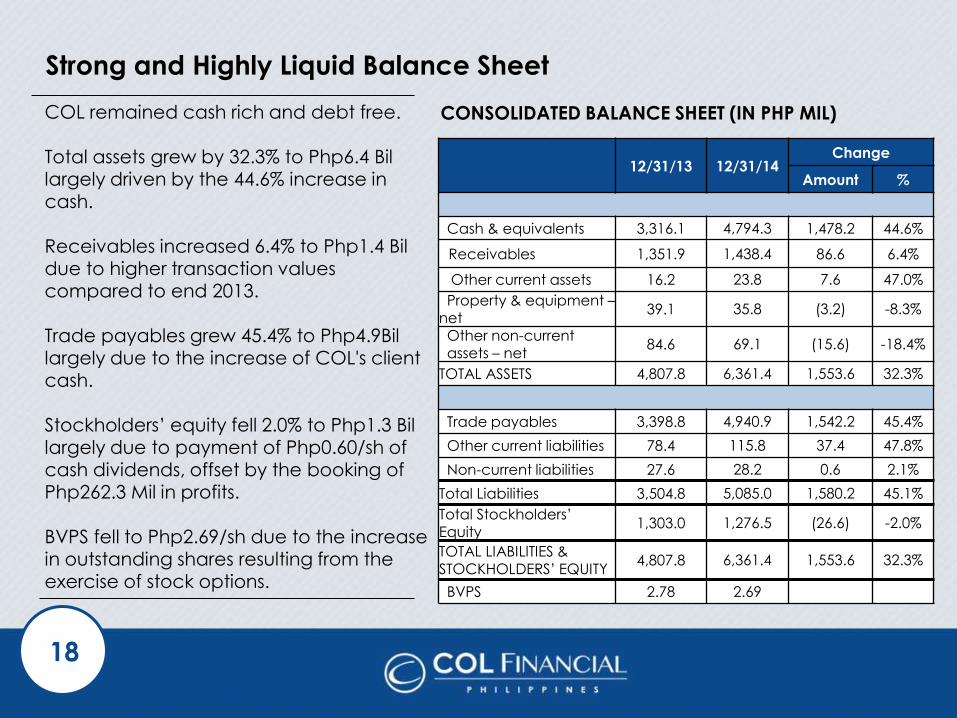
COL remained cash rich and debt free. Total assets grew by 32.3% to Php6.4 Bil largely driven by the 44.6% increase in
cash. Receivables increased 6.4% to Php1.4 Bil due to higher transaction values compared to end 2013.
Trade payables grew 45.4% to Php4.9Bil largely due to the increase of COL's client cash. Stockholders’ equity fell 2.0% to Php1.3 Bil
largely due to payment of Php0.60/sh of cash dividends, offset by the booking of Php262.3 Mil in profits. BVPS fell to Php2.69/sh due to the increase in outstanding shares resulting from the
exercise of stock options.
18
12/31/13 12/31/14 Change
Amount %
Cash & equivalents 3,316.1 4,794.3 1,478.2 44.6%
Receivables 1,351.9 1,438.4 86.6 6.4%
Other current assets 16.2 23.8 7.6 47.0%
Property & equipment – net
39.1 35.8 (3.2) -8.3%
Other non-current assets – net
84.6 69.1 (15.6) -18.4%
TOTAL ASSETS 4,807.8 6,361.4 1,553.6 32.3%
Trade payables 3,398.8 4,940.9 1,542.2 45.4%
Other current liabilities 78.4 115.8 37.4 47.8%
Non-current liabilities 27.6 28.2 0.6 2.1%
Total Liabilities 3,504.8 5,085.0 1,580.2 45.1%
Total Stockholders’ Equity
1,303.0 1,276.5 (26.6) -2.0%
TOTAL LIABILITIES & STOCKHOLDERS’ EQUITY
4,807.8 6,361.4 1,553.6 32.3%
BVPS 2.78 2.69
CONSOLIDATED BALANCE SHEET (IN PHP MIL)
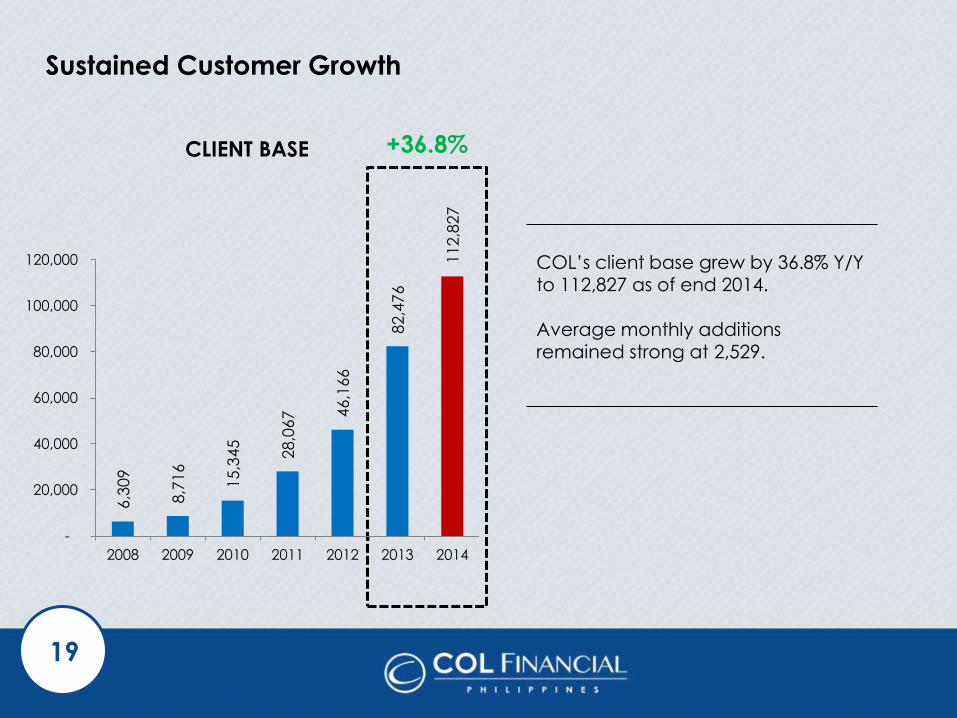
Sustained Customer Growth
19
COL’s client base grew by 36.8% Y/Y to 112,827 as of end 2014.
Average monthly additions remained strong at 2,529.
CLIENT BASE +36.8% 6
,309
8,7
16
15,3
45
28,0
67
46,1
66
82,4
76
112,8
27
-
20,000
40,000
60,000
80,000
100,000
120,000
2008 2009 2010 2011 2012 2013 2014
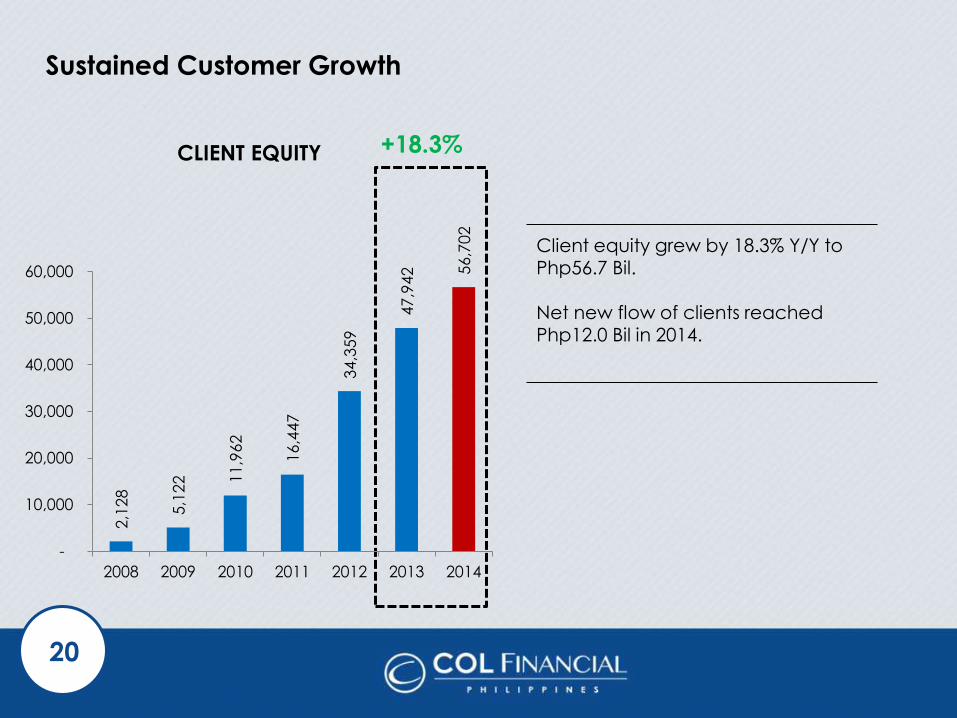
Sustained Customer Growth
20
Client equity grew by 18.3% Y/Y to Php56.7 Bil. Net new flow of clients reached Php12.0 Bil in 2014.
CLIENT EQUITY +18.3% 2
,128
5,1
22
11,9
62
16,4
47
34,3
59
47,9
42
56,7
02
-
10,000
20,000
30,000
40,000
50,000
60,000
2008 2009 2010 2011 2012 2013 2014
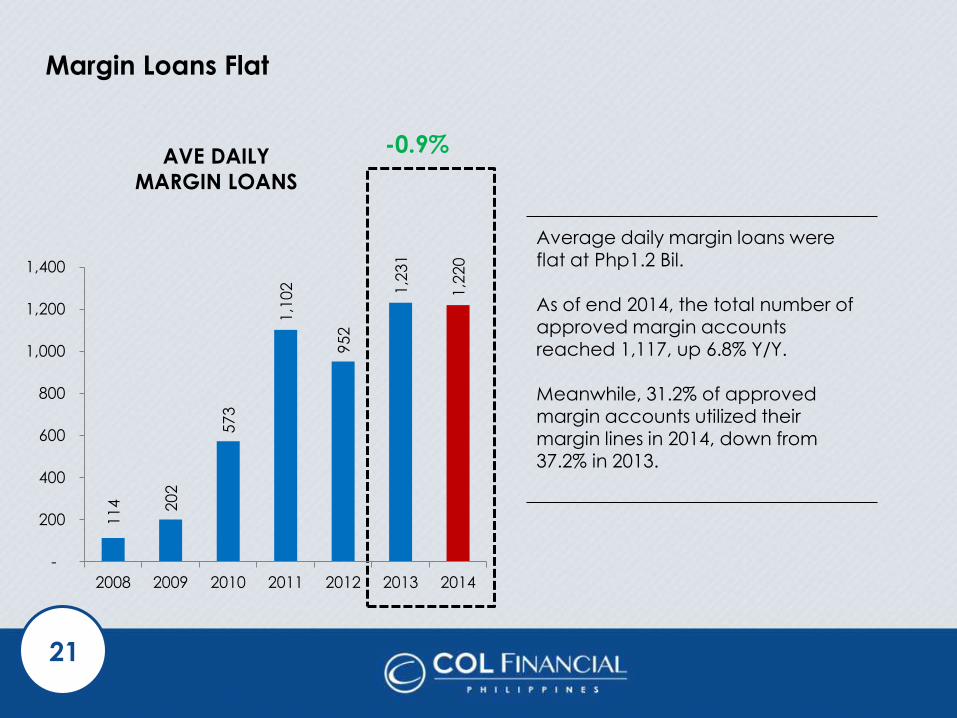
Margin Loans Flat
21
Average daily margin loans were
flat at Php1.2 Bil. As of end 2014, the total number of approved margin accounts reached 1,117, up 6.8% Y/Y.
Meanwhile, 31.2% of approved margin accounts utilized their margin lines in 2014, down from 37.2% in 2013.
AVE DAILY
MARGIN LOANS
-0.9%
114
202
573
1,1
02
952
1,2
31
1,2
20
-
200
400
600
800
1,000
1,200
1,400
2008 2009 2010 2011 2012 2013 2014
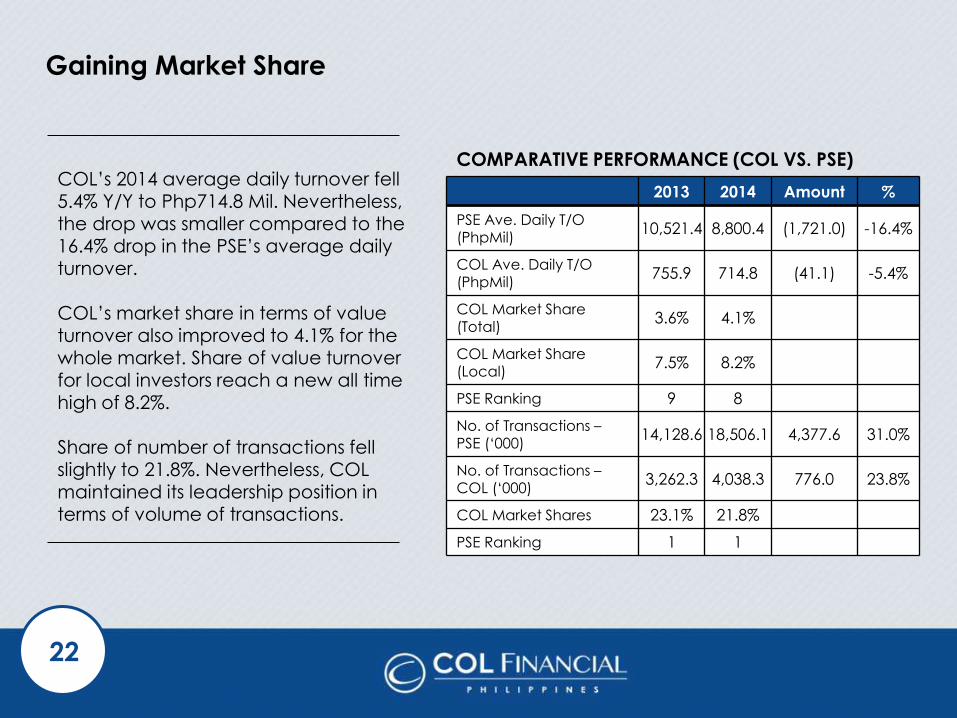
Gaining Market Share
COL’s 2014 average daily turnover fell 5.4% Y/Y to Php714.8 Mil. Nevertheless, the drop was smaller compared to the 16.4% drop in the PSE’s average daily
turnover. COL’s market share in terms of value turnover also improved to 4.1% for the whole market. Share of value turnover
for local investors reach a new all time high of 8.2%. Share of number of transactions fell slightly to 21.8%. Nevertheless, COL maintained its leadership position in
terms of volume of transactions.
22
2013 2014 Amount %
PSE Ave. Daily T/O (PhpMil)
10,521.4 8,800.4 (1,721.0) -16.4%
COL Ave. Daily T/O (PhpMil)
755.9 714.8 (41.1) -5.4%
COL Market Share
(Total) 3.6% 4.1%
COL Market Share (Local)
7.5% 8.2%
PSE Ranking 9 8
No. of Transactions – PSE (‘000)
14,128.6 18,506.1 4,377.6 31.0%
No. of Transactions – COL (‘000)
3,262.3 4,038.3 776.0 23.8%
COL Market Shares 23.1% 21.8%
PSE Ranking 1 1
COMPARATIVE PERFORMANCE (COL VS. PSE)
Investor Presentation Highlights
23
FINANCIAL & OPERATING
HIGHLIGHTS GROWTH
PLANS
COMPANY
OVERVIEW
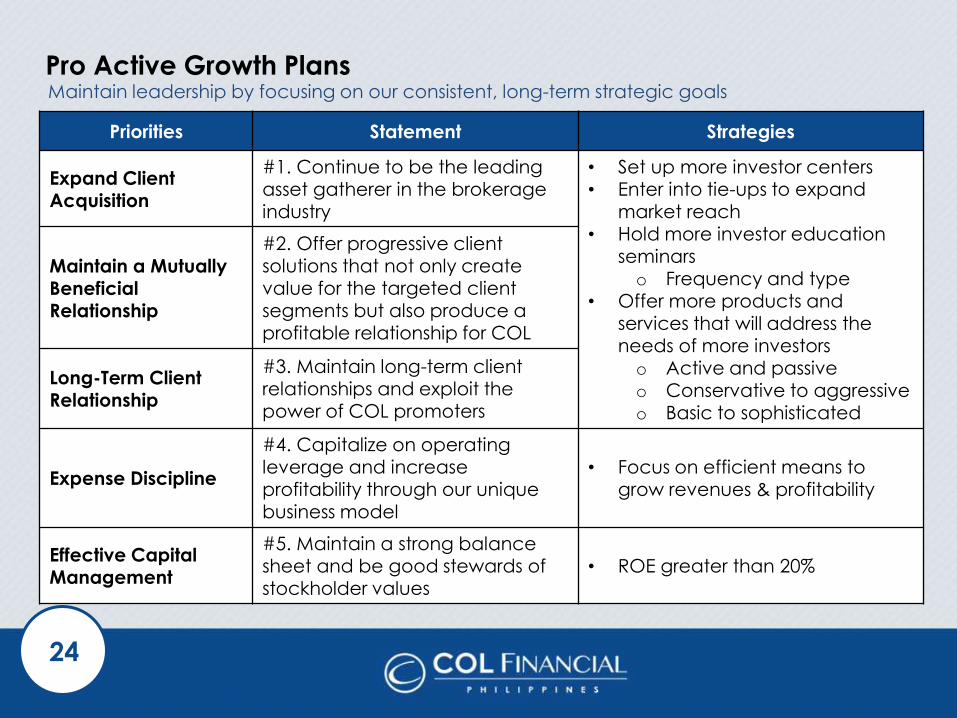
Pro Active Growth Plans
24
Maintain leadership by focusing on our consistent, long-term strategic goals
Priorities Statement Strategies
Expand Client Acquisition
#1. Continue to be the leading asset gatherer in the brokerage industry
• Set up more investor centers • Enter into tie-ups to expand
market reach
• Hold more investor education seminars o Frequency and type
• Offer more products and services that will address the needs of more investors
o Active and passive o Conservative to aggressive o Basic to sophisticated
Maintain a Mutually Beneficial Relationship
#2. Offer progressive client solutions that not only create value for the targeted client segments but also produce a profitable relationship for COL
Long-Term Client Relationship
#3. Maintain long-term client relationships and exploit the power of COL promoters
Expense Discipline
#4. Capitalize on operating leverage and increase
profitability through our unique business model
• Focus on efficient means to
grow revenues & profitability
Effective Capital Management
#5. Maintain a strong balance sheet and be good stewards of stockholder values
• ROE greater than 20%
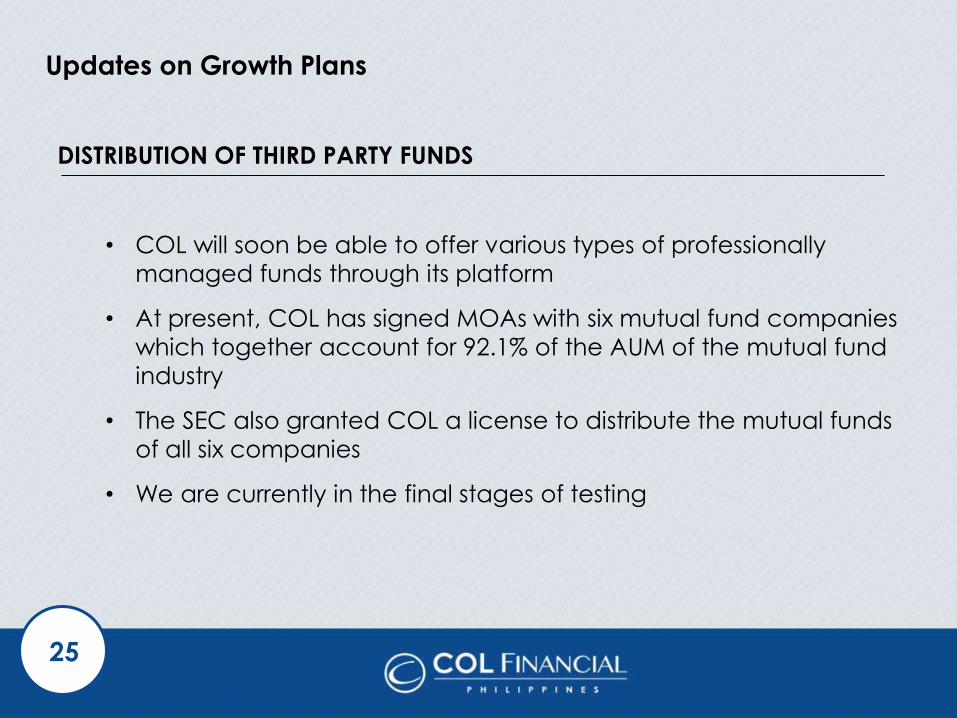
Updates on Growth Plans
25
DISTRIBUTION OF THIRD PARTY FUNDS
• COL will soon be able to offer various types of professionally
managed funds through its platform
• At present, COL has signed MOAs with six mutual fund companies
which together account for 92.1% of the AUM of the mutual fund
industry
• The SEC also granted COL a license to distribute the mutual funds
of all six companies
• We are currently in the final stages of testing

26
Thank You
This presentation was prepared solely and exclusively for discussion purposes. This
presentation and/or any part thereof may not be reproduced, disclosed or used without the prior written consent of COL Financial (the “Company”). This presentation, as well as discussions arising therefrom, may contain statements relating to future expectations and/or projections of the Company by its management team, with respect to the Company. These statements are: (i) presented on the basis of current
assumptions which the Company’s management team believes to be reasonable and presumed correct based on available data at the time these were made, (ii) based on assumptions regarding the Company’s present and future business strategies, and the environment in which it will operate in the future, (iii) a reflection of our current views with respect to future events and not a guarantee of future performance, and (iv) subject to certain factors which may cause some or all of the assumptions not to occur or cause
actual results to diverge significantly from those projected. Any and all forward looking statements made by the Company or any persons acting on its behalf are deemed qualified in their entirety by these cautionary statements . This presentation is solely for informational purposes and should in no way be construed as
a solicitation or an offer to buy or sell securities or related financial instruments of the Company.
Disclaimer