Investor Presentation - Hapag-Lloyd · Investor Presentation Full Year 2016 Results Hamburg, 24...
34
Investor Presentation Full Year 2016 Results Hamburg, 24 March 2017
Transcript of Investor Presentation - Hapag-Lloyd · Investor Presentation Full Year 2016 Results Hamburg, 24...
Investor Presentation
Full Year 2016 Results
Hamburg, 24 March 2017
2
Disclaimer
This presentation contains forward-looking statements that involve a
number of risks and uncertainties. Such statements are based on a
number of assumptions, estimates, projections or plans that are
inherently subject to significant risks, as well as uncertainties and
contingencies that are subject to change. Actual results can differ
materially from those anticipated in the Company’s forward-looking
statements as a result of a variety of factors, many of which are
beyond the control of the Company, including those set forth from
time to time in the Company’s press releases and reports and those
set forth from time to time in the Company’s analyst calls and
discussions. We do not assume any obligation to update the forward-
looking statements contained in this presentation.
This presentation does not constitute an offer to sell or a solicitation
or offer to buy any securities of the Company, and no part of this
presentation shall form the basis of or may be relied upon in
connection with any offer or commitment whatsoever. This
presentation is being presented solely for your information and is
subject to change without notice.
Forward-looking Statements
3
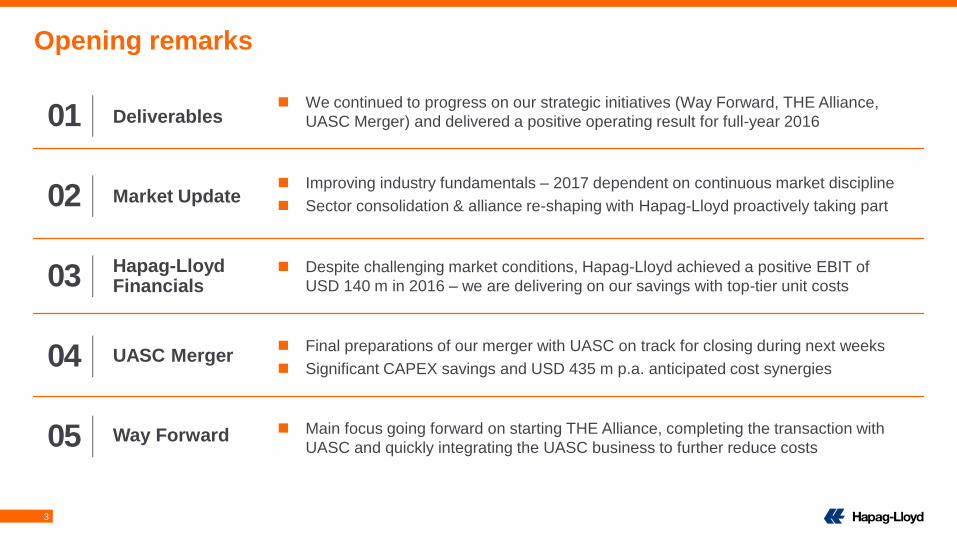
Deliverables
Market Update
Hapag-Lloyd Financials
UASC Merger
Way Forward
Opening remarks
01
05
04
03
02 Improving industry fundamentals – 2017 dependent on continuous market discipline
Sector consolidation & alliance re-shaping with Hapag-Lloyd proactively taking part
Despite challenging market conditions, Hapag-Lloyd achieved a positive EBIT of
USD 140 m in 2016 – we are delivering on our savings with top-tier unit costs
Final preparations of our merger with UASC on track for closing during next weeks
Significant CAPEX savings and USD 435 m p.a. anticipated cost synergies
We continued to progress on our strategic initiatives (Way Forward, THE Alliance,
UASC Merger) and delivered a positive operating result for full-year 2016
Main focus going forward on starting THE Alliance, completing the transaction with
UASC and quickly integrating the UASC business to further reduce costs
4
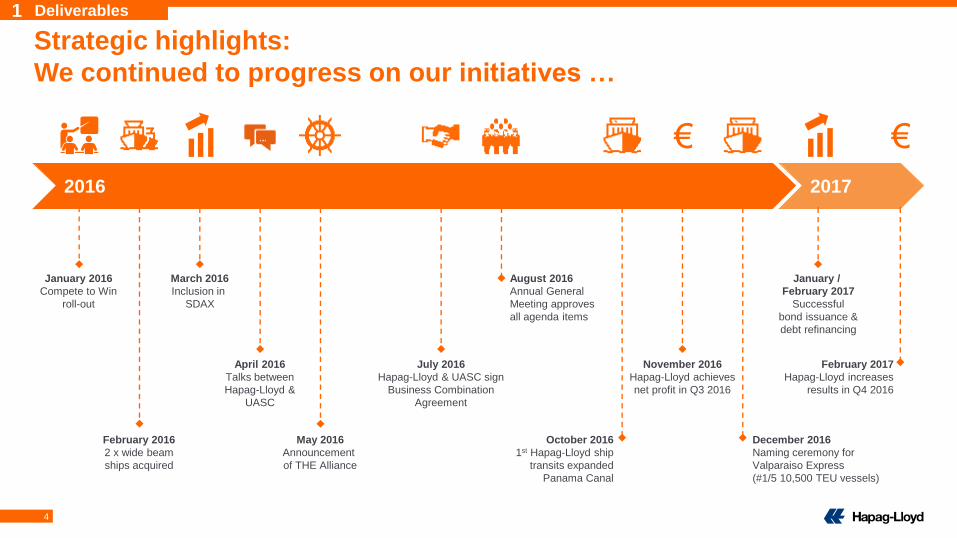
Strategic highlights:
We continued to progress on our initiatives …
1 Deliverables
2016 2017
January 2016
Compete to Win
roll-out
February 2016
2 x wide beam
ships acquired
March 2016
Inclusion in
SDAX
May 2016
Announcement
of THE Alliance
July 2016
Hapag-Lloyd & UASC sign
Business Combination
Agreement
October 2016
1st Hapag-Lloyd ship
transits expanded
Panama Canal
November 2016
Hapag-Lloyd achieves
net profit in Q3 2016
December 2016
Naming ceremony for
Valparaiso Express
(#1/5 10,500 TEU vessels)
January /
February 2017
Successful
bond issuance &
debt refinancing
February 2017
Hapag-Lloyd increases
results in Q4 2016
April 2016
Talks between
Hapag-Lloyd &
UASC
€ €
August 2016
Annual General
Meeting approves
all agenda items
5
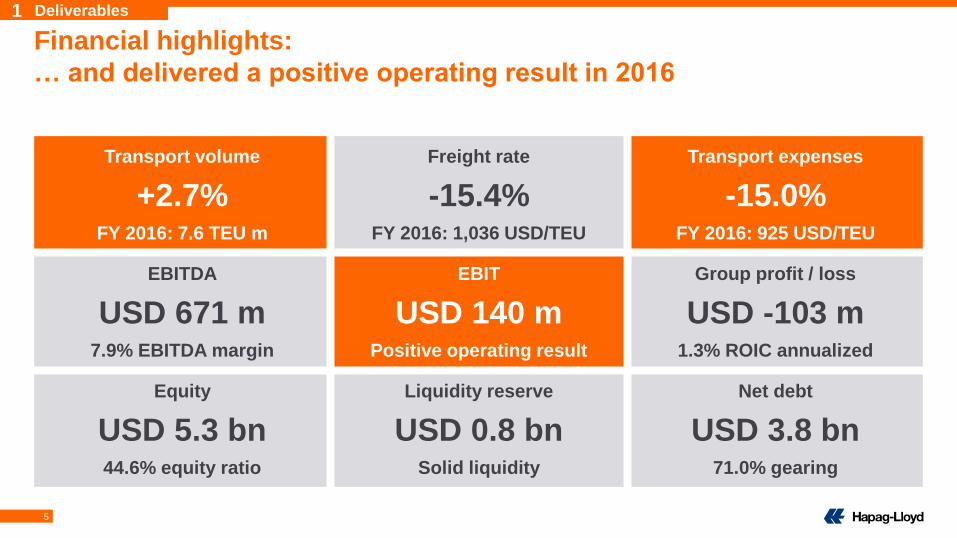
Financial highlights:
… and delivered a positive operating result in 2016
1 Deliverables
Transport volume
+2.7%FY 2016: 7.6 TEU m
Freight rate
-15.4%FY 2016: 1,036 USD/TEU
Transport expenses
-15.0%FY 2016: 925 USD/TEU
EBITDA
USD 671 m7.9% EBITDA margin
EBIT
USD 140 mPositive operating result
Group profit / loss
USD -103 m1.3% ROIC annualized
Equity
USD 5.3 bn44.6% equity ratio
Liquidity reserve
USD 0.8 bnSolid liquidity
Net debt
USD 3.8 bn71.0% gearing
6
100
150
200
250
300
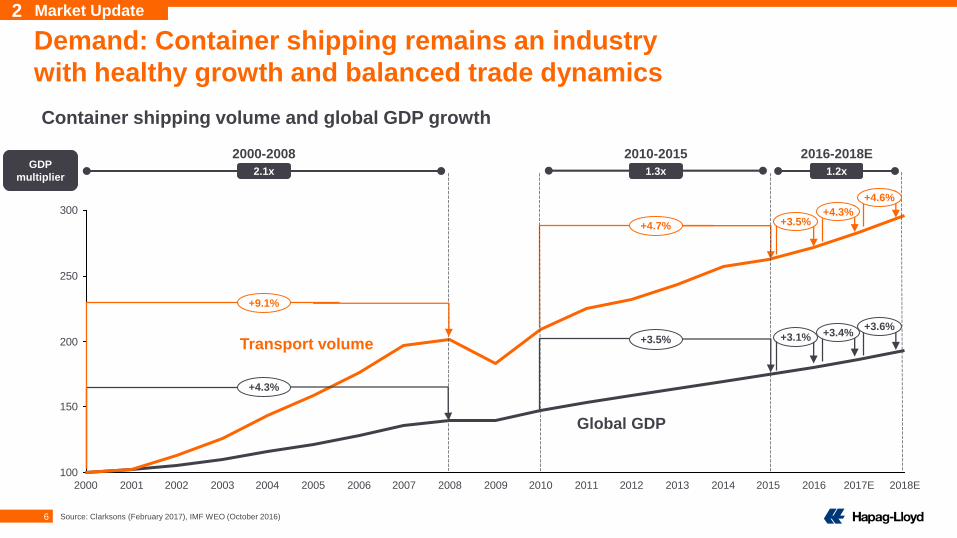
2018E2017E20162015201420132012201120102009200820072006200520042003200220012000
Demand: Container shipping remains an industry
with healthy growth and balanced trade dynamics
Container shipping volume and global GDP growth
Global GDP
Transport volume
+4.7% +3.5%
6
2 Market Update
2000-2008 2010-2015 2016-2018E
2.1x 1.3x 1.2xGDP
multiplier
Source: Clarksons (February 2017), IMF WEO (October 2016)
+4.3%
+4.6%
+3.1% +3.4%+3.6%
+3.5%
+4.3%
+9.1%
7
Supply: Capacity growth is slowing (as a result of
decreasing benefits of ever larger vessels)
Orderbook-to-fleet [TEU m, %] Orders placed by year [TEU m]
Vessel deliveries by year [TEU m]
7
6
5
4
3
8
2
1
0
2012
21%
3.4
2011
28%
4.3
2010
27%
3.9
2009
38%
5.0
2008
6.0
2007
61%
6.5
2013
21%
3.6
2016
17%
3.4
2015
19%
3.8
2014
18%
3.3
50%
-91%
Feb 17
YTD
0.0
2016
0.2
2015
2.2
2014
1.1
2013
0.1
2008
1.2
2007
3.2
2.0
2012
0.4
2011
1.8
2010
0.6
2009
-35%
2016
1.1
2015
1.7
2014
1.5
2013
1.3
2012
1.3
2011
1.2
2010
1.4
2009
1.2
2008
1.4
2007
1.41.6
2017E
2 Market Update
Source: Clarksons (February 2017), Drewry , MDS Transmodal (January / February 2017)
8
181923232324
302827
… slowly reducing supply / demand gap
Supply: Scrapping and idling help to further
reduce effective supply growth
Highest scrapping level ever … … and idling remains high …
… keeping net capacity growth low …
-10
-5
0
5
10
15
20
2018E
5.5%
4.6%
2017E
3.7%
4.3%
2016
1.8%
3.5%
2015
8.4%
2.2%
2014
6.3%
5.3%
2013
5.5%
5.1%
2012
6.1%
3.1%
2011
8.0%
7.8%
2010
9.7%
13.7%
2009
6.8%
-9.2%
Demand Supply
[TTEU]
228
779809
356
1,480
Q4
2009
595
Q4
2010
Q4
2011
1,324
Q4
2016
1,441
Q4
2015
1,359
Q4
2014
Q4
2013
Q4
2012
Especially in
Panamax segment
6.6%Share of world fleet
Net capacity growth 2017E
-1.0%
Scheduled
capacity growth
Scrapping
-3.0%
Post-ponements Net capacity growth
3.7%
7.7%
[TTEU]
332
2011 2012 2013
444
75
351
2009
131
2010
650
138
2016
+237%
Feb 17
YTD
381
2014
193
2015
Average age
2 Market Update
Source: Alphaliner (February 2017), Clarksons (February 2017), Drewry (Forecaster 4Q16)
9
Freight rates are slowly improving from Q2 2016 lows –
But continuous market discipline needed during 2017
Shanghai – Europe (SCFI)
Shanghai – Latin America (SCFI)
Shanghai – USA (SCFI)
Comments
Further freight rate increases planned for April 2017 by various carriers, e.g.:1)
Hapag-Lloyd: Asia – ISC: USD 250 /TEU – 1 April; Asia (Pacific) – ME: USD / 200 USD
– 1 April; Asia – Latin America: USD 1050 / TEU – 15 April
CMA CGM: Asia – Latin America: USD 1050 / TEU – 1 April, ISC – Africa: USD 250 / TEU
– 1 April, Asia – Africa: USD 350 / TEU
OOCL: Asia – North America: USD 640 / TEU – 1 April
MOL: Asia – Africa: USD 300 / TEU – 1 April
Market bunker price level increased in Q4 2016 and beginning of 2017 compared
to 9M 2016 which is also partially reflected in higher spot market rates
815
2,500
2,000
1,500
1,000
500
0
Jan
17
Oct
16
Jul
16
Apr
16
Jan
16
Oct
15
Jul
15
Apr
15
Jan
15
Oct
14
Jul
14
Apr
14
Jan
14
6,000
5,000
4,000
3,000
2,000
1,000
0
Jan
17
Oct
16
Jul
16
Apr
16
Jan
16
Oct
15
Jul
15
Apr
15
Jan
15
Oct
14
Jul
14
Apr
14
Jan
14
2,625
1,288
1,500
1,000
500
0
2,000
2,500
3,000
Apr
15
Jan
15
Oct
14
Jul
14
Apr
14
Jan
14
Jan
17
Oct
16
Jul
16
Apr
16
Jan
16
Oct
15
Jul
15
1,726
HL Far East*NEurope (USD/TEU) Mediter. (USD/TEU)USEC (USD/FEU) HL Transpacific*USWC (USD/FEU)
HL Latin America* (USD/TEU)LatAm (USD/TEU)
1) Based on peer and industry publications * Hapag-Lloyd trade definition
2 Market Update
Source: Shanghai Shipping Exchange (24 March 2017)
798
10
CSCL
0.6
APL
0.6
Hanjin
0.7
Hapag-
Lloyd
0.7
COSCO
0.8
Ever-
green
0.8
CMA
CGM
1.5
MSC
2.3
Maersk Hyundai
0.3
ZIM
0.3
K-Line
0.3
PIL
0.4
Yang
Ming
0.4
OOCL
0.5
Hamburg
Süd
0.5
NYK
0.5
MOL CSAV
0.3
UASC
0.30.5
2.5
Carrier capacity [TEU m] and global capacity share [%]
1.0
MOL / NYK
/ K-Line
1.4
COSCO
/ CSCL
1.6
CMA CGM
/ APL
2.1
MSC
2.8
Maersk /
Hamburg Süd
3.7
Hapag-Lloyd
/ UASC
1.5
ZIM
0.3
PIL
0.4
Hyundai
0.4
Yang Ming
0.6
OOCL
0.6
Evergreen
18% 14% 11% 8% 8%
5% 3% 3% 2%
7%
14% 13% 8%
4% 4% 4% 4% 3% 3% 3% 3% 3% 2% 2% 2% 2% 2% 2% 2% 1%
2% 1%
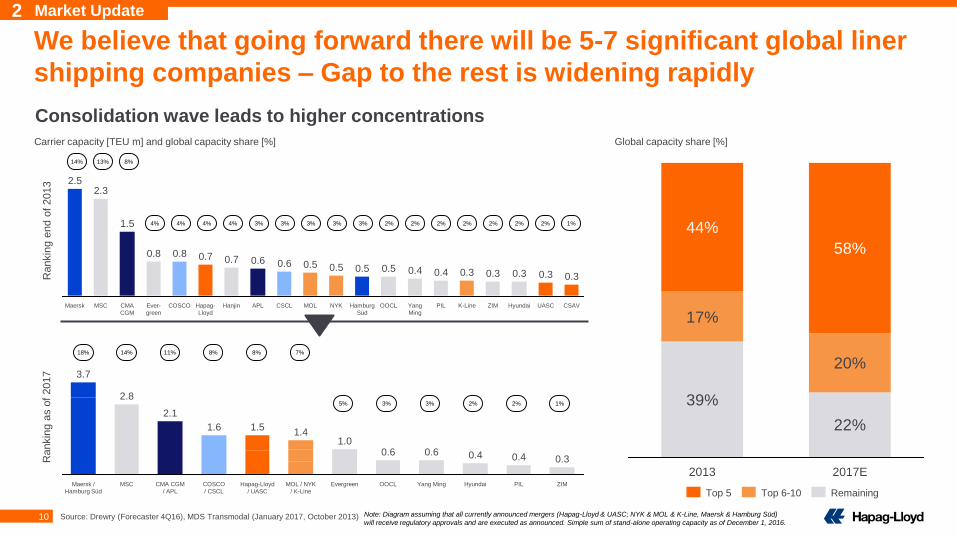
We believe that going forward there will be 5-7 significant global liner
shipping companies – Gap to the rest is widening rapidly
Consolidation wave leads to higher concentrations
Rankin
g a
s o
f 2017
Rankin
g e
nd o
f 2013
Note: Diagram assuming that all currently announced mergers (Hapag-Lloyd & UASC; NYK & MOL & K-Line, Maersk & Hamburg Süd)
will receive regulatory approvals and are executed as announced. Simple sum of stand-alone operating capacity as of December 1, 2016.
39%
22%
17%
20%
44%
58%
2017E2013
RemainingTop 6-10Top 5
Global capacity share [%]
2 Market Update
Source: Drewry (Forecaster 4Q16), MDS Transmodal (January 2017, October 2013)
11
THE Alliance covers all East-West trades
Comprehensive network of 32 services will connect
more than 75 major ports
Combined capacity of ~3.5m TEU or around 17% of world fleet –
vessel pool of more than 240 ships
Leading product characterized by
Fast transit times
Broad port coverage
Latest vessels
Unique contingency plan
Independent trust fund to safeguard
customers’ cargo on board
After Japanese JV2) we are three
partners in THE Alliance:3)
On the back of consolidation, alliances have been
re-shaped with start of operations in April 2017
1) 2M including Hamburg Süd; 2) Subject to regulatory approvals and closing; 3) Total operating capacity of THE alliance partners, not all to be deployed in alliance (Hapag-Lloyd including UASC)
16%
39%
45%
Yang Ming
K-Line, MOL, NYK
Hapag-Lloyd
Source: Alphaliner monthly (February 2017), Drewry (Forecaster 4Q16), MDS Transmodal (January 2017)
2 Market Update
Transpacific
Far East
2
2M1) 49%
Ocean 13%
Others 5%
THE Alliance
33%
2
2M1) 20%
Ocean 42%
Others 9%
THE Alliance
29%
3
2M1) 38%
Ocean 34%
Others 5%
THE Alliance
23%
Atlantic
Strong partner in THE Alliance
12
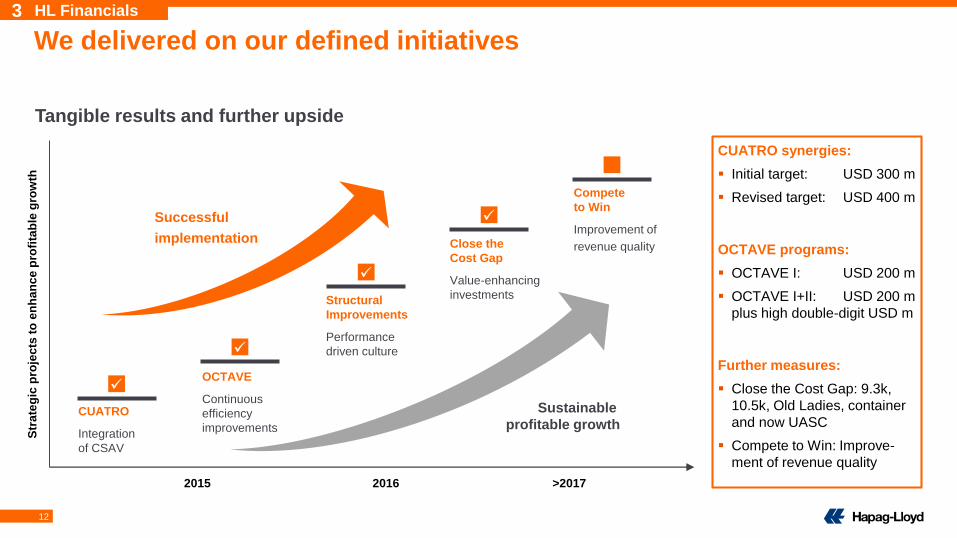
We delivered on our defined initiatives
Tangible results and further upside
CUATRO synergies:
Initial target: USD 300 m
Revised target: USD 400 m
OCTAVE programs:
OCTAVE I: USD 200 m
OCTAVE I+II: USD 200 m
plus high double-digit USD m
Further measures:
Close the Cost Gap: 9.3k,
10.5k, Old Ladies, container
and now UASC
Compete to Win: Improve-
ment of revenue quality
Str
ate
gic
pro
jec
ts t
o e
nh
an
ce
pro
fita
ble
gro
wth
20162015 >2017
Successful
implementation
Sustainable
profitable growth
Compete
to Win
Improvement of
revenue quality
Structural
Improvements
Performance
driven culture
OCTAVE
Continuous
efficiency
improvements
CUATRO
Integration
of CSAV
Close the
Cost Gap
Value-enhancing
investments
3 HL Financials
13
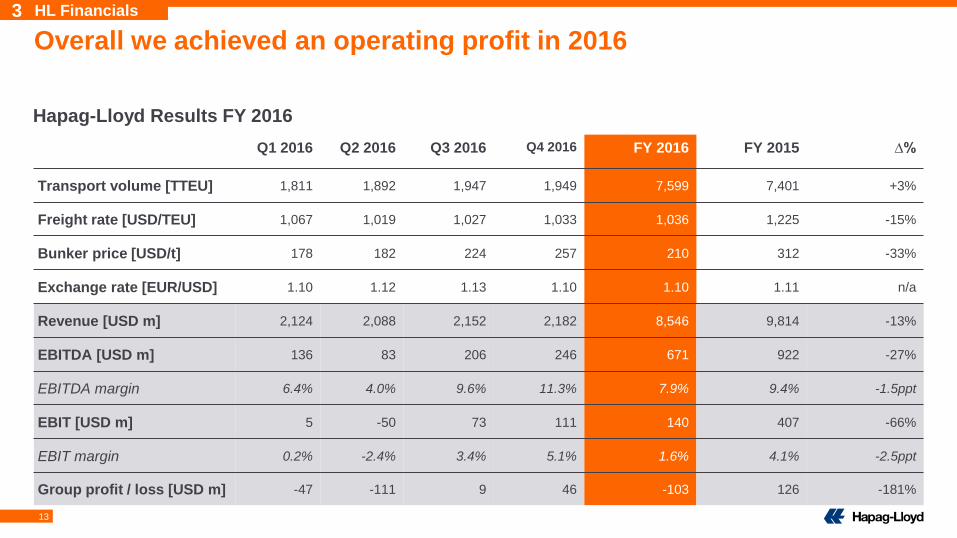
Overall we achieved an operating profit in 2016
Hapag-Lloyd Results FY 2016
Q1 2016 Q2 2016 Q3 2016 Q4 2016 FY 2016 FY 2015 ∆%
Transport volume [TTEU] 1,811 1,892 1,947 1,949 7,599 7,401 +3%
Freight rate [USD/TEU] 1,067 1,019 1,027 1,033 1,036 1,225 -15%
Bunker price [USD/t] 178 182 224 257 210 312 -33%
Exchange rate [EUR/USD] 1.10 1.12 1.13 1.10 1.10 1.11 n/a
Revenue [USD m] 2,124 2,088 2,152 2,182 8,546 9,814 -13%
EBITDA [USD m] 136 83 206 246 671 922 -27%
EBITDA margin 6.4% 4.0% 9.6% 11.3% 7.9% 9.4% -1.5ppt
EBIT [USD m] 5 -50 73 111 140 407 -66%
EBIT margin 0.2% -2.4% 3.4% 5.1% 1.6% 4.1% -2.5ppt
Group profit / loss [USD m] -47 -111 9 46 -103 126 -181%
3 HL Financials
14
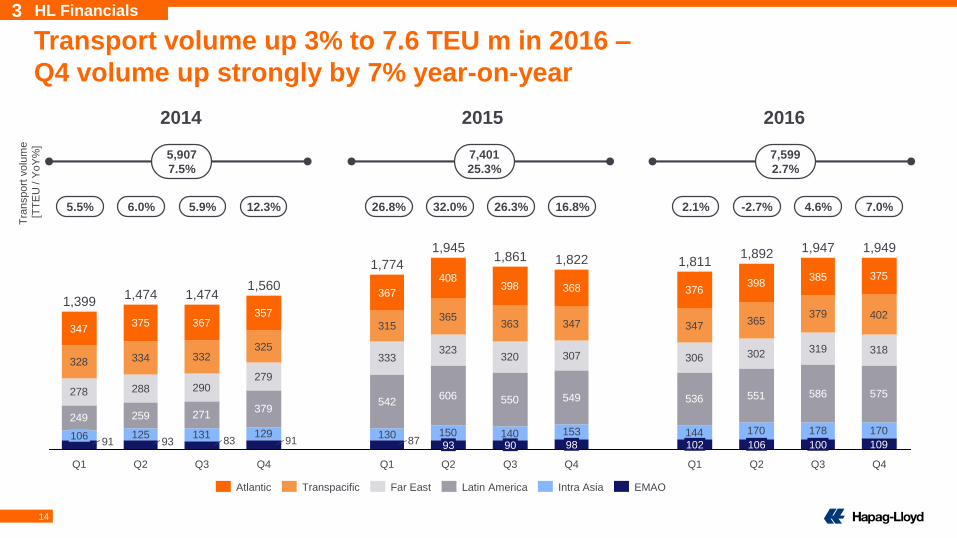
Transport volume up 3% to 7.6 TEU m in 2016 –
Q4 volume up strongly by 7% year-on-year
2014 20162015
125 131 129 130 150 140 153 144 170 178 170
249 259 271379
542606 550 549 536 551 586 575278 288 290
279
333323
320 307 306 302 319 318328 334 332
325
315365
363 347 347 365379 402
347375 367
357
367
408398 368 376
398385 375
1099391 83
Q1
1,811
102
1,474
Q1
1,399
106
Q4
1,822
98
Q3
1,947
100
1,892
106
Q3 Q4 Q2 Q4
1,474
Q2
1,945
93
Q3
1,861
90
Q1
1,774
87
1,560
91
Q2
1,949
Far EastTranspacificAtlantic Intra AsiaLatin America EMAO
5,907
7.5%
7,401
25.3%
7,599
2.7%
3 HL FinancialsT
ransport
volu
me
[TT
EU
/ Y
oY
%]
5.5% 6.0% 5.9% 12.3% 26.8% 32.0% 26.3% 16.8% 2.1% -2.7% 4.6% 7.0%
15
257224
182178245
306317378
525585592595
1,000
1,100
0
800
900
1,100
600
500
700
200
300
400
100900
1,400
1,300
1,500
1,200
800
1,000
-100
1,448
Q3Q2
1,331
Q3
1,189
1,412
Q2Q1
1,4261,422
1,264
Q4 Q1 Q3
1,033
Q4Q2
1,019 1,0271,067
Q1Q4
1,116
2016 average freight rate decreased by 15.4% –
However, rates slowly improve from Q2 lows
Freight rate1) [USD/TEU] vs. bunker price2) [USD/t]
1) Hapag-Lloyd average freight rate for the period 2) Hapag-Lloyd average (MFO) consumption price for the period
Freight rate1,225
312 210
2014 2016
Bunker price
2015
575
1,427 1,036
3 HL Financials
-14.2% -15.4%
-32.6%-45.7%
16
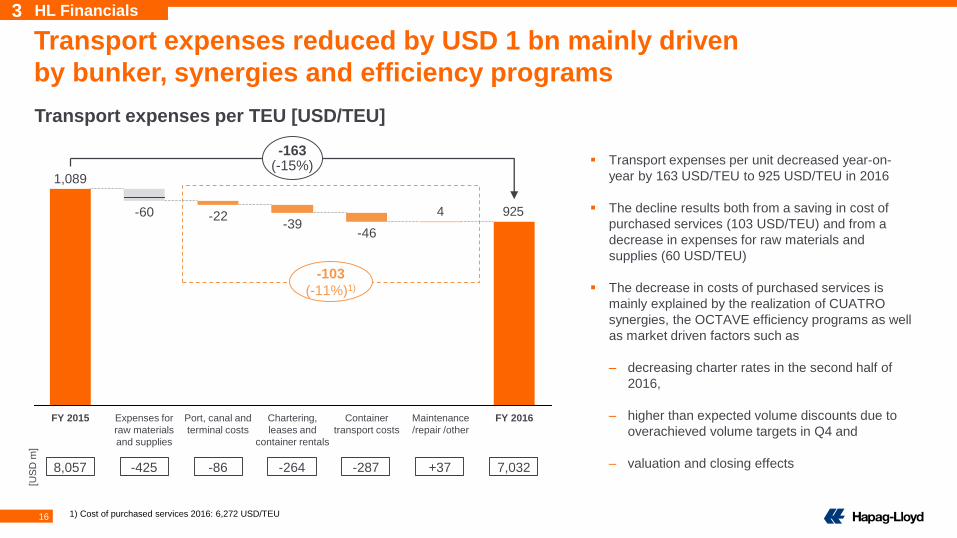
9254
FY 2016
-163(-15%)
1,089
-22
Expenses for
raw materials
and supplies
-60
FY 2015 Container
transport costs
-46
Chartering,
leases and
container rentals
-39
Port, canal and
terminal costs
Maintenance
/repair /other
Transport expenses reduced by USD 1 bn mainly driven
by bunker, synergies and efficiency programs
Transport expenses per TEU [USD/TEU]
-103
(-11%)1)
1) Cost of purchased services 2016: 6,272 USD/TEU
8,057 -425 -86 -264 -287 +37 7,032
[US
D m
]
3 HL Financials
Transport expenses per unit decreased year-on-
year by 163 USD/TEU to 925 USD/TEU in 2016
The decline results both from a saving in cost of
purchased services (103 USD/TEU) and from a
decrease in expenses for raw materials and
supplies (60 USD/TEU)
The decrease in costs of purchased services is
mainly explained by the realization of CUATRO
synergies, the OCTAVE efficiency programs as well
as market driven factors such as
– decreasing charter rates in the second half of
2016,
– higher than expected volume discounts due to
overachieved volume targets in Q4 and
– valuation and closing effects
17
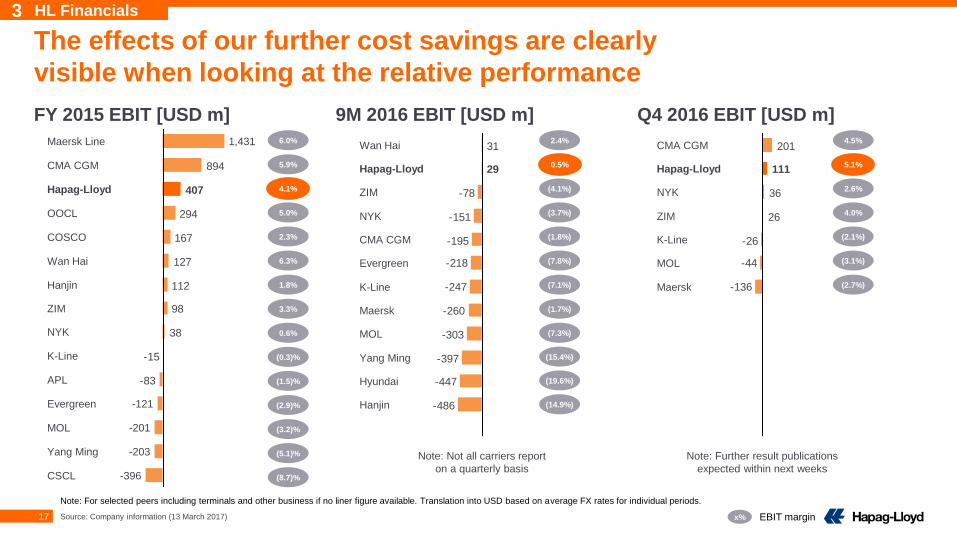
9M 2016 EBIT [USD m] Q4 2016 EBIT [USD m]
EBIT marginx%
-486
-447
-397
-303
-260
-247
-218
-195
-151
-78
31
29
Hanjin
Hyundai
Yang Ming
MOL
Maersk
K-Line
Evergreen
CMA CGM
NYK
ZIM
Hapag-Lloyd
Wan Hai
The effects of our further cost savings are clearly
visible when looking at the relative performance
FY 2015 EBIT [USD m]
6.0%
5.9%
4.1%
1.8%
3.3%
0.6%
(0.3)%
(1.5)%
(5.1)%
2.3%
(8.7)%
5.0%
6.3%
(2.9)%
(3.2)%
2.4%
Note: For selected peers including terminals and other business if no liner figure available. Translation into USD based on average FX rates for individual periods.
-83
-15
38
98
112
127
167
294
894
407
COSCO
OOCL
Hapag-Lloyd
CMA CGM
CSCL
Maersk Line 1,431
-396
Yang Ming -203
MOL -201
Evergreen -121
APL
K-Line
NYK
ZIM
Hanjin
Wan Hai
-136
-44
-26
26
36
111
201
K-Line
MOL
ZIM
Hapag-Lloyd
CMA CGM
NYK
Maersk
0.5%
(4.1%)
3 HL Financials
(3.7%)
(1.8%)
(7.8%)
(7.1%)
(1.7%)
(7.3%)
Source: Company information (13 March 2017)
(15.4%)
(19.6%)
(14.9%)
Note: Further result publications
expected within next weeks
Note: Not all carriers report
on a quarterly basis
4.5%
5.1%
2.6%
4.0%
(2.1%)
(3.1%)
(2.7%)
18
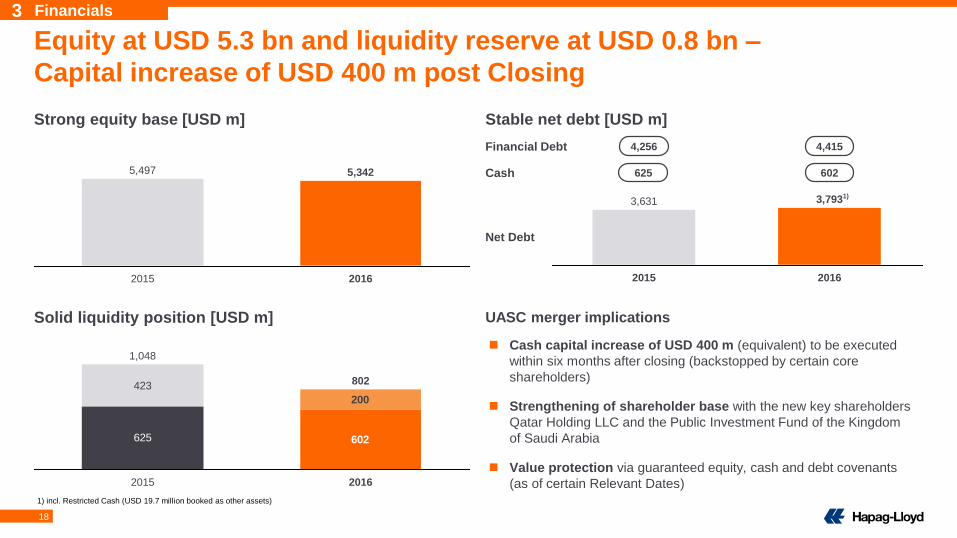
Equity at USD 5.3 bn and liquidity reserve at USD 0.8 bn –
Capital increase of USD 400 m post Closing
Solid liquidity position [USD m]
Strong equity base [USD m]
UASC merger implications
Stable net debt [USD m]
3 Financials
2016
5,342
2015
5,497
3,793
2015
3,631
2016
625
423
602
200
20162015
802
1,048
Cash
Financial Debt
Net Debt
4,415
602625
4,256
1) incl. Restricted Cash (USD 19.7 million booked as other assets)
1)
Cash capital increase of USD 400 m (equivalent) to be executed
within six months after closing (backstopped by certain core
shareholders)
Strengthening of shareholder base with the new key shareholders
Qatar Holding LLC and the Public Investment Fund of the Kingdom
of Saudi Arabia
Value protection via guaranteed equity, cash and debt covenants
(as of certain Relevant Dates)
19
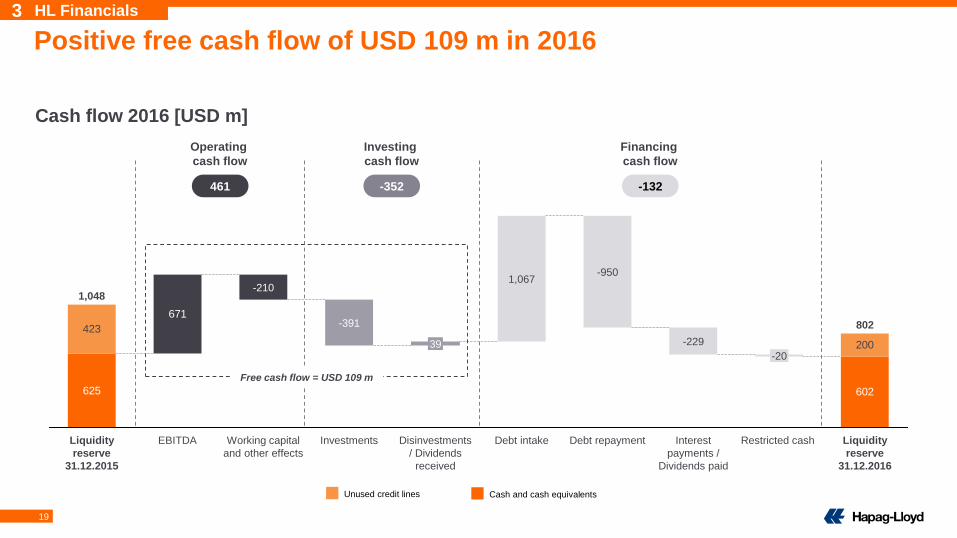
Positive free cash flow of USD 109 m in 2016
Cash flow 2016 [USD m]
602
671
625
200
423
Liquidity
reserve
31.12.2016
802
Restricted cash
-20
Interest
payments /
Dividends paid
-229
Debt repayment
-950
Debt intake
1,067
Disinvestments
/ Dividends
received
39
Investments
-391
Working capital
and other effects
-210
EBITDALiquidity
reserve
31.12.2015
1,048
Operating
cash flow
461 -352
Investing
cash flow
-132
Financing
cash flow
Free cash flow = USD 109 m
Cash and cash equivalentsUnused credit lines
3 HL Financials
20
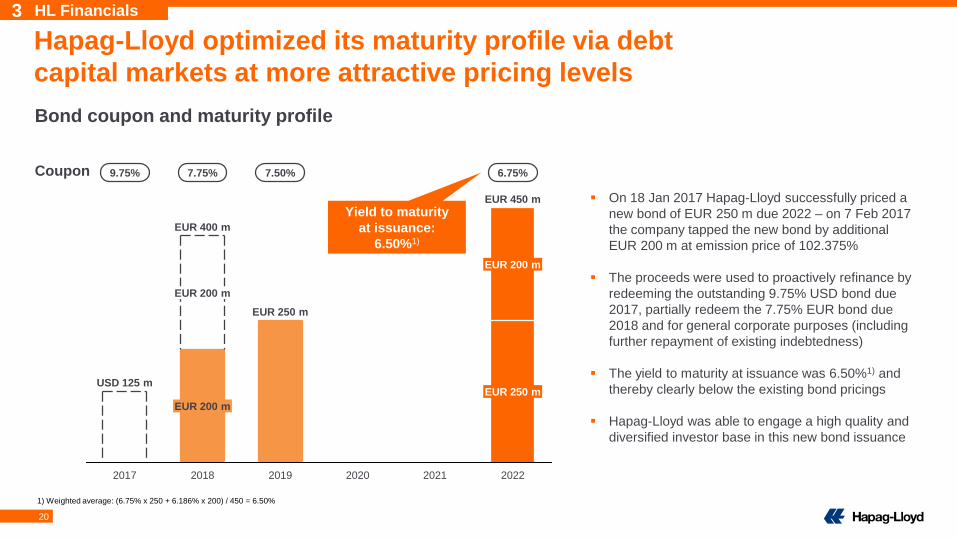
Hapag-Lloyd optimized its maturity profile via debt
capital markets at more attractive pricing levels
202120202019
EUR 250 m
2018
EUR 400 m
EUR 200 m
EUR 200 m
2017
EUR 450 m
2022
USD 125 mEUR 250 m
EUR 200 m
Bond coupon and maturity profile
Coupon 6.75%9.75% 7.75% 7.50%
Yield to maturity
at issuance:
6.50%1)
1) Weighted average: (6.75% x 250 + 6.186% x 200) / 450 = 6.50%
On 18 Jan 2017 Hapag-Lloyd successfully priced a
new bond of EUR 250 m due 2022 – on 7 Feb 2017
the company tapped the new bond by additional
EUR 200 m at emission price of 102.375%
The proceeds were used to proactively refinance by
redeeming the outstanding 9.75% USD bond due
2017, partially redeem the 7.75% EUR bond due
2018 and for general corporate purposes (including
further repayment of existing indebtedness)
The yield to maturity at issuance was 6.50%1) and
thereby clearly below the existing bond pricings
Hapag-Lloyd was able to engage a high quality and
diversified investor base in this new bond issuance
3 HL Financials
21
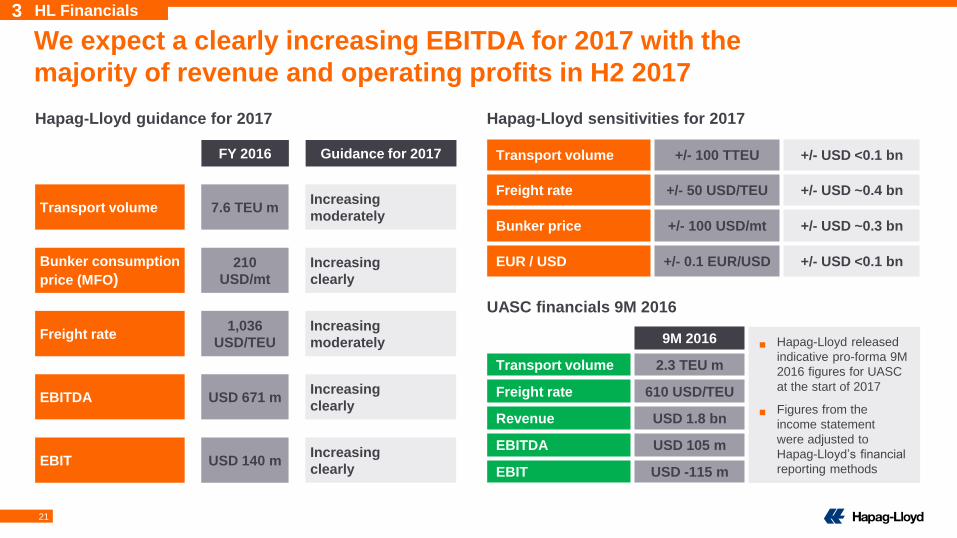
Hapag-Lloyd released
indicative pro-forma 9M
2016 figures for UASC
at the start of 2017
Figures from the
income statement
were adjusted to
Hapag-Lloyd’s financial
reporting methods
We expect a clearly increasing EBITDA for 2017 with the
majority of revenue and operating profits in H2 2017
Hapag-Lloyd guidance for 2017 Hapag-Lloyd sensitivities for 2017
UASC financials 9M 2016
3 HL Financials
Transport volume +/- 100 TTEU +/- USD <0.1 bn
Freight rate +/- 50 USD/TEU +/- USD ~0.4 bn
Bunker price +/- 100 USD/mt +/- USD ~0.3 bn
EUR / USD +/- 0.1 EUR/USD +/- USD <0.1 bn
Transport volumeIncreasing
moderately
Increasing
clearly
Bunker consumption
price (MFO)
Freight rateIncreasing
moderately
EBITDAIncreasing
clearly
EBITIncreasing
clearly
Guidance for 2017
7.6 TEU m
210
USD/mt
1,036
USD/TEU
USD 671 m
USD 140 m
FY 2016
9M 2016
Transport volume 2.3 TEU m
Freight rate 610 USD/TEU
Revenue USD 1.8 bn
EBITDA USD 105 m
EBIT USD -115 m
22
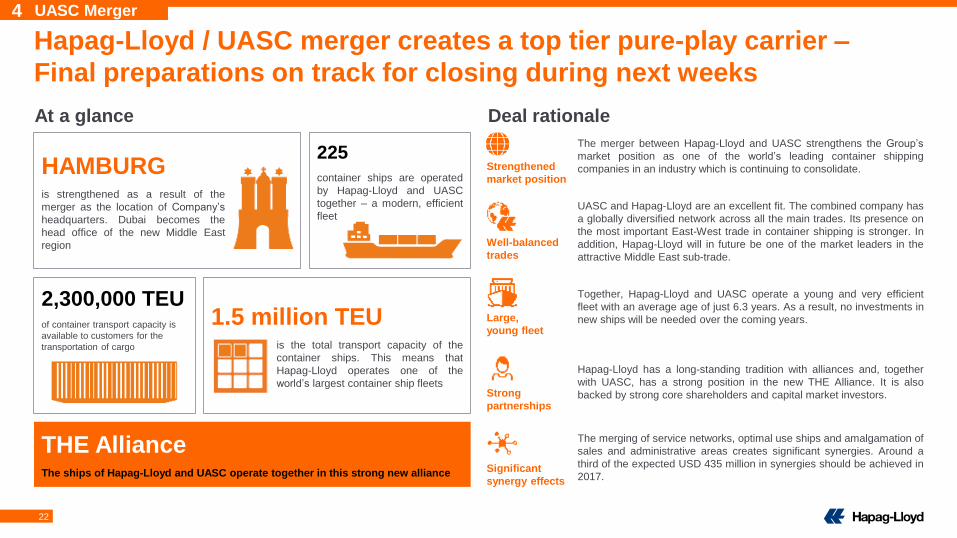
Hapag-Lloyd / UASC merger creates a top tier pure-play carrier –
Final preparations on track for closing during next weeks
The merger between Hapag-Lloyd and UASC strengthens the Group’s
market position as one of the world’s leading container shipping
companies in an industry which is continuing to consolidate.
UASC and Hapag-Lloyd are an excellent fit. The combined company has
a globally diversified network across all the main trades. Its presence on
the most important East-West trade in container shipping is stronger. In
addition, Hapag-Lloyd will in future be one of the market leaders in the
attractive Middle East sub-trade.
Together, Hapag-Lloyd and UASC operate a young and very efficient
fleet with an average age of just 6.3 years. As a result, no investments in
new ships will be needed over the coming years.
Hapag-Lloyd has a long-standing tradition with alliances and, together
with UASC, has a strong position in the new THE Alliance. It is also
backed by strong core shareholders and capital market investors.
The merging of service networks, optimal use ships and amalgamation of
sales and administrative areas creates significant synergies. Around a
third of the expected USD 435 million in synergies should be achieved in
2017.
Strengthened
market position
Well-balanced
trades
Large,
young fleet
Strong
partnerships
Significant
synergy effects
THE AllianceThe ships of Hapag-Lloyd and UASC operate together in this strong new alliance
HAMBURG is strengthened as a result of the
merger as the location of Company’s
headquarters. Dubai becomes the
head office of the new Middle East
region
1.5 million TEUis the total transport capacity of the
container ships. This means that
Hapag-Lloyd operates one of the
world’s largest container ship fleets
4 UASC Merger
225
container ships are operated
by Hapag-Lloyd and UASC
together – a modern, efficient
fleet
Deal rationaleAt a glance
2,300,000 TEUof container transport capacity is
available to customers for the
transportation of cargo
23
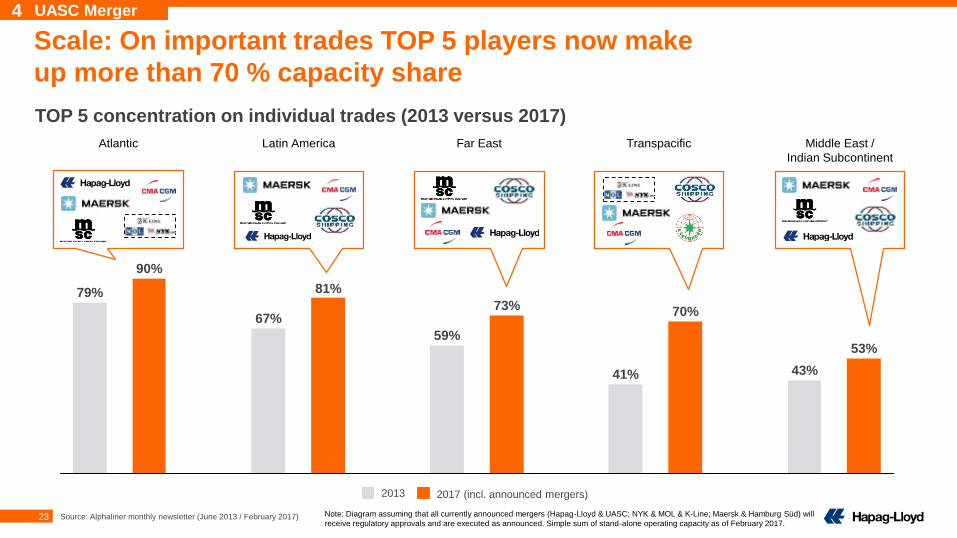
Scale: On important trades TOP 5 players now make
up more than 70 % capacity share
TOP 5 concentration on individual trades (2013 versus 2017)
Note: Diagram assuming that all currently announced mergers (Hapag-Lloyd & UASC; NYK & MOL & K-Line; Maersk & Hamburg Süd) will
receive regulatory approvals and are executed as announced. Simple sum of stand-alone operating capacity as of February 2017.
4 UASC Merger
Source: Alphaliner monthly newsletter (June 2013 / February 2017)
73%
53%
43%41%
70%
59%
79%
90%
81%
67%
2013 2017 (incl. announced mergers)
Atlantic TranspacificFar EastLatin America Middle East /
Indian Subcontinent
24
20%
19%29%
1%
6%
11%
14% 14%
19%
13%
5%
4%
21%
24%
10%5%
7%
30%27%
19%
2%
9%
20%
8%28%
24%
1%10%
23%
13%
24%
20%
3%13%
4%
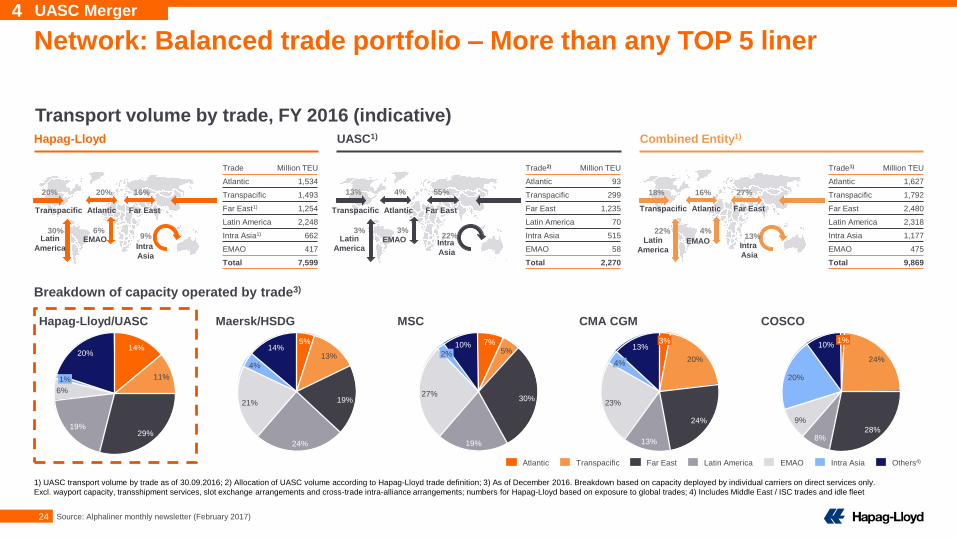
Network: Balanced trade portfolio – More than any TOP 5 liner
Hapag-Lloyd UASC1) Combined Entity1)
Latin America Others4)Intra AsiaEMAOFar EastTranspacificAtlantic
Breakdown of capacity operated by trade3)
Hapag-Lloyd/UASC Maersk/HSDG MSC CMA CGM COSCO
Source: Alphaliner monthly newsletter (February 2017)
Trade Million TEU
Atlantic 1,534
Transpacific 1,493
Far East1) 1,254
Latin America 2,248
Intra Asia1) 662
EMAO 417
Total 7,599
4 UASC Merger
Trade2) Million TEU
Atlantic 93
Transpacific 299
Far East 1,235
Latin America 70
Intra Asia 515
EMAO 58
Total 2,270
Trade1) Million TEU
Atlantic 1,627
Transpacific 1,792
Far East 2,480
Latin America 2,318
Intra Asia 1,177
EMAO 475
Total 9,869
1) UASC transport volume by trade as of 30.09.2016; 2) Allocation of UASC volume according to Hapag-Lloyd trade definition; 3) As of December 2016. Breakdown based on capacity deployed by individual carriers on direct services only.
Excl. wayport capacity, transshipment services, slot exchange arrangements and cross-trade intra-alliance arrangements; numbers for Hapag-Lloyd based on exposure to global trades; 4) Includes Middle East / ISC trades and idle fleet
Transport volume by trade, FY 2016 (indicative)
20% 20%
30% 6%
16%
9%
13% 4%
3% 3%
55%
22%
18% 16%
22% 4%
27%
13%
Transpacific Atlantic Far East Transpacific Atlantic Far East Transpacific Atlantic Far East
Latin
AmericaEMAO
Intra
Asia
Latin
AmericaEMAO Intra
Asia
Latin
AmericaEMAO
Intra
Asia
25
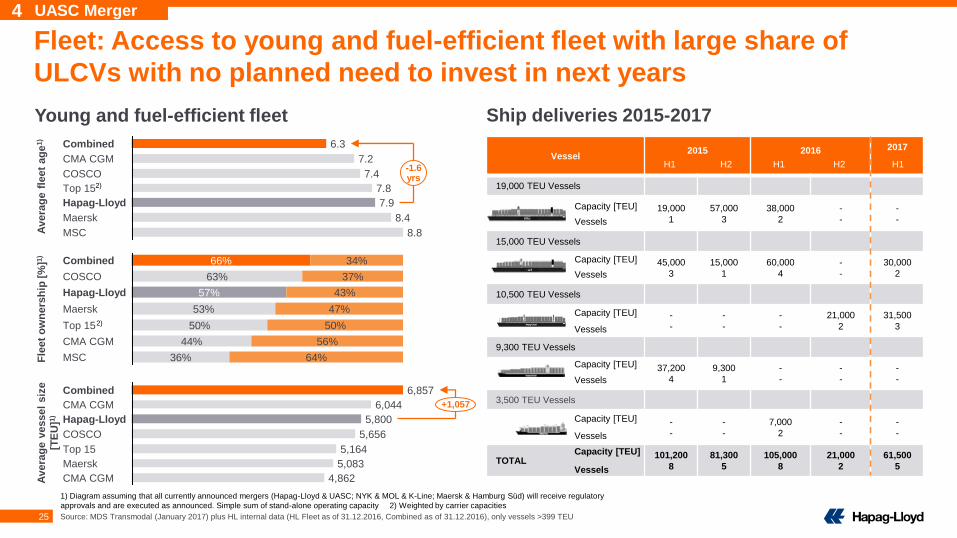
Fleet: Access to young and fuel-efficient fleet with large share of
ULCVs with no planned need to invest in next years
Vessel 2015 2016 2017
19,000 TEU Vessels
19,000
1
57,000
3
38,000
2
-
-
-
-
15,000 TEU Vessels
45,000
3
15,000
1
60,000
4
-
-
30,000
2
10,500 TEU Vessels
-
-
-
-
-
-
21,000
2
31,500
3
9,300 TEU Vessels
37,200
4
9,300
1
-
-
-
-
-
-
3,500 TEU Vessels
-
-
-
-
7,000
2
-
-
-
-
TOTAL 101,200
8
81,300
5
105,000
8
21,000
2
61,500
5
Young and fuel-efficient fleet
Capacity [TEU]
Vessels
Capacity [TEU]
Vessels
Capacity [TEU]
Vessels
Capacity [TEU]
Vessels
Capacity [TEU]
Vessels
Capacity [TEU]
Vessels
H1 H2 H1 H2 H1
4 UASC Merger
7.8
COSCO 7.4
CMA CGM 7.2
Combined 6.3
-1.6yrs
MSC 8.8
Maersk 8.4
Hapag-Lloyd 7.9
Top 15
50%
Maersk 53% 47%
Hapag-Lloyd 57% 43%
COSCO 63% 37%
Combined 66% 34%
MSC 36% 64%
CMA CGM 44% 56%
Top 15 50%
Avera
ge
vessel
siz
e
[TE
U]1
)
Fle
et
ow
ne
rsh
ip [
%]1
)A
vera
ge
fle
et
ag
e1)
5,800
CMA CGM
Hapag-Lloyd
6,044
Combined 6,857
+1,057
4,862
Maersk
CMA CGM
5,083
Top 15
5,656COSCO
5,164
Source: MDS Transmodal (January 2017) plus HL internal data (HL Fleet as of 31.12.2016, Combined as of 31.12.2016), only vessels >399 TEU
1) Diagram assuming that all currently announced mergers (Hapag-Lloyd & UASC; NYK & MOL & K-Line; Maersk & Hamburg Süd) will receive regulatory
approvals and are executed as announced. Simple sum of stand-alone operating capacity 2) Weighted by carrier capacities
2)
2)
Ship deliveries 2015-2017
26
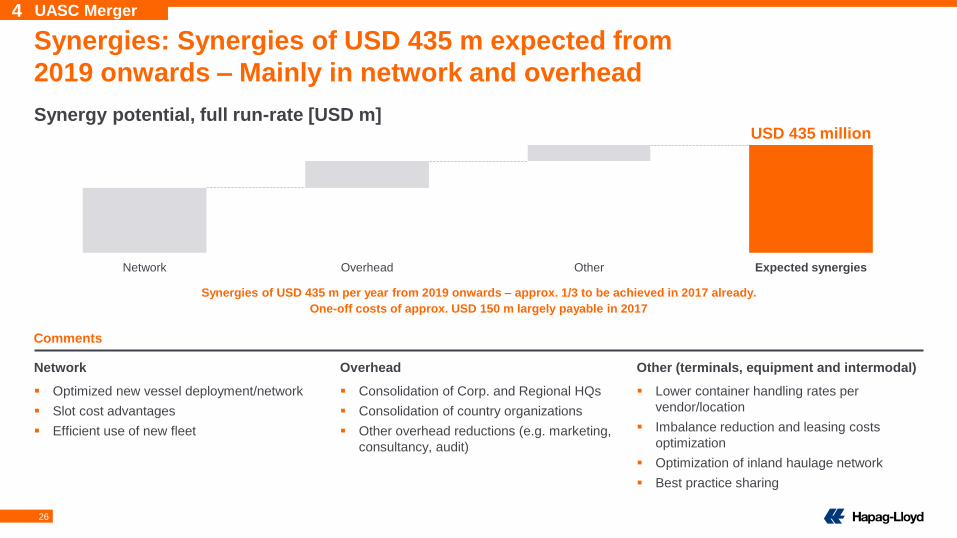
Synergies: Synergies of USD 435 m expected from
2019 onwards – Mainly in network and overhead
Synergy potential, full run-rate [USD m]
Synergies of USD 435 m per year from 2019 onwards – approx. 1/3 to be achieved in 2017 already.
One-off costs of approx. USD 150 m largely payable in 2017
Other
USD 435 million
Expected synergiesOverheadNetwork
Network Overhead Other (terminals, equipment and intermodal)
Optimized new vessel deployment/network
Slot cost advantages
Efficient use of new fleet
Consolidation of Corp. and Regional HQs
Consolidation of country organizations
Other overhead reductions (e.g. marketing,
consultancy, audit)
Lower container handling rates per
vendor/location
Imbalance reduction and leasing costs
optimization
Optimization of inland haulage network
Best practice sharing
4 UASC Merger
Comments
27
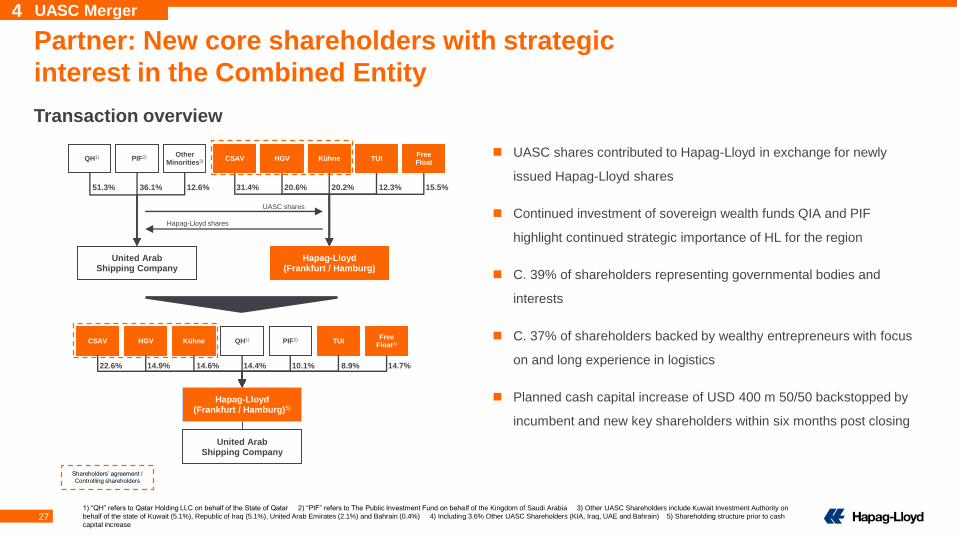
Partner: New core shareholders with strategic
interest in the Combined Entity
Transaction overview
1) “QH” refers to Qatar Holding LLC on behalf of the State of Qatar 2) “PIF” refers to The Public Investment Fund on behalf of the Kingdom of Saudi Arabia 3) Other UASC Shareholders include Kuwait Investment Authority on
behalf of the state of Kuwait (5.1%), Republic of Iraq (5.1%), United Arab Emirates (2.1%) and Bahrain (0.4%) 4) Including 3.6% Other UASC Shareholders (KIA, Iraq, UAE and Bahrain) 5) Shareholding structure prior to cash
capital increase
United Arab Shipping Company
51.3%
QH1)
36.1%
PIF2)
12.6%
OtherMinorities3)
31.4% 20.6% 20.2% 12.3% 15.5%
Hapag-Lloyd(Frankfurt / Hamburg)
CSAV HGV Kühne TUIFreeFloat
UASC shares contributed to Hapag-Lloyd in exchange for newly
issued Hapag-Lloyd shares
Continued investment of sovereign wealth funds QIA and PIF
highlight continued strategic importance of HL for the region
C. 39% of shareholders representing governmental bodies and
interests
C. 37% of shareholders backed by wealthy entrepreneurs with focus
on and long experience in logistics
Planned cash capital increase of USD 400 m 50/50 backstopped by
incumbent and new key shareholders within six months post closing
UASC shares
Hapag-Lloyd shares
CSAV HGV Kühne QH1) PIF2) TUIFree
Float4)
22.6% 14.9% 14.6% 14.4% 10.1%
Hapag-Lloyd(Frankfurt / Hamburg)5)
United Arab Shipping Company
Shareholders’ agreement /
Controlling shareholders
8.9% 14.7%
4 UASC Merger
28
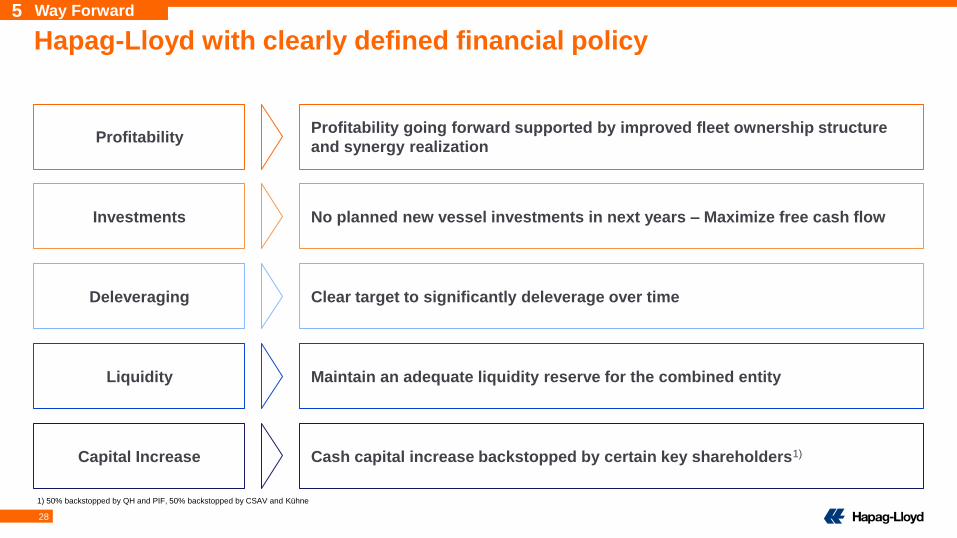
Profitability going forward supported by improved fleet ownership structure
and synergy realizationProfitability
No planned new vessel investments in next years – Maximize free cash flow Investments
Cash capital increase backstopped by certain key shareholders1)Capital Increase
Clear target to significantly deleverage over timeDeleveraging
Maintain an adequate liquidity reserve for the combined entityLiquidity
Hapag-Lloyd with clearly defined financial policy
1) 50% backstopped by QH and PIF, 50% backstopped by CSAV and Kühne
5 Way Forward
29
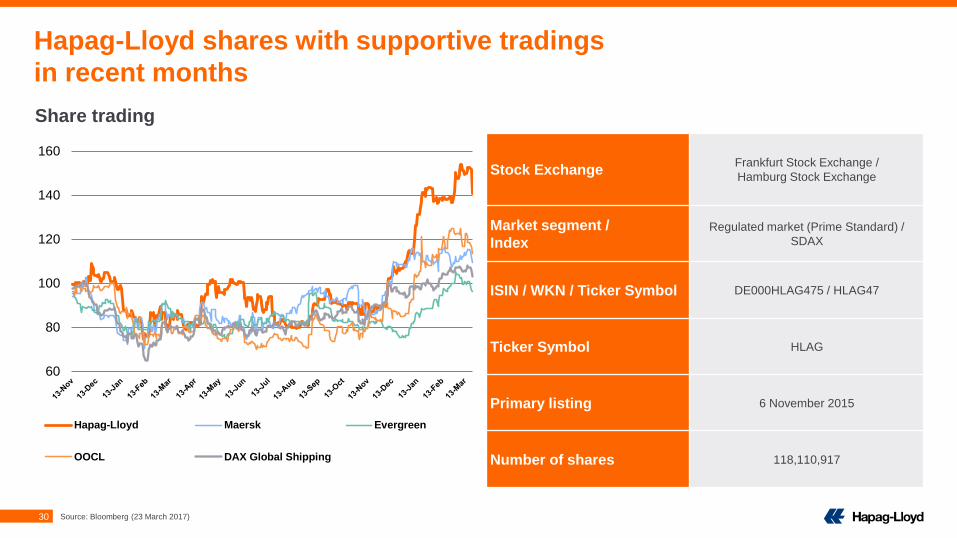
30
Hapag-Lloyd shares with supportive tradings
in recent months
60
80
100
120
140
160
Hapag-Lloyd Maersk Evergreen
OOCL DAX Global Shipping
Stock ExchangeFrankfurt Stock Exchange /
Hamburg Stock Exchange
Market segment /
IndexRegulated market (Prime Standard) /
SDAX
ISIN / WKN / Ticker Symbol DE000HLAG475 / HLAG47
Ticker Symbol HLAG
Primary listing 6 November 2015
Number of shares 118,110,917
Share trading
Source: Bloomberg (23 March 2017)
31
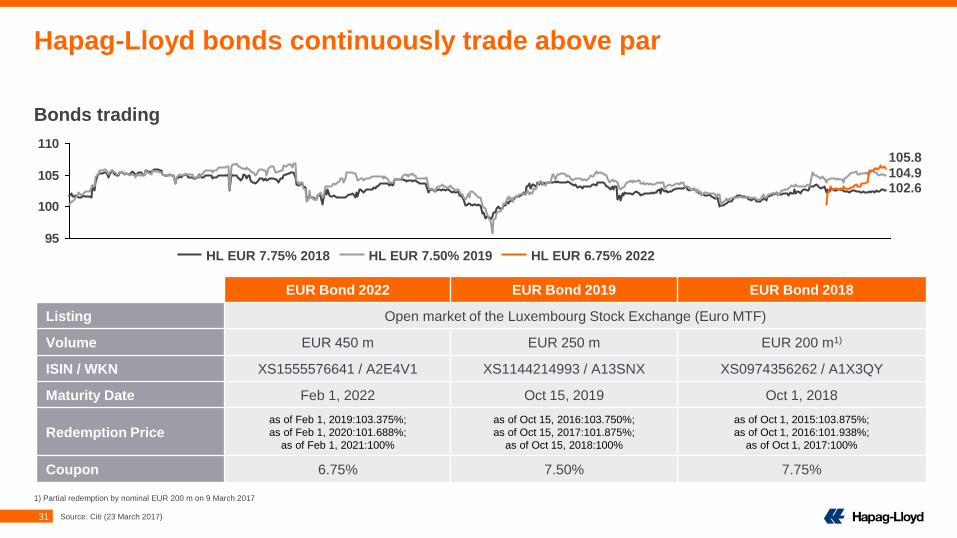
Bonds trading
Hapag-Lloyd bonds continuously trade above par
95
100
105
110
102.6
105.8
104.9
HL EUR 7.50% 2019HL EUR 7.75% 2018 HL EUR 6.75% 2022
EUR Bond 2022 EUR Bond 2019 EUR Bond 2018
Listing Open market of the Luxembourg Stock Exchange (Euro MTF)
Volume EUR 450 m EUR 250 m EUR 200 m1)
ISIN / WKN XS1555576641 / A2E4V1 XS1144214993 / A13SNX XS0974356262 / A1X3QY
Maturity Date Feb 1, 2022 Oct 15, 2019 Oct 1, 2018
Redemption Price as of Feb 1, 2019:103.375%;
as of Feb 1, 2020:101.688%;
as of Feb 1, 2021:100%
as of Oct 15, 2016:103.750%;
as of Oct 15, 2017:101.875%;
as of Oct 15, 2018:100%
as of Oct 1, 2015:103.875%;
as of Oct 1, 2016:101.938%;
as of Oct 1, 2017:100%
Coupon 6.75% 7.50% 7.75%
1) Partial redemption by nominal EUR 200 m on 9 March 2017
Source: Citi (23 March 2017)
32
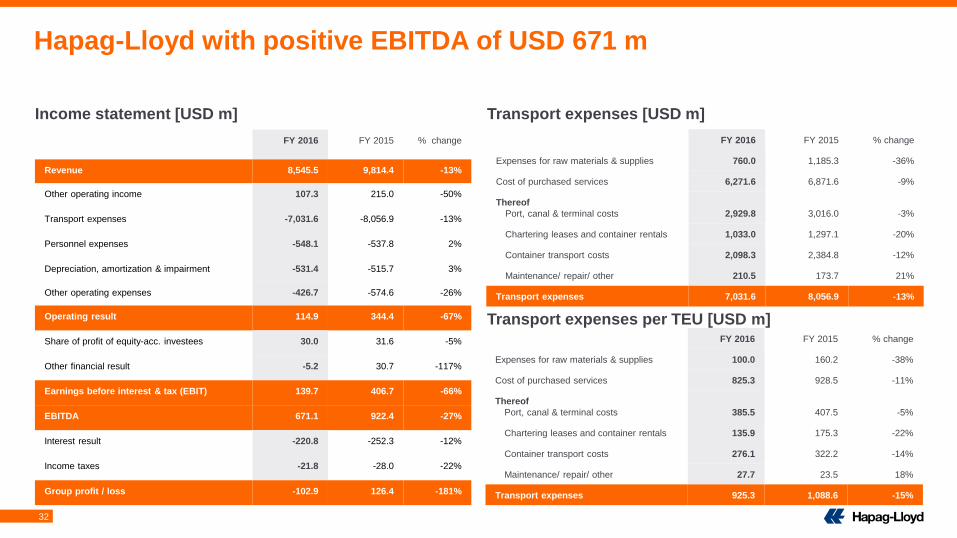
Hapag-Lloyd with positive EBITDA of USD 671 m
Income statement [USD m] Transport expenses [USD m]
FY 2016 FY 2015 % change
Revenue 8,545.5 9,814.4 -13%
Other operating income 107.3 215.0 -50%
Transport expenses -7,031.6 -8,056.9 -13%
Personnel expenses -548.1 -537.8 2%
Depreciation, amortization & impairment -531.4 -515.7 3%
Other operating expenses -426.7 -574.6 -26%
Operating result 114.9 344.4 -67%
Share of profit of equity-acc. investees 30.0 31.6 -5%
Other financial result -5.2 30.7 -117%
Earnings before interest & tax (EBIT) 139.7 406.7 -66%
EBITDA 671.1 922.4 -27%
Interest result -220.8 -252.3 -12%
Income taxes -21.8 -28.0 -22%
Group profit / loss -102.9 126.4 -181%
FY 2016 FY 2015 % change
Expenses for raw materials & supplies 760.0 1,185.3 -36%
Cost of purchased services 6,271.6 6,871.6 -9%
Thereof
Port, canal & terminal costs 2,929.8 3,016.0 -3%
Chartering leases and container rentals 1,033.0 1,297.1 -20%
Container transport costs 2,098.3 2,384.8 -12%
Maintenance/ repair/ other 210.5 173.7 21%
Transport expenses 7,031.6 8,056.9 -13%
Transport expenses per TEU [USD m]FY 2016 FY 2015 % change
Expenses for raw materials & supplies 100.0 160.2 -38%
Cost of purchased services 825.3 928.5 -11%
Thereof
Port, canal & terminal costs 385.5 407.5 -5%
Chartering leases and container rentals 135.9 175.3 -22%
Container transport costs 276.1 322.2 -14%
Maintenance/ repair/ other 27.7 23.5 18%
Transport expenses 925.3 1,088.6 -15%
33
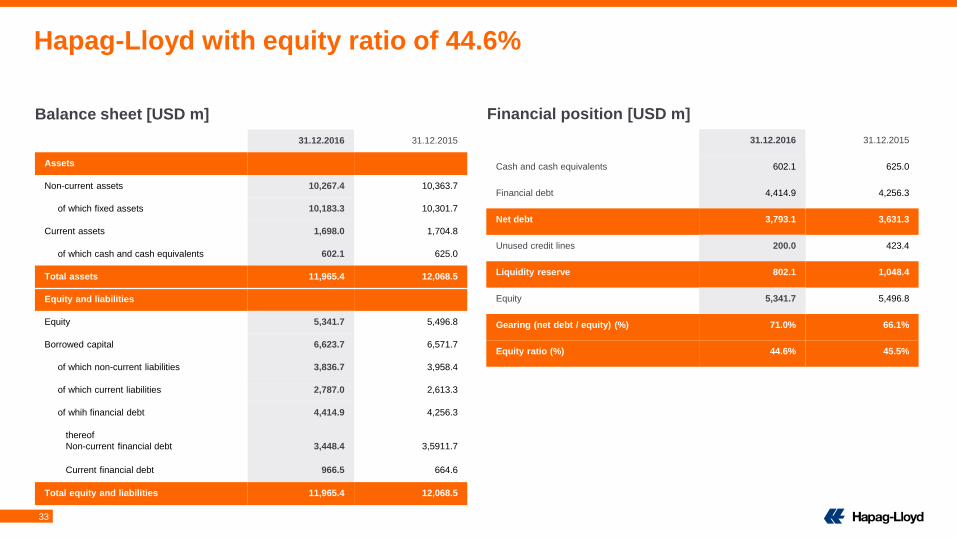
Hapag-Lloyd with equity ratio of 44.6%
Balance sheet [USD m] Financial position [USD m]
31.12.2016 31.12.2015
Assets
Non-current assets 10,267.4 10,363.7
of which fixed assets 10,183.3 10,301.7
Current assets 1,698.0 1,704.8
of which cash and cash equivalents 602.1 625.0
Total assets 11,965.4 12,068.5
Equity and liabilities
Equity 5,341.7 5,496.8
Borrowed capital 6,623.7 6,571.7
of which non-current liabilities 3,836.7 3,958.4
of which current liabilities 2,787.0 2,613.3
of whih financial debt 4,414.9 4,256.3
thereof
Non-current financial debt 3,448.4 3,5911.7
Current financial debt 966.5 664.6
Total equity and liabilities 11,965.4 12,068.5
31.12.2016 31.12.2015
Cash and cash equivalents 602.1 625.0
Financial debt 4,414.9 4,256.3
Net debt 3,793.1 3,631.3
Unused credit lines 200.0 423.4
Liquidity reserve 802.1 1,048.4
Equity 5,341.7 5,496.8
Gearing (net debt / equity) (%) 71.0% 66.1%
Equity ratio (%) 44.6% 45.5%
34
Hapag-Lloyd Investor Relations
Tel +49 40 3001-2896
Fax +49 40 3001-72896
https://www.hapag-lloyd.com/en/ir.html