![INDIA GRID TRUST · Information Memorandum Serial No.:[ ] Investor name: [ ] Private & Confidential For Private Circulation only INDIA GRID TRUST (Registered in the Republic of India](https://static.fdocuments.us/doc/165x107/5f58b4c15fd5466d8c41f7d2/india-grid-trust-information-memorandum-serial-no-investor-name-private.jpg)
Investor Presentation Grid Dynamics
14
trusted engineering partner for digital transformation Grid Dynamics Investor Presentation NASDAQ: GDYN | Q3 2020 www.griddynamics.com 1
Transcript of Investor Presentation Grid Dynamics
trusted engineering partner for digital transformation
Grid DynamicsInvestor PresentationNASDAQ: GDYN | Q3 2020
ww
w.g
riddy
nam
ics.
com
1
Disclaimer
2 Grid Dynamics / Investor Presentation Q3 2020
Forward-Looking StatementsThis communication contains “forward-looking statements” within the meaning of Section 27A of the Securities Act of 1933 and Section 21E of the Securities Exchange Act of 1934 that are not historical facts,and involve risks and uncertainties that could cause actual results of Grid Dynamics to differ materially from those expected and projected. These forward-looking statements can be identified by the use of forward-looking terminology, including the words “believes,” “estimates,” “anticipates,” “expects,” “intends,” “plans,” “may,” “will,” “potential,” “projects,” “predicts,” “continue,” or “should,” or, in each case, their negative or other variations or comparable terminology. These forward-looking statements include, without limitation, statements concerning Grid Dynamics’ expectations with respect to future performance, market size and industry trends. These forward-looking statements involve significant risks and uncertainties that could cause the actual results to differ materially from the expected results. Most of these factors are outside Grid Dynamics’ control and are difficult to predict. Factors that may cause such differences include, but are not limited to: (i) Grid Dynamics has a relatively short operating history and operates in a rapidly evolving industry, which makes it difficult to evaluate future prospects and may increase the risk that it will not continue to be successful; (ii) Grid Dynamics may be unable to effectively manage its growth or achieve anticipated growth, which could place significant strain on Grid Dynamics’ management personnel, systems and resources; (iii) Grid Dynamics’ revenues are highly dependent on a limited number of clients and industries that are affected by seasonal trends, and any decrease in demand for outsourced services in these industries may reduce Grid Dynamics’ revenues and adversely affect Grid Dynamics’ business, financial condition and results of operations; (iv) Grid Dynamics’ revenues are highly dependent on clients primarily located in the United States, and any economic downturn in the United States or disruptions in the credit markets may have a material adverse effect on Grid Dynamics’ business, financial condition and results of operations; (v) Grid Dynamics faces intense and increasing competition; (vii) Grid Dynamics’ failure to successfully attract, hire, develop, motivate and retain highly skilled personnel could materially adversely affect Grid Dynamics’ business, financial condition and results of operations; (viii) failure to adapt to rapidly changing technologies, methodologies and evolving industry standards may have a material adverse effect on Grid Dynamics’ business, financial condition and results of operations; (ix) failure to successfully deliver contracted services or causing disruptions to clients’ businesses may have a material adverse effect on Grid Dynamics’ reputation, business, financial condition and results of operations; (xi) the impact of the COVID-19 pandemic has and may continue to materially adversely affect our stock price, business operations, and overall financial performance; and (xii) other risks and uncertainties as specified in Grid Dynamics’ filings with the SEC, including those under the sections entitled “Risk Factors.” Grid Dynamics cautions that the foregoing list of factors is not exclusive. Grid Dynamics cautions readers not to place undue reliance upon any forward-looking statements, which speak only as of the date made. Grid Dynamics does not undertake any obligation to update any forward-looking statements to reflect any change in its expectations or any change in events, conditions or circumstances on which any such statement is based.
Use of ProjectionsThis presentation contains projections for Grid Dynamics, including with respect to its revenue. Grid Dynamics’ auditors have not audited, reviewed, compiled or performed any procedures with respect to the projections for the purpose of their inclusion in this presentation, and accordingly, have not expressed an opinion or provided any other form of assurance with respect thereto for the purpose of this presentation. These projections are for illustrative purposes only and should not be relied upon as necessarily indicative of future results. In this presentation, certain of the above-mentioned projection information has been repeated for purposes of providing comparisons with historical data. The assumptions and estimates underlying the projected information are inherently uncertain and are subject to a wide variety of significant business, economic and competitive risks and uncertainties that could cause actual results to differ materially from those contained in the projected information. Accordingly, there can be no assurance that the projected results will be indicative of the future performance of Grid Dynamics or that actual results will not differ materially from those presented in the projected information.
Industry and Market DataThis presentation includes market data and other statistical information for sources believed by Grid Dynamics to be reliable, including independent industry publications and other published independent sources. Some data are also based on the good faith estimates of Grid Dynamics, which are derived from their review of internal sources as well as the independent sources described above. Although Grid Dynamics believe these sources are reliable, they have not independently verified the information and cannot guarantee its accuracy and completeness.
Non-GAAP Financial MeasuresIn this presentation, Grid Dynamics supplements results reported in accordance with United States generally accepted accounting principles, referred to as GAAP, with non-GAAP financial measures, including Adjusted EBITDA, non-GAAP Net Income, Non-GAAP Gross Profit, and non-GAAP Earnings Per Share. Management believes these measures help illustrate underlying trends in Grid Dynamics’ business and uses the measures to establish budgets and operational goals, communicate internally and externally, for managing its business and evaluating its performance, including in comparison to prior periods. Adjusted EBITDA is defined as Earnings Before Interest, Taxes, Depreciation and Amortization, and excludes transaction expenses, stock-based compensation expenses, retention bonuses, and restructuring charges. Adjusted EBITDA is not a measure of financial performance under GAAP and should not be considered as an alternative to, or more meaningful than, income from operations as a measure of operating performance or to cash flows from operating, investing or financing activities or as a measure of liquidity. Reconciliations of the differences between the non-GAAP measures to the comparable GAAP financial measures are included in this presentation. Grid Dynamics anticipates that it will continue to report certain non-GAAP financial measures in its financial results, including non-GAAP results that exclude stock-based compensation expense, acquisition-related charges, impairment of goodwill, amortization of certain intangible assets, retention bonuses, restructuring charges, items related to one-time charges and benefits, gains and losses related to foreign exchange, and the tax impact of any such pre-tax adjustments. Because these non-GAAP financial measures are not calculated in accordance with GAAP, these measures are not comparable to GAAP and may not be comparable to similarly described non-GAAP measures reported by other companies within Grid Dynamics’ industry. Consequently, Grid Dynamics’ non-GAAP financial measures should not be evaluated in isolation or supplant comparable GAAP measures, but should be considered together with the information in Grid Dynamics’ consolidated financial statements, which are prepared in accordance with GAAP.
NASDAQ: GDYN © 2020 Grid Dynamics Holdings, Inc. All Rights Reserved.

About Grid Dynamics
3 Grid Dynamics / Investor Presentation Q3 2020NASDAQ: GDYN © 2020 Grid Dynamics Holdings, Inc. All Rights Reserved.
EMPLOYEES
1200+
FY 2019 REVENUE (M)
$118.3
CASH
$126.5 M
DILUTED SHARES *
49.7 M
Q3 REVENUE (M)
$26.3Q3 2020 GAAP/non-GAAP EPS
$(0.02) / $0.05
LOCATIONS
UNITED STATESPOLANDRUSSIASERBIA UKRAINE
NASDAQ CM
GDYNHEADQUARTERS
SAN RAMON, CA, USACEO
LEONARD LIVSCHITZ
* Includes warrants, options and restricted stock units
Digital-native technology services provider that accelerates growth and bolsters competitive advantage for Fortune 1000 companies.
Q4 2020 REVENUE EXPECTATIONS
$27.7 M to $28.7 M

4
History Inception
Established in 2006 in San Ramon, CA as a grid computing consulting company by a founding team from Sun Microsystems, Grid Dynamics has quickly established the reputation of solving the toughest algorithmic challenges the companies had to offer.
Customers such as PayPal, Cisco, and eBay helped Grid Dynamics refine and expand its service portfolio.
Looking to source the top talent for challenging algorithmic tasks, Grid Dynamics turned its gaze east, opening its first offices in CEE through relationships with the alma mater of ACM programming contest champions.
Grid Dynamics / Investor Presentation Q3 2020
2006 2007 2008 2009 2010 2011 2012 2013 2014 2015 2016 2017 2018 2019 2020
Traction
The crisis of 2009 and post-crisis shift to online and mobile spending helped Grid Dynamics see the transformation opportunity in the traditional enterprises. Over the next years, Grid Dynamics became a digital partner of choice for the top retailers in the country. Strong technical underpinnings and deep understanding of the digital operations made Grid Dynamics widely known for its expertise in the emerging cloud and big data spaces.
On average, Grid Dynamics has been adding a new engineering center every two years, quickly becoming an employer of choice due to its engineering-focused culture.
By 2018, Grid Dynamics graduated to become a tier-1 supplier to many Fortune-100 enterprises. With its focus on transformative capabilities of new technologies, platform to deliver end-to-end solutions, and strong financial metrics, leadership had set their sights to the new horizon.
Grid Dynamics became publicly listed on NASDAQ Capital Markets in 2020. With presence in five countries and counting over 1,000 employees generating industry-leading per capita revenues, Grid Dynamics is the newest challenger in the fast-growing digital transformation market.
We are just getting started.
Growth
NASDAQ: GDYN © 2020 Grid Dynamics Holdings, Inc. All Rights Reserved.

The best agileservice providers excel in co-creation, helping clients apply the latest technology to solve their, and their customers’, challenges. 1
1
“
”5 NASDAQ: GDYN © 2020 Grid Dynamics Holdings, Inc. All Rights Reserved. Grid Dynamics / Investor Presentation Q3 2020

High value, high impact services Technical Consulting
Lean Prototypes
Digital IntelligenceDevelopment Culture
Scalable Engineering
Experience DesignProof-of-ConceptFeasibility Lab
Data ScienceArtificial Intelligence
Quality and Security Engineering Agile Development
Continuous Delivery and DevOps
Technology RoadmapsDiscovery Workshops
Web and MobileConversational Interfaces Digital
Innovation
Big Data & Fast DataCloud Computing
Performance Engineering
6 Grid Dynamics / Data Science, AI, and MLPrivileged and confidential

Differentiated and defensible core
Digital commerce expertise
Grid Dynamics’ leadership had decades of experience in driving digital profits through the use of technology and data. Our track record in digital retail and technology helped us create an estimated 200B in value for our customers. As more and more industries go through digital transformation, demand for digital skills skyrockets.
Driven by consulting
Unlike most of the industry, we maintain a high proportion of our staff onsite at customer’s premises. This gives us a strong sense of ownership and ability to advise with a deep understanding of the business constraints. Onsite and offshore staff works as a single team, eliminating choke points and execution delays.
Land and expand
Great things start from humble beginnings. Grid Dynamics engages with the customers starting with risky, innovative projects that can only be delivered in close collaboration with the client and enabled by the world’s best technical skills. These initial successes allow us establish the trust and position ourselves as the top partner for digital programs.
Focus on engineering
We believe that a strong engineering core is paramount to adoption of new technology. We hire the top 5% of the already mature markets and maintain a rigorous training program to ensure our technical skills are up to date. Our senior-to-junior ratio is much higher than the industry average and relentless attention on quality results in the lower total cost for the client.
Optimized for innovation
Every process in Grid Dynamics is optimized for time to market and continuous iteration. We have practiced and coached our customers on agile, continuous delivery and DevOps since the inception and prioritize results. This stands in stark contrast to traditional outsourcing project management, which attempts to tackle multi-year waterfall planning despite the evidence of its ineffectiveness.
Globally integrated
Whether in US, Poland, Serbia, Ukraine, or Russia, every Grid Dynamics team member is part of the global system. Every pod is built and managed as distributed from day 1 and every engineer is ready to switch to remote mode at the drop of a hat. Everyone speaks the same language and shares in the same set of cultural values. In many of our global locations, Grid Dynamics is the top employment choice.
7 Grid Dynamics / Investor Presentation Q3 2020NASDAQ: GDYN © 2020 Grid Dynamics Holdings, Inc. All Rights Reserved.
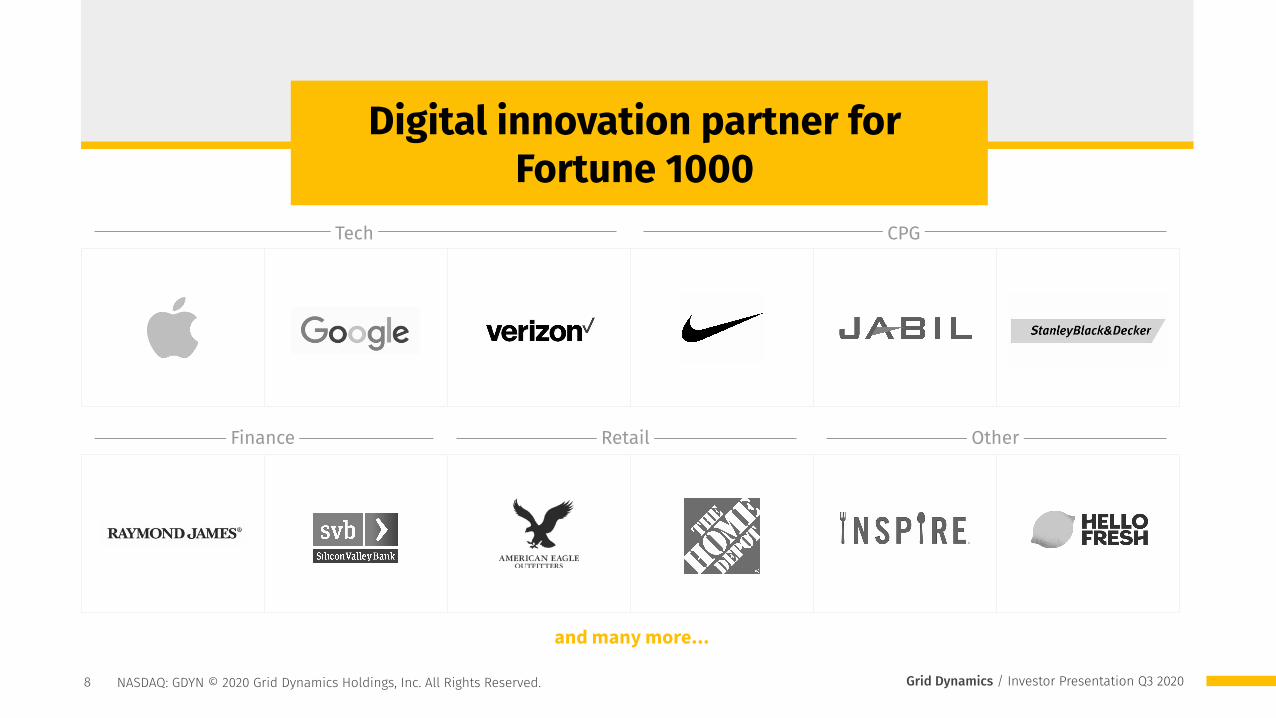
Digital innovation partner for Fortune 1000
and many more...
.Tech. .CPG.
.Finance. .Retail. .Other.
8 Grid Dynamics / Investor Presentation Q3 2020NASDAQ: GDYN © 2020 Grid Dynamics Holdings, Inc. All Rights Reserved.

Americas Europe
San FranciscoBay Area Plano
Frisco
New YorkChicago
St. Petersburg
SaratovKharkivLviv
Belgrade
KyivWroclaw
Krakow
Other client offices
Grid Dynamics technical staff
Warsaw
Engineering offices in USA & Europe
Offshore centers
Plano, TX (2018)
San Ramon, CA (2006)Headquarters and the center of operations for SF Bay Area.
● Seattle● Portland● Boise● Chicago● Milwaukee● New York● Pittsburgh● Baltimore● Atlanta● St Petersburg● Austin
Serbia
Poland
■ Belgrade (2018)
■ Krakow (2015)■ Warsaw (2019)■ Wroclaw (2019)
Ukraine■ Kyiv (2018)■ Lviv (2016)■ Kharkiv (2009)
■ Saratov (2006)Oldest Grid Dynamics office
■ St Petersburg (2009)
Russia
USA

Revenue Distribution Per Industry In 2020
CPG 12.7%
Q1 2020 Revenue Distribution
Q2 2020 Revenue Distribution
Q3 2020 Revenue Distribution
TMT 31% Retail 49.6% Finance 12.4%
CPG 6.7%
10 Grid Dynamics / Investor Presentation Q3 2020NASDAQ: GDYN © 2020 Grid Dynamics Holdings, Inc. All Rights Reserved.
TMT 53.5% Retail 17.9% Finance 15.7% CPG 11.1%
Other 1.8%
TMT 48% Retail 23.3% Finance 11.7%
Other 4.3%
Other 0.3%

GAAPQ3 2020
Non-GAAPQ3 2020
Revenue $26.3M $26.3M
Q/Q Change 18% 18%
YoY Change (16)% (16)%
Gross Profit $11.2M $11.2M
Gross Margin 42.4% 42.6%
Net Income $(1.1)M $2.5M
% of Revenue (4.2)% 9.5%
EPS $(0.02) $0.05
Diluted Share Count 49.7 49.7
Adj. EBITDA $4.2M
% of Revenue 15.8%
Third Quarter 2020 Results — Key Financial Metrics
Non-GAAP Gross Profit Margin ($M)
Non-GAAP Gross Profit Margin (%)
Revenue ($M)
11 Grid Dynamics / Investor Presentation Q3 2020NASDAQ: GDYN © 2020 Grid Dynamics Holdings, Inc. All Rights Reserved.

Q3 2020
Revenue
29%
$20
$0
$40
$60
$80
$100
$120
$140
$160
$180Top 10 Average Spend
21%
$0
$2
$4
$6
$8
$10
$12
23%
024681012141618
#Clients > $1M
68
1011
15
Adjusted EBITDA 5
22%
$35
$30
$25
$20
$15
$10
$5
$0
2015 2016 2017 2018 2019
Headcount
27%
2015
554
2016
705
2017
808
2018
1144
2019
1430
2015 2016 2017 2018 2019 2015 2016 2017 2018 2019 2015 2016 2017 2018 2019
6 6 6 7 7
Annual Key Metrics (Historical)
Customer concentration
0%
20%
40%
60%
80%
100%
2017 2018 2019
Top 1
Top 5
Top 10
Rest
12 Grid Dynamics / Investor Presentation Q3 2020NASDAQ: GDYN © 2020 Grid Dynamics Holdings, Inc. All Rights Reserved.

Trusted engineering partner for digital transformation
Grid Dynamics Holdings Inc.
5000 Executive Parkway,
Suite 520 / San Ramon, CA
1-646-277-1236
www.griddynamics.com
NASDAQ: GDYN © 2020 Grid Dynamics Holdings, Inc. All Rights Reserved.

1. The Forrester Wave™ — Midsize Agile Software Development Service Providers, Q2 2019 2. Reports and Data — COVID 19 Impact Analysis of Digital Transformation Market
https://www.reportsanddata.com/report-detail/digital-transformation-market3. Gartner, 2015
https://www.gartner.com/en/newsroom/press-releases/2015-08-27-gartner-says-modernization-and-digital-transformation-projects-are-behind-growth-in-enterprise-application-software-market
4. Gartner, 2019https://www.gartner.com/en/newsroom/press-releases/2019-10-23-gartner-says-global-it-spending-to-grow-3point7-percent-in-2020
1. Adj. EBITDA: net income before interest income/expense, provision for income taxes and depreciation and amortization, and further adjusted for the impact of stock-based compensation expense, transaction-related costs (which include, when applicable, professional fees, retention bonuses, and consulting, legal and advisory costs related to Grid Dynamics’ merger and acquisition and capital-raising activities), impairment of goodwill and other income/expenses, net (which includes mainly interest income and expense, foreign currency transaction losses and gains, fair value adjustments and other miscellaneous expenses).
1. 2015 and 2016 not audited under PCAOB standard
1. 2017, 2018, and 2019 audited and upgraded to PCAOB standard
Cover slide photo by Marten Bjork, https://unsplash.com/photos/j0Da0mEplnY
Footnotes
14 Grid Dynamics / Investor Presentation Q3 2020NASDAQ: GDYN © 2020 Grid Dynamics Holdings, Inc. All Rights Reserved.