Investor Presentation for the January 2019 (23rd) Period ...
44
[Security Code] 3249 Investor Presentation for the January 2019 (23rd) Period ~Appendix~
Transcript of Investor Presentation for the January 2019 (23rd) Period ...

[Security Code] 3249
Investor Presentationfor the January 2019 (23rd) Period~Appendix~
Our Portfolio (As of January 31, 2019)
1
GreaterTokyo Area
61.2%JPY323,919
mn
Asset Size
By Asset Category By Area (Reference)Regional Share of Japanese GDP
~Appendix~Portfolio Data and Other Materials
Logistics55.5%
Manufacturing and R&D17.7%
Infrastructure26.8%
(Note) Based on appraisal price
Greater NagoyaArea(Note3)
1.2%
Greater OsakaArea(Note2)
24.2% Greater TokyoArea (Note1)
61.2%
Other Areas(Note4)
13.3%
(Note) Based on appraisal price (Note) Cabinet Office, Japan, Annual Report on Prefectural Accounts for FY 2015 (released on August 31, 2018)
Hokkaido / Tohoku11.3%
Kanto40.9%
Chubu15.6%
Kinki15.2%
Chugoku 5.5%Shikoku 2.6%
Kyushu 9.0%
(Note1) Greater Tokyo Area includes Tokyo Metropolitan area and Kanagawa, Chiba and Saitama prefectures.(Note2) Greater Osaka Area includes Shiga, Kyoto, Osaka, Hyogo, Nara and Wakayama prefectures.(Note3) Greater Nagoya Area includes Aichi, Mie and Gifu prefectures.(Note4) Other Areas are areas other than Greater Tokyo Area, Greater Osaka Area and Greater Nagoya Area.

IIF HitachinakaPort Logistics Center(land with leasehold interest)
Our Portfolio (As of January 31, 2019)
2
~Appendix~Portfolio Data and Other Materials
(1) Greater Tokyo Area includes Tokyo Metropolitan area and Kanagawa, Chiba and Saitama prefectures.(2) Greater Osaka Area includes Shiga, Kyoto, Osaka, Hyogo, Nara and Wakayama prefectures.(3) Greater Nagoya Area includes Aichi, Mie and Gifu prefectures.(4) Other Areas are areas other than Greater Tokyo Area, Greater Osaka Area and Greater Nagoya Area.
L-9
L-33
IIF Atsugi Logistics Center
L-6
IIF Yokosuka Technology Center
F-11
IIF InzaiLogistics Center
L-23
IIF KamataR&D Center
F-5
IIF AtsugiLogistics Center III
L-15
IIF Ota Logistics Center
L-38
IIF Fukuoka Koga Vehicle Logistics Center(land with leasehold interest)
IIF KakegawaManufacturing Center(land with leasehold interest)
F-9
IIF Shinagawa IT Solution Center
I-8
IIF ShinonomeLogistics Center
L-1
IIF Kashiwa Logistics Center
L-19
IIF Nagoya Logistics Center
L-14
F-7
IIF SagamiharaR&D Center
IIF NodaLogistics Center
L-4
IIF MisatoLogistics Center
L-20
F-8
IIF Yokohama Shinyamashita R&D Center
I-7
IIF Nagoya Port Tank Terminal (land with leasehold interest)
IIF KoshigayaLogistics Center
L-7
IIF KazoLogistics Center
L-32
IIF Shonan Technology Center
F-12
IIF SaitamaLogistics Center
L-13
IIF MitakaCard Center
F-3
IIF Sendai Taiwa Logistics Center
L-37
IIF Hiroshima Logistics Center
L-25
IIF Shinagawa Data Center
I-4
IIF KawasakiScience Center
F-6
IIF KawaguchiLogistics Center
L-16
IIF Morioka Logistics Center II
L-41
IIF Fukuoka Higashi Logistics Center
L-30
IIF Hiroshima Manufacturing Center(land with leaseholdinterest)
IIF Higashimatsuyama Gas Tank Maintenance Center (land with leasehold interest)
I-9
F-13
IIF ShinsunaLogistics Center
L-5
F-10
IIF UrayasuMachinery MaintenanceCenter(land with leaseholdinterest)
IIF IrumaLogistics Center
L-21
IIF Osaka Toyonaka Data Center
I-5
IIF Osaka NankoIT Solution Center
I-6
IIF Kobe District Heating and Cooling Center
I-1
IIF Yokohama Tsuzuki Logistics Center
L-12
IIF Fukuoka HakozakiLogistics Center II
L-35
IIF Morioka Logistics Center
L-24
F-2
IIF Yokohama Tsuzuki Technology Center
IIF ZamaIT Solution Center
I-3
L-10
IIF NarashinoLogistics Center II
IIF Itabashi Logistics Center
L-36
IIF Atsugi Manufacturing Center(land with leasehold interest)
F-15
IIF Atsugi Logistics Center II
L-11
IIF TosuLogistics Center
L-22
IIF Fukuoka HakozakiLogistics Center I
L-34
IIF Sapporo Logistics Center
IIF TotsukaTechnology Center(land with leasehold interest)
IIF Haneda Airport Maintenance Center
I-2
L-42
F-1
IIF NarashinoLogistics Center(land with leasehold interest)
IIF HamuraLogistics Center
IIF Totsuka Manufacturing Center(land with leasehold interest)
F-14
IIF Kobe Logistics Center
L-17
IIF Higashi-Osaka Logistics Center
L-18
IIF Nishinomiya Logistics Center
L-8
IIF IzumisanoFood Processing and Logistics Center
L-27
IIF Izumiotsu e-shop Logistics Center(land with leasehold interest)
L-26
IIF Osaka Suminoe Logistics Center I
L-39
IIF Kobe NishiLogistics Center(land with leasehold interest)
L-45
IIF Osaka Suminoe Logistics Center II
L-40
IIF Osaka Konohana Logistics Center
L-31
L-28
IIF Kyotanabe Logistics Center
Logistics: 13 properties, Manufacturing/R&D: 3 propertyOther Area(4) 16 properties
Logistics: 19 properties, Manufacturing/R&D: 12 properties, Infrastructure: 5 propertiesGreater Tokyo Area(1) 36 properties
Logistics: 10 properties, Infrastructure: 3 propertiesGreater Osaka Area(2) 13 properties
Logistics: 1 property, Infrastructure: 1 propertyGreater Nagoya Area(3) 2 properties L-44
IIF Koriyama Logistics Center
L-29
L-43
F-16
IIF TsukubaManufacturing Center(land with leaseholdinterest)
NEW

IIF Tsukuba Manufacturing Center (land with leasehold interest)
3
~Appendix~Portfolio Data and Other Materials
Versatility
Long-term Usability
• Medium-term usability secured with the non-cancellable period by April 2023, as specified in the lease contract with the current tenant
• Location within approx. 7.0km distance from Ami-Higashi IC on Ken-O Expressway, within “Tsukuba-no Sato Industrial Park” comprised in Tsukuba International Strategic Zone, allowing for 24-hour operation
• Location close to Ryugasaki New Town and other residential colonies, which means advantage in securing a workforce
• Enhanced potential as a logistics site, underpinned by the new opening of the section of Ken-O Expressway from Sakai-Koga IC to Tsukuba-Chuo IC in February 2017
Tenant IDEC Corporation
Occupancy Rate 100.0%
Lease type Fixed-term leasehold for business purposes
Lease term(Remaining term) (Note2) 30.0 years(29.2 years)
Cancellation before maturity /Rent revision
Not allowed for 5 years / Not allowed in principle
■ Located in the Tsukuba International Strategic Zone where many manufacturer are located
Key PointsAcquired manufacturing facility (land with leasehold interest) with high versatility located in prime area through CRE proposal using cash reserves. The acquisition with NOI yield of 8.3% and unrealized gain ratio of 46.7%, contributing to the growth of dividend per unit and the net asset value.
Acquisition Price 900million
Appraisal Value 1,320million
Unrealized gain (Ratio) (Note1) +420million(+46.7%)NOI Yield 8.3%
NOI Yield after depreciation 8.3%
【Silent Partnership Interest】 OTA Techno CORE
4
~Appendix~Portfolio Data and Other Materials
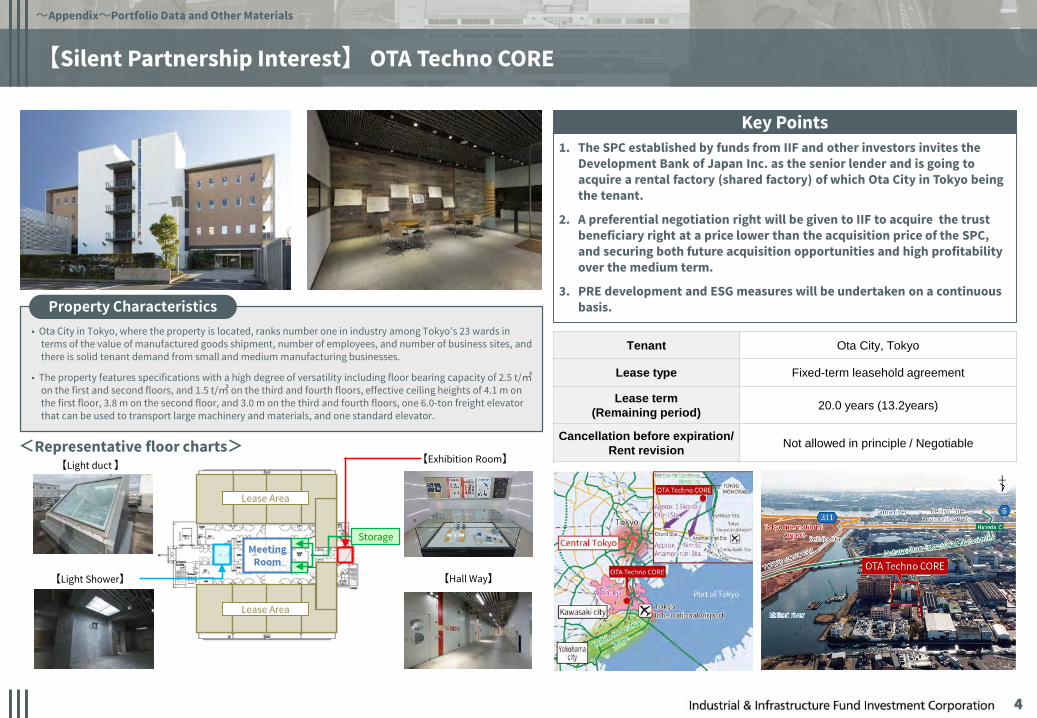
• Ota City in Tokyo, where the property is located, ranks number one in industry among Tokyo’s 23 wards in terms of the value of manufactured goods shipment, number of employees, and number of business sites, and there is solid tenant demand from small and medium manufacturing businesses.
• The property features specifications with a high degree of versatility including floor bearing capacity of 2.5 t/㎡on the first and second floors, and 1.5 t/㎡ on the third and fourth floors, effective ceiling heights of 4.1 m on the first floor, 3.8 m on the second floor, and 3.0 m on the third and fourth floors, one 6.0-ton freight elevator that can be used to transport large machinery and materials, and one standard elevator.
Property Characteristics
Tenant Ota City, Tokyo
Lease type Fixed-term leasehold agreement
Lease term(Remaining period) 20.0 years (13.2years)
Cancellation before expiration/ Rent revision Not allowed in principle / Negotiable
Key Points1. The SPC established by funds from IIF and other investors invites the
Development Bank of Japan Inc. as the senior lender and is going to acquire a rental factory (shared factory) of which Ota City in Tokyo being the tenant.
2. A preferential negotiation right will be given to IIF to acquire the trust beneficiary right at a price lower than the acquisition price of the SPC, and securing both future acquisition opportunities and high profitability over the medium term.
3. PRE development and ESG measures will be undertaken on a continuous basis.
MeetingRoom
【Light duct 】
【Light Shower】
【Exhibition Room】
Storage
Lease Area
【Hall Way】
<Representative floor charts>
Lease Area

【Silent Partnership interest】 OTA Techno CORE (Cont’d (1) )
5
~Appendix~Portfolio Data and Other Materials
Main Options for Future
Acquire thetrust beneficiary right
Continue investment in silent partnership
External sale and redemption
Lower IIF acquisition price with preferential negotiation right
Securing preferential negotiation right that allows IIF to acquire the asset at a lower price than SPC acquisition price
4.77B
4.49B
5.03BAppraisal Value
Investment Horizon
SPC acquisition price
The end of Feb. 2024Expiration of Preferential negotiation right
Price
Preferential negotiation right price
March, 2019
LowerAcquisition Price
Trust beneficiary right in real estate etc.5,050 million yen
Non-recourse debt (senior) 2,200 million yen
Non-recourse debt (mezzanine) 1,200 million yen
Equity interest in Silent Partnership, etc.1,650 million yen
IIFInvestment Amount : 100 million yen
Development Bank of Japan Inc.
Owner: the SPC
IBJ Leasing Company, Ltd.
Tenant: Ota City, Tokyo
Domestic investors with high degrees of public nature such as non-profit organizations including a mutual aid enterprise and educational institutions
SPC Scheme
Scheme involved in stakeholders with high public nature
To consider measures after the investment horizon according to the environment
Exercise preferential negotiation right
Extend the investment horizon of silent partnership
Sell the asset and receive investment redemption
2024
Schedule
2019 January : Execution of silent partnership contract
March : Acquisition of trust beneficiary right by SPC
February : Scheduled end of investment horizon
IIF will secure preferential negotiation right for the asset acquisition from March 1, 2019 to February 29, 2024
February : Implementation of investment in silent partnership
Investment Amount 100 million yen(6.06% of total investment amount in silent partnership)
Expected dividend payout (Note) 7.6%
Investment Horizon 5 years(February 28, 2019 – February 29, 2024)
Special notes IIF to secure preferential negotiation right for the trust beneficiary right
(Note) The expected dividend payout is calculated by dividing (A) the product of (a) the simulated silent partnership interest dividend, which is calculated by deducting (i) simulated expenses such as operating expense of the SPC and the interest of debt from (ii) the first year net revenue with the DCF method as described in the real estate appraisal report prepared by the Japan Real Estate Institute withSeptember 30, 2018 as the appraisal date (If special circumstances are expected in the first year, the second or later year net revenue is used), and (b) IIF’s investment ratio to total silent partnership interest amount (6.06%), by the IIF’s Tokumei Kumiai investment amount. The owner of the property will receive subsidies from Ota City in Tokyo until 2021, and the expected dividend payout is calculated using the net operating income in the first year in which the effects from those subsidies are not present. Further, the anticipated amounts of expenses are reference values calculated by the Asset Manager, and the actual dividend payout may differ greatly from the reference values or dividends may not be paid at all.
【Silent Partnership interest】 OTA Techno CORE (Cont’d (2) )
~Appendix~Portfolio Data and Other Materials
6
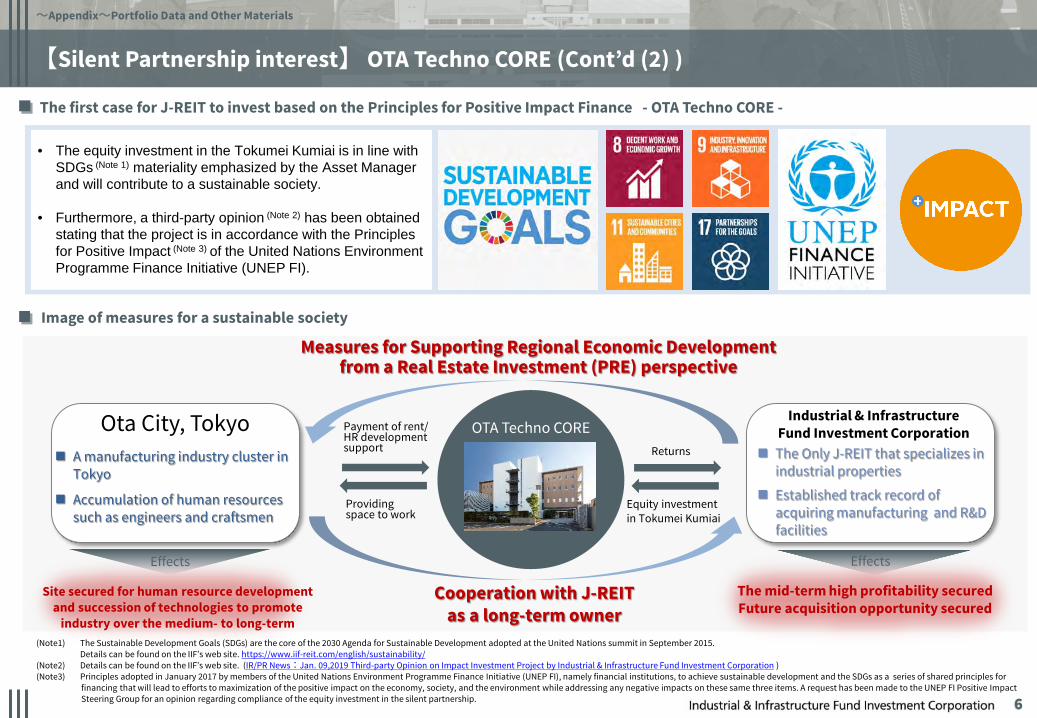
The first case for J-REIT to invest based on the Principles for Positive Impact Finance - OTA Techno CORE -
• The equity investment in the Tokumei Kumiai is in line with SDGs (Note 1) materiality emphasized by the Asset Manager and will contribute to a sustainable society.
• Furthermore, a third-party opinion (Note 2) has been obtained stating that the project is in accordance with the Principles for Positive Impact (Note 3) of the United Nations Environment Programme Finance Initiative (UNEP FI).
OTA Techno CORE
The mid-term high profitability secured Future acquisition opportunity secured
Cooperation with J-REIT as a long-term owner
Equity investment in Tokumei Kumiai
Returns
Providingspace to work
Payment of rent/HR development support The Only J-REIT that specializes in
industrial properties
Established track record of acquiring manufacturing and R&D facilities
Effects Effects
Measures for Supporting Regional Economic Development from a Real Estate Investment (PRE) perspective
A manufacturing industry cluster in Tokyo
Accumulation of human resources such as engineers and craftsmen
Site secured for human resource development and succession of technologies to promote
industry over the medium- to long-term
Ota City, Tokyo Industrial & Infrastructure Fund Investment Corporation
Image of measures for a sustainable society
(Note1) The Sustainable Development Goals (SDGs) are the core of the 2030 Agenda for Sustainable Development adopted at the United Nations summit in September 2015. Details can be found on the IIF’s web site. https://www.iif-reit.com/english/sustainability/
(Note2) Details can be found on the IIF’s web site. (IR/PR News:Jan. 09,2019 Third-party Opinion on Impact Investment Project by Industrial & Infrastructure Fund Investment Corporation )(Note3) Principles adopted in January 2017 by members of the United Nations Environment Programme Finance Initiative (UNEP FI), namely financial institutions, to achieve sustainable development and the SDGs as a series of shared principles for
financing that will lead to efforts to maximization of the positive impact on the economy, society, and the environment while addressing any negative impacts on these same three items. A request has been made to the UNEP FI Positive Impact Steering Group for an opinion regarding compliance of the equity investment in the silent partnership.

Earnings Announcement
Change of Fiscal Period (1)Consider “Expansion of acquisition opportunities” and “Optimal funding timing,” and change fiscal period end to January and July
7
December January February March April
【Current】Fiscal period
Jun - Dec
【After Change】Fiscal period
Jul - Jan
Asset Acquisition
Timing for CRE Activities Period when business
companies make decisions to sell real estate most often
Optimal public offering timing
Optimal public offering timing
Fiscal period end
Peak acquisition period(4th fiscal quarter of business companies)
Typical fiscal period end for business corporates
Earnings Announcement
Change fiscal period end to align public offerings and
prevent missing acquisitions opportunities
If industrial real estate is acquired from business companies from CRE proposals, the seller is likely to reach a decision after its 4th fiscal quarter
Fiscal period end
~Appendix~Portfolio Data and Other Materials

7,990
3,350
28,574
8,700
1,770
14,279
2,280
16,604
1,641
15,160
6,590
690
3,172
1,540
10,597
820
32,530
1,302
23,208
4,940 900
0
5,000
10,000
15,000
20,000
25,000
30,000
35,000
1Q 2Q 3Q 4Q 1Q 2Q 3Q 4Q 1Q 2Q 3Q 4Q 1Q 2Q 3Q 4Q 1Q 2Q 3Q 4Q 1Q 2Q 3Q 4Q 1Q 2Q 3Q 4Q 1Q 2Q 3Q 4Q 1Q
8
Total Acquisition Price(JPY mn.)
Acquisition timing, price and number of property
4Assets
1Asset
5Assets
1Asset
1Asset
5Assets
1Asset
8Assets
1Asset
4Assets
2Assets
1Asset
3Assets
1Asset
3Assets
1Asset
1Asset
10Assets
2011 2012 2013 2014 2015 2016 2017 2018 2019
Announcement Date of Public Offering Feb. 21st Feb. 15th Jan. 16th Jan. 15th Feb. 25th - Jan. 24th Feb. 20th -
Change of Fiscal Period (2)IIF’s acquisitions have concentrated around the first quarter of the year in the past
~Appendix~Portfolio Data and Other Materials
12Assets
1Asset
(Note) IIF Sendai Taiwa Logistics Center (Extension Building) is not included in the figures above.
1Asset

Overview of Temporary Distribution in Excess of Profit (TDEP) ①
9
Temporary distribution in excess of profit
In case deferred losses on hedges or other losses are generated, implement temporary distribution in excess of
profit to lighten (avoid) tax burden
(B) Distributions of allowance for temporary difference adjustment
Treated as distributions, and therefore as dividend income (Note)
Distributions to reduce burden of taxation due to inconsistency between taxation and accounting or deductible equity items
(A)Distribution with decrease of investment capital under tax laws
Treated as redemption of investment capital, and therefore treated as deemed transfer
income (Sometimes partially treated as deemed transfer income)
Distributions funded from depreciation expense and other sources
Temporary distribution in excess of profit possible only when DPU is expected to decrease temporarily due to issuance of
new investment units or other similar causes
Item
Summary
Tax treatment of
distributions
PolicyIntroduced in 2016
Response to Tax Code Reform in 2016
~Appendix~Portfolio Data and Other Materials
(Note) In principle, accounting treatment of distributions received are determined based on purpose of the securities held as shown below. However, it is necessary to independently consult an accountant or tax counsel for the appropriate response. Available for Sale Securities: Treat as Distributions ReceivedOther Classifications: Reduce book value from investment securities
Overview of Temporary Distribution in Excess of Profit ②
10
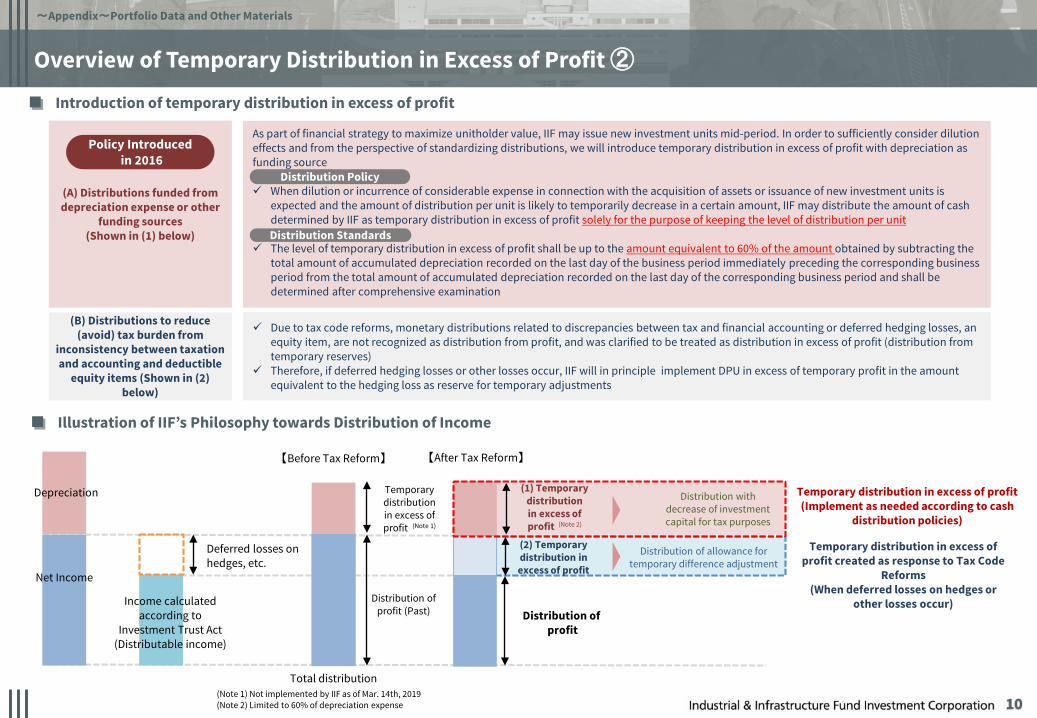
Introduction of temporary distribution in excess of profit
Illustration of IIF’s Philosophy towards Distribution of Income
As part of financial strategy to maximize unitholder value, IIF may issue new investment units mid-period. In order to sufficiently consider dilution effects and from the perspective of standardizing distributions, we will introduce temporary distribution in excess of profit with depreciation as funding source
When dilution or incurrence of considerable expense in connection with the acquisition of assets or issuance of new investment units is expected and the amount of distribution per unit is likely to temporarily decrease in a certain amount, IIF may distribute the amount of cash determined by IIF as temporary distribution in excess of profit solely for the purpose of keeping the level of distribution per unit
The level of temporary distribution in excess of profit shall be up to the amount equivalent to 60% of the amount obtained by subtracting the total amount of accumulated depreciation recorded on the last day of the business period immediately preceding the corresponding business period from the total amount of accumulated depreciation recorded on the last day of the corresponding business period and shall be determined after comprehensive examination
(A) Distributions funded from depreciation expense or other
funding sources(Shown in (1) below)
(B) Distributions to reduce (avoid) tax burden from
inconsistency between taxation and accounting and deductible
equity items (Shown in (2) below)
Due to tax code reforms, monetary distributions related to discrepancies between tax and financial accounting or deferred hedging losses, an equity item, are not recognized as distribution from profit, and was clarified to be treated as distribution in excess of profit (distribution from temporary reserves)
Therefore, if deferred hedging losses or other losses occur, IIF will in principle implement DPU in excess of temporary profit in the amount equivalent to the hedging loss as reserve for temporary adjustments
Distribution Policy
Distribution Standards
Policy Introducedin 2016
(Note 1) Not implemented by IIF as of Mar. 14th, 2019(Note 2) Limited to 60% of depreciation expense
【Before Tax Reform】
Net Income
Income calculated according to
Investment Trust Act(Distributable income)
Total distribution
Deferred losses on hedges, etc.
Distribution ofprofit (Past)
【After Tax Reform】
Distribution of profit
Temporary distribution in excess of profit (Note 1)
Depreciation
(2) Temporary distribution in excess of profit
(1) Temporary distribution in excess of profit (Note 2)
Distribution with decrease of investment capital for tax purposes
Distribution of allowance for temporary difference adjustment
Temporary distribution in excess of profit created as response to Tax Code
Reforms(When deferred losses on hedges or
other losses occur)
Temporary distribution in excess of profit(Implement as needed according to cash
distribution policies)
~Appendix~Portfolio Data and Other Materials

Our Portfolio (1) (As of January 31, 2019)
11
Logistics Facilities
~Appendix~Portfolio Data and Other Materials
Percentage Percentage Percentage
L-1 IIF Shinonome Logistics Center (Note 7) Koto-ku, Tokyo Feb 2006 13.0 years 13,700 5.0% 17,119 5.3% 27,493.29㎡ 1.8% 100.0% 4.6%L-4 IIF Noda Logistics Center Noda-shi, Chiba Mar 2006 12.9 years 6,500 2.4% 9,100 2.8% 38,828.10㎡ 2.6% 100.0% 0.3%L-5 IIF Shinsuna Logistics Center Koto-ku, Tokyo Jun 1998 20.7 years 5,300 1.9% 7,460 2.3% 5,741.75㎡ 0.4% 100.0% 6.4%L-6 IIF Atsugi Logistics Center Atsugi-shi, Kanagawa Jan 2005 14.0 years 2,100 0.8% 2,160 0.7% 10,959.68㎡ 0.7% 100.0% 8.7%L-7 IIF Koshigaya Logistics Center Koshigaya-shi, Saitama Sep 1985 33.4 years 2,000 0.7% 2,780 0.9% 10,113.50㎡ 0.7% 100.0% 2.6%
existing building May 1997 21.7 years 1,300 0.5% 10,608.00㎡ 0.7% 100.0% 9.9%extension building May 2016 2.7 years 859 0.3% 6,592.00㎡ 0.4% 100.0% 6.7%
L-9 IIF Narashino Logistics Center (land with leasehold interest) Narashino-shi, Chiba ― ― 1,190 0.4% 2,810 0.9% 19,834.71㎡ 1.3% 100.0% ―(land with leasehold interest) ― ― 3,350 1.2% 58,070.00㎡ 3.9% 100.0% ―(building with leasehold interest) Apr 1991 27.8 years 1,200 0.4% 25,835.16㎡ 1.7% 100.0% 9.2%
L-11 IIF Atsugi Logistics Center Ⅱ Atsugi-shi, Kanagawa Oct 1992 26.3 years 3,100 1.1% 4,040 1.2% 20,661.13㎡ 1.4% 100.0% 7.6%L-12 IIF Yokohama Tsuzuki Logistics Center Yokohama-shi, Kanagawa Sep 1998 20.4 years 2,350 0.9% 3,280 1.0% 9,464.03㎡ 0.6% 100.0% 8.7%L-13 IIF Saitama Logistics Center Saitama-shi, Saitama Dec 1989 29.1 years 1,490 0.5% 2,130 0.7% 8,995.00㎡ 0.6% 100.0% 4.2%L-14 IIF Nagoya Logistics Center Nagoya-shi, Aichi Apr 1990 28.8 years 1,050 0.4% 1,610 0.5% 8,721.01㎡ 0.6% 100.0% 9.1%L-15 IIF Atsugi Logistics Center Ⅲ Atsugi-shi, Kanagawa Oct 1981 37.3 years 2,290 0.8% 3,130 1.0% 16,584.64㎡ 1.1% 100.0% 7.3%L-16 IIF Kawaguchi Logistics Center Kawaguchi-shi, Saitama Apr 2002 16.8 years 1,770 0.6% 4,380 1.4% 11,705.02㎡ 0.8% 100.0% 10.7%L-17 IIF Kobe Logistics Center Kobe-shi, Hyogo Jan 2001 18.0 years 5,193 1.9% 7,560 2.3% 39,567.74㎡ 2.7% 100.0% 5.5%L-18 IIF Higashi Osaka Logistics Center Higashi Osaka-shi, Osaka Nov 1991 27.2 years 2,280 0.8% 3,240 1.0% 20,495.06㎡ 1.4% 97.3% 9.0%L-19 IIF Kashiwa Logistics Center Kashiwa-shi, Chiba Nov 1990 28.2 years 1,810 0.7% 2,950 0.9% 17,379.78㎡ 1.2% 100.0% 4.4%L-20 IIF Misato Logistics Center Misato-shi, Saitama Feb 2007 12.0 years 3,550 1.3% 5,310 1.6% 19,019.71㎡ 1.3% 100.0% 4.0%L-21 IIF Iruma Logistics Center Iruma-shi, Saitama Dec 2010 8.1 years 3,184 1.2% 4,160 1.3% 17,881.65㎡ 1.2% 100.0% 5.8%L-22 IIF Tosu Logistics Center Tosu-shi, Saga Feb 2007 12.0 years 1,570 0.6% 1,960 0.6% 13,862.05㎡ 0.9% 100.0% 0.8%L-23 IIF Inzai Logistics Center Inzai-shi, Chiba Feb 2007 11.9 years 1,060 0.4% 1,370 0.4% 5,490.00㎡ 0.4% 100.0% 4.7%L-24 IIF Morioka Logistics Center Shiwa-gun, Iwate Aug 2005 13.5 years 600 0.2% 1,220 0.4% 8,001.57㎡ 0.5% 100.0% 1.9%L-25 IIF Hiroshima Logistics Center Hiroshima-shi, Hiroshima Dec 2013 5.1 years 3,540 1.3% 4,500 1.4% 22,768.24㎡ 1.5% 100.0% 4.8%L-26 IIF Izumiotsu e-shop Logistics Center (land with leasehold interest) Izumiotsu-shi, Osaka ― ― 4,000 1.5% 4,420 1.4% 48,932.00㎡ 3.3% 100.0% ―L-27 IIF Izumisano Food Processing and Logistics Center Izumisano-shi, Osaka Oct 1996 22.3 years 860 0.3% 1,090 0.3% 13,947.83㎡ 0.9% 100.0% 12.3%L-28 IIF Kyotanabe Logistics Center Kyotanabe-shi, Kyoto Mar 2007 11.9 years 5,730 2.1% 7,390 2.3% 33,243.99㎡ 2.2% 100.0% 5.6%L-29 IIF Fukuoka Koga Vehicle Logistics Center (land with leasehold interest) Koga-shi, Fukuoka ― ― 860 0.3% 988 0.3% 30,815.97㎡ 2.1% 100.0% ―L-30 IIF Fukuoka Higashi Logistics Center Fukuoka-shi, Fukuoka Jan 1997 22.1 years 1,860 0.7% 2,050 0.6% 11,262.86㎡ 0.8% 100.0% 0.2%L-31 IIF Osaka Konohana Logistics Center Osaka-shi, Osaka Jan 1991 28.1 years 8,700 3.2% 9,580 3.0% 46,262.20㎡ 3.1% 100.0% 9.6%L-32 IIF Kazo Logistics Center Kazo-shi, Saitama Apr 1989 29.8 years 2,361 0.9% 2,760 0.9% 17,744.41㎡ 1.2% 100.0% 8.2%L-33 IIF Hamura Logistics Center Hamura-shi, Tokyo Jul 1991 27.5 years 820 0.3% 928 0.3% 3,892.66㎡ 0.3% 100.0% 4.2%L-34 IIF Fukuoka Hakozaki Logistics Center I Fukuoka-shi, Fukuoka Feb 2008 11.0 years 5,170 1.9% 5,220 1.6% 24,967.58㎡ 1.7% 100.0% 0.4%
existing building Mar 2008 10.9 years 0.2%extension building Feb 2018 0.9 years 0.7%
L-36 IIF Itabashi Logistics Center Itabashi-ku, Tokyo May 2007 11.7 years 1,717 0.6% 1,920 0.6% 5,057.68㎡ 0.3% 100.0% 5.8%L-37 IIF Sendai Taiwa Logistics Center Kurokawa-gun, Miyagi Jan 2006 13.0 years 1,546 0.6% 1,700 0.5% 15,555.15㎡ 1.0% 100.0% 2.4%L-38 IIF Ota Logistics Center Ota-shi, Gunma Feb 2006 12.9 years 1,010 0.4% 1,160 0.4% 6,900.01㎡ 0.5% 100.0% 7.0%L-39 IIF Osaka Suminoe Logistics Center I Osaka-shi, Osaka Mar 2006 12.8 years 12,100 4.4% 14,100 4.4% 52,201.30㎡ 3.5% 100.0% 4.8%L-40 IIF Osaka Suminoe Logistics Center II Osaka-shi, Osaka Jul 1991 27.6 years 2,540 0.9% 2,800 0.9% 12,299.76㎡ 0.8% 100.0% 3.9%L-41 IIF Morioka Logistics Center II Shiwa-gun, Iwate Mar 1997 21.9 years 1,302 0.5% 1,580 0.5% 12,383.30㎡ 0.8% 100.0% 1.7%L-42 IIF Sapporo Logistics Center Sapporo-shi, Hokkaido May 2009 9.7 years 2,480 0.9% 2,610 0.8% 13,064.75㎡ 0.9% 100.0% 2.0%L-43 IIF Hitachinaka Port Logistics Center(land with leasehold interest) Naka-gun, Ibaraki ― ― 1,145 0.4% 1,210 0.4% 20,000.00㎡ 1.3% 100.0% ―L-44 IIF Koriyama Logistics Center Koriyama-shi, Fukushima Oct 2005 13.3 years 2,585 0.9% 3,170 1.0% 17,533.15㎡ 1.2% 100.0% 2.8%L-45 IIF Kobe Nishi Logistics Center(land with leasehold interest) Kobe-shi, Hyogo ― ― 1,960 0.7% 2,180 0.7% 33,000.00㎡ 2.2% 100.0% ―
17.1 years 141,263 51.2% 179,625 55.5% 925,122.74㎡ 62.2% 99.9% ―
IIF Fukuoka Hakozaki Logistics Center II L-35 10,179 3.7% 10,900 3.4% 51,385.32㎡ 3.5% 100.0%Fukuoka-shi, Fukuoka
L-8
IIF Narashino Logistics Center Ⅱ (Note 8) 2.0%
IIF Nishinomiya Logistics Center Nishinomiya-shi, Hyogo
Age of abuilding(Note 2)
Name of Property
L-10 Narashino-shi, Chiba
OccupancyRate
(Note 5)
3,000 0.9%
PropertyNumber
LocationDate
Completed(Note 1)
6,600
Logistics Facilities Total
Total LeasableArea
(Note 4)
PML(Note 6)
AcquisitionPrice
(million yen)
AppraisalValue as of theEnd of Period(million yen)
Percentage Percentage Percentage
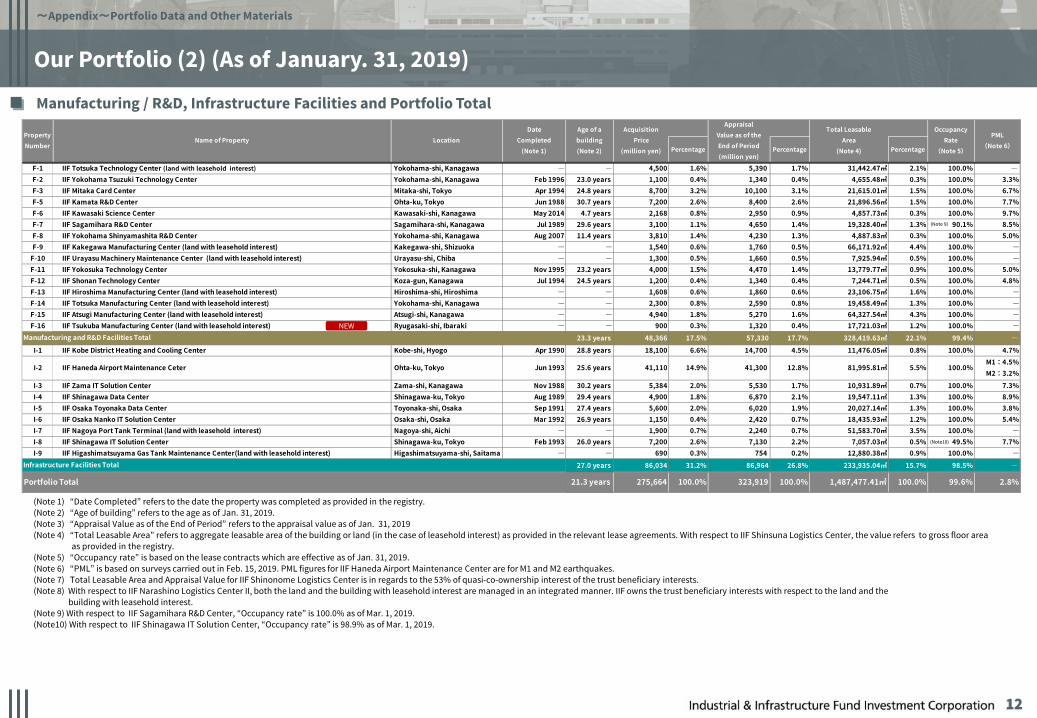
F-1 IIF Totsuka Technology Center (land with leasehold interest) Yokohama-shi, Kanagawa ― ― 4,500 1.6% 5,390 1.7% 31,442.47㎡ 2.1% 100.0% ―F-2 IIF Yokohama Tsuzuki Technology Center Yokohama-shi, Kanagawa Feb 1996 23.0 years 1,100 0.4% 1,340 0.4% 4,655.48㎡ 0.3% 100.0% 3.3%F-3 IIF Mitaka Card Center Mitaka-shi, Tokyo Apr 1994 24.8 years 8,700 3.2% 10,100 3.1% 21,615.01㎡ 1.5% 100.0% 6.7%F-5 IIF Kamata R&D Center Ohta-ku, Tokyo Jun 1988 30.7 years 7,200 2.6% 8,400 2.6% 21,896.56㎡ 1.5% 100.0% 7.7%F-6 IIF Kawasaki Science Center Kawasaki-shi, Kanagawa May 2014 4.7 years 2,168 0.8% 2,950 0.9% 4,857.73㎡ 0.3% 100.0% 9.7%F-7 IIF Sagamihara R&D Center Sagamihara-shi, Kanagawa Jul 1989 29.6 years 3,100 1.1% 4,650 1.4% 19,328.40㎡ 1.3% 90.1% 8.5%F-8 IIF Yokohama Shinyamashita R&D Center Yokohama-shi, Kanagawa Aug 2007 11.4 years 3,810 1.4% 4,230 1.3% 4,887.83㎡ 0.3% 100.0% 5.0%F-9 IIF Kakegawa Manufacturing Center (land with leasehold interest) Kakegawa-shi, Shizuoka ― ― 1,540 0.6% 1,760 0.5% 66,171.92㎡ 4.4% 100.0% ―
F-10 IIF Urayasu Machinery Maintenance Center (land with leasehold interest) Urayasu-shi, Chiba ― ― 1,300 0.5% 1,660 0.5% 7,925.94㎡ 0.5% 100.0% ―F-11 IIF Yokosuka Technology Center Yokosuka-shi, Kanagawa Nov 1995 23.2 years 4,000 1.5% 4,470 1.4% 13,779.77㎡ 0.9% 100.0% 5.0%F-12 IIF Shonan Technology Center Koza-gun, Kanagawa Jul 1994 24.5 years 1,200 0.4% 1,340 0.4% 7,244.71㎡ 0.5% 100.0% 4.8%F-13 IIF Hiroshima Manufacturing Center (land with leasehold interest) Hiroshima-shi, Hiroshima ― ― 1,608 0.6% 1,860 0.6% 23,106.75㎡ 1.6% 100.0% ―F-14 IIF Totsuka Manufacturing Center (land with leasehold interest) Yokohama-shi, Kanagawa ― ― 2,300 0.8% 2,590 0.8% 19,458.49㎡ 1.3% 100.0% ―F-15 IIF Atsugi Manufacturing Center (land with leasehold interest) Atsugi-shi, Kanagawa ― ― 4,940 1.8% 5,270 1.6% 64,327.54㎡ 4.3% 100.0% ―F-16 IIF Tsukuba Manufacturing Center (land with leasehold interest) Ryugasaki-shi, Ibaraki ― ― 900 0.3% 1,320 0.4% 17,721.03㎡ 1.2% 100.0% ―
23.3 years 48,366 17.5% 57,330 17.7% 328,419.63㎡ 22.1% 99.4% ―
I-1 IIF Kobe District Heating and Cooling Center Kobe-shi, Hyogo Apr 1990 28.8 years 18,100 6.6% 14,700 4.5% 11,476.05㎡ 0.8% 100.0% 4.7%
I-2 IIF Haneda Airport Maintenance Ceter Ohta-ku, Tokyo Jun 1993 25.6 years 41,110 14.9% 41,300 12.8% 81,995.81㎡ 5.5% 100.0%M1:4.5%M2:3.2%
I-3 IIF Zama IT Solution Center Zama-shi, Kanagawa Nov 1988 30.2 years 5,384 2.0% 5,530 1.7% 10,931.89㎡ 0.7% 100.0% 7.3%I-4 IIF Shinagawa Data Center Shinagawa-ku, Tokyo Aug 1989 29.4 years 4,900 1.8% 6,870 2.1% 19,547.11㎡ 1.3% 100.0% 8.9%I-5 IIF Osaka Toyonaka Data Center Toyonaka-shi, Osaka Sep 1991 27.4 years 5,600 2.0% 6,020 1.9% 20,027.14㎡ 1.3% 100.0% 3.8%I-6 IIF Osaka Nanko IT Solution Center Osaka-shi, Osaka Mar 1992 26.9 years 1,150 0.4% 2,420 0.7% 18,435.93㎡ 1.2% 100.0% 5.4%I-7 IIF Nagoya Port Tank Terminal (land with leasehold interest) Nagoya-shi, Aichi ― ― 1,900 0.7% 2,240 0.7% 51,583.70㎡ 3.5% 100.0% ―I-8 IIF Shinagawa IT Solution Center Shinagawa-ku, Tokyo Feb 1993 26.0 years 7,200 2.6% 7,130 2.2% 7,057.03㎡ 0.5% 49.5% 7.7%I-9 IIF Higashimatsuyama Gas Tank Maintenance Center(land with leasehold interest) Higashimatsuyama-shi, Saitama ― ― 690 0.3% 754 0.2% 12,880.38㎡ 0.9% 100.0% ―
27.0 years 86,034 31.2% 86,964 26.8% 233,935.04㎡ 15.7% 98.5% ―
21.3 years 275,664 100.0% 323,919 100.0% 1,487,477.41㎡ 100.0% 99.6% 2.8%Portfolio Total
Age of abuilding(Note 2)
Name of Property
Infrastructure Facilities Total
OccupancyRate
(Note 5)
PropertyNumber
LocationDate
Completed(Note 1)
Manufacturing and R&D Facilities Total
Total LeasableArea
(Note 4)
PML(Note 6)
AcquisitionPrice
(million yen)
AppraisalValue as of theEnd of Period(million yen)
Our Portfolio (2) (As of January. 31, 2019)
12
NEW
Manufacturing / R&D, Infrastructure Facilities and Portfolio Total
~Appendix~Portfolio Data and Other Materials
(Note 1) “Date Completed” refers to the date the property was completed as provided in the registry.(Note 2) “Age of building” refers to the age as of Jan. 31, 2019.(Note 3) “Appraisal Value as of the End of Period” refers to the appraisal value as of Jan. 31, 2019 (Note 4) “Total Leasable Area” refers to aggregate leasable area of the building or land (in the case of leasehold interest) as provided in the relevant lease agreements. With respect to IIF Shinsuna Logistics Center, the value refers to gross floor area
as provided in the registry.(Note 5) “Occupancy rate” is based on the lease contracts which are effective as of Jan. 31, 2019.(Note 6) “PML” is based on surveys carried out in Feb. 15, 2019. PML figures for IIF Haneda Airport Maintenance Center are for M1 and M2 earthquakes.(Note 7) Total Leasable Area and Appraisal Value for IIF Shinonome Logistics Center is in regards to the 53% of quasi-co-ownership interest of the trust beneficiary interests.(Note 8) With respect to IIF Narashino Logistics Center II, both the land and the building with leasehold interest are managed in an integrated manner. IIF owns the trust beneficiary interests with respect to the land and the
building with leasehold interest.(Note 9) With respect to IIF Sagamihara R&D Center, “Occupancy rate” is 100.0% as of Mar. 1, 2019.(Note10) With respect to IIF Shinagawa IT Solution Center, “Occupancy rate” is 98.9% as of Mar. 1, 2019.
(Note10)
(Note 9)

Lease Contracts (1) (As of January 31, 2019)
13
Logistics Facilities
~Appendix~Portfolio Data and Other Materials
PropertyNumber
Name of Property Name of Tenants(Note1) No. ofTenants(Note2) Type of Contract
Annual Rent(JPY MM)(Note 3,4)
Percentage(Note5) Lease Term(Note6) Lease Term
Remaining (Note 7)
L-1 IIF Shinonome Logistics Center Sagawa Express Co., Ltd. 1 Fixed-Term Lease 795 4.4% 20.0 years 7.1 years L-4 IIF Noda Logistics Center Mitsubishi Electric Logistics Corporation, etc. 2 Fixed-Term Lease Not Disclosed - 7.5 years 2.2 years L-5 IIF Shinsuna Logistics Center Sagawa Express Co., Ltd. 1 Ordinary Lease 358 2.0% 20.0 years 19.5 years L-6 IIF Atsugi Logistics Center Fuji Logitech Next Co., Ltd. 1 Fixed-Term Lease Not Disclosed - 5.0 years 3.4 years L-7 IIF Koshigaya Logistics Center Kabushikigaisya Tsukasa 1 Fixed-Term Lease 151 0.8% 10.0 years 1.9 years L-8 IIF Nishinomiya Logistics Center Suzuyo Corporation 2 Fixed-Term Lease Not Disclosed - 26.7 years 17.3 years L-9 IIF Narashino Logistics Center (land with leasehold interest) Kajima Leasing Corporation/JA Mitsui Leasing, Ltd. 2 Fixed-Term Lease Not Disclosed - 20.0 years 2.6 years L-10 IIF Narashino Logistics Center II (Note 8) Sapporo Breweries Ltd., etc. 2 Fixed-Term Lease, etc Not Disclosed - 28.0 years 22.0 years L-11 IIF Atsugi Logistics Center Ⅱ Sun Toshi Tatemono Co., Ltd. 1 Ordinary Lease Not Disclosed - 10.0 years 3.6 years L-12 IIF Yokohama Tsuzuki Logistics Center Tokyo Logistics Factory Co., Ltd. 1 Fixed-Term Lease Not Disclosed - 15.0 years 5.2 years L-13 IIF Saitama Logistics Center MM Corporation 1 Fixed-Term Lease 133 0.7% 5.0 years 0.8 years L-14 IIF Nagoya Logistics Center Japan Airways Co., Ltd. 1 Fixed-Term Lease Not Disclosed - 5.0 years 1.0 years L-15 IIF Atsugi Logistics Center Ⅲ Tokyo Logistics Factory Co., Ltd. 1 Fixed-Term Lease Not Disclosed - 5.0 years 3.0 years L-16 IIF Kawaguchi Logistics Center Hitachi Transport System Metropolitan Co., Ltd. 1 Fixed-Term Lease Not Disclosed - 10.0 years 5.4 years L-17 IIF Kobe Logistics Center Nissin Corporation 1 Ordinary Lease Not Disclosed - 11.7 years 5.7 years L-18 IIF Higashi Osaka Logistics Center Settsu Warehouse Co., Ltd., etc. 2 Fixed-Term Lease, etc Not Disclosed - 11.7 years 4.1 years L-19 IIF Kashiwa Logistics Center PIP LOGISTICS CO., LTD. 1 Fixed-Term Lease Not Disclosed - 5.0 years 3.8 years L-20 IIF Misato Logistics Center Takuyo Co., Ltd. 1 Ordinary Lease Not Disclosed - 15.1 years 3.2 years L-21 IIF Iruma Logistics Center Daiichi Freight System Inc. 1 Fixed-Term Lease Not Disclosed - 30.0 years 22.0 years L-22 IIF Tosu Logistics Center Hinode Corporation, etc. 2 Ordinary Lease Not Disclosed - 8.1 years 1.6 years L-23 IIF Inzai Logistics Center Sun Logistics Co., Ltd. 1 Fixed-Term Lease Not Disclosed - 15.0 years 3.2 years L-24 IIF Morioka Logistics Center Nippon Access, Inc. 1 Fixed-Term Lease Not Disclosed - 7.0 years 3.7 years L-25 IIF Hiroshima Logistics Center Muroo Co., Ltd. 1 Fixed-Term Lease Not Disclosed - 15.0 years 9.9 years L-26 IIF Izumiotsu e-shop Logistics Center (land with leasehold interest) Kohnan Shoji Co., Ltd. 1 Fixed-Term Lease Not Disclosed - 20.0 years 5.7 years L-27 IIF Izumisano Food Processing and Logistics Center Nakano Shokai Co., Ltd. 1 Fixed-Term Lease Not Disclosed - 10.0 years 6.2 years L-28 IIF Kyotanabe Logistics Center Takara Butsuryu Inc. 1 Ordinary Lease Not Disclosed - 10.0 years 8.9 years L-29 IIF Fukuoka Koga Vehicle Logistics Center (land with leasehold interest) ORIX Auto Corporation 1 Fixed-Term Lease Not Disclosed - 20.0 years 16.3 years L-30 IIF Fukuoka Higashi Logistics Center Toll Express Japan Co., Ltd. 1 Fixed-Term Lease Not Disclosed - 15.0 years 12.1 years L-31 IIF Osaka Konohana Logistics Center Sagawa Express Co., Ltd. 1 Ordinary Lease Not Disclosed - 36.3 years 8.1 years L-32 IIF Kazo Logistics Center PIP Co., Ltd. 1 Fixed-Term Lease Not Disclosed - 10.0 years 7.1 years L-33 IIF Hamura Logistics Center Coca-Cola Bottlers Japan Inc. 1 Fixed-Term Lease Not Disclosed - 8.0 years 5.7 years L-34 IIF Fukuoka Hakozaki Logistics Center I Fukuoka Soko Co., Ltd. 3 Fixed-Term Lease Not Disclosed - 4.0 years 3.3 years L-35 IIF Fukuoka Hakozaki Logistics Center II (Note9) NTT LOGISCO Inc., etc. 5 Fixed-Term Lease Not Disclosed - 7.9 years 3.4 years L-36 IIF Itabashi Logistics Center Higashi Twenty One Co., Ltd. 1 Ordinary Lease Not Disclosed - 20.0 years 8.3 years L-37 IIF Sendai Taiwa Logistics Center Miyago Logistics Co., Ltd. 1 Ordinary Lease Not Disclosed - 5.0 years 3.9 years L-38 IIF Ota Logistics Center Meitetsu Unyu Co., Ltd. 1 Fixed-Term Lease Not Disclosed - 20.0 years 7.1 years L-39 IIF Osaka Suminoe Logistics Center I Toshiba Logistics Corporation 1 Fixed-Term Lease Not Disclosed - 20.0 years 7.2 years L-40 IIF Osaka Suminoe Logistics Center II Toshiba Logistics Corporation 1 Ordinary Lease Not Disclosed - 1.0 years 0.6 years L-41 IIF Morioka Logistics Center II Miyago Logistics Co., Ltd. 1 Fixed-Term Lease Not Disclosed - 3.0 years 1.2 years L-42 IIF Sapporo Logistics Center Nippon Express Co., Ltd. 1 Fixed-Term Lease Not Disclosed - 7.0 years 5.3 years L-43 IIF Hitachinaka Port Logistics Center (land with leasehold interest) Aono Sangyo Corporation 1 Fixed-Term Lease Not Disclosed - 30.0 years 28.7 years L-44 IIF Koriyama Logistics Center Nichirei Logistics Group Inc. 2 Fixed-Term Lease Not Disclosed - 20.0 years 6.8 years L-45 IIF Kobe Nishi Logistics Center (land with leasehold interest) Kohnan Shoji Co., Ltd. 1 Ordinary Lease Not Disclosed - 20.0 years 19.2 years

PropertyNumber
Name of Property Name of Tenants(Note1) No. ofTenants(Note2) Type of Contract
Annual Rent(JPY MM)(Note 3,4)
Percentage(Note5) Lease Term(Note6) Lease Term
Remaining (Note 7)
F-1 IIF Totsuka Technology Center (land with leasehold interest) Taisei Corporation 1 Fixed-Term Lease 276 1.5% 30.0 years 21.2 years F-2 IIF Yokohama Tsuzuki Technology Center TÜV Rheinland Japan Ltd. 1 Fixed-Term Lease 118 0.7% 22.0 years 11.7 years F-3 IIF Mitaka Card Center JCB Co., Ltd. 1 Ordinary Lease 729 4.1% 18.5 years 2.1 years F-5 IIF Kamata R&D Center Tokyo KEIKI Inc. 1 Fixed-Term Lease Not Disclosed - 14.9 years 7.2 years F-6 IIF Kawasaki Science Center Johnson & Johnson K.K. Medical Company 1 Fixed-Term Lease Not Disclosed - 15.0 years 10.3 years F-7 IIF Sagamihara R&D Center Micron Memory Japan Inc., 2 Ordinary Lease, etc Not Disclosed - 10.0 years 8.8 years F-8 IIF Yokohama Shinyamashita R&D Center TRW Automotive Japan Co., Ltd. 1 Fixed-Term Lease Not Disclosed - 20.0 years 8.6 years F-9 IIF Kakegawa Manufacturing Center (land with leasehold interest) CxS Corporation 1 Fixed-Term Lease Not Disclosed - 30.0 years 26.9 years F-10 IIF Urayasu Machinery Maintenance Center (land with leasehold interest) NISHIO RENT ALL Co., Ltd. 1 Fixed-Term Lease Not Disclosed - 49.0 years 46.2 years F-11 IIF Yokosuka Technology Center Nikon Corporation 1 Ordinary Lease Not Disclosed - 10.0 years 7.6 years F-12 IIF Shonan Technology Center Nikon Corporation 1 Ordinary Lease Not Disclosed - 10.0 years 7.6 years F-13 IIF Hiroshima Manufacturing Center (land with leasehold interest) Metal One Corporation 1 Ordinary Lease Not Disclosed - 20.0 years 18.2 years F-14 IIF Totsuka Manufacturing Center (land with leasehold interest) MITSUIKE CORPORATION 1 Fixed-Term Lease Not Disclosed - 50.0 years 49.1 years
F-15 IIF Atsugi Manufacturing Center (land with leasehold interest) IBJ Leasing 1
(Before the completionof the building)
Lease agreement fortemporary use of land(After the completion
of the building)Fixed-term landlease agreement
Not Disclosed - 31.1 years 30.4 years
F-16 IIF Tsukuba Manufacturing Center (land with leasehold interest) IDEC Corporation 1 Fixed-Term Lease Not Disclosed - 30.0 years 29.2 years I-1 IIF Kobe District Heating and Cooling Center Osaka Gas Co., Ltd. 4 Fixed-Term Lease 665 3.7% 12.0 years 5.4 years I-2 IIF Haneda Airport Maintenance Center Japan Airlines Co., Ltd. 1 Fixed-Term Lease 1,888 10.6% 15.4 years 6.9 years I-3 IIF Zama IT Solution Center IBM Japan, Ltd. 1 Fixed-Term Lease Not Disclosed - 10.0 years 2.5 years I-4 IIF Shinagawa Data Center XYMAX Corporation 1 Fixed-Term Lease Not Disclosed - 10.0 years 3.1 years I-5 IIF Osaka Toyonaka Data Center Kanden Properties Co., Ltd. 1 Fixed-Term Lease Not Disclosed - 10.0 years 6.7 years I-6 IIF Osaka Nanko IT Solution Center Nomura Research Institute, Ltd. 1 Fixed-Term Lease Not Disclosed - 10.1 years 4.1 years I-7 IIF Nagoya Port Tank Terminal (land with leasehold interest) Chemical Logitec Co., Ltd. 1 Fixed-Term Lease Not Disclosed - 49.9 years 45.0 years I-8 IIF Shinagawa IT Solution Center Hitachi Systems, Ltd., etc. 4 Ordinary Lease Not Disclosed - 2.1 years 1.5 years I-9 IIF Higashimatsuyama Gas Tank Maintenance Center (land with leasehold interest) J Cylinder Service Co., Ltd. 1 Fixed-Term Lease Not Disclosed - 30.1 years 26.9 years
16.0 years 8.7 years Portfolio Average Lease Term
(Note 1) “Name of Tenants” is listed only main tenant.(Note 2) “No. of Tenants” is calculated based on the number of lease agreements in each property including Land temporary use Lease.(Note 3) “Annual Rent” is the monthly rent described the respective lease agreements annualized by multiplying by 12, rounded up to the nearest million.(Note 4) “Annual Rent” and “Lease Term” are based on lease agreements concluded with tenants as of Jan. 31, 2019. (Note 5) “Percentage” is the annual rent relating to each tenant as a proportion of the annual rent from all tenants and the figures are rounded up at the second decimal place.(Note 6) “Lease Term” is calculated based on rent amount of total portfolio and is the weighted average contracted lease term .(Note 7) “Lease Term Remaining” is calculated from Jan. 31, 2019 to the expiry date on the lease contract. The lease term remaining is calculated based on a weighted average of the annual rent.(Note 8) With respect to IIF Narashino Logistics Center II, both the land and the building with leasehold interest are managed in an integrated manner. IIF owns the trust beneficiary interests with respect to the land and the
building with leasehold interest.(Note9) Figures include IIF Fukuoka Hakozaki LC II(extension building)
Lease Contracts (2) (As of July 31, 2018)
14
Manufacturing / R&D, Infrastructure Facilities and Portfolio Total
~Appendix~Portfolio Data and Other Materials
NEW
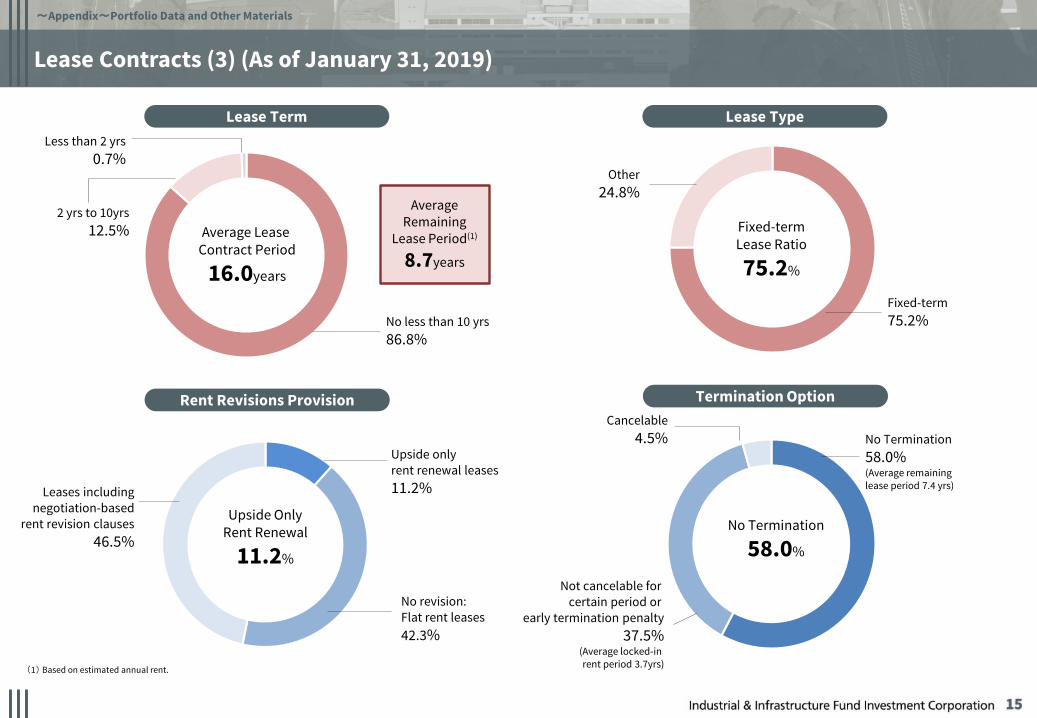
Lease Contracts (3) (As of January 31, 2019)
15
Average Lease Contract Period
16.0years
AverageRemaining
Lease Period(1)
8.7years
Less than 2 yrs0.7%
Fixed-termLease Ratio
75.2%
Other24.8%
Fixed-term75.2%
Upside OnlyRent Renewal
11.2%
No revision:Flat rent leases42.3%
Upside only rent renewal leases 11.2%Leases including
negotiation-basedrent revision clauses
46.5%No Termination
58.0%
No Termination 58.0%(Average remaininglease period 7.4 yrs)
Not cancelable for certain period or
early termination penalty37.5%
(Average locked-in rent period 3.7yrs)
Cancelable4.5%
No less than 10 yrs86.8%
2 yrs to 10yrs12.5%
(1) Based on estimated annual rent.
Lease Term Lease Type
Rent Revisions Provision Termination Option
~Appendix~Portfolio Data and Other Materials

Intentionally Blank Page
16

Appraisal Values (1) (As of January 31, 2019)
17
Logistics Facilities
~Appendix~Portfolio Data and Other Materials
(Note 1) “Appraisal Value as of the End of Period”, “Capitalization Rate (Direct Capitalization Method)” and “Terminal Capitalization Rate (DCF Method)” refer to figures provided in the respective appraisal reports (or research report) as of Jan. 31, 2019(Note 2) “Appraisal Value as of the End of Period” for IIF Shinonome Logistics Center applies only to 53% co-ownership interests of the trust beneficiary interests.
End of 22nd PeriodDirect
CapitalizationMethod
L-1 IIF Shinonome Logistics Center (Note 2) 12,894 +4,224 17,119 +371 +2.2% 16,748 4.2% 3.8% 4.4% (0.1p) (0.1p) (0.1p)
L-4 IIF Noda Logistics Center 5,377 +3,722 9,100 +200 +2.2% 8,900 4.4% 4.2% 4.6% (0.1p) (0.1p) (0.1p)
L-5 IIF Shinsuna Logistics Center 5,176 +2,283 7,460 +170 +2.3% 7,290 4.2% 3.9% 4.3% (0.1p) (0.1p) (0.1p)
L-6 IIF Atsugi Logistics Center 1,530 +629 2,160 +40 +1.9% 2,120 4.7% 4.4% 5.0% (0.1p) (0.1p) (0.1p)
L-7 IIF Koshigaya Logistics Center 1,782 +997 2,780 +50 +1.8% 2,730 4.8% 4.5% 4.9% (0.1p) (0.1p) (0.1p)
L-8 IIF Nishinomiya Logistics Center 1,958 +1,041 3,000 +10 +0.3% 2,990 5.1% 4.9% 5.3% 0.0p 0.0p 0.0p
L-9 IIF Narashino Logistics Center (land with leasehold interest) 1,223 +1,586 2,810 +120 +4.5% 2,690 - 4.5% - - 0.0p -
L-10 IIF Narashino Logistics Center Ⅱ 4,657 +1,942 6,600 +140 +2.2% 6,460 4.7% 4.5% 4.9% (0.1p) (0.1p) (0.1p)
L-11 IIF Atsugi Logistics Center Ⅱ 3,205 +834 4,040 +80 +2.0% 3,960 4.7% 4.4% 5.0% (0.1p) (0.1p) (0.1p)
L-12 IIF Yokohama Tsuzuki Logistics Center 2,304 +975 3,280 +70 +2.2% 3,210 4.5% 4.3% 4.7% (0.1p) (0.1p) (0.1p)
L-13 IIF Saitama Logistics Center 1,445 +684 2,130 +40 +1.9% 2,090 5.0% 4.7% 5.2% (0.1p) (0.1p) (0.1p)
L-14 IIF Nagoya Logistics Center 1,137 +472 1,610 +30 +1.9% 1,580 5.4% 5.1% 5.7% (0.1p) (0.1p) (0.1p)
L-15 IIF Atsugi Logistics Center Ⅲ 2,379 +750 3,130 +70 +2.3% 3,060 4.9% 4.6% 5.1% (0.1p) (0.1p) (0.1p)
L-16 IIF Kawaguchi Logistics Center 2,066 +2,313 4,380 - 0.0% 4,380 4.4% 4.2% 4.5% 0.0p 0.0p 0.0p
L-17 IIF Kobe Logistics Center 5,125 +2,434 7,560 - 0.0% 7,560 4.6% 4.3% 4.7% 0.0p 0.0p 0.0p
L-18 IIF Higashi Osaka Logistics Center 2,518 +721 3,240 +30 +0.9% 3,210 5.0% 4.7% 5.2% (0.1p) (0.1p) 0.0p
L-19 IIF Kashiwa Logistics Center 1,844 +1,105 2,950 +60 +2.1% 2,890 4.8% 4.4% 4.9% (0.1p) (0.1p) (0.1p)
L-20 IIF Misato Logistics Center 3,446 +1,863 5,310 - 0.0% 5,310 4.3% 4.1% 4.4% 0.0p 0.0p 0.0p
L-21 IIF Iruma Logistics Center 3,063 +1,096 4,160 (60) (1.4%) 4,220 4.9% 4.4% 5.3% (0.1p) (0.1p) (0.1p)
L-22 IIF Tosu Logistics Center 1,505 +454 1,960 (10) (0.5%) 1,970 5.1% 4.9% 5.2% 0.0p 0.0p 0.0p
L-23 IIF Inzai Logistics Center 1,023 +346 1,370 - 0.0% 1,370 5.4% 5.2% 5.5% 0.0p 0.0p 0.0p
L-24 IIF Morioka Logistics Center 578 +641 1,220 (20) (1.6%) 1,240 5.9% 5.7% 6.0% 0.0p 0.0p 0.0p
L-25 IIF Hiroshima Logistics Center 3,364 +1,135 4,500 (70) (1.5%) 4,570 5.2% 5.0% 5.3% 0.0p 0.0p 0.0p
L-26 IIF Izumiotsu e-shop Logistics Center (land with leasehold interest) 4,179 +240 4,420 (10) (0.2%) 4,430 - 4.6% - - 0.0p -
L-27 IIF Izumisano Food Processing and Logistics Center 945 +144 1,090 - 0.0% 1,090 4.9% 4.5% 5.0% 0.0p 0.0p 0.0p
L-28 IIF Kyotanabe Logistics Center 5,725 +1,664 7,390 +10 +0.1% 7,380 4.7% 4.4% 4.8% 0.0p 0.0p 0.0p
L-29 IIF Fukuoka Koga Vehicle Logistics Center (land with leasehold interest) 914 +73 988 +7 +0.7% 981 - 5.6% - - 0.0p -
L-30 IIF Fukuoka Higashi Logistics Center 1,923 +126 2,050 - 0.0% 2,050 5.0% 4.6% 5.1% 0.0p 0.0p 0.0p
L-31 IIF Osaka Konohana Logistics Center 8,689 +890 9,580 +20 +0.2% 9,560 4.1% 3.9% 4.3% 0.0p 0.0p 0.0p
L-32 IIF Kazo Logistics Center 2,605 +154 2,760 - 0.0% 2,760 4.8% 4.5% 4.9% 0.0p 0.0p 0.0p
L-33 IIF Hamura Logistics Center 917 +10 928 +20 +2.2% 908 4.5%Until 3rd 4.4%
From 4th to6th 4.5%After 7th 4.6%
4.7% (0.1p)Until 3rd (0.1p)
From 4th to 6th (0.1p)After 7th (0.1p)
(0.1p)
L-34 IIF Fukuoka Hakozaki Logistics Center Ⅰ 5,191 +28 5,220 +10 +0.2% 5,210 4.6% 4.2% 4.6% 0.0p 0.0p 0.0p
L-35 IIF Fukuoka Hakozaki Logistics Center Ⅱ 10,279 +620 10,900 - 0.0% 10,900 4.6% 4.2% 4.6% 0.0p 0.0p 0.0p
L-36 IIF Itabashi Logistics Center 1,754 +165 1,920 (10) (0.5%) 1,930 4.3% 3.8% 4.3% 0.0p 0.0p 0.0p
L-37 IIF Sendai Taiwa Logistics Center 1,589 +110 1,700 +30 +1.8% 1,670 5.3% 5.0% 5.6% (0.1p) (0.1p) (0.1p)
Appraisal Value as of the End of Period (JPY MM) (Note 1)
End of 23rd Period DCF Method Period-rarlier Levels
Appraisal Value
PropertyNumber
Terminal CapitalizationRate by DCF Method
Discount Rate by DCFMethod
Terminal CapitalizationRate
Capitalization Rateby Direct
CapitalizationMethod
UnrealizedCapital
GainPeriod-Over-
period (%)Capitalization
RateDiscount Rate
Name of Property Book Value(JPY MM)
Appraisal ValuePeriod-Over-
period
Applied Rate (Note 1)
End of 22nd PeriodDirect
CapitalizationMethod
L-38 IIF Ota Logistics Center 1,024 +135 1,160 - 0.0% 1,160 5.5%Until 7th 5.4%After 8th 5.6%
5.7% 0.0p 0.0% 0.0p
L-39 IIF Osaka Suminoe Logistics Center Ⅰ 12,094 +2,005 14,100 +200 +1.4% 13,900 4.2% 4.3% 4.4% (0.1p) (0.1p) (0.1p)
L-40 IIF Osaka Suminoe Logistics Center Ⅱ 2,568 +231 2,800 +70 +2.6% 2,730 4.3% 4.4% 4.5% (0.1p) (0.1p) (0.1p)
L-41 IIF Morioka Logistics Center Ⅱ 1,378 +201 1,580 +10 +0.6% 1,570 5.9% 5.5% 5.9% 0.0p 0.0p 0.0p
L-42 IIF Sapporo Logistics Center 2,516 +93 2,610 - 0.0% 2,610 5.0% 4.8% 5.2% 0.0p 0.0p 0.0p
L-43 IIF Hitachinaka Port Logistics Center(land with leasehold interest) 1,193 +16 1,210 - 0.0% 1,210 4.5% 4.5% - 0.0p 0.0p -
L-44 IIF Koriyama Logistics Center 2,583 +586 3,170 - 0.0% 3,170 5.6%Until 7th 5.6%After 8th 5.7%
5.8% 0.0p 0.0p 0.0p
L-45 IIF Kobe Nishi Logistics Center(land with leasehold interest) 2,047 +132 2,180 +50 +2.3% 2,130 -Until 14th 4.5%After 15th 4.6%
4.7% - 0.0p 0.0p
Logistics Facilities Total 139,733 +39,891 179,625 +1,728 +1.0% 177,897
F-1 IIF Totsuka Technology Center (land with leasehold interest) 4,553 +836 5,390 (10) (0.2%) 5,400 - 5.0% - - 0.0p -
F-2 IIF Yokohama Tsuzuki Technology Center 1,209 +130 1,340 - 0.0% 1,340 5.6% 5.4% 5.8% 0.0p 0.0p 0.0p
F-3 IIF Mitaka Card Center 9,350 +749 10,100 - 0.0% 10,100 5.5% 5.3% 5.7% 0.0p 0.0p 0.0p
F-5 IIF Kamata R&D Center 7,451 +948 8,400 - 0.0% 8,400 5.4% 5.1% 5.6% 0.0p 0.0p 0.0p
F-6 IIF Kawasaki Science Center 2,039 +910 2,950 - 0.0% 2,950 5.3% 5.1% 5.5% 0.0p 0.0p 0.0p
F-7 IIF Sagamihara R&D Center 3,278 +1,371 4,650 +690 +17.4% 3,960 5.7% 5.5% 5.9% (0.1p) 0.0p 0.0p
F-8 IIF Yokohama Shinyamashita R&D Center 3,872 +357 4,230 - 0.0% 4,230 4.8% 4.4% 4.9% 0.0p 0.0p 0.0p
F-9 IIF Kakegawa Manufacturing Center (land with leasehold interest) 1,572 +187 1,760 - 0.0% 1,760 - 5.1% - - 0.0p -
F-10 IIF Urayasu Machinery Maintenance Center (land with leasehold interest) 1,345 +314 1,660 - 0.0% 1,660 4.8% 4.0% 5.1% 0.0p 0.0p 0.0p
F-11 IIF Yokosuka Technology Center 4,205 +264 4,470 - 0.0% 4,470 5.6% 5.3% 5.7% 0.0p 0.0p 0.0p
F-12 IIF Shonan Technology Center 1,307 +32 1,340 - 0.0% 1,340 5.2% 4.9% 5.3% 0.0p 0.0p 0.0p
F-13 IIF Hiroshima Manufacturing Center (land with leasehold interest) 1,693 +166 1,860 +30 +1.6% 1,830 - 5.6% - - (0.1p) -
F-14 IIF Totsuka Manufacturing Center (land with leasehold interest) 2,413 +176 2,590 +10 +0.4% 2,580 4.6% 4.6% - 0.0p 0.0p -
F-15 IIF Atsugi Manufacturing Center (land with leasehold interest) 5,005 +264 5,270 - 0.0% 5,270 5.0% 5.0% - 0.0p 0.0p -
F-16 IIF Tsukuba Manufacturing Center (land with leasehold interest) (Note 2) 954 +365 1,320 - 0.0% 1,320 - 5.0% - - 0.0p -
Manufacturing and R&D Facilities Total 50,252 +7,077 57,330 +720 +1.3% 56,610
I-1 IIF Kobe District Heating and Cooling Center 16,157 (1,457) 14,700 - 0.0% 14,700 4.4% 3.6% 4.6% 0.0p 0.0p 0.0p
I-2 IIF Haneda Airport Maintenance Ceter 38,312 +2,987 41,300 +100 +0.2% 41,200 4.4% 3.5% 4.8% 0.0p 0.0p 0.0p
I-3 IIF Zama IT Solution Center 5,115 +414 5,530 - 0.0% 5,530 7.2% 5.8% 7.8% 0.0p 0.0p 0.0p
I-4 IIF Shinagawa Data Center 5,297 +1,572 6,870 +30 +0.4% 6,840 4.7% 4.8% 5.2% 0.0p 0.0p 0.0p
I-5 IIF Osaka Toyonaka Data Center 5,570 +449 6,020 - 0.0% 6,020 6.2% 4.9% 5.4% 0.0p 0.0p 0.0p
I-6 IIF Osaka Nanko IT Solution Center 1,212 +1,207 2,420 +10 +0.4% 2,410 6.3% 5.7% 6.8% 0.2p 0.0p 0.0p
I-7 IIF Nagoya Port Tank Terminal (land with leasehold interest) 1,998 +241 2,240 - 0.0% 2,240 5.6% 4.7% 6.3% 0.0p 0.0p 0.0p
I-8 IIF Shinagawa IT Solution Center 7,918 (788) 7,130 +390 +5.8% 6,740 4.5% 4.1% 4.6% 0.0p 0.0p 0.0p
I-9 IIF Higashimatsuyama Gas Tank Maintenance Center(land with leasehold interest) 729 +24 754 +1 +0.1% 753 - 4.9% - - 0.0p -
Infrastructure Facilities Total 82,311 +4,652 86,964 +531 +0.6% 86,433
272,297 +51,621 323,919 +2,979 +0.9% 320,940
Appraisal Value as of the End of Period (JPY MM) (Note 1)
End of 23rd Period DCF Method Period-rarlier Levels
Appraisal Value
PropertyNumber
Terminal CapitalizationRate by DCF Method
Discount Rate by DCFMethod
Terminal CapitalizationRate
Capitalization Rateby Direct
CapitalizationMethod
UnrealizedCapital
Gain
Portfolio Total
Period-Over-period (%)
CapitalizationRate
Discount Rate
Name of Property Book Value(JPY MM)
Appraisal ValuePeriod-Over-
period
Applied Rate (Note 1)
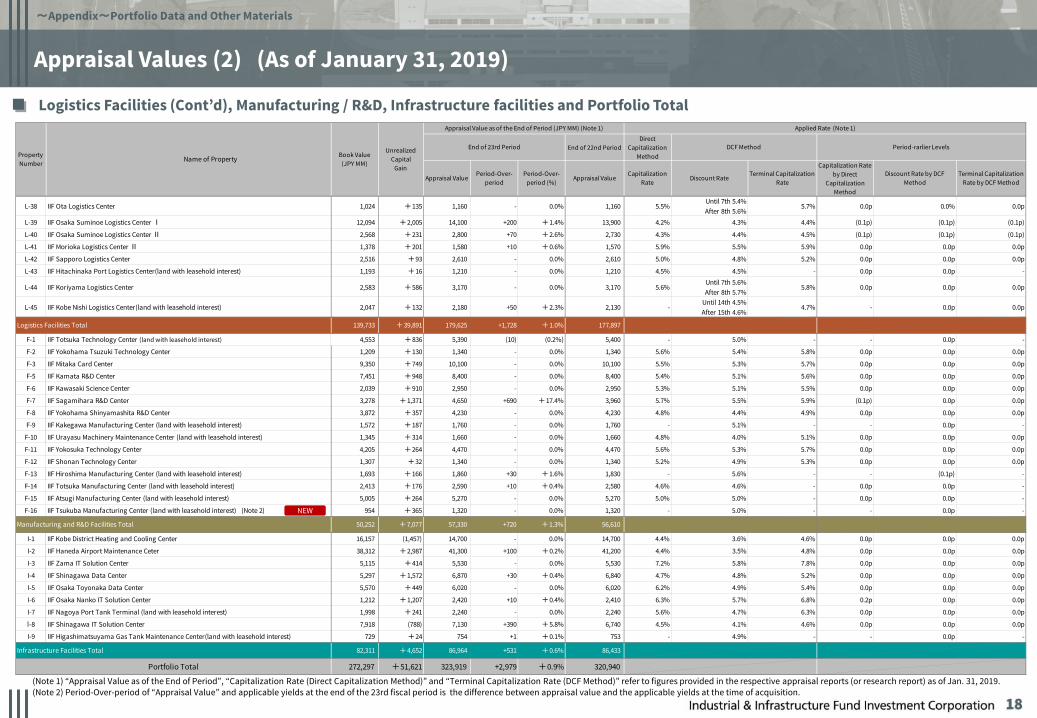
Appraisal Values (2) (As of January 31, 2019)
18
Logistics Facilities (Cont’d), Manufacturing / R&D, Infrastructure facilities and Portfolio Total
~Appendix~Portfolio Data and Other Materials
(Note 1) “Appraisal Value as of the End of Period”, “Capitalization Rate (Direct Capitalization Method)” and “Terminal Capitalization Rate (DCF Method)” refer to figures provided in the respective appraisal reports (or research report) as of Jan. 31, 2019.(Note 2) Period-Over-period of “Appraisal Value” and applicable yields at the end of the 23rd fiscal period is the difference between appraisal value and the applicable yields at the time of acquisition.
NEW

Performance by Property (1)
19
~Appendix~Portfolio Data and Other Materials
(JPY mn)
22nd 23rd 22nd 23rd 22nd 23rd 22nd 23rd 22nd 23rd 22nd 23rd 22nd 23rd 22nd 23rd 22nd 23rd 22nd 23rdDays 181days 184days 181days 184days 181days 184days 181days 184days 181days 184days 181days 184days 181days 184days 181days 184days 181days 184days 181days 184daysRent 397 397 179 179 75 75Others 2 4 - - 0 0
Total rental business income 400 402 179 179 75 75Taxes and public dues 30 30 16 16 3 3Management expenses 0 0 0 0 0 0Repair expenses 0 3 - 0 0 0Insurance cost and trust fee 0 0 0 0 0 0Others 0 0 1 0 0 0
Total rental business expenses 33 35 18 18 6 5NOI 366 366 206 207 160 160 53 54 69 70 81 82 38 37 174 175 113 114 74 78Depreciation and amortization 43 43 49 50 11 11 32 32 26 26 20 20 - - 7 7 19 19 8 8Rental business profit 323 323 157 157 148 149 21 21 43 43 61 61 38 37 166 168 94 94 66 69
Total deposits (Ending balance) 1,219 1,219Not
DisclosedNot
Disclosed84 84
NotDisclosed
NotDisclosed
37 37Not
DisclosedNot
DisclosedNot
DisclosedNot
DisclosedNot
DisclosedNot
DisclosedNot
DisclosedNot
DisclosedNot
DisclosedNot
Disclosed
22nd 23rd 22nd 23rd 22nd 23rd 22nd 23rd 22nd 23rd 22nd 23rd 22nd 23rd 22nd 23rd 22nd 23rd 22nd 23rdDays 181days 184days 181days 184days 181days 184days 181days 184days 181days 184days 181days 184days 181days 184days 181days 184days 181days 184days 181days 184daysRent 66 66Others 0 0
Total rental business income 66 66Taxes and public dues 3 2Management expenses 0 0Repair expenses 0 1Insurance cost and trust fee 0 0Others 1 2
Total rental business expenses 4 6NOI 62 60 42 42 75 82 106 106 179 180 87 88 70 77 116 116 106 105 51 52Depreciation and amortization 11 11 6 6 10 10 10 9 20 20 10 11 9 9 16 16 22 22 8 8Rental business profit 50 48 36 36 64 71 95 96 158 160 77 77 60 67 100 100 83 82 42 44
Total deposits (Ending balance) 33 33Not
DisclosedNot
DisclosedNot
DisclosedNot
DisclosedNot
DisclosedNot
DisclosedNot
DisclosedNot
DisclosedNot
DisclosedNot
DisclosedNot
DisclosedNot
DisclosedNot
DisclosedNot
DisclosedNot
DisclosedNot
DisclosedNot
DisclosedNot
Disclosed
22nd 23rd 22nd 23rd 22nd 23rd 22nd 23rd 22nd 23rd 22nd 23rd 22nd 23rd 22nd 23rd 22nd 23rd 22nd 23rdDays 181days 184days 181days 184days 181days 184days 181days 184days 181days 184days 181days 184days 181days 184days 181days 184days 181days 184days 181days 184daysRentOthers
Total rental business incomeTaxes and public duesManagement expensesRepair expensesInsurance cost and trust feeOthers
Total rental business expensesNOI 37 37 37 37 120 120 111 111 29 28 174 175 27 27 51 51 221 216 67 67Depreciation and amortization 5 5 5 5 25 25 0 0 8 8 32 32 - - 4 4 32 32 8 8Rental business profit 31 31 32 32 95 95 111 111 20 20 142 143 27 27 46 46 189 183 58 59
Total deposits (Ending balance)Not
DisclosedNot
DisclosedNot
DisclosedNot
DisclosedNot
DisclosedNot
DisclosedNot
DisclosedNot
DisclosedNot
DisclosedNot
DisclosedNot
DisclosedNot
DisclosedNot
DisclosedNot
DisclosedNot
DisclosedNot
DisclosedNot
DisclosedNot
DisclosedNot
DisclosedNot
Disclosed
L9(Narashino)
L10(NarashinoⅡ)
L11(AtsugiⅡ)
L12(Yokohama Tsuzuki)
ItemL1
(Shinonome)L4
(Noda)L5
(Shinsuna)L6
(Atsugi)L7
(Koshigaya)L8
(Nishinomiya)
NotDisclosed
NotDisclosed
NotDisclosed
NotDisclosed
NotDisclosed
NotDisclosed
NotDisclosed
NotDisclosed
NotDisclosed
NotDisclosed
NotDisclosed
NotDisclosed
NotDisclosed
NotDisclosed
L22(Tosu)
L13(Saitama)
L14(Nagoya)
L15(AtsugiⅢ)
L16(Kawaguchi)
L17(Kobe)
L18(Higashi Osaka)
ItemL19
(Kashiwa)L20
(Misato)L21
(Iruma)
NotDisclosed
NotDisclosed
NotDisclosed
NotDisclosed
NotDisclosed
NotDisclosed
NotDisclosed
NotDisclosed
NotDisclosed
NotDisclosed
NotDisclosed
NotDisclosed
NotDisclosed
NotDisclosed
NotDisclosed
NotDisclosed
NotDisclosed
NotDisclosed
L28(Kyotanabe)
L29(Fukuoka Koga)
L30(Fukuoka Higashi)
L31(Osaka Konohana)
L32(Kazo)
ItemL23
(Inzai)L24
(Morioka)L25
(Hiroshima)L26
(Izumiotsu)L27
(Izumisano)
NotDisclosed
NotDisclosed
NotDisclosed
NotDisclosed
NotDisclosed
NotDisclosed
NotDisclosed
NotDisclosed
NotDisclosed
NotDisclosed
NotDisclosed
NotDisclosed
NotDisclosed
NotDisclosed
NotDisclosed
NotDisclosed
NotDisclosed
NotDisclosed
NotDisclosed
NotDisclosed

Performance by Property(2)
20
~Appendix~Portfolio Data and Other Materials
(JPY mn)
22nd 23rd 22nd 23rd 22nd 23rd 22nd 23rd 22nd 23rd 22nd 23rd 22nd 23rd 22nd 23rd 22nd 23rd 22nd 23rdDays 181days 184days 181days 184days 181days 184days 181days 184days 181days 184days 181days 184days 181days 184days 181days 184days 181days 184days 146days 184daysRentOthers
Total rental business incomeTaxes and public duesManagement expensesRepair expensesInsurance cost and trust feeOthers
Total rental business expensesNOI 21 22 128 125 253 251 37 40 50 46 34 33 258 259 60 62 43 41 60 75Depreciation and amortization 3 3 23 23 44 47 5 6 8 8 4 4 51 53 7 8 5 5 6 7Rental business profit 17 18 105 101 208 204 31 34 41 38 30 29 206 205 52 53 38 36 54 68
Total deposits (Ending balance)Not
DisclosedNot
DisclosedNot
DisclosedNot
DisclosedNot
DisclosedNot
DisclosedNot
DisclosedNot
DisclosedNot
DisclosedNot
DisclosedNot
DisclosedNot
DisclosedNot
DisclosedNot
DisclosedNot
DisclosedNot
DisclosedNot
DisclosedNot
DisclosedNot
DisclosedNot
Disclosed
22nd 23rd 22nd 23rd 22nd 23rd 22nd 23rd 22nd 23rd 22nd 23rd 22nd 23rd 22nd 23rd 22nd 23rd 22nd 23rdDays 145days 184days 145days 184days 125days 184days 181days 184days 181days 184days 181days 184days 181days 184days 181days 184days 181days 184days 181days 184daysRent 154 154 59 59 364 364Others 0 0 - - 0 0
Total rental business income 154 154 59 59 364 364Taxes and public dues 16 16 8 8 47 47Management expenses - - 6 6 3 3Repair expenses - - 3 3 6 13Insurance cost and trust fee 0 0 0 0 0 0Others 0 0 0 0 1 1
Total rental business expenses 17 17 19 19 59 66NOI 23 29 80 105 31 45 137 137 40 39 305 298 235 235 82 82 144 141 103 104Depreciation and amortization - - 18 22 - - - - 5 6 48 55 29 31 23 23 14 16 19 19Rental business profit 23 29 61 83 31 45 137 137 34 33 257 242 205 203 58 58 129 124 83 84
Total deposits (Ending balance)Not
DisclosedNot
DisclosedNot
DisclosedNot
DisclosedNot
DisclosedNot
Disclosed276 276 92 92 182 182
NotDisclosed
NotDisclosed
NotDisclosed
NotDisclosed
NotDisclosed
NotDisclosed
NotDisclosed
NotDisclosed
NotDisclosed
NotDisclosed
NotDisclosed
NotDisclosed
ItemL33
(Hamura)
NotDisclosed
NotDisclosed
NotDisclosed
L40(Osaka Suminoe Ⅱ)
L41(Morioka Ⅱ)
L42(Sapporo)
L34(Fukuoka HakozakiⅠ)
L35(Fukuoka HakozakiⅡ)
L36(Itabashi)
L37(Sendai Taiwa)
L38(Ota)
L39(Osaka Suminoe Ⅰ)
NotDisclosed
NotDisclosed
NotDisclosed
NotDisclosed
NotDisclosed
NotDisclosed
NotDisclosed
NotDisclosed
NotDisclosed
NotDisclosed
NotDisclosed
NotDisclosed
NotDisclosed
NotDisclosed
L44(Koriyama)
F3(Mitaka)
F5(Kamata)
F6(Kawasaki)
F7(Sagamihara)
F8(Shinyamashita)
ItemL43
(Hitachinaka Port)
NotDisclosed
NotDisclosed
NotDisclosed
NotDisclosed
NotDisclosed
NotDisclosed
NotDisclosed
NotDisclosed
NotDisclosed
NotDisclosed
NotDisclosed
L45(Kobe-nishi)
F1(Totsuka TC)
F2(Yokohama Tsuzuki)
NotDisclosed
NotDisclosed

Performance by Property(3)
21
~Appendix~Portfolio Data and Other Materials
(JPY mn)
22nd 23rd 22nd 23rd 22nd 23rd 22nd 23rd 22nd 23rd 22nd 23rd 22nd 23rd 22nd 23rd 22nd 23rd 22nd 22ndDays 181days 184days 181days 184days 181days 184days 181days 184days 146days 184days 146days 184days 96days 184days 0days 21days 181days 184days 181days 184daysRent - 332 332 1,413 1,414Others - 0 0 15 15
Total rental business income - 332 332 1,428 1,429Taxes and public dues - 11 11 82 78Management expenses - 0 0 0 0Repair expenses - 9 1 - -Insurance cost and trust fee - 1 1 4 4Others - 1 1 387 392
Total rental business expenses - 23 15 475 476NOI 42 42 37 37 147 142 44 39 46 58 52 65 71 132 - 4 309 317 952 953Depreciation and amortization - - - - 12 12 3 3 - - - - - - - - 132 132 244 246Rental business profit 42 42 37 37 134 129 41 35 46 58 52 65 71 132 - 4 176 184 708 706
Total deposits (Ending balance)Not
DisclosedNot
DisclosedNot
DisclosedNot
DisclosedNot
DisclosedNot
DisclosedNot
DisclosedNot
DisclosedNot
DisclosedNot
DisclosedNot
DisclosedNot
DisclosedNot
DisclosedNot
Disclosed- Not
Disclosed2,159 2,159 974 974
22nd 23rd
22nd 22nd 22nd 23rd 22nd 23rd 22nd 23rd 22nd 23rd 22nd 23rd 22nd 23rd (Actual) (Actual)
Days 181days 184days 181days 184days 181days 184days 181days 184days 181days 184days 181days 184days 181days 184days
Rent 9,239 9,393Others 446 413
Total rental business income 9,686 9,806Taxes and public dues 746 788Management expenses 166 141Repair expenses 97 92Insurance cost and trust fee 38 38Others 754 784
Total rental business expenses 1,803 1,844NOI 201 201 181 174 191 215 71 73 62 62 202 109 18 18 7,882 7,961Depreciation and amortization 35 35 35 40 28 28 9 9 - - 38 39 - - 1,331 1,365Rental business profit 165 165 145 134 162 186 62 63 62 62 164 70 18 18 6,550 6,595
Total deposits (Ending balance)Not
DisclosedNot
DisclosedNot
DisclosedNot
DisclosedNot
DisclosedNot
DisclosedNot
DisclosedNot
DisclosedNot
DisclosedNot
DisclosedNot
DisclosedNot
DisclosedNot
DisclosedNot
Disclosed10,807 10,674
F14(Totsuka MC)
F15(Atsugi)
I2(Haneda)
I3(Zama)
ItemF9
(Kakegawa)F10
(Urayasu)F11
(Yokosuka)F12
(Shonan)F13
(Hiroshima)
NotDisclosed
NotDisclosed
NotDisclosed
F15(Tsukuba)
NotDisclosed
NotDisclosed
NotDisclosed
NotDisclosed
I1(Kobe)
NotDisclosed
NotDisclosed
NotDisclosed
NotDisclosed
NotDisclosed
NotDisclosed
NotDisclosed
I8(Shinagawa ITSC)
I9(Higashimatsuyama)
ItemI4
(Shinagawa)I5
(Osaka Toyonaka)I6
(Osaka Nanko)I7
(Nagoya Port)
NotDisclosed
NotDisclosed
NotDisclosed
NotDisclosed
NotDisclosed
NotDisclosed
NotDisclosed
NotDisclosed
NotDisclosed
NotDisclosed
NotDisclosed
NotDisclosed
NotDisclosed
NotDisclosed
NotDisclosed

5,000 2,000 3,000 4,000 3,900 4,000 4,600
7,200
5,000
9,500 10,000 5,500 8,300 10,150 10,100 9,950 5,000
8,200 5,600
7,700 4,100 3,300 3,800 4,900
0
5,000
10,000
15,000
20,000
25,000
24thJul.
25thJan.
26thJul.
27thJan.
28thJul.
29thJan.
30thJul.
31stJan.
32ndJul.
33rdJan.
34thJul.
35thJan.
36thJul.
37thJan.
38thJul.
39thJan.
40thJul.
41stJan.
42ndJul.
43rdJan.
44thJul.
45thJan.
46thJul.
2019 2020 2021 2022 2023 2024 2025 2026 2027 2028 2029 2030
Investment Corporation Bond Long Term Borrowings
Debt Stability (1) (As of January 31, 2019)
Unused portion of commitment line: JPY 20bn
Key Indices(Note)
Diversification of Debt Maturities
(Note) Outstanding balance as of January 31, 2019 is described
~Appendix~Portfolio Data and Other Materials
22
(JPYmn)
Weighted average interest rate Issuer credit rating(JCR)
0.95% AA(Stable)
Average borrowing period Fixed debt ratio
9.3years 100.0%

Debt Stability (2) (As of January 31, 2019)
23
Lender Status
~Appendix~Portfolio Data and Other Materials
(Note 1) Outstanding balance as of Jan. 31, 2019 is described(Note 2) The amounts are rounded down to the nearest million yen (Note 3) The applicable rate is based on the interest rate as Mar. 13, 2019 . (Note 4) IIF signed an interest rate swap contract to fix the interest rate.(Note 5) The remaining term for the existing borrowing is calculated with the base date as of Jan. 31, 2019. The average is calculated by weighting the remaining term of each borrowing according to the borrowing amount(Note 6) Long term borrowing includes a current portion of long term borrowings which will reach maturity within one year
Breakdown Total
1,085
415
1,000 1,000 1.90500 Mar. 30, 2022 Fixed (Note 4) 10 years 3.2 years
1,500 1,500 1.56100 Mar. 31, 2020 Fixed (Note 4) 8 years 1.2 years
1,000 1,000 2.22000 Mar. 29, 2024 Fixed 12 years 5.2 years
2,000 2,000 1.90000 Mar. 29, 2022 Fixed 10 years 3.2 years
500 500 1.90500 Mar. 31, 2022 Fixed (Note 4) 10 years 3.2 years
1,500 1,500 1.32375 Mar. 29, 2019 Fixed (Note 4) 7 years 0.2 years
1,000 1,000 1.42000 Jun. 30, 2020 Fixed 8 years 1.4 years
583 583 1.17500 Jun. 28, 2019 Fixed (Note 4) 7 years 0.4 years
417 417 1.17500 Jun. 28, 2019 Fixed (Note 4) 7 years 0.4 years
2,274 2,274 1.15750 Sep. 30, 2019 Fixed (Note 4) 7 years 0.7 years
1,626 1,626 1.15750 Sep. 30, 2019 Fixed (Note 4) 7 years 0.7 years
1,000 1,000 1.83000 Feb. 5, 2025 Fixed 12 years 6.0 years
2,534
966
1,000 1,000 1.29000 Feb. 6, 2023 Fixed 10 years 4.0 years
500 500 1.38980 Feb. 6, 2023 Fixed (Note 4) 10 years 4.0 years
1,000 1,000 1.48980 Feb. 6, 2023 Fixed (Note 4) 10 years 4.0 years
500 500 1.55000 Feb. 6, 2023 Fixed 10 years 4.0 years
500 500 1.38980 Feb. 6, 2023 Fixed (Note 4) 10 years 4.0 years
362
138
500 500 1.22750 Feb. 4, 2022 Fixed (Note 4) 9 years 3.0 years
2,000 2,000 1.75000 Jun. 28, 2024 Fixed 11 years 5.4 years
2,500 2,500 1.68475 Jun. 30, 2023 Fixed (Note 4) 10 years 4.4 years
1,500 1,500 1.64650 Jun. 30, 2022 Fixed (Note 4) 9 years 3.4 years
500
500
500
7,500 7,500 Oct. 18, 2013 1.40200 Oct. 18, 2023 Fixed (Note 4) 10 years 4.7 years
2,000 2,000 Dec. 30, 2013 1.38025 Dec. 29, 2023 Fixed (Note 4) 10 years 4.9 years
700 700 1.31000 Aug. 6, 2024 Fixed 10.5 years 5.5 years
900 900 1.24100 Feb. 6, 2024 Fixed (Note 4) 10 years 5.0 years
500 500 1.14000 Aug. 4, 2023 Fixed 9.5 years 4.5 years
500 500 1.03150 Aug. 5, 2022 Fixed (Note 4) 8.5 years 3.5 years
868
331
1,000 1,000 Mar. 13, 2014 1.67000 Mar. 13, 2026 Fixed 12 years 7.1 years
Borrowingterm
Remainingperiod
(Note 5)Lender
Long
-term
bor
row
ing
MUFG Bank, Ltd.(Note 6)1,500
Mar. 30, 2012
1.32375 Mar. 29, 2019 Fixed (Note 4)
Classification Outstanding Balance (JPY MM)(Note 1)(Note 2) Date of
BorrowingInterest Rate(Note 3) (%)
Maturity dateFixed/
Variable
Development Bank of Japan Inc.
Sumitomo Mitsui Banking Corporation
Sumitomo Mitsui Banking Corporation(Note6)
Nippon Life Insurance Company
Jun. 29, 2012MUFG Bank, Ltd.(Note6)
Sumitomo Mitsui Banking Corporation(Note6)
7 years 0.2 yearsSumitomo Mitsui Trust Bank, Limited(Note 6)
MUFG Bank, Ltd.
Mizuho Bank, Ltd.
Development Bank of Japan Inc.
10 years 4.0 yearsSumitomo Mitsui Trust Bank, Limited
MUFG Bank, Ltd.(Note 6)Sep. 28, 2012
Sumitomo Mitsui Banking Corporation(Note 6)
Development Bank of Japan Inc.
Feb. 6, 2013
MUFG Bank, Ltd.3,500
MUFG Bank, Ltd.
Sumitomo Mitsui Banking Corporation
Mizuho Bank, Ltd.
Nippon Life Insurance Company
Shinsei Bank, Ltd.
MUFG Bank, Ltd.500 1.22750 Feb. 4, 2022
1.38980 Feb. 6, 2023 Fixed (Note 4)
Fixed (Note 4) 9 years 3.0 yearsSumitomo Mitsui Trust Bank, Limited
Sumitomo Mitsui Banking Corporation
Nippon Life Insurance Company
Jun. 28, 2013
Sumitomo Mitsui Trust Bank, Limited
Mizuho Bank, Ltd.
Nomura Trust and Banking Co., Ltd.
0.92790 Feb. 4, 2022 Fixed (Note 4) 8 years 3.0 years
Resona Bank, Ltd.
THE YAMAGUCHI BANK, Ltd.
MUFG Bank, Ltd.
Sumitomo Mitsui Banking Corporation
MUFG Bank, Ltd.
Feb. 6, 2014
Sumitomo Mitsui Banking Corporation
THE YAMAGUCHI BANK, Ltd.
THE NISHI-NIPPON CHITIBANK, LTD.
MUFG Bank, Ltd.
1,500 1.24050 Jun. 30, 2020 Fixed (Note 4) 7 years 1.4 years
Sumitomo Mitsui Trust Bank, Limited1,200
Development Bank of Japan Inc.
Breakdown Total
724
276
1,158
441
1,350 1,350 0.98000 Mar. 14, 2025 Fixed 10 years 6.1 years
850 850 1.01740 Mar. 14, 2025 Fixed (Note 4) 10 years 6.1 years
850 850 1.01740 Mar. 14, 2025 Fixed (Note 4) 10 years 6.1 years
2,570
979
700 700 0.66090 Sep. 15, 2022 Fixed (Note 4) 7.5 years 3.6 years
1,000 1,000 1.26000 Mar. 31, 2027 Fixed 12 years 8.2 years
850 850 1.19000 Mar. 31, 2026 Fixed 11 years 7.2 years
1,500 1,500 0.98000 Mar. 31, 2025 Fixed 10 years 6.2 years
832
317
800 800 0.54500 Mar. 31, 2026 Fixed (Note 4) 10 years 7.2 years
The Bank of Fukuoka, LTD. 800 800 0.50130 Mar. 31, 2026 Fixed 10 years 7.2 years
2,000 2,000 Aug. 31, 2016 0.44000 Aug. 31, 2026 Fixed 10 years 7.6 years
1,600 1,600 Feb. 17, 2017 0.48500 Aug. 15, 2025 Fixed 8.5 years 6.5 years
3,255
1,244
2,170
829
1,500 1,500 0.49750 Mar. 6, 2025 Fixed 8 years 6.1 years
2,099
800
1,000 1,000 0.53000 Mar. 17, 2026 Fixed 9 years 7.1 years
1,000 1,000 0.86600 Mar. 16, 2029 Fixed 12 years 10.1 years
1,500 1,500 0.50500 Mar. 17, 2025 Fixed 8 years 6.1 years
1,000 1,000 0.63300 Mar. 17, 2027 Fixed 10 years 8.1 years
1,000 1,000 0.68000 Mar. 17, 2027 Fixed 10 years 8.1 years
1,000 1,000 0.68000 Mar. 17, 2027 Fixed 10 years 8.1 years
The Bank of Fukuoka, LTD. 1,000 1,000 0.68000 Mar. 17, 2027 Fixed 10 years 8.1 years
1,000 1,000 0.50500 Mar. 17, 2025 Fixed 8 years 6.1 years
4,054
1,545
1,000 1,000 0.65500 Mar. 31, 2027 Fixed 10 years 8.2 years
600 600 0.48500 Mar. 31, 2025 Fixed 8 years 6.2 years
1,000 1,000 0.65500 Mar. 31, 2027 Fixed 10 years 8.2 years
1,300 1,300 0.83800 Mar. 30, 2029 Fixed 12 years 10.2 years
1,200 1,200 0.63500 Mar. 31, 2027 Fixed 10 years 8.2 years
Long
-term
bor
row
ing
Borrowingterm
Remainingperiod
(Note 5)Lender
Classification Outstanding Balance (JPY MM)(Note 1)(Note 2) Date of
BorrowingInterest Rate(Note 3) (%)
Maturity dateFixed/
Variable
Sumitomo Mitsui Trust Bank, Limited
1.68675 Mar. 13, 2026 Fixed (Note 4) 12 years 7.1 yearsSumitomo Mitsui Trust Bank, Limited
MUFG Bank, Ltd.1,000
Mar. 13, 2014MUFG Bank, Ltd.
1,600
MUFG Bank, Ltd.
Mar. 16, 2015
Shinsei Bank, Ltd.
Mizuho Trust & Banking Co., Ltd.
MUFG Bank, Ltd.3,550
Mizuho Bank, Ltd.Apr. 15, 2016
MUFG Bank, Ltd.
MUFG Bank, Ltd.
1.27175 Mar. 13, 2024 Fixed (Note 4)
0.91900 Sep. 30, 2024 Fixed (Note 4) 9.5 years
10 years 5.1 years
5.7 years
Fixed (Note 4) 9.5 years 5.6 yearsSumitomo Mitsui Trust Bank, Limited
The Chugoku Bank, Limited.
Development Bank of Japan Inc.
Mar. 31, 2015
Meiji Yasuda Life Insurance Company
Sumitomo Mitsui Trust Bank, Limited
MUFG Bank, Ltd.
Sumitomo Mitsui Trust Bank, Limited1,150
0.92990 Sep. 13, 2024
0.67606 Sep. 4, 2026 Fixed 9.5 years 7.6 yearsSumitomo Mitsui Trust Bank, Limited
0.62977 Mar. 6, 2026 Fixed 9 years 7.1 yearsSumitomo Mitsui Trust Bank, Limited
MUFG Bank, Ltd.4,500
Mar. 6, 2017MUFG Bank, Ltd.3,000
Fixed 8.5 years 6.6 yearsSumitomo Mitsui Trust Bank, Limited
MUFG Bank, Ltd.
Development Bank of Japan Inc.
Sumitomo Mitsui Trust Bank, Limited
MUFG Bank, Ltd.2,900
Mar. 17, 2017
0.60233 Sep. 17, 2025
Sumitomo Mitsui Banking Corporation
Mizuho Bank, Ltd.
THE NISHI-NIPPON CHITIBANK, LTD.
Mizuho Trust & Banking Co., Ltd.
Sep. 30, 2025 Fixed 8.5 years 6.7 yearsSumitomo Mitsui Trust Bank, Limited
MUFG Bank, Ltd.
The Norinchukin Bank
MUFG Bank, Ltd.5,600
Mar. 31, 2017
0.57171
Sumitomo Mitsui Banking Corporation
Shinsei Bank, Ltd.
Development Bank of Japan Inc.
Mizuho Bank, Ltd.

Debt Stability (3) (As of January 31, 2019)
Breakdown of Lender Formation
~Appendix~Portfolio Data and Other Materials
24
(Note 1) Outstanding balance as of Jan. 31, 2019 is described(Note 2) The amounts are rounded down to the nearest million yen (Note 3) The applicable rate is based on the interest rate as Mar. 13, 2019. (Note 4) IIF signed an interest rate swap contract to fix the interest rate.(Note 5) The remaining term for the existing borrowing is calculated with the base date as of Jan. 31, 2019.
The average is calculated by weighting the remaining term of each borrowing according to the borrowing amount(Note 6) Long term borrowing includes a current portion of long term borrowings which will reach maturity within one year
MUFG Bank, Ltd.41.2%
Sumitomo Mitsui Trust Bank, Ltd
13.2%
Development Bank of Japan Inc.
10.3%
Sumitomo Mitsui Banking Corporation
9.4%
Mizuho Bank, Ltd. 5.9%
Nippon Life Insurance Company
2.4%
Mizuho Trust & Banking Co., Ltd. 2.0%
Shinsei Bank, Limited 1.6%
Japan Post Insuarance 1.6%
The Bank of Fukuoka, LTD. 1.2%
THE NISHI-NIPPON CITY BANK 1.0%
THE YAMAGUCHI BANK, Ltd. 0.7%
The Norinchukin Bank 0.7%
Meiji Yasuda Life Insurance Company 0.6%
The Chugoku Bank, LTD.0.5%
Resona Bank, Ltd.0.3%
The Nomura Trust and Banking Co,. Ltd
0.3%
Bond6.9%
Breakdown Total
2,791
1,009
2,938
1,062
2,791
1,009
2,099
800
2,300
100
700 700 0.67900 Feb. 1, 2028 Fixed 10 years 9.0 years
2,500 2,500 0.70100 Aug. 31, 2028 Fixed 10.5 years 9.6 years
2,500 2,500 0.85000 Feb. 28, 2030 Fixed 12 years 11.1 years
400 400 0.69600 Sep. 7, 2028 Fixed 10.5 years 9.6 years
400 400 0.59800 Sep. 7, 2027 Fixed 9.5 years 8.6 years
400 400 0.64600 Mar. 7, 2028 Fixed 10 years 9.1 years
1,100 1,100 0.64600 Mar. 7, 2028 Fixed 10 years 9.1 years
1,808
692
3,618
1,382
724
276
796
303
434
165
1,200 1,200 0.67500 Sep. 29, 2028 Fixed 10.5 years 9.7 years
1,000 1,000 0.29800 Sep. 30, 2021 Fixed 3.5 years 2.7 years
600 600 0.57800 Sep. 30, 2027 Fixed 9.5 years 8.7 years
500 500 0.62500 Mar. 31, 2028 Fixed 10 years 9.2 years
5,000 5,000 Dec. 27, 2012 1.40000 Dec. 27, 2022 Fixed 10 years 3.9 years
2,000 2,000 Jun. 26, 2014 0.89000 Jun. 26, 2024 Fixed 10 years 5.4 years
3,000 3,000 Dec. 26, 2016 0.40000 Dec. 25, 2026 Fixed 10 years 7.9 years
144,800 144,800 0.95 9.3 years 6.0 years
Investmentdorporation
bonds
Second series unsecured investment corporation bonds
Third series unsecured investment corporation bonds
Fourth series unsecured investment corporation bonds
Total / Average
9.5 years 8.7 yearsSumitomo Mitsui Trust Bank, Limited
Development Bank of Japan Inc.
Sumitomo Mitsui Banking Corporation
Sumitomo Mitsui Banking Corporation
Long
-term
bor
row
ing
Sumitomo Mitsui Trust Bank, Limited
MUFG Bank, Ltd.600 0.63050 Sep. 30, 2027 Fixed
10.1 yearsSumitomo Mitsui Trust Bank, Limited
MUFG Bank, Ltd.1,100
Mar. 30, 2018
0.33529 Sep. 30, 2021 Fixed 3.5 years 2.7 years
MUFG Bank, Ltd.1,000 0.80315 Mar. 9, 2029 Fixed 11 years
Mizuho Bank, Ltd.
0.70243 Mar. 9, 2028 Fixed 10 years 9.1 yearsSumitomo Mitsui Trust Bank, Limited
0.34085 Sep. 9, 2021 Fixed 3.5 years 2.6 yearsSumitomo Mitsui Trust Bank, Limited
Development Bank of Japan Inc.
Mar. 7, 2017Sumitomo Mitsui Banking Corporation
Mizuho Bank, Ltd.
Mizuho Trust & Banking Co., Ltd.
MUFG Bank, Ltd.2,500
Mar. 9, 2018MUFG Bank, Ltd.
5,000
Development Bank of Japan Inc.Feb. 27, 2017
Development Bank of Japan Inc.
Fixed 6.5 years 5.5 yearsSumitomo Mitsui Trust Bank, Limited
JAPAN POST INSURANCE Co., Ltd.2,400 0.88100 Feb. 1, 2030 Fixed 12 years
Sumitomo Mitsui Trust Bank, Limited
MUFG Bank, Ltd.2,900
Feb. 1, 2018
0.48077 Aug. 1, 2024
11.0 yearsSumitomo Mitsui Trust Bank, Limited
Mizuho Bank, Ltd.
5 years 3.7 yearsSumitomo Mitsui Trust Bank, Limited
MUFG Bank, Ltd.4,000 0.67599 Sep. 30, 2027 Fixed 10 years 8.7 years
MUFG Bank, Ltd.3,800
Sep. 29, 2017
0.34451 Sep. 30, 2022 Fixed
Sumitomo Mitsui Trust Bank, Limited
MUFG Bank, Ltd.3,800 0.86109 Sep. 30, 2029 Fixed 12 years 10.7 years
Borrowingterm
Remainingperiod
(Note 5)Lender
Classification Outstanding Balance (JPY MM)(Note 1)(Note 2) Date of
BorrowingInterest Rate(Note 3) (%)
Maturity dateFixed/
Variable

Prodigious Growth Potential with less Acquisition Competition
Opportunities for acquisition of real estate held by private/public sectors are still huge for J-REITs
~Appendix~Portfolio Data and Other Materials
JPY 580 tn. (Note 1) JPY 435 tn. (Note 2)
JPY 2,560 tn. (Note 1)
JPY 208 tn.
JPY 37.8 tn. (Note 3)
J-REIT
Securitized real estate
Income generating properties
Real estate held by private-sector
In Japan
Real estate held by public-sector
In Japan
JPY 18.0 tn. (Note 4)
J-REIT
Real estate in Japan
(Note1) Source: Cabinet Office, Government of Japan(Note2) Source: Ministry of Land, Infrastructure, Transport
and Tourism(Note3) Source: Ministry of Land, Infrastructure, Transport
and Tourism, ARES J-REIT Report(Feb. 2019), Sumitomo Mitsui Trust Research Institute eport(July. 2018)
(Note4) Source: ARES J-REIT REPORT (Feb. 2019)
25

Potentials of Manufacturing Facility Investments
Continuously lead acquisition of the high potential manufacturing facility market
~Appendix~Portfolio Data and Other Materials
Printing
Fiber
Electricalmachinery
ChemicalsNon-metals
Precision instrument
Pulp/Paper
Rubberproducts
【breakdown】(building) Manufacturing facility: JPY 12.8 tn. Warehouse: JPY 4.6 tn. (land) Manufacturing facility/ Warehouse: JPY 47 tn.
approx. JPY 64 tn.
Manufacturing facility/Warehouse ownedby private sector (Note)
Metalproduct
Electronicpart
Food
Lumber
Cement
Oil/Coal
Beverage
Beginning of manufacturing-facility assets securitization,where large potential market lies
Business networkof sponsor
(Mitsubishi Corp.)
IIF’s extensivenetwork
• Rich network established through CRE propositions efforts• Established trust with a wide range of industries, including the public
sector
• Operating with over 200 bases and over 1,200 consolidated subsidiaries in Japan and overseas
• Leverage business network across various industries
Through CRE proposals based on IIF’s extensive network,IIF will aim at pioneering a huge potential market
(Note) Source : Ministry of Land, Infrastructure, Transport and Tourism 26

97
62
59
51
46
40
39
38
37
37
0 20 40 60 80 100 120
Shizuoka
Gunma
Hyogo
Aichi
Ibaraki
Fukuoka
Nagano
Tochigi
Saitama
Nigata
Manufacturing Facilities Location Trends
Top 10 prefectures in terms of amount of products shipped
Top 10 prefectures in terms of the no. of manufacturing facilities
~Appendix~Portfolio Data and Other Materials
Manufacturing facilities in Japan areconcentered in areas surrounding the threemajor cities and Tokai region
Manufacturing facilities construction in 2017 is concentratedin land areas of Tokai region and Northern Kanto region
(Source) Ministry of Economy, Trade and Industry, “Census of Manufacture“, 2017
(Note) The value of products shipped is defined as the total value of annual income from manufactured goods shipments, receipts for production done to others, shipments for scraps and salable refuse, and other revenue, including internal tax on consumption and consumption tax.
(JPY tn.)(No. of facilities)
(Note) Only includes sites throughout Japan with ground area of 1,000 m2 or more that were acquired or leased for the purpose of building factories or work places (excluding the landfill planned site) for manufacturing, electric, gas or heat supply businesses.
(Source) Ministry of Economy, Trade and Industry, “Survey of Factory Location Trends: 2017 Preliminary Report (January–December)“
27
44.9
16.3
16.1
15.8
15.1
12.7
11.4
11.2
9.9
9.9
0 20 40 60
Aichi
Kanagawa
Shizuoka
Osaka
Hyogo
Saitama
Chiba
Ibaraki
Hiroshima
Mie
Reasons to choose locations
Reasons to choose locationsin Japan rather than abroad
(No. of responses)
(No. of responses)
(Source) Ministry of Economy, Trade and Industry, “Survey of Factory Location Trends: 2017 Preliminary Report (January–December)“
Proximity to HQ and other factories of its own 167Land price 144A lot in an industrial park 122Proximity to markets 70Aid from national/local governments 93Proximity of affiliated companies 69Less limitation due to surrounding environment 92Access to labor/talents 99Access to expressway 87Sincerity/enthusiasm/speed of local government 85Access to raw materials 42Access to distribution and service-industry operations 18Personal contact with other managers 20Access to industrial water supply 28Access to airport, seaport, and rail 23Share location with other companies 9Developed academic research institute 5Others 52
Access to good labor 17Access to raw materials 14Proximity to markets 17Proximity of affiliated companies 26Aid/cooperation from national/local government 17Political stability and security 6Organized industrial foundation 3Developed service-industry operations for the location 1Developed academic research institute 0Organized distribution system 4Care for intellectual property right 2Others 7

Intentionally Blank Page
28
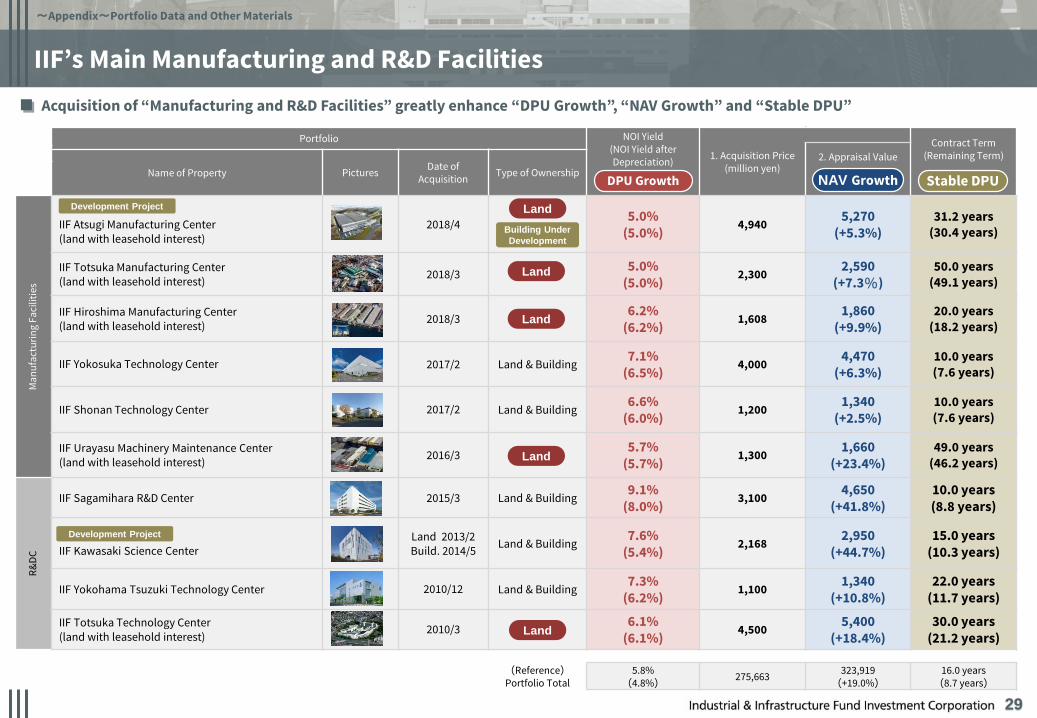
IIF’s Main Manufacturing and R&D Facilities
29
Acquisition of “Manufacturing and R&D Facilities” greatly enhance “DPU Growth”, “NAV Growth” and “Stable DPU”
Portfolio NOI Yield(NOI Yield afterDepreciation) 1. Acquisition Price
(million yen)
Contract Term(Remaining Term)2. Appraisal Value
Name of Property Pictures Date ofAcquisition Type of Ownership
Man
ufac
turin
g Fa
cilit
ies
IIF Atsugi Manufacturing Center (land with leasehold interest)
2018/45.0%
(5.0%) 4,940 5,270(+5.3%)
31.2 years(30.4 years)
IIF Totsuka Manufacturing Center(land with leasehold interest) 2018/3 底地 5.0%
(5.0%) 2,300 2,590(+7.3%)
50.0 years(49.1 years)
IIF Hiroshima Manufacturing Center(land with leasehold interest) 2018/3 底地 6.2%
(6.2%) 1,608 1,860(+9.9%)
20.0 years(18.2 years)
IIF Yokosuka Technology Center 2017/2 Land & Building7.1%
(6.5%) 4,000 4,470(+6.3%)
10.0 years(7.6 years)
IIF Shonan Technology Center 2017/2 Land & Building6.6%
(6.0%) 1,200 1,340(+2.5%)
10.0 years(7.6 years)
IIF Urayasu Machinery Maintenance Center (land with leasehold interest) 2016/3 底地 5.7%
(5.7%) 1,300 1,660(+23.4%)
49.0 years(46.2 years)
R&DC
IIF Sagamihara R&D Center 2015/3 Land & Building9.1%
(8.0%) 3,100 4,650(+41.8%)
10.0 years(8.8 years)
IIF Kawasaki Science CenterLand 2013/2Build. 2014/5 Land & Building
7.6%(5.4%) 2,168 2,950
(+44.7%)15.0 years
(10.3 years)
IIF Yokohama Tsuzuki Technology Center 2010/12 Land & Building7.3%
(6.2%) 1,100 1,340(+10.8%)
22.0 years(11.7 years)
IIF Totsuka Technology Center (land with leasehold interest) 2010/3 底地 6.1%
(6.1%) 4,500 5,400(+18.4%)
30.0 years(21.2 years)
Stable DPUDPU Growth
Land
Land
Land
Land
Development Project
Building Under Development
NAV Growth
Land
Development Project
(Reference)Portfolio Total
5.8%(4.8%) 275,663 323,919
(+19.0%)16.0 years
(8.7 years)
~Appendix~Portfolio Data and Other Materials

IIF’s Main Land with Leasehold Interest
30
Mainly acquire land and property for all asset type but also invest in land with leasehold interest in accordance with versatility of property
Portfolio NOI Yield(NOI Yield afterDepreciation) 1. Acquisition Price
(million yen)
Contract Term(Remaining Term)
Name of Property Date of Acquisition
2. Appraisal Value3. Land Price
Logistics IIF Narashino Logistics Center(land with leasehold interest) 2010/2
6.4%
(6.4%)1,190
2, 810
(+129.6%)
3,050
(+156.3%)
20.0 years
(2.6 years)
Infra-structure
IIF Nagoya Port Tank Terminal (land with leasehold interest) 2014/2
6.6%
(6.6%)1,900
2,240
(+12.1%)
2,320
(+22.1)
49.9 years
(45.0 years)
R&DC IIF Totsuka Technology Center (land with leasehold interest) 2010/3
6.1%
(6.1%)4,500
5,390
(+18.4%)
5,240
(+16.4%)
30.0 years
(21.2 years)
Manu-facturing
IIF Totsuka Manufacturing Center (land with leasehold interest) 2018/3
5.0%
(5.0%)2,300
2,590
(+7.3%)
3,070
(+33.5%)
50.0 years
(49.1 years)
IIF Hiroshima Manufacturing Center(land with leasehold interest) 2018/3
6.2%
(6.2%)1,608 1,860
(+9.9%)1,990
(+23.7%)
20.0 years
(18.2 years)
IIF Urayasu Machinery Maintenance Center (land with leasehold interest) 2016/3
5.7%
(5.7%)1,300
1,660
(+23.4%)
1,740
(+33.8%)
49.0 years
(46.2 years)
Versatility of Manufacturing Facility:Key Consideration Points
Stable DPUDPU Growth NAV Growth
(1) Building specifications such as facility equipment and floor load
(2) Potential usability with versatile specifications for other industrial tenants
(3) Possibility of conversion to other asset type such as a logistics facility, etc.
Total Portfolio Acquisition Price275.6B in Portfolio Total
<Land with leasehold interest>JPY 28.8B
Inv. Ratio 10.4%
~Appendix~Portfolio Data and Other Materials

IIF’s Proactive Approach to Manufacturing and R&D Facilities Investment Risks(1)
31
Secure long-term yield spread by “long-term lease” and “long-term fixed borrowing” for investments in assets with low liquidity
Tapering risk towards future inflation
《Main Risk Factors》
Sustainability(Stability: Long-term Contract)
Versatility(Location / Building)
ALM Strategy(Long maturity with fixed
rate)
《Asset》 《Debt》
Promote long-term fixed borrowings to mitigate the tapering risk towards future inflation
Stabilize cash flow with long term lease until risk premium becomes low due to by increase in number of transaction and liquidity enhancement
Liquidity risk due to few transaction
precedents
Leasing risk associated with tenant
leaving
《IIF’s Risk Measures》
~Appendix~Portfolio Data and Other Materials

IIF’s Proactive Approach to Manufacturing and R&D Facilities Investment Risks(2)
32
Gain first-mover advantage with expectation of increasing liquidity and lowering risk premium for manufacturing and R&D facilities in the future
Low
High
Low High
《Asset》
《Debt》
Liquidity
RiskPremium
Lower risk premium by increase in number of transaction (Liquidity enhancement)
LogisticsFacilities
Manufacturing and R&D Facilities
Versatility (Location / Building)
Stability (Long-term Contract)
ALM Strategy(Long maturity with fixed rate)
First Mover Advantage
※Image of risk measures until risk premium is lowered
– Realization of First-Mover Advantages -
~Appendix~Portfolio Data and Other Materials
Intentionally Blank Page
33

Potential for CRE (1)
Initiatives to improve capital efficiency
~Appendix~Portfolio Data and Other Materials
► Japanese companies are facing growing demand for improving capital efficiency because their ROE levels are lower throughout the world and there is a gap in attitude toward ROE between investors and companies
Increasing focus on ROE
One of the world’s largest pension funds is focusing on capital efficiency
Investment policy changed to support investment managers who comply with the Japanese Stewardship Code (e.g., use of JPX Nikkei Index 400 as a benchmark)
“GPIF”Recent Changes to Government Pension Investment
Fund investment policies
Index change brings discipline
“JPX400”Launch of JPX Nikkei Index 400
Eligibility criteria include 3-year average ROE as a benchmark, 3-year accumulated operating profits, appointment of independent outside directors and adoption of IFRS.
“Stewardship Code”Formulation of Japan Stewardship Code
Investor communications seeking to improve capital efficiency
Japanese institutional investors have accepted the new Stewardship Code which has as its core tenet the improvement of corporate value and efficiency through increased dialogue between institutional investors and Japanese companies (239 institutional investors accepted)(Note 1)
Quantitative target requirements
“Corporate Governance Code”(Note2)
Japan’s new Corporate Governance Code
The new Code became effective on June 1, 2015, under which listed companies are required to present targets of profitability and capital efficiency and to mention how to allocate managerial resources to meet such targets, in their business strategy and plans
ISS amendments increase pressure to achieve 5% ROE
ISS’s amendments recommend investors that vote against directors if a company’s average ROE is lower than 5% for 5 consecutive fiscal period (effective as of February 2015)(Note 3)
“ISS”Amendments to Institutional Shareholder Services
Inc.’s proxy voting guidelines
Capture acquisition opportunities through CRE proposalswhich take advantage of the increasing awareness regarding capital efficiency
(Note 1) Japanese Version of Stewardship Code was established in February 2014 at the Council of Experts on the Stewardship Code. and was revised in May 2017. The figure is for the Institutional investors accepted as of December. 14, 2018.(Note 2) Corporate Governance Code refers to the policy established by Tokyo Stock Exchange and was implemented in June 2015 as a guide to basic corporate governance practice for the listed companies. (Note3) Except for the case where ROE of the most recent fiscal year is 5% or more 34
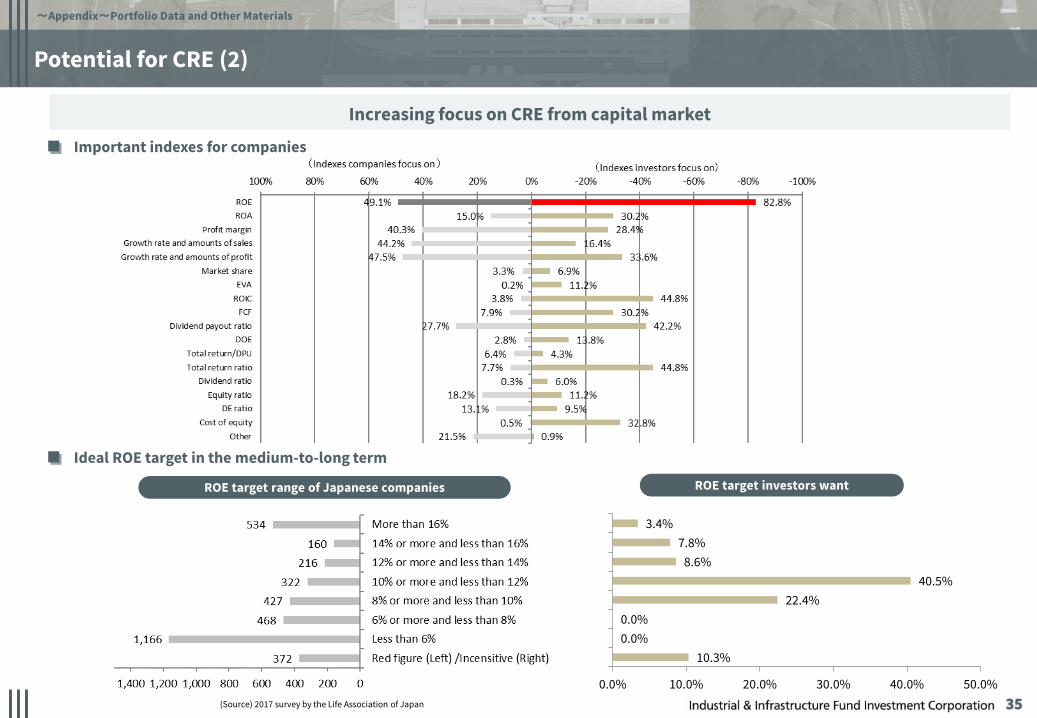
Potential for CRE (2)
Increasing focus on CRE from capital market
Important indexes for companies
Ideal ROE target in the medium-to-long term
~Appendix~Portfolio Data and Other Materials
ROE target range of Japanese companies ROE target investors want
(Source) 2017 survey by the Life Association of Japan 35
10.3%0.0%0.0%
22.4%40.5%
8.6%7.8%
3.4%
0.0% 10.0% 20.0% 30.0% 40.0% 50.0%

Toyota Motor Corporation
Honda Motor Co., Ltd.
Nissan Motor Co., Ltd.
Hitachi, Ltd.
Sony Corporation
Panasonic Corporation
Nippon Steel & Sumitomo Metal Corporation
DENSO Corporation
Mitsubishi Electric Corporation
Mitsubishi Heavy Industries, Ltd.
Aisin Seiki Co., Ltd.
Fujitsu Limited
Canon Inc.
JFE Holdings, Inc.Mitsubishi Chemical Holdings Corporation
Suzuki Motor Corporation
Toshiba Corporation
Bridgestone Corporation
Mazda Motor Corporation
Subaru Corporation
Volkswagen AG
Apple Inc.
Daimler AG
Ford Motor CompanyGeneral Motors Company
Fiat Chrysler Automobiles N.V.
Microsoft Corporation
Bayerische Motoren Werke Aktiengesellschaft
The Boeing Company
Nestlé S.A.
Dell Technologies Inc.
DowDuPont Inc.
Peugeot S.A.
Johnson & Johnson
International Business Machines Corporation
Airbus SEBASF SE
The Procter & Gamble Company
United Technologies Corporation
Renault SA
0
2
4
6
8
10
12
18
0% 5% 10% 15% 20% 25% 30% 35% 40% 45%
Potential for CRE (3)
High
Low
Low
Capital-efficient western companies tend to be low in real estate per total asset and high in real estate
turnover ratio
High
Seek external growth opportunities through CRE proposals as a solution provider
(Source) Prepared by the Asset Manager based on Capital IQ(Note 1) Real estate turnover ratio=revenue / net tangible fixed asset, Real estate per total asset=net tangible fixed asset / total asset
Real estate per total asset (Note 1)
Real estate turnover ratio (Note 1)
≪Real Estate Turnover Ratio & Real Estate per Total Asset (International Comparison of Top 20 Manufacturing Companies) ≫
Possibility of accelerating off-balance transaction in manufacturing industry
~Appendix~Portfolio Data and Other Materials
36
US and Europe Japan

4.5
4.7
4.0
4.5
5.0
5.5
6.0
6.5
7.0
7.5
Apr.
Oct
.
Apr.
Oct
.
Apr.
Oct
.
Apr.
Oct
.
Apr.
Oct
.
Apr.
Oct
.
Apr.
Oct
.
Apr.
Oct
.
Apr.
Oct
.
Apr.
Oct
.
Apr.
Oct
.
Apr.
Oct
.
Apr.
Oct
.
2006 2007 2008 2009 2010 2011 2012 2013 2014 2015 2016 2017 2018
Single Tenant Type: Coastal Area Single Tenant Type: Inland Area
Multiple Tenant Type: Coastal Area Multiple Tenant Type: Inland Area
200
250
300
350
400
450
500
Jan Feb Mar Apr May Jun Jul Aug Sep Oct Nov Dec
2010 2011 20122013 2014 20152016 2017 2018
Overview of the Logistics Market (1)
~Appendix~Portfolio Data and Other Materials
(Source) Japan Real Estate Institute “The Japanese Real Estate Investor Survey”
(%)
(Source) Ministry of Land, infrastructure, Transport and Tourism
(No. mn.)
Expected Cap Rate of Logistics Properties and Warehouses (Tokyo) Number of Parcels for Home Delivery Service Trend
37
Expected cap rate declines continuouslythrough active supply and demand of logistics properties
Number of parcels for home delivery service increasing due to expanding mail-order business
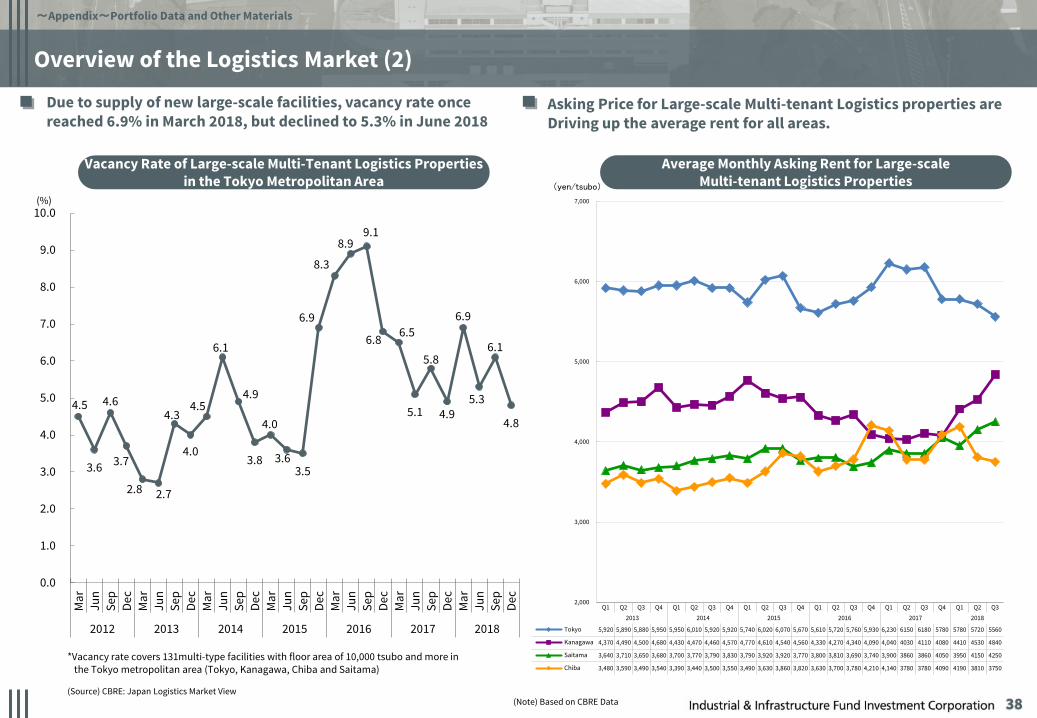
Overview of the Logistics Market (2)
Due to supply of new large-scale facilities, vacancy rate once reached 6.9% in March 2018, but declined to 5.3% in June 2018
(Source) CBRE: Japan Logistics Market View(Note) Based on CBRE Data
(%)
*Vacancy rate covers 131multi-type facilities with floor area of 10,000 tsubo and more in the Tokyo metropolitan area (Tokyo, Kanagawa, Chiba and Saitama)
Average Monthly Asking Rent for Large-scale Multi-tenant Logistics Properties
Vacancy Rate of Large-scale Multi-Tenant Logistics Properties in the Tokyo Metropolitan Area
~Appendix~Portfolio Data and Other Materials
38
Asking Price for Large-scale Multi-tenant Logistics properties are Driving up the average rent for all areas.
4.5
3.6
4.6
3.7
2.8 2.7
4.3
4.0
4.5
6.1
4.9
3.8
4.0
3.63.5
6.9
8.3
8.99.1
6.8 6.5
5.1
5.8
4.9
6.9
5.3
6.1
4.8
0.0
1.0
2.0
3.0
4.0
5.0
6.0
7.0
8.0
9.0
10.0
Mar
Jun
Sep
Dec
Mar
Jun
Sep
Dec
Mar
Jun
Sep
Dec
Mar
Jun
Sep
Dec
Mar
Jun
Sep
Dec
Mar
Jun
Sep
Dec
Mar
Jun
Sep
Dec
2012 2013 2014 2015 2016 2017 2018
Q1 Q2 Q3 Q4 Q1 Q2 Q3 Q4 Q1 Q2 Q3 Q4 Q1 Q2 Q3 Q4 Q1 Q2 Q3 Q4 Q1 Q2 Q32013 2014 2015 2016 2017 2018
Tokyo 5,920 5,890 5,880 5,950 5,950 6,010 5,920 5,920 5,740 6,020 6,070 5,670 5,610 5,720 5,760 5,930 6,230 6150 6180 5780 5780 5720 5560
Kanagawa 4,370 4,490 4,500 4,680 4,430 4,470 4,460 4,570 4,770 4,610 4,540 4,560 4,330 4,270 4,340 4,090 4,040 4030 4110 4080 4410 4530 4840
Saitama 3,640 3,710 3,650 3,680 3,700 3,770 3,790 3,830 3,790 3,920 3,920 3,770 3,800 3,810 3,690 3,740 3,900 3860 3860 4050 3950 4150 4250
Chiba 3,480 3,590 3,490 3,540 3,390 3,440 3,500 3,550 3,490 3,630 3,860 3,820 3,630 3,700 3,780 4,210 4,140 3780 3780 4090 4190 3810 3750
2,000
3,000
4,000
5,000
6,000
7,000
(yen/tsubo)

-
100
200
300
400
500
600
Jan Apr Jul Oct Jan Apr Jul Oct Jan Apr Jul Oct Jan Apr Jul Oct Jan Apr Jul Oct Jan Apr Jul Oct Jan Apr Jul Oct Jan Apr Jul Oct Jan Apr Jul Oct Jan
Unit Price Performance (Jan. 4, 2010 ~ Mar. 6, 2019)
~Appendix~Portfolio Data and Other Materials
392.8(JPY119,700)
202.7(JPY21,596)
2015 Offering
IIF
TSE REIT Index
Nikkei 225
(Soruce) Bloomberg(Note1) Indices are based on closing prices considering the unit split of the investment units.(Note2) Vertical axis indicates indexed unit price trend (Tokyo Stock Exchange) using Jan 4, 2010 as the base date with index value equal to 100(Note3) Effective as of January 1, 2015, IIF implemented two-for-one split of the investment units and effective as of February 1, 2018, IIF implemented four-for-one unit split of the investment units.
2012 Offering
2011 Offering
2013 Offering
PortfolioRebalance
Jan 4, 2010= 100
204.0(1,848.71)
2014 Offering
IIFJPY30,475
TSE REIT Index906.28
Nikkei 225JPY10,654
2017 Offering
39
0
2018 Offering
2010 2011 2012 2013 2014 2015 2016 2017 2018 2019

0
200
400
600
800
1,000
1,200
Jan Apr Jul Oct Jan Apr Jul Oct Jan Apr Jul Oct Jan Apr Jul Oct Jan Apr Jul Oct Jan Apr Jul Oct Jan Apr Jul Oct Jan Apr Jul Oct Jan Apr Jul Oct Jan
Historical Market Capitalization and Trading Volume (Jan. 4, 2010 ~ Mar. 6, 2019)
~Appendix~Portfolio Data and Other Materials
2015 OfferingIIF
J-REIT
(Source) Bloomberg(Note 1) Based on closing prices(Note 2) Vertical axis indicates indexed unit price trend (Tokyo Stock Exchange) using Jan 4, 2010 as the base date with index value equal to 100
2012 Offering2011 Offering
2013 Offering
PortfolioRebalance
2014 Offering
Jan 4, 2010= 100
IIFJPY19.2bn
J-REITJPY2.7tn
494(JPY 13.7 tn.)
IIF Daily Average Trading Volume
JPY 66mn JPY 85mn JPY 215mn
1,055(JPY 203.3 bn)
JPY 609mn
2017 Offering
40
JPY 529mn JPY 475mn JPY 468mn JPY 568mn JPY 508mn
2018 Offering
2010 2011 2012 2013 2014 2015 2016 2017 2018 2019
JPY 403mn

Investors’ Attributes
41(Note) Effective as of January 1, 2015, IIF made a two-for-one split of its units, and
effective as of February 1, 2018, IIF made a four-for-one split of its units. The information in the charts retroactively reflects the unit splits and the figures are truncated to the relevant digit.
(Unit)
Number of Investment Units issued
~Appendix~Portfolio Data and Other Materials
Top 20 Investors as of the End of Jan. 2019 Unit Holder Composition
Rank Name Number ofUnits Held
OwnershipRation (%)
1 Japan Trustee Services Bank, Ltd. (Trust Account) 252,913 14.88
2 Master Trust Bank of Japan, Ltd. (Trust Account) 250,799 14.76
3 Nomura Trust and Banking Co., Ltd. (Trust Account) 70,021 4.12
4Trust & Custody Services Bank, Ltd.(Securities Investment Trust Account) 61,302 3.60
5 Mitsubishi Corporation 25,600 1.50
6 Mizuho Trust & Banking Co., Ltd. 24,265 1.42
7 STATE STREET BANK WEST CLIENT - TREATY 505234 22,561 1.32
8 Joyo Bank, Ltd. 22,232 1.30
9 The Hachijuni Bank, Ltd. 22,220 1.30
10 The Chugoku Bank 22,000 1.29
11 Development Bank of Japan Inc. 20,000 1.17
12Trust & Custody Services Bank, Ltd.(Cash in Trust Taxable Account) 19,826 1.16
13 Mitsubishi UFJ Morgan Stanley Securities Co., Ltd. 19,558 1.15
14 The Gunma Bank,Ltd. 19,366 1.13
15 Mitsubishi UFJ Trust and Banking Corporation 19,155 1.12
16 The Chukyo Bank, Ltd. 18,424 1.08
17 BNYM AS AGT/CLTS 10 PERCENT 17,229 1.01
18 The Hokkoku Bank, Ltd. 16,500 0.97
19 THE HOKURIKU BANK, LTD 15,428 0.90
20 THE ASHIKAGA BANK, LTD. 14,932 0.87
954,331 56.17Total of Top 20
662,736 (58.9%)
708,400 (56.6%)
752,872 (60.2%)
797,280 (60.2%)
884,328 (66.8%)
972,424 (69.0%)
1,015,156 (72.0%) 955,204
(67.7%)
979,928 (69.5%)
1,104,692 (69.5%)
1,106,696 (69.7%)
1,199,086 (70.6%)
1,213,509 (71.4%)
117,792 (10.5%)
118,736 (9.5%)
70,232 (5.6%)
77,656 (5.9%)
77,576 (5.9%)
78,132 (5.5%)
77,276 (5.5%) 76,556
(5.4%)
76,320 (5.4%)
82,944 (5.2%)
80,612 (5.1%)
85,414 (5.0%)
84,858 (5.0%)
243,384 (21.6%)
342,896 (27.4%)
344,680 (27.5%)
360,184 (27.2%)
280,088 (21.2%)
272,516 (19.3%)
239,408 (17.0%) 301,692
(21.4%)
278,156 (19.7%)
305,224 (19.2%)
294,760 (18.6%)
301,023 (17.7%)
274,783 (16.2%)
101,144 (9.0%)
81,424 (6.5%)
83,672 (6.7%)
89,136 (6.7%)
82,264 (60.2%)
87,184 (6.2%)
78,416 (5.6%)
76,804 (5.4%)
75,852 (5.4%)
95,796 (6.0%)
106,588 (6.7%)
113,293 (6.7%)
125,666 (7.4%)
0
200,000
400,000
600,000
800,000
1,000,000
1,200,000
1,400,000
1,600,000
1,800,000
Dec. 2012(11th)
Jun. 2013(12th)
Dec. 2013(13th)
Jun. 2014(14th)
Dec. 2014(15th)
Jun. 2015(16th)
Dec. 2015(17th)
Jun. 2016(18th)
Dec. 2016(19th)
Jul. 2017(20th)
Jan. 2018(21st)
Jul. 2018(22nd)
Jan. 2019(23rd)
Individuals and others Foreign Company Other Corporation Financial Institution1,698,8161,698,816
1,588,6561,588,656
1,410,2561,410,2561,410,2561,410,256
1,324,2561,324,256
1,251,4561,251,456
1,125,056

Overview of the Asset Management Company
42
Mitsubishi Corporation UBS Asset Management AG
~Appendix~Portfolio Data and Other Materials
Shareholders of Asset Management Company
% in total issue
51.0%
% in total issue
49.0%
Asset Management Company: ・Number of Directors and Employees 136
(excluding part-time directors and employees, and seconded employees)
Number of Licensed Persons Out of the Above・Licensed Real Estate Agents 40・First-class Architects 9・Real Estate Appraisers 3・Certified Member of Security Analysts
Association of Japan 9・CPA 2・Certified Tax Accountants 2・MBA (including US and UK) 3
Organizational StructureShareholders’ Meeting
Board of Directors Auditors’ Meeting
Auditors
Investment Committee
Internal Audit Office
Risk Management Committee
Compliance Office
Compliance Committee
Deal Review Meeting
Compensation Committee
President Management Committee
Strategic Planning Office
Kansai Office Corporate DivisionRetail Division Industrial Division Acquisition Division
(Note) As of Feb. 28, 2019
COO(Chief Operating Officer)
Disclaimer
43
This material may contain information such as data on future performance, plans, management targets, and strategies. Such descriptions with regard
to the future are based on current hypotheses and assumptions about future events and trends in the business environment, but these hypotheses
and assumptions are not necessarily correct. As such, actual results may vary significantly due to various factors
This material is prepared based on Japanese accounting principles unless otherwise noted
This material is to be used for analyzing the financial results of IIF, and is not prepared for the purpose of soliciting the acquisition of IIF’s investment
securities or the signing of financial instruments contracts. When investing, we ask investors to invest on their own responsibility and their own
judgment
IIF is a publicly-offered real estate investment corporation (J-REIT) investing in real estate and related assets the prices of which may fluctuate.
Unitholders of the Investment Corporation may suffer loss when unit prices decline in the market or an amount of distributions declines, according to
economic and interest rate circumstances, a balance of supply and demand for units, real estate market environment, fluctuations of prices of, and
rent revenues from real estate properties under management, disasters, aggravation of financial status of IIF and other reasons. For details, please see
“Investment Risk” in the Securities Registration Statement (offering circular) and the Securities Report of IIF
Asset Management Company :Mitsubishi Corp.- UBS Realty Inc.
(Financial Instruments Dealer Director of Kanto Financial Bureau (Financial Instruments Dealer)
Number 403, Member of The Investment Trusts Association, Japan)