Investor presentation - Essentra plc
33
INVESTOR PRESENTATION Half Year 2015 Results 31 JULY 2015
Transcript of Investor presentation - Essentra plc

INVESTOR PRESENTATION
Half Year 2015 Results
31 JULY 2015
AGENDA
1. Operational Review - Colin Day
2. Financial Review - Matthew Gregory
3. 2015 Outlook - Colin Day
2 © 2013 ESSENTRA PLC

© 2013 ESSENTRA PLC
OPERATIONAL REVIEW
Colin Day
Chief Executive

HY 2015: HIGHLIGHTS
• Positive result, despite Oil & Gas challenge in Pipe Protection Technologies
‒ Total revenue +27% @ constant FX
‒ LFL revenue +6% ex-PPT, +2% total Group
• Strong underlying margin expansion offset by short-term dilution from
acquisitions and PPT
• Rapid start to Clondalkin SPD integration: annualised synergy savings target
raised by 50% to at least US$24m from 2016
• Continued improvement in tax rate
• Half year dividend per share increased by 11% to 6.3p
• Well-placed to deliver balanced, profitable growth in 2015
Solid start to Drive for 2020
4

STRONG REVENUE & PROFIT GROWTH
Revenue (£m)
Distribution
£138m
LFL: +9%
H&PC
Packaging
£189m
LFL: +0%
Filter Products
£154m
LFL: +6%
Specialist Technologies
£71m
LFL: -14%
Ex-PPT: +6%
Group: £550m*
+27%
LFL: +2%
Ex-PPT: +6%
55.0
65.0
75.0
85.0
HY14 HY15
Adjusted Operating Profit (£m)
5
Notes:
Growth at constant exchange rates, unless otherwise stated
Operating profit is adjusted to exclude intangible amortisation and exceptional operating items
* After Eliminations of £(1.1)m
+18%

DISTRIBUTION
6
• Growth supported by more encouraging market
conditions
– Continued improvement in Europe
– Benefit from regional warehouse in Singapore
– ... but more challenging in North America
• Incremental revenue opportunities from focus
on larger custom injection moulding projects
• Launch of new catalogues in all geographic
regions
– 6-7,000 new products offered in Europe and Asia
• Further site expansion and roll-out
– Upgraded facilities in Australia and Canada
– Market entry in South Korea and Dubai
• Speciality Tapes supported by further growth in
the US
• Site footprint consolidation and further operating
& process efficiencies
– Offset by short-term dilution from acquisitions and
increased marketing spend
Investment in more productive injection moulding
machines in Kidlington
Roll-out of eCommerce platform
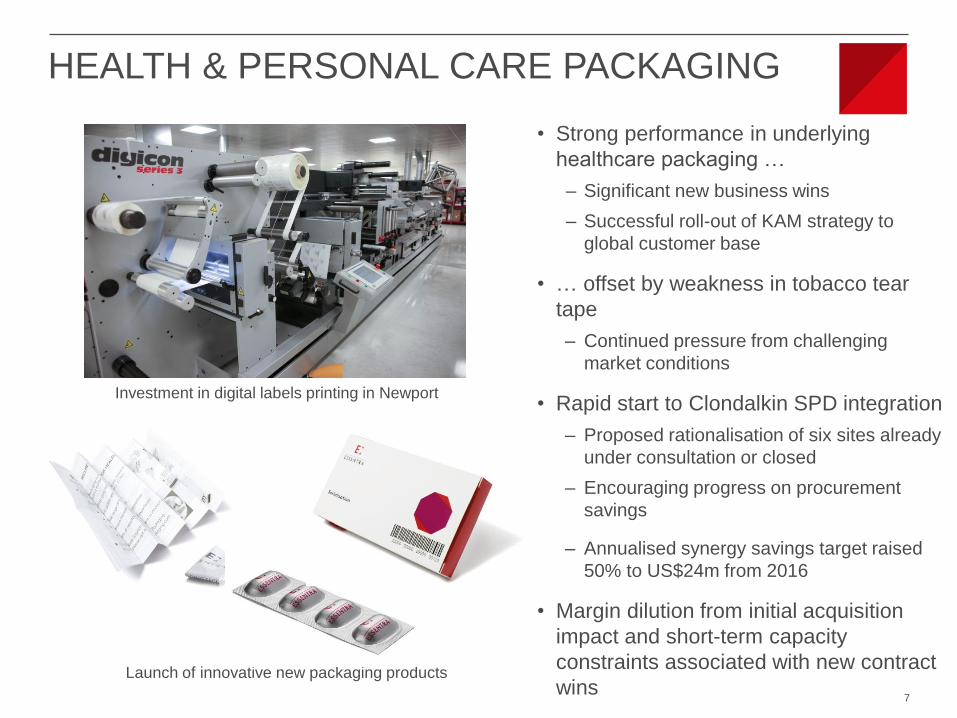
HEALTH & PERSONAL CARE PACKAGING
7
• Strong performance in underlying
healthcare packaging …
– Significant new business wins
– Successful roll-out of KAM strategy to
global customer base
• … offset by weakness in tobacco tear
tape
– Continued pressure from challenging
market conditions
• Rapid start to Clondalkin SPD integration
– Proposed rationalisation of six sites already
under consultation or closed
– Encouraging progress on procurement
savings
– Annualised synergy savings target raised
50% to US$24m from 2016
• Margin dilution from initial acquisition
impact and short-term capacity
constraints associated with new contract
wins
Investment in digital labels printing in Newport
Launch of innovative new packaging products

FILTER PRODUCTS
• Underlying volumes > HY 2014
– Strong growth in special filters
• Ongoing launches & development initiatives
– Innovative filters allowing greater visualisation
and brand differentiation
– Further increase in joint development activity
with multinational and independent customers
– Continued roll-out of e-cig offering in Europe
and North America → benefit in H2
• Continued development in Scientific
Services
– New dedicated e-cig testing facility
• Geographic footprint enhanced
– Further expansion in Dubai
– Strong growth in Hungary
• Announced a 45-day consultation period
regarding the proposed transfer of activities
to Hungary and consequent closure of
Jarrow site
8
Further investment in high speed combining equipment in
Thailand
New product launches to meet the market trends in both traditional
tobacco and smokeless segments

SPECIALIST TECHNOLOGIES
• Result driven exclusively by impact of industry
weakness on Pipe Protection Technologies
– LFL ex-PPT +6% o/w:
• Extrusion +14%
• Porous Technologies +4%
• Benefit of new contracts and commercialisation of
recent wins in Porous Technologies
– Continued momentum in speciality wipes
– Growth in advanced wound care and products using
porous plastics
– Benefit from portfolio expansion in nibs
– Accelerated demand for recent home care innovations
• Continued business wins and positive momentum
in Extrusion
– Esp. furniture, water treatment and POS segments
• Significant reduction in Oil & Gas activity → PPT
LFL -63%
– Margin mix impact offset significant improvement in
Porous and Extrusion (OM ex-PPT +430bps)
– Industry conditions remain uncertain
9
Investment in innovative, high speed extrusion equipment
for new manufacturing process
Further development of products using porous
plastics

PPT IN CONTEXT
10
0
10
20
30
40
50
FY14A Feb-15 View Jun-15 View
50
20
PPT revenue (£m)
35
Uncertain outlook, but industry data seems to have plateaued …
$0
$20
$40
$60
$80
$100
$120
0
500
1,000
1,500
2,000
2,500
3,000
Rig Counts Per Month Oil Price
© 2013 ESSENTRA PLC
© 2013 ESSENTRA PLC
© 2013 ESSENTRA PLC

EUROPE HY 2015 REVENUE: £270.3M
• Strong performance in Industrial, Health &
Personal Care and Furniture segments
– Supported by Food & Drink and Tobacco
• Expansion of metal hardware in existing
and export markets
– Boosted by range expansion and roll-out of
Abric Seals portfolio
• Good growth in speciality wipes and core
healthcare packaging offering, including
authentication solutions
• Enhanced project conversion rates and
cross-selling opportunities for extruded
plastics
• Benefit of new innovative tapes and labels
to FMCG sectors
• Clondalkin SPD performing well to-date
– Sizeable contract wins and strong progress
on synergy savings 11 Components range expansion in springs and magnets
Investment in modern, high-speed combining filter
manufacturing equipment in Hungary
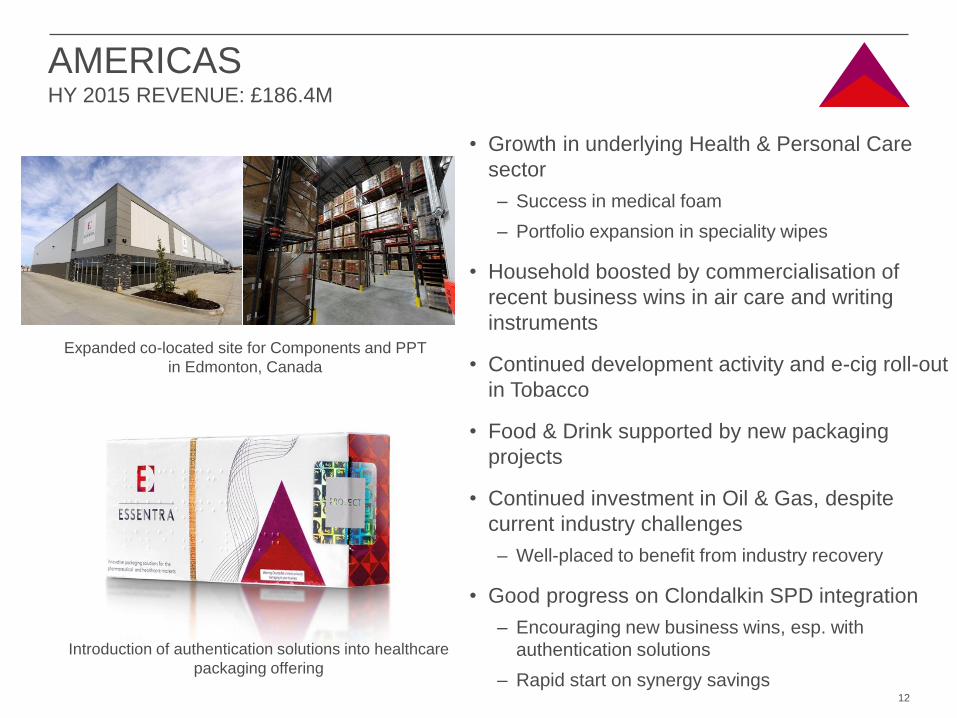
AMERICAS HY 2015 REVENUE: £186.4M
12
• Growth in underlying Health & Personal Care
sector
– Success in medical foam
– Portfolio expansion in speciality wipes
• Household boosted by commercialisation of
recent business wins in air care and writing
instruments
• Continued development activity and e-cig roll-out
in Tobacco
• Food & Drink supported by new packaging
projects
• Continued investment in Oil & Gas, despite
current industry challenges
– Well-placed to benefit from industry recovery
• Good progress on Clondalkin SPD integration
– Encouraging new business wins, esp. with
authentication solutions
– Rapid start on synergy savings
Expanded co-located site for Components and PPT
in Edmonton, Canada
Introduction of authentication solutions into healthcare
packaging offering

ASIA HY 2015 REVENUE: £93.7M
13
• Growth across all markets
– Particularly good progress in India in the Industrial
sector
– Scope for improvement in China
• Strong performance in Tobacco
– Joint development activity with key multinational
customers
– Excellent performance in flavoured and special filters
– Further expansion and strong result in Dubai JV
• Benefit in Household from transferring nib activity
to Indonesia from South Korea
– Annualised cost savings of c. £1m
• New Components site opened in Sydney
• Rapid integration of acquisitions in Malaysia and
Australia
– Launch of Securing Solutions brochure, integrating
Abric Seals range
– >13,000 new products available to order from the
combined Components website in Australia
Investment in writing instrument nib capability in
Indonesia
Launch of new Securing Solutions brochure

© 2013 ESSENTRA PLC
FINANCIAL REVIEW
Matthew Gregory
Group Finance Director
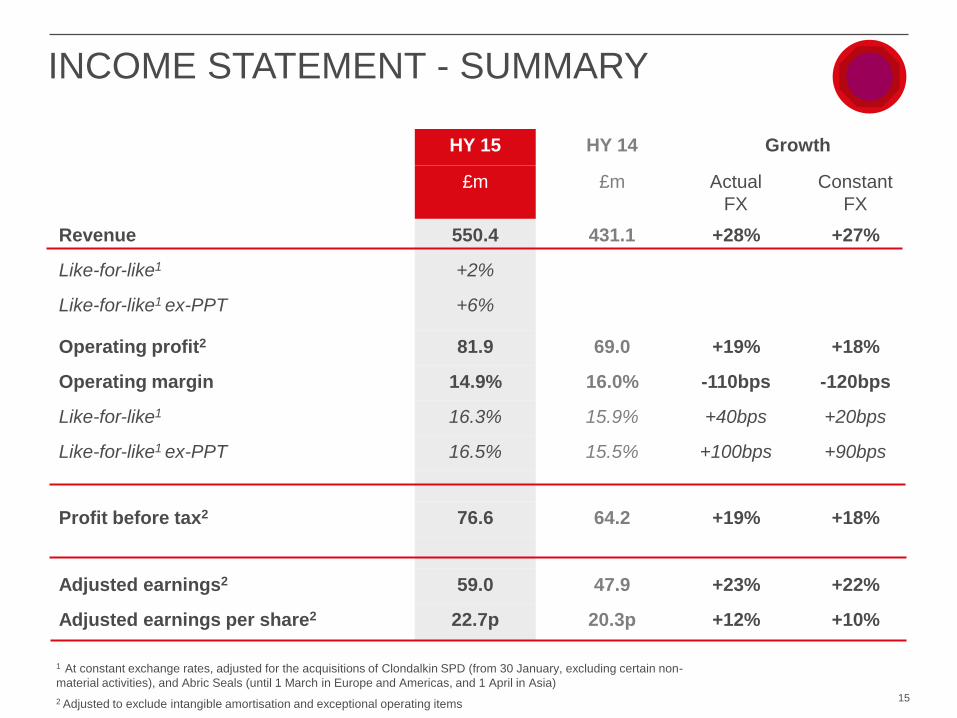
INCOME STATEMENT - SUMMARY
1 At constant exchange rates, adjusted for the acquisitions of Clondalkin SPD (from 30 January, excluding certain non-
material activities), and Abric Seals (until 1 March in Europe and Americas, and 1 April in Asia)
2 Adjusted to exclude intangible amortisation and exceptional operating items
HY 15 HY 14 Growth
£m £m Actual
FX
Constant
FX
Revenue 550.4 431.1 +28% +27%
Like-for-like1 +2%
Like-for-like1 ex-PPT +6%
Operating profit2 81.9 69.0 +19% +18%
Operating margin 14.9% 16.0% -110bps -120bps
Like-for-like1 16.3% 15.9% +40bps +20bps
Like-for-like1 ex-PPT 16.5% 15.5% +100bps +90bps
Profit before tax2 76.6 64.2 +19% +18%
Adjusted earnings2 59.0 47.9 +23% +22%
Adjusted earnings per share2 22.7p 20.3p +12% +10%
15
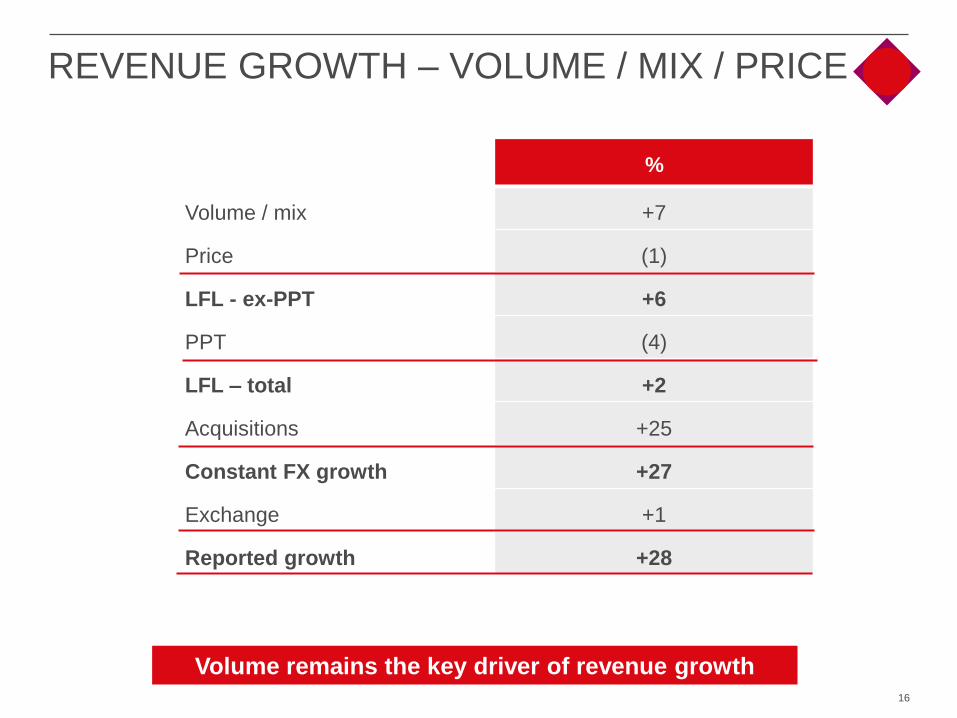
REVENUE GROWTH – VOLUME / MIX / PRICE
16
Volume remains the key driver of revenue growth
%
Volume / mix +7
Price (1)
LFL - ex-PPT +6
PPT (4)
LFL – total +2
Acquisitions +25
Constant FX growth +27
Exchange +1
Reported growth +28
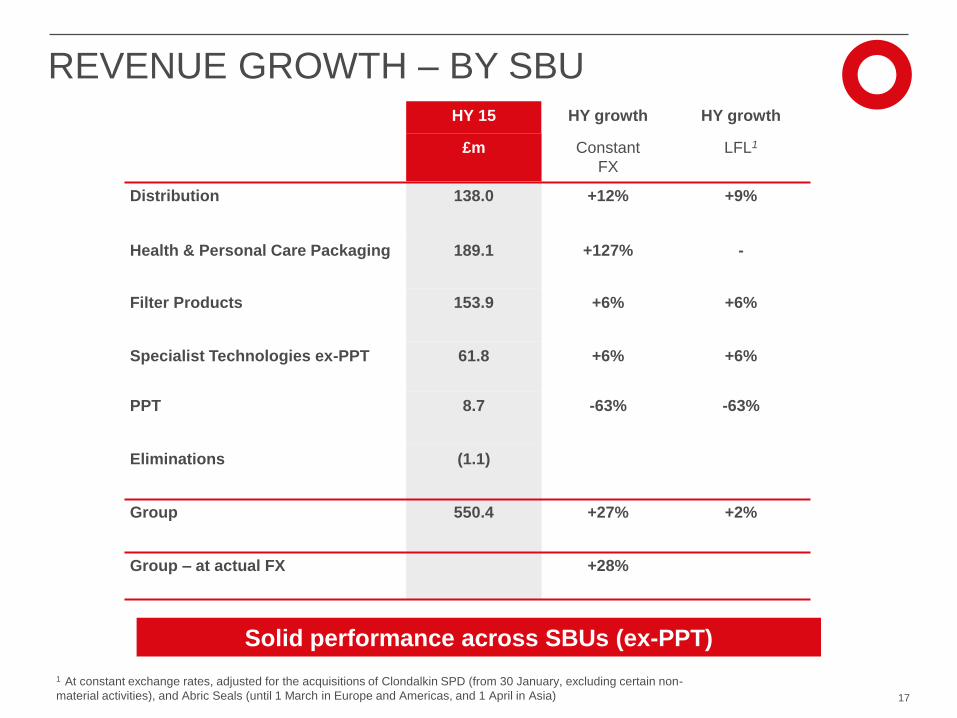
REVENUE GROWTH – BY SBU HY 15 HY growth HY growth
£m Constant
FX
LFL1
Distribution 138.0 +12% +9%
Health & Personal Care Packaging 189.1 +127% -
Filter Products 153.9 +6% +6%
Specialist Technologies ex-PPT 61.8 +6% +6%
PPT 8.7 -63% -63%
Eliminations (1.1)
Group 550.4 +27% +2%
Group – at actual FX
+28%
Solid performance across SBUs (ex-PPT)
17
1 At constant exchange rates, adjusted for the acquisitions of Clondalkin SPD (from 30 January, excluding certain non-
material activities), and Abric Seals (until 1 March in Europe and Americas, and 1 April in Asia)

REVENUE GROWTH – BY REGION1
HY 15 HY growth HY growth
£m Constant
FX
LFL2
Europe 270.3 +27 +4
Americas 186.4 +33 -8
Americas ex-PPT 178.3 +53 +3
Asia 93.7 +16 +13
Group 550.4 +27% +2%
Group – at actual FX
+28%
18
1 Revenue by destination
2 At constant exchange rates, adjusted for the acquisitions of Clondalkin SPD (from 30 January, excluding certain non-
material activities), and Abric Seals (until 1 March in Europe and Americas, and 1 April in Asia)

OPERATING PROFIT1
– KEY MOVEMENTS
1Adjusted to exclude intangible amortisation and exceptional operating items 19
69.0
88.3
4.5 0.8
10.2 1.6
4.6
10.0
81.9
6.4
HY 2014 FiltersClosure(2014)
Currency Acquisitions Raw material& other input
costs
Net pricingimpact
Volume, mix&
efficiencies
HY 2015Excluding
PPT
Impact ofPPT volume
decrease
HY 2015
£m

OPERATING PROFIT1
BY SBU
Adjusted1 operating profit
HY 15 Growth Margin
£m Constant
FX
Distribution 32.4 +5%
Health & Personal Care Packaging 22.4 +48%
Filter Products 23.8 +32%
Specialist Technologies ex-PPT 11.9 +37%
PPT
0.2 -98%
Central Services (8.8)
Group
81.9 +18%
Group – at actual FX
+19%
1 Adjusted to exclude intangible amortisation and exceptional operating items
23.5%
15.5%
11.8%
19.3%
1.7%
20

HY 15 Growth
£m Actual
FX
Constant
FX
Operating profit1 81.9 +19% +18%
Net finance charge (5.3)
Profit before tax1 76.6 +19% +18%
Taxation (17.6)
- Underlying tax rate 23.0%
Net income1 59.0 +23% +22%
Adjusted earnings1 58.7 +24% +22%
EPS - adjusted1 22.7p +12% +10%
EPS – diluted, adjusted1 22.3p +12% +11%
INCOME STATEMENT – CONTINUED
1 Adjusted to exclude intangible amortisation of £15.2m and an exceptional pre-tax charge of £16.3m
21
Tax rate down
240bps
Lower pension
interest income
Impact of share
placing

EXCEPTIONAL OPERATING ITEMS
HY 15
£m
Acquisition fees 0.1
Acquisition integration & restructuring costs 18.2
Other (2.0)
Total exceptional operating items 16.3
22
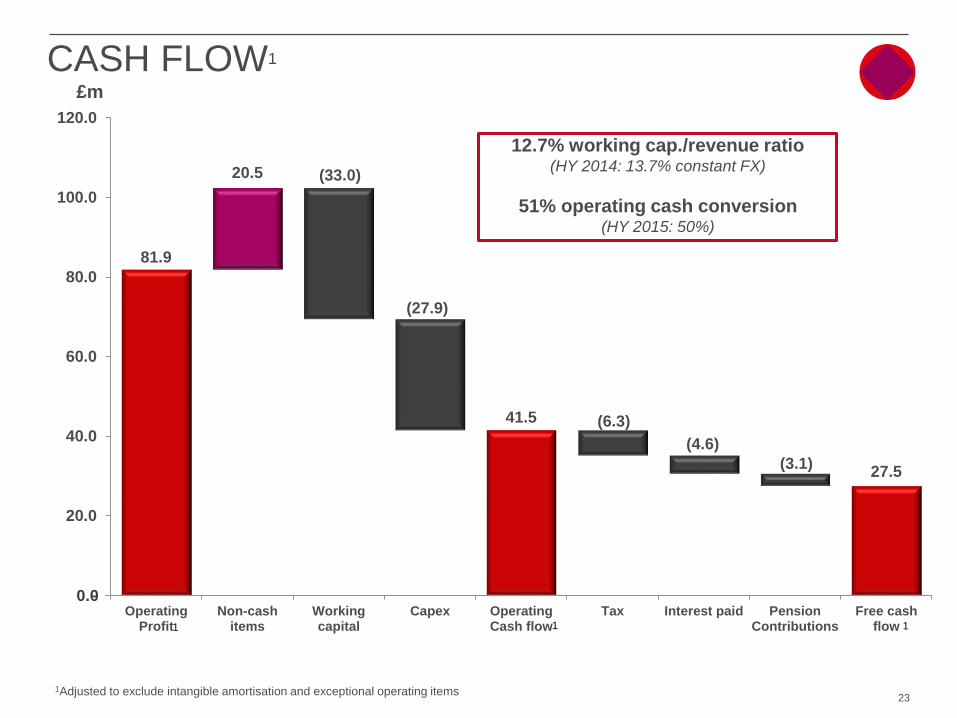
81.9
41.5
27.5
20.5
(27.9)
(33.0)
(6.3)
(4.6)
(3.1)
-
20.0
40.0
60.0
80.0
100.0
120.0
OperatingProfit
Non-cashitems
Workingcapital
Capex OperatingCash flow
Tax Interest paid PensionContributions
Free cashflow1 1 1
0.0
CASH FLOW1
1Adjusted to exclude intangible amortisation and exceptional operating items 23
12.7% working cap./revenue ratio (HY 2014: 13.7% constant FX)
51% operating cash conversion (HY 2015: 50%)
£m
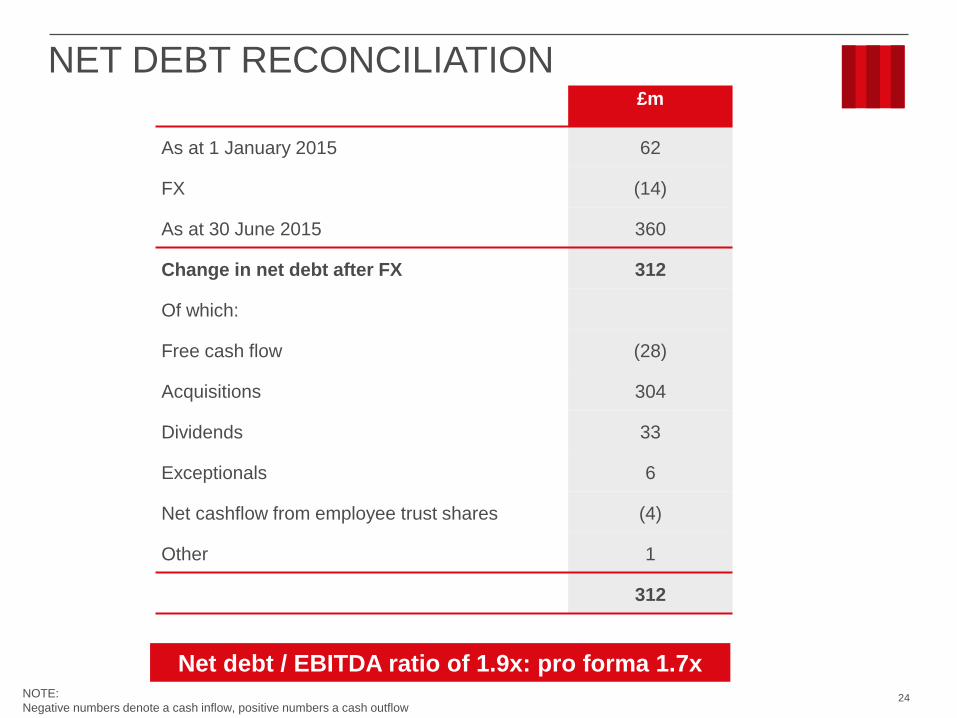
£m
As at 1 January 2015 62
FX (14)
As at 30 June 2015 360
Change in net debt after FX 312
Of which:
Free cash flow (28)
Acquisitions 304
Dividends 33
Exceptionals 6
Net cashflow from employee trust shares (4)
Other 1
312
NET DEBT RECONCILIATION
NOTE:
Negative numbers denote a cash inflow, positive numbers a cash outflow
Net debt / EBITDA ratio of 1.9x: pro forma 1.7x
24
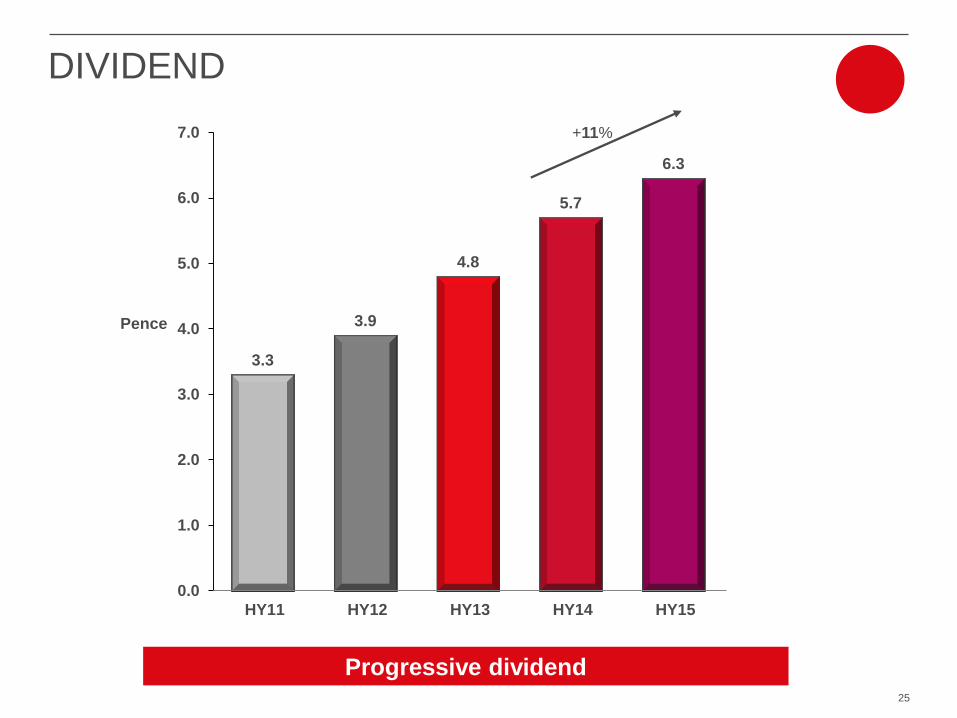
3.3
3.9
4.8
5.7
6.3
0.0
1.0
2.0
3.0
4.0
5.0
6.0
7.0
HY11 HY12 HY13 HY14 HY15
Pence
DIVIDEND
+11%
Progressive dividend 25

© 2013 ESSENTRA PLC
2015 OUTLOOK
Colin Day
Chief Executive

HOW WE’RE DOING
27 We’ve done well, but can do better in a number of areas
What’s gone well … … and what we need to
improve
Distribution • Components - Continental Europe and much
of Asia Pacific
• Speciality Tapes - US
• Abric and Specialty Plastics integration
• Launch of custom business
• Components - North America, UK
and China
• Speciality Tapes – UK
• Leverage eCommerce platform
H&PC Packaging • Contract wins with blue-chip customers
• Retention of Clondalkin SPD business
• Fast start on integration
• Better management of commercial
success
Filter Products • Commercialisation of recent contract wins
• Further joint development activity with
multinationals and independents
• Expansion of Dubai JV
• Maintain momentum behind new
product innovation and e-cig roll-
out
Porous Technologies • New business wins
• Acceleration of recent launches
• Product development / technology expansion
(eg, filtration products, nibs, speciality wipes)
• Cost-based management
• Ongoing focus on:
‒ Larger opportunities
‒ Speed to market
• Continue to manage Printer
Systems in a maturing market
PPT • Actions to address cost base / headcount
• Management resolve
-
Extrusion • New business wins in attractive segments
• Widening product appeal in new markets
• Strong margin improvement
• Managing capacity
• Reducing project lead time
• Geographical reach

H2 slightly better than H1
• Improvement in North American Components
• Better management of commercial success in core H&PC Packaging
• Additional 1 month benefit from Clondalkin SPD acquisition
• Continued leverage of new business wins and revenue synergy delivery
• Maintain rapid pace of Clondalkin SPD integration
• Ongoing focus on cost / headcount reduction and efficiency initiatives
• Continued progress on treasury / tax
• Further strong cash flow generation and disciplined capital management
2015: SUMMARY
28
Well-placed to deliver balanced, profitable growth in 2015
1 At constant exchange rates

© 2013 ESSENTRA PLC
APPENDICES

INCOME STATEMENT – REPORTED BASIS
HY 15 Growth
£m Actual
FX
Constant
FX
Adjusted operating profit 81.9 +19% +18%
Intangible amortisation (15.2)
Exceptional operating items (16.3)
Reported operating profit 50.4 -7% -8%
Net finance charge (5.3)
Profit before tax 45.1 -8% -10%
Taxation (9.5)
- Underlying tax rate 23.0%
Net income 35.6 -1% -2%
EPS 13.7p -10% -12%
EPS - diluted 13.4p -9% -11%
30

EXCHANGE RATES
Six months ending 30 June 2015 Average Closing
US $/£ 1.53 1.57
Euro €/£ 1.36 1.41
Impact of a one cent change per annum Op. Profit (£m)
US $/£ 0.2
Euro €/£ 0.1
Six months ending 30 June 2014 Average Closing
US $/£ 1.67 1.71
Euro €/£ 1.22 1.25
31

DISCLAIMER
IMPORTANT LEGAL NOTICE
THIS DOCUMENT IS STRICTLY CONFIDENTIAL TO THE RECIPIENT AND HAS BEEN SUBMITTED TO YOU SOLELY FOR YOUR INFORMATION. THE RECIPIENT MAY NOT REPRODUCE OR REDISTRIBUTE ANY PART OF THIS DOCUMENT TO ANY PERSON IN ANY FORM.
THIS DOCUMENT AND THE PRESENTATION TO WHICH IT RELATES (“PRESENTATION”) NEITHER CONSTITUTES, NOR FORMS PART OF, AN ISSUE FOR SALE OR SUBSCRIPTION OF, OR SOLICITATION OF ANY OFFER OR INVITATION TO SUBSCRIBE FOR, UNDERWRITE OR OTHERWISE ACQUIRE OR DISPOSE OF ANY SECURITIES OF ESSENTRA PLC (THE “COMPANY”) NOR SHOULD IT OR ANY PART OF IT FORM THE BASIS OF, OR BE RELIED ON IN CONNECTION WITH, ANY CONTRACT OR COMMITMENT WHATSOEVER WHICH MAY AT ANY TIME BE ENTERED INTO BY THE RECIPIENT OR ANY OTHER PERSON, NOR DOES IT CONSTITUTE AN INVITATION OR INDUCEMENT TO ENGAGE IN INVESTMENT ACTIVITY UNDER SECTION 21 OF THE UK FINANCIAL SERVICES AND MARKETS ACT 2000, NOR DOES IT CONSTITUTE AN INVITATION TO EFFECT ANY TRANSACTION WITH THE COMPANY OR TO MAKE USE OF ANY SERVICES PROVIDED BY THE COMPANY.
THE DISTRIBUTION OF THIS DOCUMENT IN OTHER JURISDICTIONS MAY BE RESTRICTED BY LAW AND PERSONS INTO WHOSE POSSESSION THIS DOCUMENT COMES SHOULD INFORM THEMSELVES ABOUT, AND OBSERVE, ANY SUCH RESTRICTIONS.
WHILE THE INFORMATION IN THIS DOCUMENT AND THE OPINIONS ARE BASED ON SOURCES BELIEVED TO BE RELIABLE THE COMPANY HAS NOT INDEPENDENTLY VERIFIED THE CONTENTS OF THIS DOCUMENT. ACCORDINGLY, NO REPRESENTATION OR WARRANTY, EXPRESS OR IMPLIED, IS MADE AS TO AND NO RELIANCE SHOULD BE PLACED ON THE FAIRNESS, ACCURACY, COMPLETENESS OR CORRECTNESS OF THE INFORMATION OR OPINIONS CONTAINED IN THIS DOCUMENT OR IN ANY PRESENTATION OR OTHER COMMUNICATION (WHETHER WRITTEN OR ORAL) ACCOMPANYING THIS DOCUMENT. THE INFORMATION AND OPINIONS CONTAINED IN THIS DOCUMENT OR THE PRESENTATION ARE PROVIDED AS AT THE DATE OF THIS PRESENTATION AND ARE SUBJECT TO CHANGE WITHOUT NOTICE. NEITHER THE COMPANY NOR ITS SHAREHOLDERS NOR ANY OF THEIR ASSOCIATES OR AFFILIATES NOR ANY OF THEIR RESPECTIVE DIRECTORS, MEMBERS, OFFICERS OR EMPLOYEES SHALL HAVE ANY LIABILITY WHATSOEVER FOR ANY LOSS HOWSOEVER ARISING DIRECTLY OR INDIRECTLY FROM ANY USE OF THIS DOCUMENT OR ITS CONTENTS OR OTHERWISE ARISING IN CONNECTION THEREWITH.
NEITHER THE INFORMATION IN THIS DOCUMENT NOR THE PRESENTATION SHOULD NOT BE INTERPRETED AS A PROFIT FORECAST NOR SHOULD ANY INFORMATION CONTAINED HEREIN BE INTERPRETED TO MEAN THAT THE FUTURE EARNINGS PER SHARE OF THE COMPANY WILL NECESSARILY MATCH OR EXCEED THE HISTORICAL PUBLISHED EARNINGS PER SHARE. PAST PERFORMANCE CANNOT BE RELIED ON AS A GUIDE TO FUTURE PERFORMANCE.
ALL STATEMENTS OTHER THAN STATEMENTS OF HISTORICAL FACTS INCLUDED IN THIS PRESENTATION, INCLUDING, WITHOUT LIMITATION, THOSE REGARDING THE COMPANY’S FINANCIAL POSITION, BUSINESS STRATEGY, PLANS AND OBJECTIVES OF MANAGEMENT FOR FUTURE OPERATIONS (INCLUDING DEVELOPMENT PLANS AND OBJECTIVES RELATING TO THE COMPANY’S SERVICES) ARE 'FORWARD-LOOKING STATEMENTS'. FORWARD-LOOKING STATEMENTS INVOLVE KNOWN AND UNKNOWN RISKS, UNCERTAINTIES AND OTHER IMPORTANT FACTORS THAT COULD CAUSE THE ACTUAL RESULTS, PERFORMANCE OR ACHIEVEMENTS OF THE COMPANY OR THOSE MARKETS AND ECONOMIES TO BE MATERIALLY DIFFERENT FROM FUTURE RESULTS, PERFORMANCE OR ACHIEVEMENTS EXPRESSED OR IMPLIED BY SUCH FORWARD-LOOKING STATEMENTS. THESE RISKS AND UNCERTAINTIES INCLUDE INTERNATIONAL, NATIONAL AND LOCAL CONDITIONS AND OTHER FACTORS INCLUDING THOSE DESCRIBED UNDER “MANAGEMENT OF PRINCIPAL RISKS” IN THE COMPANY’S ANNUAL REPORT AND ACCOUNTS. SUCH FORWARD-LOOKING STATEMENTS ARE BASED ON NUMEROUS ASSUMPTIONS REGARDING THE COMPANY’S PRESENT AND FUTURE BUSINESS STRATEGIES AND THE ENVIRONMENT IN WHICH THE COMPANY WILL OPERATE IN THE FUTURE AND SUCH ASSUMPTIONS MAY OR MAY NOT PROVE TO BE CORRECT. THESE FORWARD-LOOKING STATEMENTS SPEAK ONLY AS AT THE DATE OF THIS PRESENTATION. THE COMPANY EXPRESSLY DISCLAIMS ANY OBLIGATION (OTHER THAN PURSUANT TO LAW) OR UNDERTAKING TO DISSEMINATE ANY UPDATES OR REVISIONS TO ANY FORWARD-LOOKING STATEMENTS CONTAINED HEREIN TO REFLECT ANY CHANGE IN THE COMPANY’S EXPECTATIONS WITH REGARD THERETO OR ANY CHANGE IN EVENTS, CONDITIONS OR CIRCUMSTANCES ON WHICH ANY SUCH STATEMENT IS BASED.

INVESTOR PRESENTATION
Half Year 2015 Results
31 JULY 2015