INVESTOR PRESENTATION Dabur India LtdDabur India Ltd · Dabur Overview One of the oldest ... •...
35
INVESTOR PRESENTATION Dabur India Ltd Dabur India Ltd
Transcript of INVESTOR PRESENTATION Dabur India LtdDabur India Ltd · Dabur Overview One of the oldest ... •...

INVESTOR PRESENTATION
Dabur India LtdDabur India Ltd
FMCG Growth Drivers
Overview FMCG G th D iOverview FMCG Growth Drivers
Rising income drivingFourth largest sector in the economy
Rising income driving purchases
Growth of Modern Trade & Ecommerce
Current size of the Indian FMCG Market is around USD 45 bn*
Low penetration and Consumption
Evolving consumer lifestyle
Grown at an annual average of 11 per cent over the last decade *
Evolving consumer lifestyle
Favorable demographics
Urban segment is the largest contributor to the sector- accounting for two-thirds of total revenue
1
Sector is likely to touch sales of USD 100 bn by 2020
*Source:IBEF
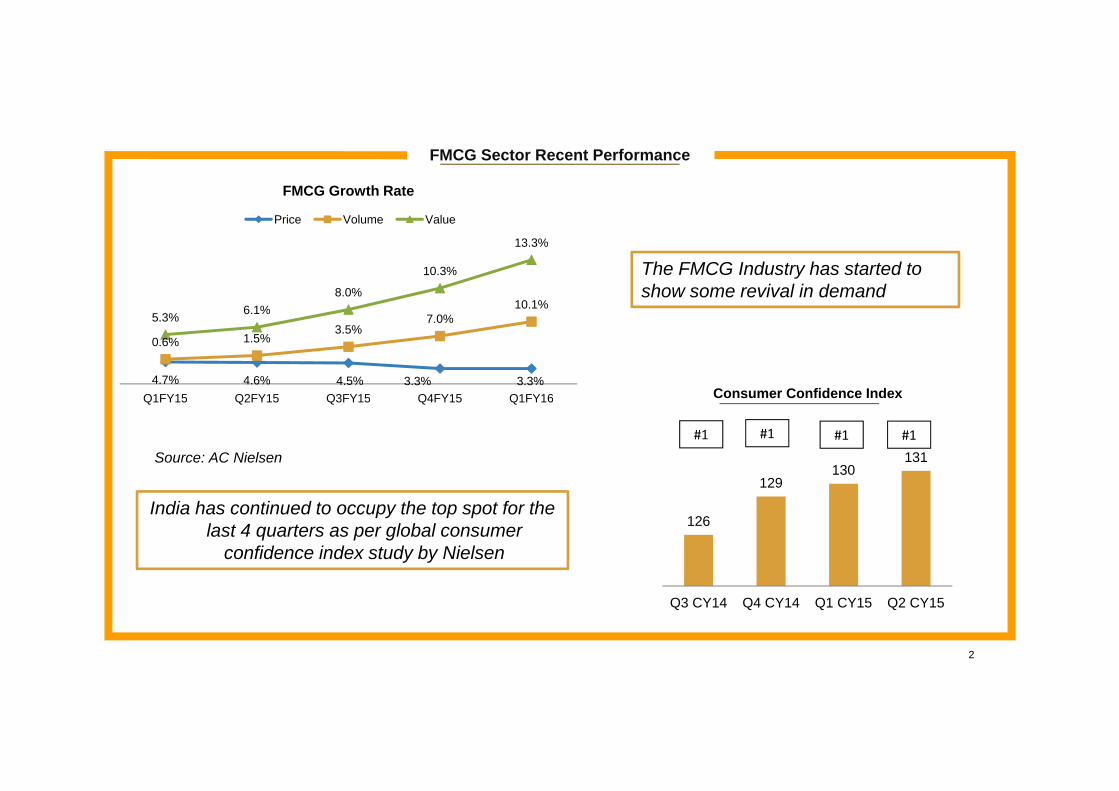
FMCG Sector Recent Performance
FMCG Growth Rate
P i V l V l
The FMCG Industry has started to show some revival in demand
10 1%6 1%8.0%
10.3%
13.3%
Price Volume Value
Consumer Confidence Index4.7% 4.6% 4.5% 3.3% 3.3%
0.6% 1.5%3.5%
7.0%10.1%
5.3% 6.1%
Q1FY15 Q2FY15 Q3FY15 Q4FY15 Q1FY16
Source: AC Nielsen#1 #1 #1 #1
Consumer Confidence IndexQ1FY15 Q2FY15 Q3FY15 Q4FY15 Q1FY16
129130
131
India has continued to occupy the top spot for the last 4 quarters as per global consumer
confidence index study by Nielsen
126
129
2
Q3 CY14 Q4 CY14 Q1 CY15 Q2 CY15

Dabur Overview
One of the oldest and largest FMCG Companies in the country
Dabur Gastrina wins Silver at Cannes 2015
Dedicated to the Health and Well- Being of every household
World’s largest in Ayurveda and natural Dabur ranked amongst g yhealthcare
20 world class manufacturing facilities catering to needs of diverse markets
India's Super 50 Companies by Forbes India Ltd
Strong overseas presence with 31% contribution to consolidated sales Brave and Beautiful campaign
bags Blue Elephant at Kyoorius Awards 2015 in
‘Advertising for Good’
3
Advertising for Good category

• Established by Dr SK Burman in Kolkata1884
Key Milestones
• Came out with first public issue1994
• Inducted professional management• Inducted professional management1998
• Crossed the 1000 crs turnover mark2000
• Dabur acquired Balsara2005
• Acquired Fem Pharma20082008
• Acquired Hobi and Namaste2010
• Dabur crosses billion dollar turnover mark2012
4

Global Business Footprint
TurkeyUK
U.S. EgyptUAE
Nepal
B’Desh
Nigeria Sri Lanka
Manufacturing FacilitiesKey markets
5

Domestic Distribution Structure
FactoryFactoryTotal reach at 5.3 mn retail outlets,
DepotDepot (Carry & Forward Agents)
one of the highest among FMCG companies
Insti StockistsInsti StockistsStockistsStockists Super stockistsSuper stockists
Modern TradeStockist
Modern TradeStockist
WholesalersWholesalers
Retail tradeRetail trade
Sub stockistsSub stockists
Rural tradeRural trade
Insti customers Insti customers Retail trade Retail trade
Shoppers & Consumers
6

Sales
Dabur Performance Snapshot
466.540.852.8 61.5 70.7 78.1
Market Capin INR bn
in INR bn
167.2 185.4238.9
313.1
FY11 FY12 FY13 FY14 FY15167.2
FY11 FY12 FY13 FY14 FY1510 7
Profit After Tax
in INR bnFY11 FY12 FY13 FY14 FY15
5.7 6.4 7.69.1
10.7
Robust profitable growth translating into superior shareholder returns
FY11 FY12 FY13 FY14 FY15
7

Strong Financial Profile
Net Worth (INR Bn)ROIC
13 917.2
21.026.6
33.5
32.7% 34.0%38.3%
43.6% 45.2%
13.9
FY11 FY12 FY13 FY14 FY15 FY11 FY12 FY13 FY14 FY15
20.4%
18 2%18.9%
*EBITDA Margin
3 74.4
5.26.1EPS
17.9% 17.8% 18.2% 3.33.7
8
FY11 FY12 FY13 FY14 FY15 FY11 FY12 FY13 FY14 FY15*includes Non- Operating income
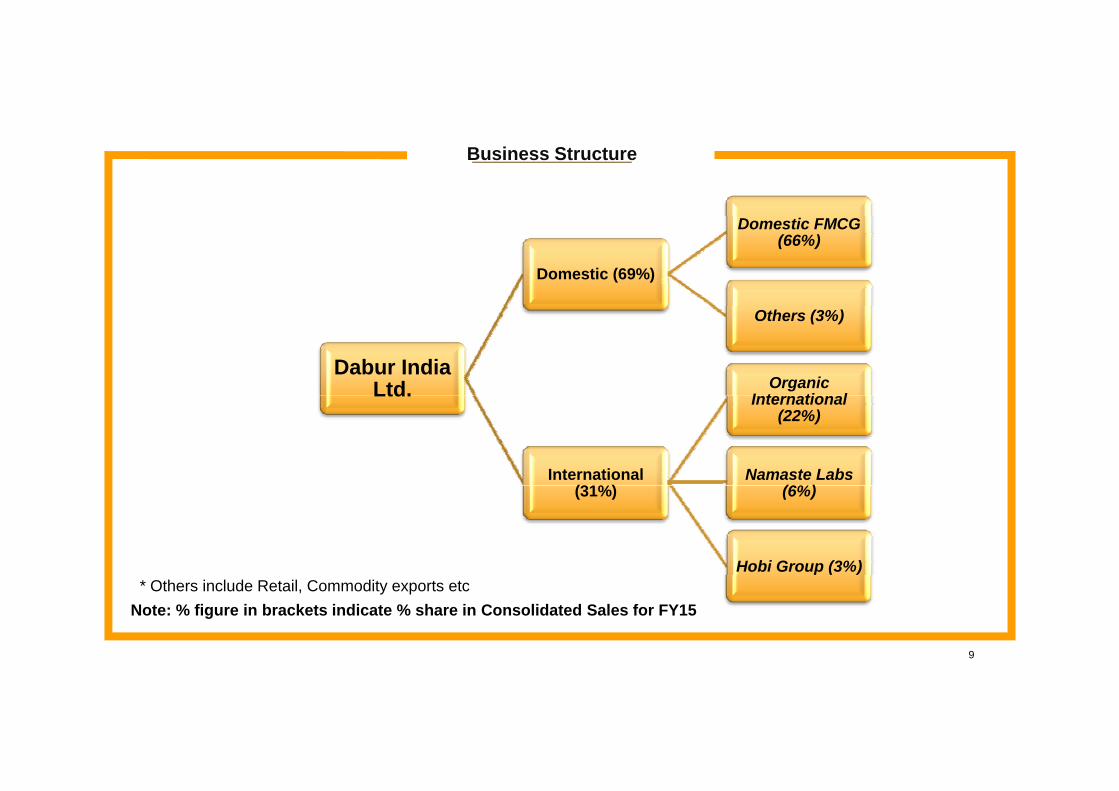
Business Structure
Domestic (69%)
Domestic FMCG (66%)
Dabur India Ltd.
Others (3%)
Organic I t ti lLtd.
International (31%)
International (22%)
Namaste Labs (6%)(31%) (6%)
Hobi Group (3%)
Note: % figure in brackets indicate % share in Consolidated Sales for FY15* Others include Retail, Commodity exports etc
9

Sales By Business Vertical
HealthcareDomestic FMCG Business FY15
Health HPC Foods
Domestic
Healthcare(33%)
HPC(48%)
Healthcare
HPC Foods
Health Supplements
18%
DigestivesSkin CareFoods19%
FMCG* HPC(48%)
Foods(19%)
6%
OTC & Ethicals
9%
Hair Care23%
Home Care
Oral Care14%
5%
Europe12%
International Sales FY15
Home Care6%
International Business Region Wise Breakdown
Middle East32%
America16%
12%
Africa23%
Asia17%
* Breakdown of Domestic FMCG business basis FY15 Sales
10

INR 10bn+ INR 1bn+
Continue to build bigger brands
14 brands with turnover of INR 1bn+ with 3 brands over 10bn
11

Competitive Position
We continue to lead across verticals- Healthcare , HPC and Foods
#Relative Competitive Position
#1 #1 #2 #2 #2 #1 #1 #2 #3 #1 #1
H d P l C Foods
* Position basis Nielsen Market Share data MAT June’15
Healthcare Home and Personal Care Foods
12

Domestic Growth Strategy
Continued Focus on InnovationContinued Focus on Innovation
Building Consumer ConnectBuilding Consumer Connect
Distribution ExpansionDistribution Expansion
Focus on Health and well beingFocus on Health and well being
13

Continued Focus on Innovation
14

Recently launched
India
Dabur Almond Shampoo
Hajmola Yoodley- Six flavours Real Wellnezz- JamunDabur Baby Massage
OilShampoo flavoursOil
International
15
Dermoviva Baby Range- Olive Enriched Powder and Olive Baby Soap
Vatika Naturals Damage Repair Leave On Cream
Vatika Shampoo- Black Olive

Product Evolution
Chyawanprash
Red Toothpowder
Hajmola
Amla Hair Oil
16

Building Consumer Connect
17
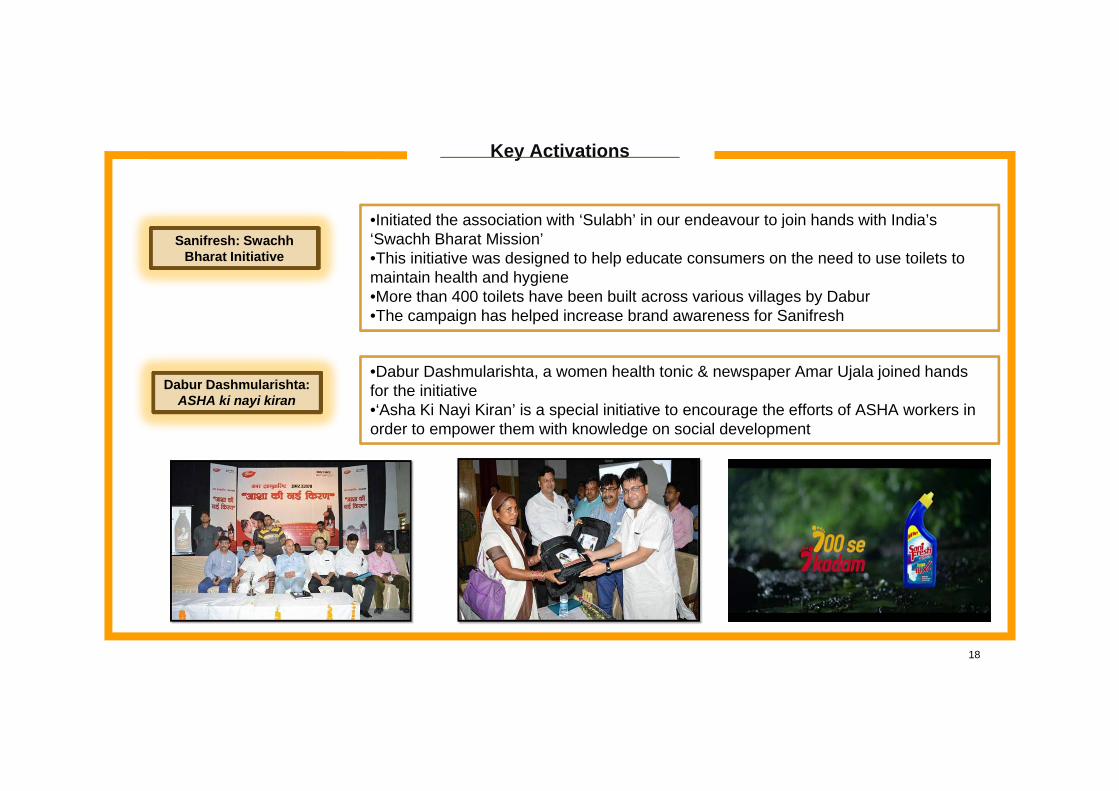
Key Activations
I iti t d th i ti ith ‘S l bh’ i d t j i h d ith I di ’Sanifresh: Swachh
Bharat Initiative
•Initiated the association with ‘Sulabh’ in our endeavour to join hands with India’s ‘Swachh Bharat Mission’•This initiative was designed to help educate consumers on the need to use toilets to maintain health and hygiene•More than 400 toilets have been built across various villages by Dabur
Dabur Dashmularishta:ASHA ki i ki
•The campaign has helped increase brand awareness for Sanifresh
•Dabur Dashmularishta, a women health tonic & newspaper Amar Ujala joined hands for the initiativeASHA ki nayi kiran for the initiative•‘Asha Ki Nayi Kiran’ is a special initiative to encourage the efforts of ASHA workers in order to empower them with knowledge on social development
18

Increasing Doctor AdvocacyProject LEAD: Leveraging Through Empowered Anchoring & Detailing
• Front end teams to be separated for Healthcare (OTC & Ethicals) and the rest of the Domestic FMCG business to have focused attention on both segments of the business
Doctor Advocacy is the key to enhance consumer franchise
• Demand generation from doctors shall be the key focus:
Advocacy platform being built
Both Ayurvedic and Allopathic doctor reach to be ramped upy p p p
Building the detailing team- Around 170 Medical representatives hired; Number will increase to 275 by end of the fiscal
Head of business inducted for Medical detailing and marketing
IT Platform and hand held devices for seamless information flow for the detailing team
Doctor Detailing for Dabur Products i h d h ld d iusing hand held devices
19

Distribution ExpansionDistribution Expansion
20

Enhancing Reach
R ll d t i FY13 t d di t i l k t
Project Double
• Rolled out in FY13 to expand direct coverage in rural markets• Direct Village coverage has increased from 14000 villages in FY11 to 44,000
villages in FY15• We plan to increase the coverage to 50,000 villages in FY16 and 60,000 in FY17
Project 50-50• Aimed at leveraging the potential of Top 130 towns which contribute to 50% of
urban consumptionProject 50-50 urban consumption• Segregating the grocery channel teams for wholesale & retail• Initiative is in line with renewed focus on urban markets
Project Core• To enhance chemist coverage and provide further impetus to our Health Care
portfolio• Direct Chemist Coverage is currently 213,000 g y ,• Strategy is to increase coverage and range for better throughput
21

Focus on Health and Well beingg
22

Health & Well Being
Health & Well being - The underlying theme across the portfolio
• Ayurveda – Dabur’s core philosophy
• Pioneered extension of Ayurveda into personal care and OTC healthcarey p
Dab r Hone Dabur Baby Massage Oil Innovations in Focus on AyurvedicDabur HoneyWeight Management
Dabur Baby Massage OilFree of paraffin and parabens -
Safe for babiesHealthcare Category
Focus on AyurvedicOTC- No.1 in Women
Health Tonics
23

Health & Well Being
Health & Well Being focus has been extended to HPC and Foods
Red Tooth Paste-Focused on Ingredient
Effectiveness
Recently introduced the
‘Real Wellnezz” Effectiveness range with the Jamun flavour
OdomosProtection from Dengue
Sanifresh- Toilet CleanerTo safeguard the health of the
ActivJuices for aTo safeguard the health of the
family by ensuring hygiene
24
Juices for a healthy lifestyle

International Business Overview
23108 24226In INR Mn
Middle East Africa South
Asia
8992
1616118338 Key Markets
Hair Care
Skin Care
Oral Care
Key Categories
FY11 FY12 FY13 FY14 FY15
•Comprises 31% of Consolidated Sales in FY15
FY11 FY12 FY13 FY14 FY15
Europe
International Sales FY15
•Localized supply chain network for efficient business operations
•Sustained investment in brands and innovation to grow the topline
•Business foray had been entirely organic since 1980’s until
Middle East32%
Asia
America16%
12%
•Business foray had been entirely organic since 1980 s, until FY2010-11 when we acquired Hobi Group and Namaste Labs
25
Africa23%
Asia17%

International- Competitive Position
44.1%
Hair Cream* No.1 Position in the Hair CreamCategory in KSA, UAE andEgypt
36.5% 36.6%
gyp
KSA UAE Egypt
64.8% 67.3%No 1 Position in the Hair OilsHair Oils*
S
27.5%No.1 Position in the Hair OilsCategory in KSA & Egypt andNo.2 in UAE
KSA UAE Egypt
*Volume Market Share Mat March 2015
26
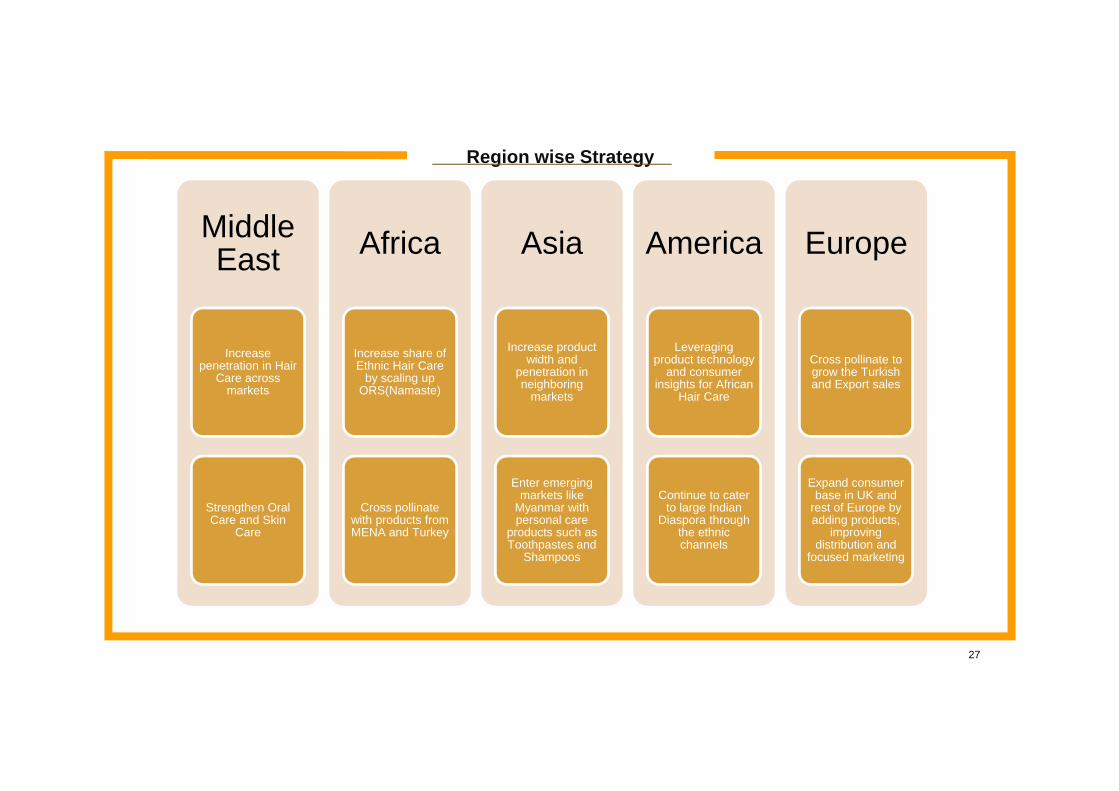
Region wise Strategy
MiddlMiddle East Africa Asia America Europe
Increase penetration in Hair
Care across markets
Increase share of Ethnic Hair Care
by scaling up ORS(Namaste)
Increase product width and
penetration in neighboring
markets
Leveraging product technology
and consumer insights for African
Hair Care
Cross pollinate to grow the Turkish and Export sales( ) markets
Enter emerging
Hair Care
Expand consumer
Strengthen Oral Care and Skin
Care
Cross pollinate with products from MENA and Turkey
Enter emerging markets like
Myanmar with personal care
products such as Toothpastes and
Shampoos
Continue to cater to large Indian
Diaspora through the ethnic channels
Expand consumer base in UK and
rest of Europe by adding products,
improving distribution and
focused marketing
27

Financial Highlights FY2014-15
10.7% 14.5% 16.6%Growth
Sales EBITDA PAT
Rs. 7806 crs Rs. 1474 crs Rs. 1066 crs
28
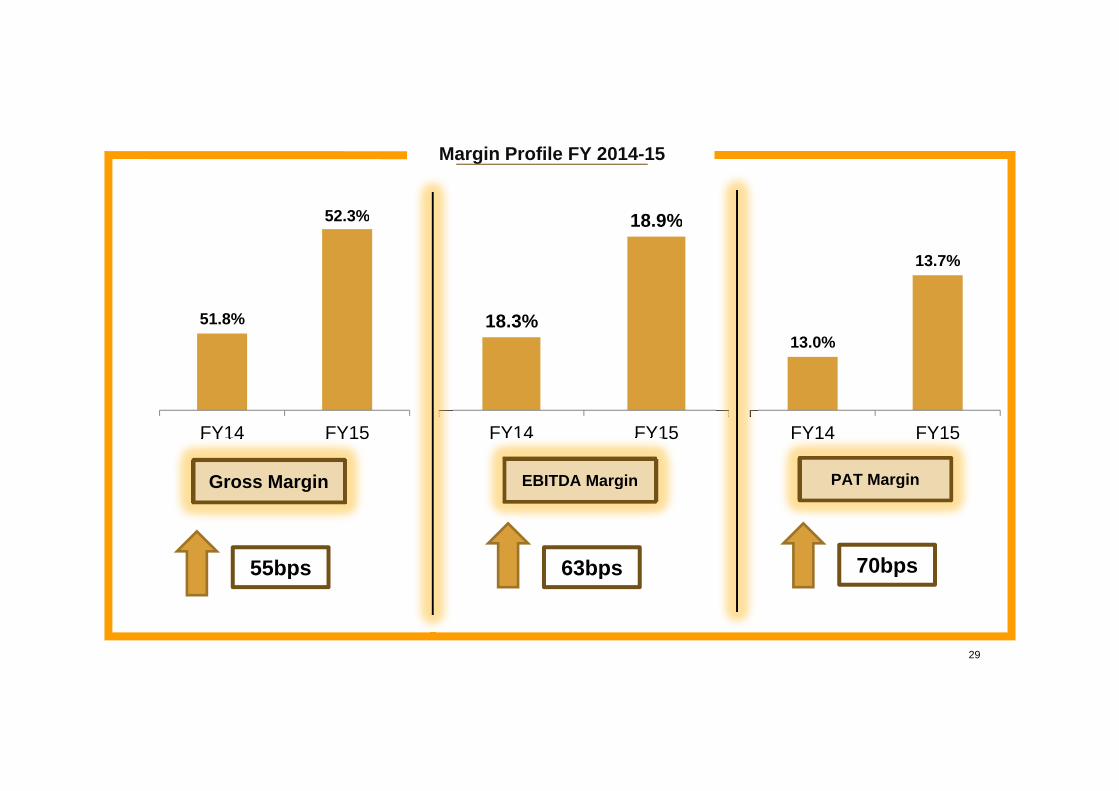
Margin Profile FY 2014-15
52 3% 18 9%52.3% 18.9%
13.7%
51.8% 18.3%13.0%
FY14 FY15
Gross Margin
FY14 FY15
EBITDA Margin PAT Margin
FY14 FY15
Gross Margin
55bps
EBITDA Margin
63bps
g
70bps55bps 63bps p
29

Sustainability:A Key Focus
Dabur is committed to being a responsible company and making a positive contribution to Society and Environment
1 141 2 028 9 13 7501,141 acres under cultivation for rare medicinal
herbs in India
2,028 beneficiary families of our Self – Help Group
initiatives
9,13,750 school kids benefitting from our Healthcare Initiatives
13 States covered under our Agronomical Initiatives
1,674 farmers/beneficiaries of our Agronomical initiatives
in India
586 women trained at our vocational training centers
30

Share Price Performance , Dividend & Shareholding
Share Holding Pattern As on 30th June 2015 Share Price Trend
FII
DII5%
Others6%
Share Holding Pattern As on 30 June 2015 Share Price Trend
Promoters68%
FII21%
200%
250% 250%
175% 175%200%
175%200%
Dividend History*
68%
140%175%
150%175%
115% 130%150%
175%
FY03 FY04 FY05 FY06 FY07 FY08 FY09 FY10 FY11 FY12 FY13 FY14 FY15
*Bonus issue in FY07 & FY11
31

Consolidated P&LDIL (Consolidated) P&L in Rs. million Q1FY16 Q1FY15 YoY (%)Net Sales 20,641 18,639 10.7%O h O i I 54 50Other Operating Income 54 50Material Cost 9,557 9,226 3.6%% of Sales 46.3% 49.5%Employee Costs 1,892 1,569 20.6%% of Sales 9.2% 8.4%Adpro 3,306 2,863 15.5%% of Sales 16.0% 15.4%Other Expenses 2,722 2,350 15.8%% of Sales 13.2% 12.6%Other Non Operating Income 479 359 33.2%p gEBITDA 3,696 3,040 21.6%% of Sales 17.9% 16.3%Interest Exp. and Fin. Charges 117 101 15.8%Depreciation & Amortization 326 267 22.0%Profit Before Tax (PBT) 3 253 2 671 21 8%Profit Before Tax (PBT) 3,253 2,671 21.8%Tax Expenses 632 560 12.8%PAT(Before extraordinary item) 2,621 2,111 24.1%% of Sales 12.7% 11.3%PAT(After extraordinary Items) 2,621 2,111 24.1%Mi it I t t (P fit)/L 10 3
32
Minority Interest ‐ (Profit)/Loss 10 3
PAT (After Extra ordinary item & Minority Int) 2,611 2,108 23.9%

Statement Of Assets & Liabilitiesin Rs. million As at 31/03/2015) As at 31/03/2014)
 EQUITY AND LIABILITIES1 Shareholders’ funds
(a) Share capital 1756 5 1743 8(a) Share capital 1756.5 1743.8(b) Reserves and surplus 31784.9 24815.8
Sub-total - Shareholders' funds 33541.4 26559.62. Minority interest 181.6 159.13. Non-current liabilities
(a) Long-term borrowings 2105.7 2604.0(b) Deferred tax liabilities (net) 587.1 448.3(c) Other long-term liabilities 1.2 0.0( ) g(c) Long-term provisions 462.1 408.9
Sub-total - Non-current liabilities 3154.9 3461.24. Current liabilities
(a) Short-term borrowings 5229.9 4477.4(b) Trade payables 10958.4 10965.3(c )Other current liabilities 5436.4 4794.2(d) Short-term provisions 2560.2 2703.2
Sub-total - Current liabilities 24184.9 22940.1TOTAL - EQUITY AND LIABILITIES 61062.8 53120.0B ASSETS
1. Non-current assets(a) Fixed assets 13060.3 11672.1(b) Goodwill on consolidation 6214.0 6214.0(c) Non-current investments 14074.0 4926.4(d) Long term loans and advances 207 5 245 4(d) Long-term loans and advances 207.5 245.4(e) Other non-current assets 201.3 180.7
Sub-total - Non-current assets 33757.1 23238.62 Current assets
(a) Current investments 4059.7 5838.3(b) Inventories 9732.7 9725.1(c) Trade receivables 7108.4 6753.0(d) Cash and bank balances 2760.4 5193.8( )(e) Short-term loans and advances 2788.7 1955.1(f) Other current assets 855.8 416.1
Sub-total - Current assets 27305.7 29881.4Total -Assets 61062.8 53120.0
33
THANK YOUOU