Investor Presentation - WordPress.com · The Company assumes no obligation to update any...
32
Investor Presentation May 2015
-
Upload
truongphuc -
Category
Documents
-
view
219 -
download
2
Transcript of Investor Presentation - WordPress.com · The Company assumes no obligation to update any...

Strictly Confidential
Investor Presentation May 2015

2
Safe Harbour
This presentation and the accompanying slides (the “Presentation”), which have been prepared by The Byke Hospitality Limited (the
“Company”), have been prepared solely for information purposes and do not constitute any offer, recommendation or invitation to
purchase or subscribe for any securities, and shall not form the basis or be relied on in connection with any contract or binding commitment
whatsoever. No offering of securities of the Company will be made except by means of a statutory offering document containing detailed
information about the Company.
This Presentation has been prepared by the Company based on information and data which the Company considers reliable, but the
Company makes no representation or warranty, express or implied, whatsoever, and no reliance shall be placed on, the truth, accuracy,
completeness, fairness and reasonableness of the contents of this Presentation. This Presentation may not be all inclusive and may not
contain all of the information that you may consider material. Any liability in respect of the contents of, or any omission from, this
Presentation is expressly excluded.
Certain matters discussed in this Presentation may contain statements regarding the Company’s market opportunity and business prospects
that are individually and collectively forward-looking statements. Such forward-looking statements are not guarantees of future
performance and are subject to known and unknown risks, uncertainties and assumptions that are difficult to predict. These risks and
uncertainties include, but are not limited to, the performance of the Indian economy and of the economies of various international markets,
the performance of the industry in India and world-wide, competition, the company’s ability to successfully implement its strategy, the
Company’s future levels of growth and expansion, technological implementation, changes and advancements, changes in revenue, income
or cash flows, the Company’s market preferences and its exposure to market risks, as well as other risks. The Company’s actual results,
levels of activity, performance or achievements could differ materially and adversely from results expressed in or implied by this
Presentation. The Company assumes no obligation to update any forward-looking information contained in this Presentation. Any forward-
looking statements and projections made by third parties included in this Presentation are not adopted by the Company and the Company
is not responsible for such third party statements and projections.

3
Content
Company Overview 1
Key Business Strengths 2
Key Financial Highlights 3
“The Byke” Hotel Portfolio 4

The Byke Old Anchor – South Goa
Company Overview

5
The Byke : Asset Light Business Model …
“The Byke” Portfolio Room Chartering
Hotel under brand name “The Byke”
Focus on Domestic Middle Class Leisure
Tourism
8 hotel properties operational at tourist
destinations in India (as on Mar’15) of which:
2 ownership; 6 on long term lease
519 rooms
3 new hotel properties to be added in FY16
196 rooms to be added
Byke Suraj Plaza, Thane, added in May
2015
Niche in Vegetarian segment
Third-party hotel rooms chartered at
strategically identified locations across India
Asset Light approach to Hospitality Business
Capitalise on the diverse peak seasons across
India to maximize Revenue
Model offers flexibility to quickly expand
depending on tourist trend
Rooms chartering across 48 cities in India
Developed relationship with over 150 Hotels
owners
Average Room Rent (ARR) of Rs 2,404 for FY15
… well placed to capture Tourism Growth in India

6
Evolved from Standalone Hotel Property …
Mr. Anil Patodia takes
operational charge &
Rebranded as “The
Byke”
Acquired properties
on Long Term Lease:
Goa (3rd property)
Matheran
Manali
Mandawa
Jaipur
“The Byke”
Established Brand
name in Hospitality
Sector
Strong marketing &
distribution
network
Pan India Presence
through Room
Chartering model
Chartering business
achieved scale
More than 373,000
room nights in FY15
Asset Light Model
adopted through
Long Term Lease &
Room Chartering
…to sizeable Hotel Portfolio & well known Brand in Industry
Acquired 3 more
hotels on Long Term
Lease at Thane, Shimla
and Puri
To be operational by
H1 FY16
2004-07 2010-11 2012-15 Current
Hospitality services
started with the
acquisition of one
hotel in Goa
(Byke Sunflower)
Acquisition of Byke
Heritage Matheran
Acquired the largest
property in the
portfolio
The Byke Old Anchor,
Goa on lease
The Byke Hidden Paradise – North Goa
Key Business Strengths

8
Key Business Strengths
Domestic Middle Class Leisure tourism set to grow at faster pace
1
Leased Model : low cost & faster rollout of hotel properties
2
Charter Model : Highly scalable with geography & seasons diversification
3
Strong marketing / distribution network of agents
4
Experienced management / professional team
5

Domestic Tourism to Grow at a Faster Pace
Source: World Travel & Tourism Council’s Economic Impact 2014, Aranca Research 9
US$80 bn tourist expenditure (2013) US$157 bn tourist expenditure (2024)
Domestic
Tourist
81%
Foreign
Tourist
19%
Domestic
Tourist
85%
Foreign
Tourist
15%
… target market for “The Byke”
1

6
4
10
12 12
14
12
10
16
Total Consumer
Spend
Essential Consumer
Spend
Discretionary
Consumer Spend
FY00-05 FY05-10 FY11-16CL
Rising Middle Class and Increasing Discretionary Spend
10
Increasing Discretionary spend…
% CAGR
Source: NSSO, CLSA Asia-pacific Markets and Kotak Research
54%
24%
10% 3%
32%
51%
36%
17%
13%
18%
43%
59%
1% 7% 12%
20%
1995 2005 2015 2025
< $1.8k $1.8-4k $4-20k >$20k
Affluent
Class
Middle
Class
Along with growing mix of middle class
to benefit tourism industry
… to benefit tourism segment significantly

11
Lease Model…
No. of rooms & properties
…highly scalable, faster turnaround & low capital cost
2
102 102 102 102 102 102
80
323 363 363
417
595
FY11 FY12 FY13 FY14 FY15 FY16E*
Owned rooms Leased rooms
5 6 7 8 7 10
No. of properties
Currently present in 5 cities
Expanded no. of rooms by a CAGR
of 31% over FY11-16
Focus to grow the Lease portfolio
aggressively by leasing distressed
properties and turning around
quickly
Lease business to grow at 20%+
over the next few years
Chartering Business through pan-
India presence helps in gaining
insight on tourist trends - Key for
selection of hotel properties
*New rooms from Byke Suraj Plaza, Thane and 2 new properties under advanced stages of discussion to be added in Q1 FY16

12
Successfully Turning Around Properties…
… leads to improvement in ARR of most of the properties
Lower capital requirement for hotel lease
Leasing low-yield for property owner
Unlocks resources for modernization of
properties
Renovation of the property, one of the key
success factors
Renovation, interior decoration, investment in
amenities & infrastructure
Focus on completing renovation within rent-free
period
Branding of the property as “The Byke”
Marketing to create awareness of the property
Standardizing system and process in-line with
other portfolio properties
Leveraging agent network of chartering
business for ensuring higher occupancy
60%
68%
70% 70%
FY12 FY13 FY14 FY15
The Byke Old Anchor, Goa
3,520
3,900
4,250
4,500
FY12 FY13 FY14 FY15
ARR in Rs. Occupancy %
Before Renovation After Renovation

13
Consistent Revenue Growth…
… and low fixed cost gets break-even at low occupancy rate
Revenue from “The Byke” properties Properties Lease Amount (Major cost)
231
580
806
917
FY12 FY13 FY14 FY15
Total Revenue in Rs. Mn
13
39 42
53
FY12 FY13 FY14 FY15
Lease Cost* in Rs. Mn Revenue Growth % of Hotel Revenue
39% 63% 151% 5% 6% 7% 6% 14%
*Lease Cost calculated hotel wise for the respective operational period during the year

14
Chartering rooms at strategically identified
locations with partial / full advance payments
Synergistic model increasing occupancy of the
leased properties of “The Byke”
Strong marketing & agent network
Better negotiation given scale leads to low
break even point
Low Capital Employed
Location specific peak season chartering
Efficient risk mitigation due to pan-India
presence
Flexibility to quickly expand depending on
tourist trends
Chartering Business
123,758
201,355
345,000
373,250
FY12 FY13 FY14 FY15
No. of Room Nights Sold
Key strengths of model Rooms and Room Nights Sold
3
No. of rooms
4,460 2,650 4,200 1,670

15
Highly Scalable….
… and generates strong margins
Chartering Revenue Gross Profit* & Margin
259
429
750
897
FY12 FY13 FY14 FY15
Chartering Revenue in Rs. …
35
60
107
143
FY12 FY13 FY14 FY15
Gross Profit in Rs. Mn Gross Profit Margin
*Gross Profit calculated: Revenue – (Chartering Cost + Cost of Vacant Rooms + Agent Commission)
2,175 2,404 2,131
ARR in Rs.
2,096 14% 16% 14% 13%

16
Strong Network of Agents 4
… expands reach to customers to get the booking across India
89
134
182 208
FY12 FY13 FY14 FY15
22
32
41
48
FY12 FY13 FY14 FY15
Agent Network: No. of Cities
Agent Network: No. of Agents
“The Byke” Presence
Cities

Mr. Ronald Masse Mr. Mihir Sarkar
17
Experienced Professional Team… 5
… improves customer experience & strengthen brand value
Has provided strong and dynamic leadership to “The Byke” since 2011
Has sharp analytical acumen with respect to the various avenues of investment in this industry
A career Hotelier with an extensive experience in the Hospitality industry
His experience in operations and marketing is playing a key role in the global expansion and
development of future hotels
He is a Commerce Graduate from the University of Rajasthan
Has over 19 years of hands-on
experience in the hospitality industry
Past management roles at Taj, Holiday
Inn and ITDC
Specialties:
Multiple Unit Business Operations
Pre-opening Hotel Management
Vendor & Supplier Management
MICE & Convention Management
Strategy Planning and Management
Has 20 years of experience as a Hotel Executive
General Manager with proven brands such as Hilton, Wyndham Hotels, Sayaji Hotel and others
Specialization in the management of large convention hotels and 4 and 5 Star Resorts & Hotels
Proven track record of success in opening / re-opening, major renovations and brand re-positioning
Versatile hospitality professional and
dynamic manager with more than 20
yrs of experience
Has worked with Group like Baba
Group of Hotels, Tunga Group of
Hotels, Panaromic Group of Hotels
Specialties:
Hospitality Operations
Client Management & Relationship
Building
Business Development
Mr. Anil Patodia
Mr. Suraj K. Soni

The Byke Old Anchor – South Goa
Key Updates of FY15

19
Byke Grassfield, Jaipur became operational in FY15
The property has been taken on a long term
lease
The property has:
o 54 rooms
o 3 Restaurants
o 3 Lawns/Banquets
o 3 Conference Rooms
Though the property saw low occupancy in
current year, FY16 is expected to see higher
occupancy and revenues from this hotel
Byke Suraj Plaza, Thane added to the O&L portfolio in
May ’15
The property has been taken on a long term
lease
The property has 122 rooms
The property is set to be in operational in
H1FY16
Key Updates
The Byke Grassfield, Jaipur
The Byke Suraj Plaza, Thane

The Byke Grassfield – Jaipur
Financial Highlights

21
Lease Business
No. of Rooms Occupancy
ARR Revenue
425 465 465
519
FY12 FY13 FY14 FY15
No. of Rooms
61%
68% 70%
67%
FY12 FY13 FY14 FY15
Occupancy %
2,676
3,431 3,617 3,769
FY12 FY13 FY14 FY15
ARR in Rs.
149 340 428 466
55
148 201 213
27
92
177 239
FY12 FY13 FY14 FY15
Rooms Food & Beverage Others
(Rs. Mn) 58% CAGR

22
Non-rooms Revenue Segment to Grow Significantly
No. of Restaurants No. of Lawns/Banquets and Conference Halls
Food & Beverages Revenue Other Revenue*
9 9 12
17
FY13 FY14 FY15 FY16E
7 7
13
16
FY13 FY14 FY15 FY16E
No. of Lawns/Banquets and Conference Halls
148
201 213
FY13 FY14 FY15
Food & Beverages Revenue in Rs. Mn
92
177
239
FY13 FY14 FY15
Other Revenue in Rs. Mn
Restaurant Capacity
1,400 1,750 1,100 1,100
61% CAGR 20% CAGR
No. of Restaurants
*Other Revenue includes revenues from events, conferences, etc.

23
Chartering Business
No. of Room Nights Purchased Occupancy
ARR Revenue
140,000 225,000
375,000 398,000
FY12 FY13 FY14 FY15
No. of Room Nights Purchased
88%
89%
92%
94%
FY12 FY13 FY14 FY15
Occupancy %
2,096 2,131 2,175
2,404
FY12 FY13 FY14 FY15
ARR in Rs.
259
429
750
897
FY12 FY13 FY14 FY15
Revenue in Rs. Mn
No. of Rooms
4,200 4,460 2,650 1,670
51% CAGR

25
78
159 200
FY12 FY13 FY14 FY15
PAT in Rs. Mn
5% 8% 10% 11%
24
Overall Financials
Revenue Lease and Charter Revenue Mix
EBITDA & EBITDA Margin PAT & PAT Margin
491
1,009
1,556 1,814
FY12 FY13 FY14 FY15
Total Revenue in Rs. Mn
47% 57% 52% 51%
53% 43% 48% 49%
FY12 FY13 FY14 FY15
Lease Chartering
51
176
287
373
FY12 FY13 FY14 FY15
EBITDA in Rs. Mn EBITDA Margin
55% CAGR
11% 17% 18% 21%

25
Improving Return Ratio Given Asset Light Model
Margin Improvement with growth in
business…
…better capital utilization given asset
light model
Led to improvement in return ratio Consistent Dividend History
5%
8%
10% 11%
FY12 FY13 FY14 FY15
Net Profit Margin
0.56
1.05
1.49 1.55
FY12 FY13 FY14 FY15
Asset Turnover Ratio
4%
11%
20% 22%
5%
16%
24% 26%
FY12 FY13 FY14 FY15
ROE^ ROCE*
1.0 1.0
1.5
1.0
FY12 FY13 FY14 FY15#
Dividend Rs/share
^ROE = PAT / Average Net Worth *ROCE = EBIT / Average Capital Employed
# The Board has recommended a Dividend of Rs. 1.0 per share for FY15
26
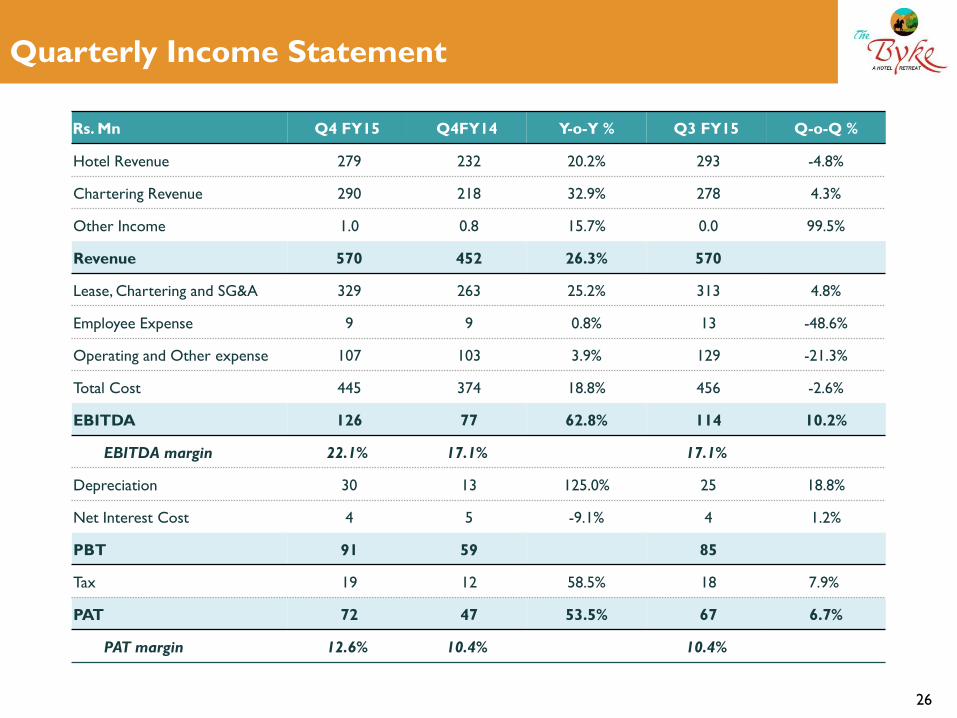
Quarterly Income Statement
Rs. Mn Q4 FY15 Q4FY14 Y-o-Y % Q3 FY15 Q-o-Q %
Hotel Revenue 279 232 20.2% 293 -4.8%
Chartering Revenue 290 218 32.9% 278 4.3%
Other Income 1.0 0.8 15.7% 0.0 99.5%
Revenue 570 452 26.3% 570
Lease, Chartering and SG&A 329 263 25.2% 313 4.8%
Employee Expense 9 9 0.8% 13 -48.6%
Operating and Other expense 107 103 3.9% 129 -21.3%
Total Cost 445 374 18.8% 456 -2.6%
EBITDA 126 77 62.8% 114 10.2%
EBITDA margin 22.1% 17.1% 17.1%
Depreciation 30 13 125.0% 25 18.8%
Net Interest Cost 4 5 -9.1% 4 1.2%
PBT 91 59 85
Tax 19 12 58.5% 18 7.9%
PAT 72 47 53.5% 67 6.7%
PAT margin 12.6% 10.4% 10.4%

27
Annual Income Statement
Rs. Mn FY15 FY14 Y-o-Y %
Hotel Revenue 917 806 13.8%
Chartering Revenue 897 751 19.4%
Other Income 1.1 1.5 -26.5%
Revenue 1,815 1,559 16.5%
Lease, Chartering and SG&A 1,025 911 12.6%
Employee Expense 38 32 19.7%
Operating and Other expense 378 329 15.1%
Total Cost 1,442 1,271 13.4%
EBITDA 373 287 30.0%
EBITDA margin 20.6% 18.4%
Depreciation 102 54 89.0%
Net Interest Cost 18 21 -13.4%
PBT 254 213
Tax 53 54 -0.5%
PAT 200 159 26.1%
PAT margin 11.0% 10.2%

28
Balance Sheet
Rs. Mn FY15 FY14
Share Capital 401 200
Reserve and Surplus 596 648
Net Worth 997 848
Total Debt 124 145
Deferred tax net 50 49
Source of Fund 1,174 1,043
Net Block + CWIP 806 820
Non-Current Assets 16 16
Inventories 60 60
Debtors 140 107
Cash and bank 20 20
Other Current Assets 1 2
Loans and Advance 315 228
Total Current Assets 536 418
Less: Current Liabilities 109 137
Less: Provisions 74 73
Net Current Assets 352 207
Total Application 1,174 1,043

The Byke Old Anchor – South Goa
“The Byke” Hotel Portfolio
30
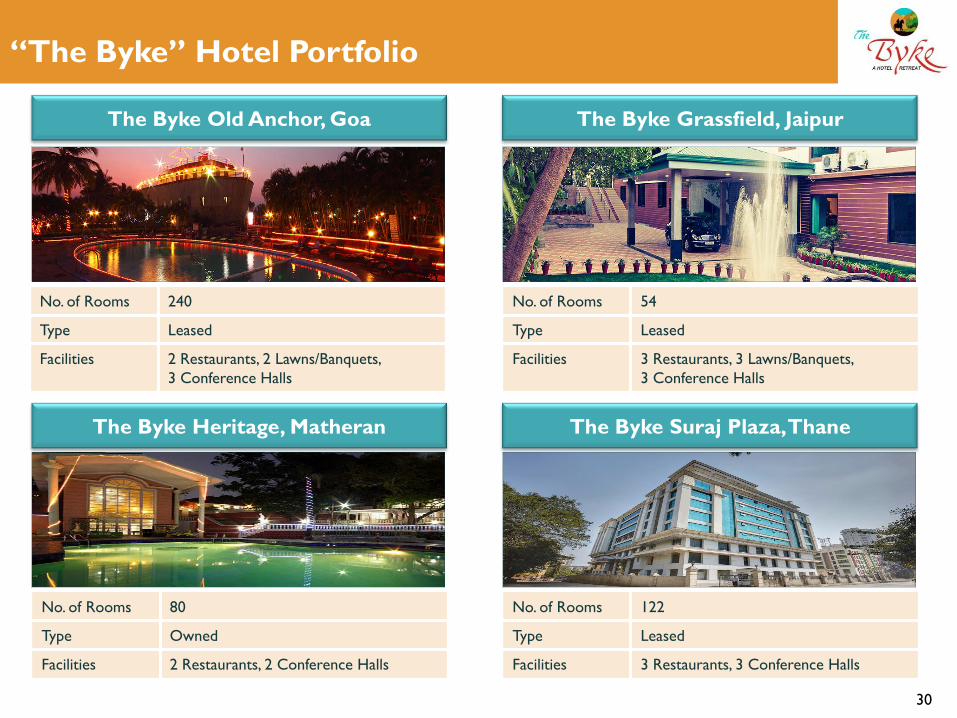
“The Byke” Hotel Portfolio
The Byke Old Anchor, Goa The Byke Grassfield, Jaipur
The Byke Heritage, Matheran The Byke Suraj Plaza, Thane
No. of Rooms 240
Type Leased
Facilities 2 Restaurants, 2 Lawns/Banquets,
3 Conference Halls
No. of Rooms 54
Type Leased
Facilities 3 Restaurants, 3 Lawns/Banquets,
3 Conference Halls
No. of Rooms 80
Type Owned
Facilities 2 Restaurants, 2 Conference Halls
No. of Rooms 122
Type Leased
Facilities 3 Restaurants, 3 Conference Halls

31
“The Byke” Hotel Portfolio
The Byke Neelkanth, Manali The Byke Hidden Paradise, Goa
The Byke Redwood, Matheran The Byke Sunflower, Goa
No. of Rooms 40
Type Leased
Facilities 1 Restaurant
No. of Rooms 40
Type Leased
Facilities 1 Restaurant
No. of Rooms 25
Type Leased
Facilities 1 Restaurant
No. of Rooms 22
Type Owned
Facilities 1 Restaurant

32
For further information, please contact:
Company : Investor Relations Advisors :
The Byke Hospitality Ltd. CIN: L67190MH1990PLC056009
Swati Gupta
www.thebyke.com
Stellar IR Advisors Pvt. Ltd. CIN: U74900MH2014PTC259212
Savli Mangle/ Pooja Dokania
[email protected]/ [email protected]
www.stellar-ir.com