Investor Presentation - Cabot Oil & Gas · 2020-04-07 · Investor Presentation November 18, 2019....
27
Investor Presentation November 18, 2019
Transcript of Investor Presentation - Cabot Oil & Gas · 2020-04-07 · Investor Presentation November 18, 2019....

Investor Presentation
November 18, 2019

2
Forward-Looking Statements and Other Disclosures
This presentation includes forward‐looking statements within the meaning of Section 27A of the Securities Act of 1933, as amended, and Section 21E of the Securities Exchange Act of 1934, as amended. The statements regarding future financial and operating performance and results, returns to shareholders, strategic pursuits and goals, market prices, future hedging and risk management activities, and other statements that are not historical facts contained in this report are forward-looking statements. The words “expect”, “project”, “estimate”, “believe”, “anticipate”, “intend”, “budget”, “plan”, “forecast”, “outlook”, “target”, “predict”, “may”, “should”, “could”, “will” and similar expressions are also intended to identify forward-looking statements. Such statements involve risks and uncertainties, including, but not limited to, market factors, market prices (including geographic basis differentials) of natural gas and crude oil, results of future drilling and marketing activity, future production and costs, pipeline projects, legislative and regulatory initiatives, electronic, cyber or physical security breaches and other factors detailed herein and in our other Securities and Exchange Commission (SEC) filings. See “Risk Factors” in Item 1A of the Form 10-K and subsequent public filings for additional information about these risks and uncertainties. Should one or more of these risks or uncertainties materialize, or should underlying assumptions prove incorrect, actual outcomes may vary materially from those indicated. Any forward-looking statement speaks only as of the date on which such statement is made, and Cabot Oil & Gas (the “Company” or “Cabot”) does not undertake any obligation to correct or update any forward-looking statement, whether as the result of new information, future events or otherwise, except as required by applicable law.
This presentation may contain certain terms, such as resource potential, risked or unrisked resources, potential locations, risked or unrisked locations, EUR (estimated ultimate recovery) and other similar terms that describe estimates of potentially recoverable hydrocarbons that the SEC rules prohibit from being included in filings with the SEC. These estimates are by their nature more speculative than estimates of proved, probable and possible reserves and may not constitute “reserves” within the meaning of SEC rules and accordingly, are subject to substantially greater risk of being actually realized. These estimates are based on the Company’s existing models and internal estimates. Actual locations drilled and quantities that may be ultimately recovered from the Company’s interests could differ substantially. Factors affecting ultimate recovery include the scope of the Company’s ongoing drilling program, which will be directly affected by the availability of capital, drilling and production costs, availably of drilling services and equipment, drilling results, lease expirations, transportation constraints, regulatory approvals, actual drilling results, including geological and mechanical factors affecting recovery rates, and other factors. These estimates may change significantly as development of the Company’s assets provide additional data. Investors are urged to consider carefully the disclosures and risk factors about Cabot’s reserves in the Form 10‐K and other reports on file with the SEC.
This presentation also refers to Discretionary Cash Flow, EBITDAX, Free Cash Flow, Adjusted Net Income (Loss), Return on Capital Employed (ROCE) and Net Debt calculations and ratios. These non-GAAP financial measures are not alternatives to GAAP measures, and should not be considered in isolation or as an alternative for analysis of the Company’s results as reported under GAAP. For additional disclosure regarding such non-GAAP measures, including definitions of these terms and reconciliations to the most directly comparable GAAP measures, please refer to Cabot’s most recent earnings release at www.cabotog.com and the Company’s related 8-K on file with the SEC.

3
Third Quarter 2019 Highlights
• Net income of $90.4 million (or $0.22 per share); adjusted net income (non-
GAAP) of $119.7 million (or $0.29 per share)
• Net cash provided by operating activities of $270.9 million; discretionary
cash flow (non-GAAP) of $275.5 million
• Free cash flow (non-GAAP) of $72.4 million
• Return on capital employed (ROCE) (non-GAAP) for the trailing twelve
months of 25.2 percent
• Returned $227.8 million of capital to shareholders through dividends and
share repurchases (10.5 million shares repurchased)
• Daily production of 2,399 million cubic feet equivalent (Mmcfe) per day, an
increase of 18 percent relative to the prior-year period
• Improved operating expenses per unit by 15 percent relative to the prior-
year period
• On September 30, 2019, Cabot announced an agreement to sell its 20
percent ownership interest in Meade Pipeline Co LLC for $256.0 million, or
over 13 times expected 2019 EBITDAX (non-GAAP); closed on November
13, 2019
• Announced an 11 percent dividend increase, the Company’s fifth dividend
increase since May 2017
• Subsequent to the third quarter earnings release, Cabot repurchased
an additional 5.0 million shares at an average share price of $17.841
Note: See supplemental tables at the end of the presentation for a reconciliation of non-GAAP measures1 As of November 15, 20192 Includes direct operations, transportation and gathering, taxes other than income, exploration, DD&A, general and administrative, and interest expense
Q3
2019
Q2
2019
Q3
2018
Equivalent Production (Mmcfe/d) 2,399 2,349 2,029
Realized Gas Price (Incl. Hedges) ($/Mcf) $2.11 $2.27 $2.36
Realized Gas Price (Excl. Hedges) ($/Mcf) $1.89 $2.20 $2.36
Net Income ($mm) $90.4 $181.0 $122.3
Adjusted Net Income (non-GAAP) ($mm) $119.7 $150.6 $108.9
Discretionary Cash Flow (non-GAAP) ($mm) $275.5 $301.9 $298.8
Free Cash Flow (non-GAAP) ($mm) $72.4 $72.7 $28.6
EBITDAX (non-GAAP) ($mm) $283.6 $311.1 $291.6
Operating Expenses2 ($/Mcfe) $1.43 $1.41 $1.69
LTM Net Debt / EBITDAX (non-GAAP) 0.7x 0.6x 0.9x
TTM ROCE (non-GAAP) 25.2% 23.5% 10.8%
4
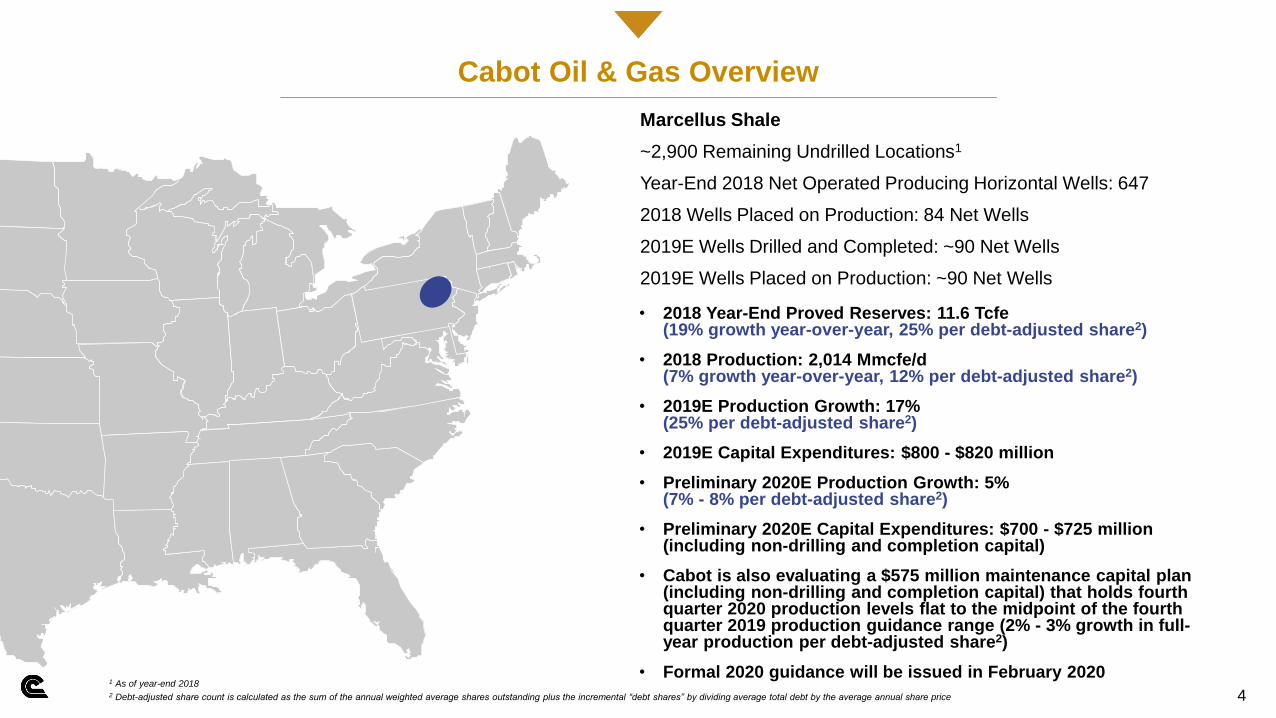
Cabot Oil & Gas Overview
Marcellus Shale
~2,900 Remaining Undrilled Locations1
Year-End 2018 Net Operated Producing Horizontal Wells: 647
2018 Wells Placed on Production: 84 Net Wells
2019E Wells Drilled and Completed: ~90 Net Wells
2019E Wells Placed on Production: ~90 Net Wells
• 2018 Year-End Proved Reserves: 11.6 Tcfe (19% growth year-over-year, 25% per debt-adjusted share2)
• 2018 Production: 2,014 Mmcfe/d (7% growth year-over-year, 12% per debt-adjusted share2)
• 2019E Production Growth: 17% (25% per debt-adjusted share2)
• 2019E Capital Expenditures: $800 - $820 million
• Preliminary 2020E Production Growth: 5% (7% - 8% per debt-adjusted share2)
• Preliminary 2020E Capital Expenditures: $700 - $725 million (including non-drilling and completion capital)
• Cabot is also evaluating a $575 million maintenance capital plan (including non-drilling and completion capital) that holds fourth quarter 2020 production levels flat to the midpoint of the fourth quarter 2019 production guidance range (2% - 3% growth in full-year production per debt-adjusted share2)
• Formal 2020 guidance will be issued in February 20201 As of year-end 20182 Debt-adjusted share count is calculated as the sum of the annual weighted average shares outstanding plus the incremental “debt shares” by dividing average total debt by the average annual share price

• Delivering growth per debt-adjusted share
• Generating positive free cash flow
• Improving corporate returns on capital employed
Cabot Oil & Gas Strategy
5
Deliver growth in production and reserves per debt-adjusted share while
generating positive free cash flow
• 2018 production growth of 7% (12% per debt-adjusted share1)
• 2018 free cash flow generation of $297mm
• 2019E production growth of 17% (25% per debt-adjusted share1)
• 2019E free cash flow generation of $500 - $525mm at $2.60 NYMEX2 (6.6% yield3)
Generate an improving return on capital employed (ROCE) that exceeds our cost of capital
• Expected to increase ROCE from 15.9% in 2018 to 20% - 22% at $2.60 NYMEX2 in 2019, despite significantly
lower NYMEX prices
Increase the return of capital to shareholders through dividends and share repurchases
• Increased dividend by 11 percent, the Company’s fifth dividend increase since May 2017
• Returned over $1.0bn of capital in 2018 including ~38.5mm shares repurchased
• Repurchased 20.5mm shares year-to-date in 20194
• Cabot is committed to returning >50% of free cash flow to shareholders annually through dividends and share
repurchases and has already returned >110% of the midpoint of the Company’s 2019 free cash flow guidance4
Maintain a strong balance sheet to maximize financial flexibility
• Net debt / LTM EBITDAX of 0.7x as of 9/30/2019
• Liquidity of ~$1.6bn as of 9/30/2019, including $82.3mm of cash on hand
• Paid down $304mm of senior notes in 2018, resulting in annualized interest expense savings of $21.8mm
• Announced an agreement to divest Cabot’s 20% ownership interest in Meade Pipeline Co LLC for $256.0mm
(excluding customary closing adjustments); closed on November 13, 2019
Note: See supplemental tables at the end of the presentation for a reconciliation of non-GAAP measures 1 Debt-adjusted share count is calculated as the sum of the annual weighted average shares outstanding plus the incremental “debt shares” by dividing average total debt by the average annual share price2 Based on 10 months of YTD NYMEX settlements and recent strip pricing for November/December3 Based on market capitalization as of October 23, 2019 and midpoint of guidance range4 As of November 15, 2019
• Increasing return of capital to shareholders
• Maintaining a strong balance sheet
Disciplined capital allocation focused on:
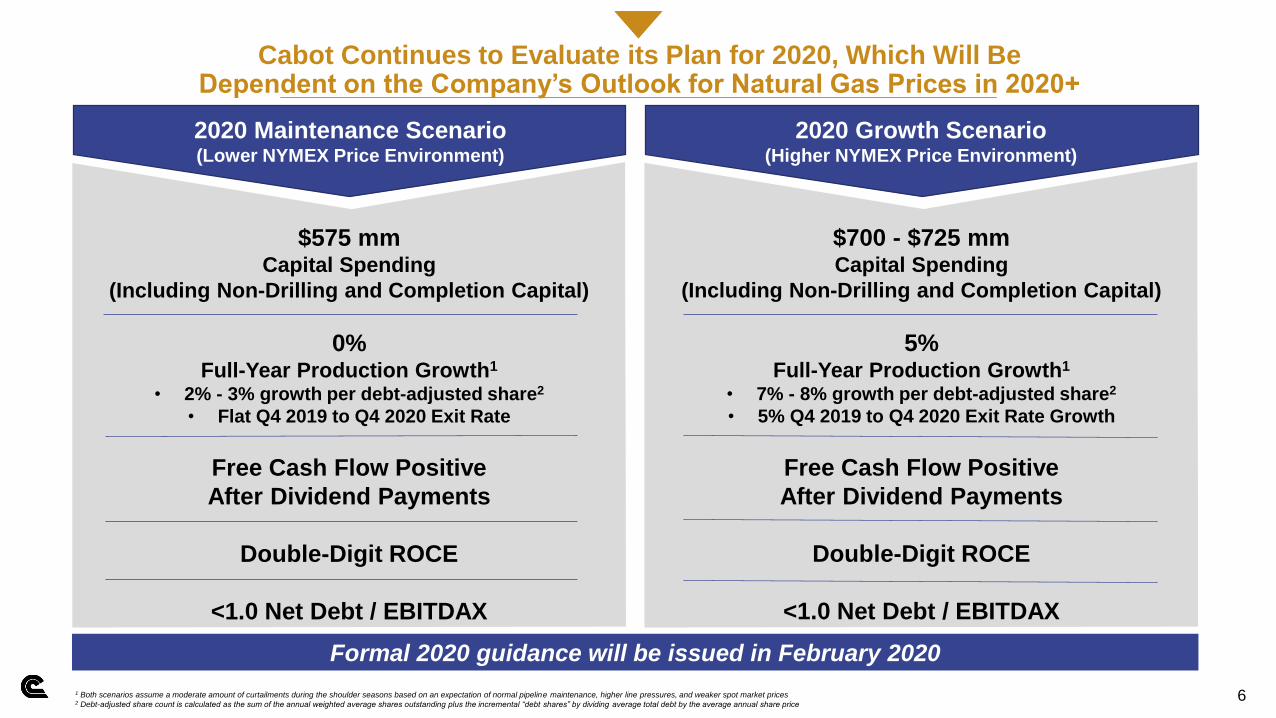
$575 mm Capital Spending
(Including Non-Drilling and Completion Capital)
0%Full-Year Production Growth1
• 2% - 3% growth per debt-adjusted share2
• Flat Q4 2019 to Q4 2020 Exit Rate
Free Cash Flow Positive
After Dividend Payments
Double-Digit ROCE
<1.0 Net Debt / EBITDAX
~6%
free cash
flow yield1,2
~5%
free cash
flow yield1,2
6
~6% free
cash flow
yield1,2
~7% free
cash flow
yield1,2
1 Both scenarios assume a moderate amount of curtailments during the shoulder seasons based on an expectation of normal pipeline maintenance, higher line pressures, and weaker spot market prices2 Debt-adjusted share count is calculated as the sum of the annual weighted average shares outstanding plus the incremental “debt shares” by dividing average total debt by the average annual share price
2020 Maintenance Scenario(Lower NYMEX Price Environment)
Cabot Continues to Evaluate its Plan for 2020, Which Will Be Dependent on the Company’s Outlook for Natural Gas Prices in 2020+
$700 - $725 mm Capital Spending
(Including Non-Drilling and Completion Capital)
5%Full-Year Production Growth1
• 7% - 8% growth per debt-adjusted share2
• 5% Q4 2019 to Q4 2020 Exit Rate Growth
Free Cash Flow Positive
After Dividend Payments
Double-Digit ROCE
<1.0 Net Debt / EBITDAX
2020 Growth Scenario(Higher NYMEX Price Environment)
Formal 2020 guidance will be issued in February 2020
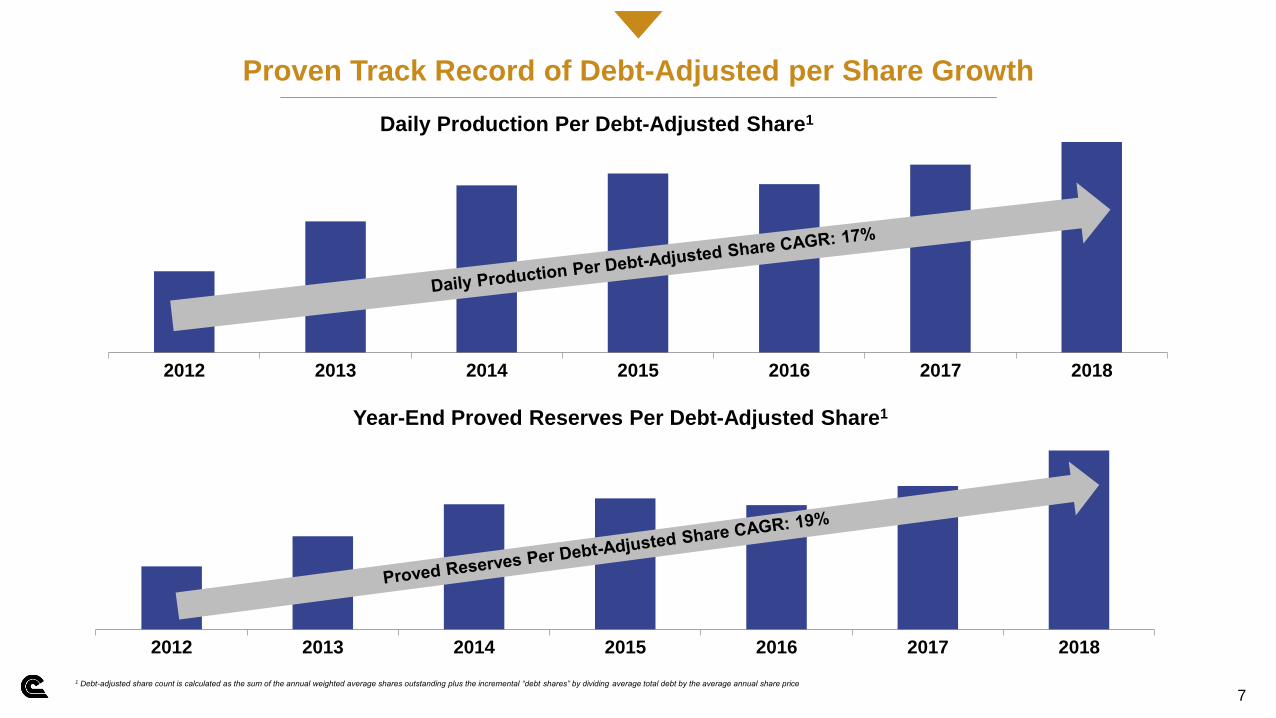
Proven Track Record of Debt-Adjusted per Share Growth
~7% free
cash flow
yield1,2~6%
free cash
flow yield1,2
~5%
free cash
flow yield1,2
7
Daily Production Per Debt-Adjusted Share1
2012 2013 2014 2015 2016 2017 2018
Year-End Proved Reserves Per Debt-Adjusted Share1
2012 2013 2014 2015 2016 2017 2018
1 Debt-adjusted share count is calculated as the sum of the annual weighted average shares outstanding plus the incremental “debt shares” by dividing average total debt by the average annual share price

Industry-Leading Cost Structure Continues to Improve…
~7% free
cash flow
yield1,2~6%
free cash
flow yield1,2
~5%
free cash
flow yield1,2
8
Total Company All-Sources Finding & Development Costs ($/Mcfe)
Marcellus All-Sources Finding & Development Costs ($/Mcf)
$0.87
$0.55
$0.71 $0.57
$0.37 $0.35 $0.30
2012 2013 2014 2015 2016 2017 2018
$0.49
$0.40 $0.43
$0.31 $0.26
$0.22 $0.26
2012 2013 2014 2015 2016 2017 2018
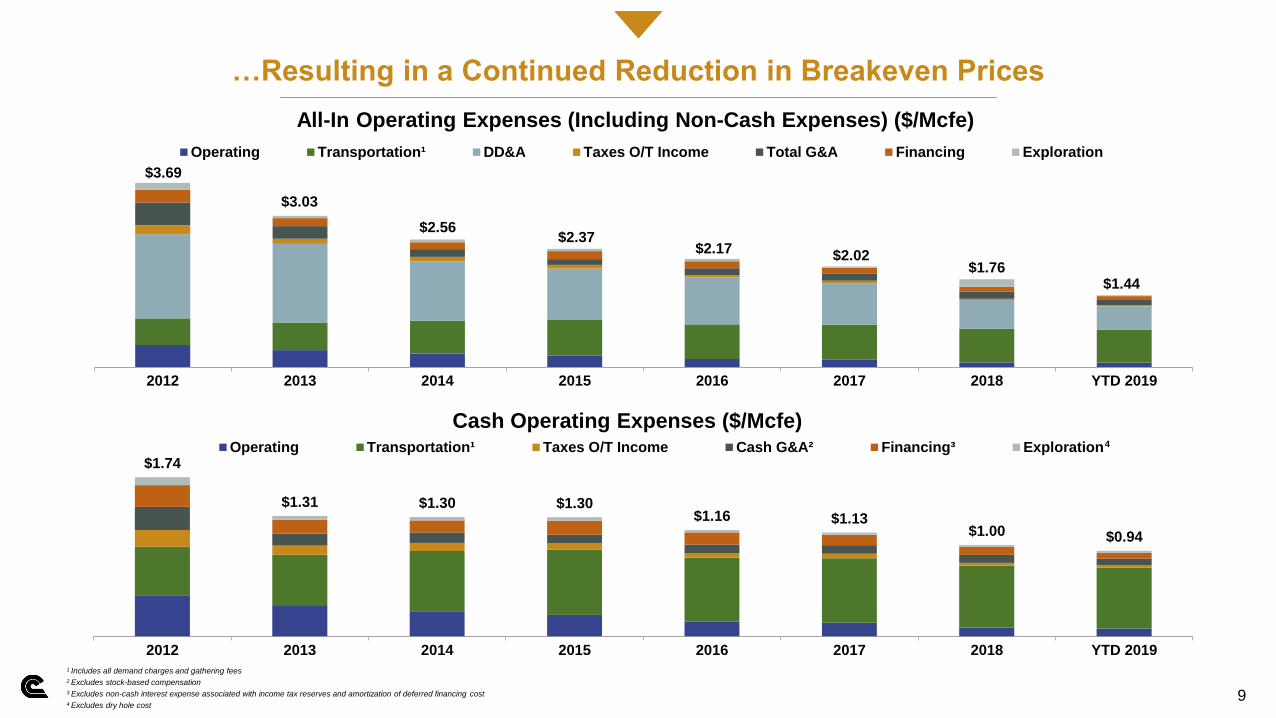
…Resulting in a Continued Reduction in Breakeven Prices
~6%
free cash
flow yield1,2
~5%
free cash
flow yield1,2
9
All-In Operating Expenses (Including Non-Cash Expenses) ($/Mcfe)
Cash Operating Expenses ($/Mcfe)
$2.56$2.37
$2.17$2.02
$1.76$1.44
2012 2013 2014 2015 2016 2017 2018 YTD 2019
Operating Transportation¹ DD&A Taxes O/T Income Total G&A Financing Exploration
$3.03
$3.69
$1.74
$1.31 $1.30 $1.30$1.16 $1.13
$1.00 $0.94
2012 2013 2014 2015 2016 2017 2018 YTD 2019
Operating Transportation¹ Taxes O/T Income Cash G&A² Financing³ Exploration
1 Includes all demand charges and gathering fees
2 Excludes stock-based compensation
3 Excludes non-cash interest expense associated with income tax reserves and amortization of deferred financing cost
4 Excludes dry hole cost
4
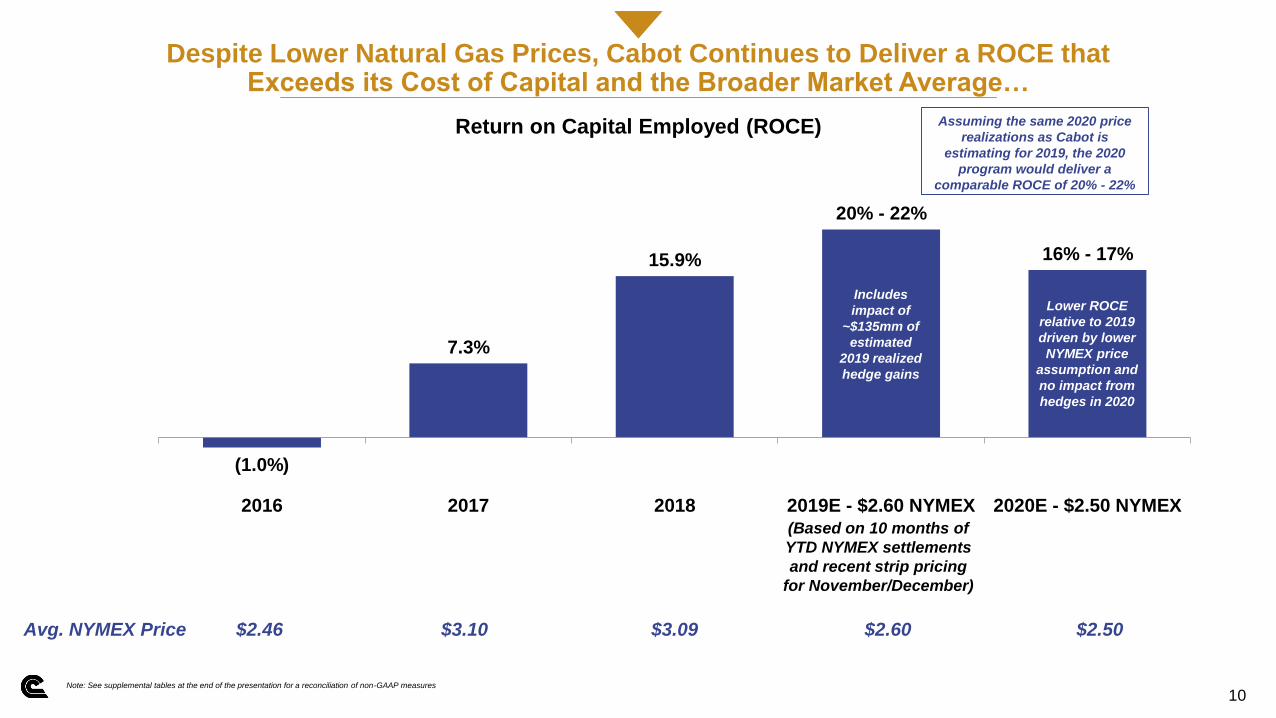
Despite Lower Natural Gas Prices, Cabot Continues to Deliver a ROCE thatExceeds its Cost of Capital and the Broader Market Average…
~7% free
cash flow
yield1,2~6%
free cash
flow yield1,2
10
Return on Capital Employed (ROCE)
(1.0%)
7.3%
15.9%
20% - 22%
16% - 17%
2016 2017 2018 2019E - $2.60 NYMEX 2020E - $2.50 NYMEX
Note: See supplemental tables at the end of the presentation for a reconciliation of non-GAAP measures
Avg. NYMEX Price $2.46 $3.10 $3.09 $2.60 $2.50
Includes
impact of
~$135mm of
estimated
2019 realized
hedge gains
Lower ROCE
relative to 2019
driven by lower
NYMEX price
assumption and
no impact from
hedges in 2020
(Based on 10 months of
YTD NYMEX settlements
and recent strip pricing
for November/December)
Assuming the same 2020 price
realizations as Cabot is
estimating for 2019, the 2020
program would deliver a
comparable ROCE of 20% - 22%

…While Generating Significant Operating Free Cash Flow
~7% free
cash flow
yield1,2~6%
free cash
flow yield1,2
~5%
free cash
flow yield1,2
11
Free Cash Flow ($mm)
$57
$155
$297
$365 –$390
~$135
2016A 2017A 2018A 2019E - $2.60 NYMEX 2020E - $2.50 NYMEX
Pre-Hedge Free Cash Flow Impact of Hedges
Note: See supplemental tables at the end of the presentation for a reconciliation of non-GAAP measures
1 Estimated free cash flow yields are based on market capitalization as of October 23, 2019 and the midpoint of the estimated free cash flow range
$500 - $525(6.6% free
cash flow
yield1)
(Based on 10 months of
YTD NYMEX settlements
and recent strip pricing
for November/December)
Based on the 5%
growth scenario;
estimated pre-hedge
2020 free cash flow is
roughly flat to 2019
levels despite a lower
NYMEX price
assumption, higher
current taxes, and the
impact of the Meade
Pipeline divestiture
$360 - $385(4.8% free
cash flow
yield1)
2020 free cash flow
range reduced by
$15mm to reflect the
impact of the Meade
Pipeline divestiture

Cabot is Committed to Returning Capital to Shareholders
~6%
free cash
flow yield1,2
~5%
free cash
flow yield1,2
12
Return of Capital to Shareholders ($mm)
~5% free
cash flow
yield1,2
~6% free
cash flow
yield1,2
~7% free
cash flow
yield1,2
$13 $17$25 $33 $33 $36 $79 $111 $1462$165 $139
$124
$904
$405 Year-to-
date1
$0
$100
$200
$300
$400
$500
$600
$700
$800
$900
$1,000
2011 2012 2013 2014 2015 2016 2017 2018 2019E
Dividends Share Repurchases
Increased
Dividend 33%
Increased
Dividend 100%
Increased
Dividend 150%
Increased
Dividend 40%
Commodity Price Downturn
1 As of November 15, 2019; excludes 2018 shares repurchases that were settled in early 20192 Includes Q4 2019 dividend payments3 Based on share price as of October 23, 20194 As of November 15, 2019Note: The chart above excludes the Company’s 2016 equity issuance
• Announced the fifth dividend increase since May 2017, resulting in a current dividend yield of 2.2 percent3
• Repurchased 20.5 million shares year-to-date in 2019, bringing the current remaining authorization to 16.0 million shares
(approximately four percent of shares outstanding)4
• Cabot is committed to returning >50% of free cash flow to shareholders annually through dividends and share repurchases and
year-to-date has already returned >110% of the midpoint of the Company’s 2019 free cash flow guidance4
Increased
Dividend 43%

~7% free
cash flow
yield1,2~6%
free cash
flow yield1,2
~5%
free cash
flow yield1,2
13
Common Shares Outstanding (in millions)
~5% free
cash flow
yield1,2
~6% free
cash flow
yield1,2
~7% free
cash flow
yield1,2
463.7
445.5
402.9
2017 Weighted-Average 2018 Weighted-Average Current (As of 11/15/2019)
Since 2017, Cabot Has Reduced its Shares Outstanding by 13 Percent

~7% free
cash flow
yield1,2~6%
free cash
flow yield1,2
~5%
free cash
flow yield1,2
14
Net Debt to LTM EBITDAX
~5% free
cash flow
yield1,2
~6% free
cash flow
yield1,2
~7% free
cash flow
yield1,2
1.4x 1.4x
0.9x
1.2x
2.5x
1.8x
1.0x 1.0x
0.7x
2011 2012 2013 2014 2015 2016 2017 2018 LTM Q3 2019
Target Leverage Ratio:
1.0x Through the Commodity Price Cycle
Note: See supplemental tables at the end of the presentation for a reconciliation of non-GAAP measures
Cabot’s Balance Sheet Provides Financial Flexibility Through the Commodity Price Cycle

~7% free
cash flow
yield1,2~6%
free cash
flow yield1,2
~5%
free cash
flow yield1,2
15
Weighted-Average Differential to NYMEX Before Hedges ($/Mcf)
~5% free
cash flow
yield1,2
~6% free
cash flow
yield1,2
~7% free
cash flow
yield1,2
($1.00)
($0.85)
($0.76)($0.80)
($0.51)
($0.30) - ($0.35) ($0.30) – ($0.35)
($1.25)
($1.00)
($0.75)
($0.50)
($0.25)
$0.002014 2015 2016 2017 2018 2019E¹ 2020E¹
1 Based on forward curves as of the week of October 21, 2019
Cabot’s Differentials Continue to Improve, Driven by New Infrastructure Projects and In-Basin Demand Growth

5.8x
3.9x
2.4x 2.4x2.1x 2.0x
1.8x1.7x
1.5x 1.5x 1.5x 1.4x 1.4x 1.3x 1.2x 1.2x 1.2x 1.1x 1.0x 1.0x
16
2019E All-In Total Recycle Ratio After G&A and Interest Expense
Source: BMO Capital Markets report "2018 Reserve Data Suggests Higher F&D and Breakevens" dated March 7, 2019.
Assumes Henry Hub of $2.98/Mmbtu, WTI of $50.29/Bbl, Brent of $57.67/Bbl, and NGLs of $25.90/Bbl
Peers include: APA, APC, AR, CHK, CLR, CXO, DVN, EOG, EQT, FANG, HES, MRO, NBL, PE, PXD, RRC, SWN, WPX, and XEC
Large-cap defined as >$10 billion of market capitalization; SMID-cap defined as <$10 billion of market capitalization
Cabot’s Recycle Ratio is Unrivaled Across Both Oil and Gas Peers

~7% free
cash flow
yield1,2~6%
free cash
flow yield1,2
17
2019E ROCE
~6% free
cash flow
yield1,2
~7% free
cash flow
yield1,2
21%
16%
10% 9% 8% 8% 7% 7% 7%4% 4% 3% 3% 2%
1% 0%
(2%)
COG Peer A Peer B Peer C Peer D Peer E Peer F Peer G Peer H Peer I Peer J Peer K Peer L Peer M Peer N Peer O Peer P
Peer A Peer B Peer D Peer F
Source: Company filings; FactSet median consensus estimates as of October 23, 2019. ROCE calculated as Net Income plus tax-adjusted Interest Expense divided by the sum of Total Debt and Stockholders’ Equity. Assumes a 21% tax rate for tax-adjusted interest expense. Return on Equity calculated as Net Income
divided by Stockholders’ Equity.
Peers include: APA, AR, CHK, CLR, CXO, DVN, ECA, EQT, MRO, MUR, NBL, PXD, RRC, SWN, WPX, and XEC
Large-cap defined as >$10 billion of market capitalization; SMID-cap defined as <$10 billion of market capitalization
31%26%
11% 11% 10% 9% 8% 8% 7%5% 3% 2% 2% 1%
(2%) (3%)
(12%)
COG Peer A Peer D Peer B Peer C Peer H Peer E Peer F Peer G Peer I Peer J Peer M Peer K Peer L Peer O Peer P Peer N
2019E Return on Capital Employed (ROCE)
2019E Return on Equity (ROE)
SMID-Cap Appalachia Large-Cap Permian Large-Cap Diversified SMID-Cap Diversified
Cabot’s 2019 Program Delivers Peer-Leading Returns…

~7% free
cash flow
yield1,2~6%
free cash
flow yield1,2
18
~6% free
cash flow
yield1,2
~7% free
cash flow
yield1,2
Source: Company filings; FactSet median consensus estimates as of October 23, 2019. The calculation for 2018 - 2019E EPS growth utilizes "adjusted EPS" from continuing operations for 2018 actuals. Free Cash Flow Yield calculated as Cash From Operations less Capital Expenditures divided by Market Capitalization.
Peers include: APA, AR, CHK, CLR, CXO, DVN, ECA, EQT, MRO, MUR, NBL, PXD, RRC, SWN, WPX, and XEC
Large-cap defined as >$10 billion of market capitalization; SMID-cap defined as <$10 billion of market capitalization
264%
42%26%
15%
(3%)(24%) (26%) (30%) (35%)
(45%) (47%) (47%)
(73%)
(96%) (129%) (142%) (143%)
Peer G COG Peer B Peer E Peer I Peer D Peer F Peer J Peer P Peer H Peer M Peer A Peer K Peer L Peer N Peer C Peer O
Peer G Peer B Peer E Peer M
9% 8% 7%
4% 4% 3% 3%1% 1%
(1%) (1%) (2%)(4%) (4%)
(13%)(21%) (44%)
Peer M COG Peer F Peer I Peer J Peer D Peer E Peer L Peer B Peer H Peer P Peer G Peer O Peer K Peer N Peer A Peer C
2018 – 2019E Earnings Per Share Growth
2019E Free Cash Flow Yield
SMID-Cap Diversified Large-Cap Permian Large-Cap Diversified SMID-Cap Appalachia
…in addition to Top-Tier Earnings Per Share Growth and Free Cash Flow Yield
~6%
free cash
flow yield1,2
~5%
free cash
flow yield1,2
19
~6% free
cash flow
yield1,2
~7% free
cash flow
yield1,2
Source: FactSet median consensus estimates as of October 23, 2019. ROCE calculated as Net Income plus tax-adjusted Interest Expense divided by the sum of Total Debt and Stockholders’ Equity. Assumes a 21% tax rate for tax-adjusted interest expense. Free Cash Flow Yield calculated as Cash From Operations less Capital Expenditures divided by Market Capitalization.1$2.60 NYMEX based on 10 months of YTD NYMEX settlements and recent strip pricing for November/December. Metrics for COG are based on the midpoint of guidance ranges. Metrics for S&P sectors are based on the median of each respective sector.
21.0%19.0%
15.9%14.7% 14.2%
12.5% 12.0%10.3%
5.7%
6.6%7.1%
5.3%4.8% 4.8% 4.8%
4.4% 4.2%3.3%
40.0%
8.8% 7.5% 5.6% 4.5% 4.3% 3.1% 1.2%
(20.6%)
11.1x
15.8x 16.9x 17.9x 18.0x 18.7x 19.4x21.8x 22.1x
2019E Return on Capital Employed1 2018 – 2019E Earnings Per Share Growth1
2019E Free Cash Flow Yield1 Price / 2019E Earnings Per Share1
At $2.60 NYMEX, Cabot Delivers Financial Metrics that Meet or Exceed the Broader Market
Appendix

2019 and Preliminary 2020 Guidance
~7% free
cash flow
yield1,2~6%
free cash
flow yield1,2
~5%
free cash
flow yield1,2
21
~5% free
cash flow
yield1,2
~6% free
cash flow
yield1,2
~7% free
cash flow
yield1,2
(1) Debt-adjusted share count is calculated as the sum of the annual weighted average shares outstanding plus the incremental “debt shares” by dividing average total debt by the average annual share price(2) Based on forward curves as of the week of October 21, 2019(3) Based on a NYMEX range of $2.50 - $2.75 per Mmbtu(4) Excluding exploratory dry hole costs; includes exploration administration expense and geophysical expenses(5) Excluding stock-based compensation
• 2019E production growth guidance: 17% (midpoint of previous 16% - 18%
guidance range), or 25% per debt-adjusted share1
• Q4 2019E production guidance: 2,375 – 2,425 Mmcfe/d
• 2019E total program spending: $800 - $820 million
• 2019E weighted-average natural gas price differential2: ($0.30) to ($0.35) per Mcf
• 2019E Marcellus Shale wells drilled and completed: ~90 net wells
• 2019E Marcellus Shale wells placed on production: ~90 net wells
• 2019E income tax rate guidance: 23%
• 2019E deferred tax rate guidance: 100%+
Q4 2019E Natural Gas Price Exposure By Index
NYMEX (less $0.35) 30%
Transco Z6 NNY (less $0.65) 17%
Fixed Price (~$2.85) 17%
Leidy Line 13%
TGP Z4 –300 Leg 9%
Power Pricing 8%
Dominion 4%
Millennium 2%
Note: Fixed price percentages above include volumes associated with sales
agreements that have floor prices. An additional deduct of ~$0.05 per Mcf should be
applied to account for fuel use.
Q4 2019E Cost Assumptions ($/Mcfe, unless otherwise noted)
Direct operations $0.08 - $0.09
Transportation and gathering $0.66 - $0.68
Taxes other than income $0.02 - $0.03
Depreciation, depletion and amortization $0.46 - $0.48
Interest expense $0.07 - $0.08
Exploration4 $0.02 - $0.03
General and administrative ($mm)5 $15.5 - $16.5
2019 Guidance
• 2020E production growth guidance: 5% (7% - 8% per debt-adjusted share1)
• 2020E total program spending: $700 - $725 million
• 2020E weighted-average natural gas price differential2: ($0.30) to ($0.35) per Mcf
• 2020E income tax rate guidance: 23%
• 2020E deferred tax rate guidance: 55% - 70%3
Preliminary 2020 Guidance
In addition to the preliminary 2020 plan above that is based on a $2.50 or higher
NYMEX price assumption and delivers 5% production growth from a capital
budget of $700 - $725 million, Cabot is also evaluating a maintenance capital
program if natural gas prices were to continue to remain weak that holds Q4 2020
production flat to the midpoint of the Q4 2019 production guidance range for $575
million of capital spending. Formal 2020 guidance will be issued in February 2020.
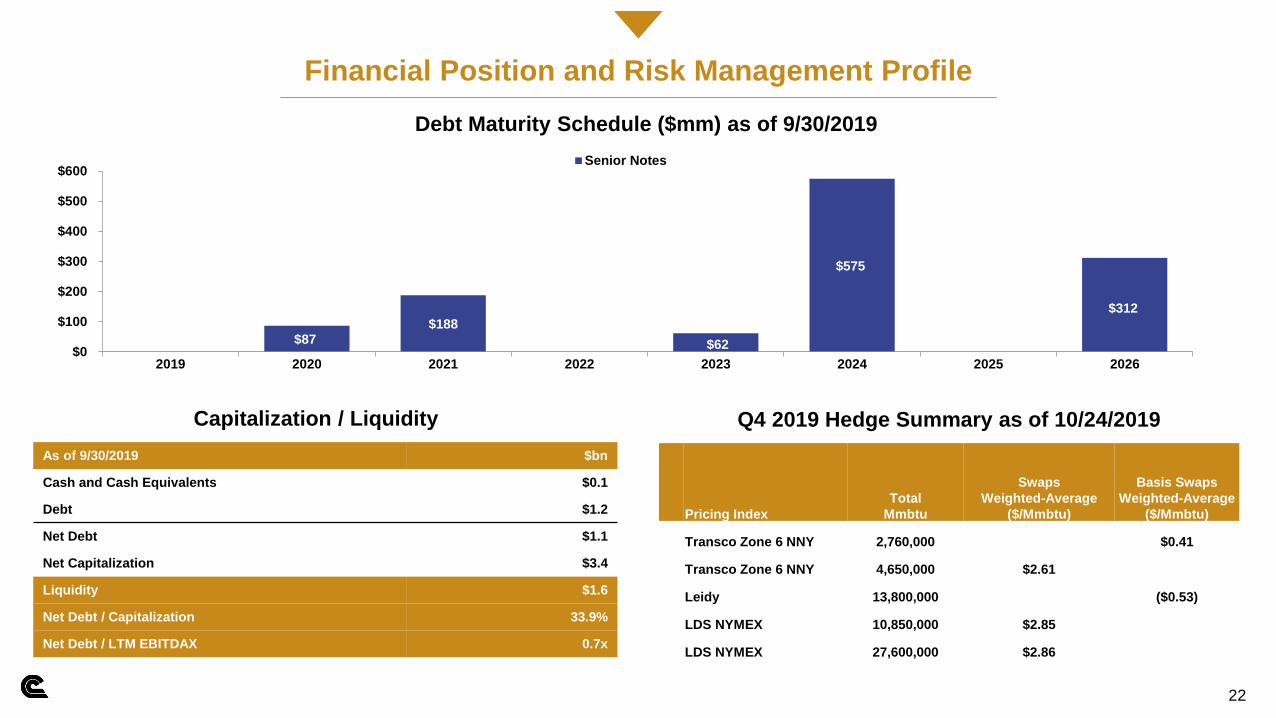
Financial Position and Risk Management Profile
~7% free
cash flow
yield1,2~6%
free cash
flow yield1,2
~5%
free cash
flow yield1,2
22
~5% free
cash flow
yield1,2
~6% free
cash flow
yield1,2
~7% free
cash flow
yield1,2
$87$188
$62
$575
$312
$0
$100
$200
$300
$400
$500
$600
2019 2020 2021 2022 2023 2024 2025 2026
Senior Notes
As of 9/30/2019 $bn
Cash and Cash Equivalents $0.1
Debt $1.2
Net Debt $1.1
Net Capitalization $3.4
Liquidity $1.6
Net Debt / Capitalization 33.9%
Net Debt / LTM EBITDAX 0.7x
Debt Maturity Schedule ($mm) as of 9/30/2019
Capitalization / Liquidity
Total
Mmbtu
Basis Swaps
Weighted-Average
($/Mmbtu)Pricing Index
Swaps
Weighted-Average
($/Mmbtu)
Transco Zone 6 NNY 2,760,000 $0.41
Transco Zone 6 NNY 4,650,000 $2.61
Leidy 13,800,000 ($0.53)
LDS NYMEX 10,850,000 $2.85
LDS NYMEX 27,600,000 $2.86
Q4 2019 Hedge Summary as of 10/24/2019

Reconciliation of Net Income to Adjusted Net Income and Adjusted Earnings Per Share
~7% free
cash flow
yield1,2~6%
free cash
flow yield1,2
~5%
free cash
flow yield1,2
23
~5% free
cash flow
yield1,2
~6% free
cash flow
yield1,2

EBITDAX Calculation and Reconciliation
~7% free
cash flow
yield1,2~6%
free cash
flow yield1,2
~5%
free cash
flow yield1,2
24
~5% free
cash flow
yield1,2
~6% free
cash flow
yield1,2
~7% free
cash flow
yield1,2

Net Debt Reconciliation
~6%
free cash
flow yield1,2
~5%
free cash
flow yield1,2
25
~5% free
cash flow
yield1,2
~6% free
cash flow
yield1,2

Discretionary Cash Flow and Free Cash Flow Calculation and Reconciliation
~7% free
cash flow
yield1,2~6%
free cash
flow yield1,2
~5%
free cash
flow yield1,2
26
~5% free
cash flow
yield1,2
~6% free
cash flow
yield1,2
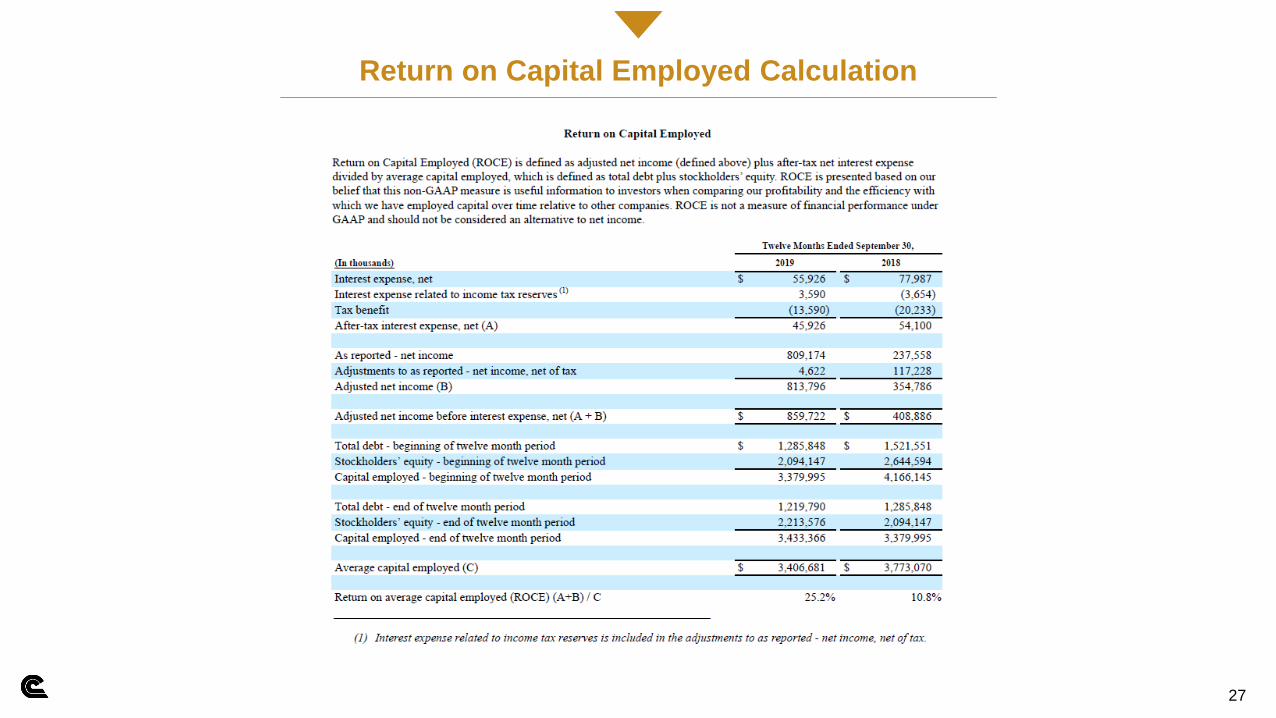
Return on Capital Employed Calculation
~6%
free cash
flow yield1,2
~5%
free cash
flow yield1,2
27
~5% free
cash flow
yield1,2
~6% free
cash flow
yield1,2