Investor Presentation - arescapitalcorp-ir.com · Overview of Ares Management 1. As of December 31,...
51
Ares Capital Corporation - Not for Publication or Distribution Investor Presentation March 2018
Transcript of Investor Presentation - arescapitalcorp-ir.com · Overview of Ares Management 1. As of December 31,...
Ares Capital Corporation - Not for Publication or Distribution
Investor Presentation
March 2018
Ares Capital Corporation - Not for Publication or Distribution 2
Disclaimer
IMPORTANT NOTICE:
Statements included herein may constitute “forward-looking statements,” which may relate to future events or the future performance or financial condition of Ares Capital Corporation (“ARCC”), its investment adviser Ares Capital Management LLC (“ACM”), a subsidiary of Ares Management, L.P. (“Ares Management”), or of Ares Management. These statements are not guarantees of future results or financial condition and involve a number of risks and uncertainties. Actual results and conditions may differ materially from those in the forward-looking statements as a result of a number of factors, including those described from time to time in the filings of ARCC and Ares Management with the Securities and Exchange Commission (“SEC”).
The information contained in this presentation is summary information that is intended to be considered in the context of the SEC filings of ARCC and Ares Management and other public announcements that ARCC or Ares Management may make, by press release or otherwise, from time to time. Neither ARCC nor Ares Management undertakes any duty or obligation to publicly update or revise the forward-looking statements or other information contained in this presentation. These materials contain information about ARCC, ACM and Ares Management, and certain of their respective personnel and affiliates, information about their respective historical performance and general information about the market. You should not view information related to the past performance of ARCC, ACM or Ares Management or information about the market, as indicative of future results, the achievement of which cannot be assured.
Nothing in these materials should be construed as a recommendation to invest in any securities that may be issued by ARCC or Ares Management or as legal, accounting or tax advice. None of ARCC, ACM, Ares Management or any affiliate of ARCC, ACM or Ares Management makes any representation or warranty, express or implied, as to the accuracy or completeness of the information contained herein and nothing contained herein shall be relied upon as a promise or representation whether as to the past or future performance. Certain information set forth herein includes estimates and projections and involves significant elements of subjective judgment and analysis. Further, such information, unless otherwise stated, is before giving effect to management and incentive fees and deductions for taxes. No representations are made as to the accuracy of such estimates or projections or that all assumptions relating to such estimates or projections have been considered or stated or that such estimates or projections will be realized.
These materials may contain confidential and proprietary information, and their distribution or the divulgence of any of their contents to any person, other than the person to whom they were originally delivered and such person’s advisers, without the prior consent of ARCC, ACM or Ares Management, as applicable, is prohibited. You are advised that United States securities laws restrict any person who has material, non-public information about a company from purchasing or selling securities of such company (and options, warrants and rights relating thereto) and from communicating such information to any other person under circumstances in which it is reasonably foreseeable that such person is likely to purchase or sell such securities. You agree not to purchase or sell such securities in violation of any such laws.
These materials are not intended as an offer to sell, or the solicitation of an offer to purchase, any security, the offer and/or sale of which can only be made by definitive offering documentation. Any offer or solicitation with respect to any securities that may be issued by ARCC, Ares Management or any of their affiliates will be made only by means of definitive offering memoranda or prospectus, which will be provided to prospective investors and will contain material information that is not set forth herein, including risk factors relating to any such investment.
S&P Disclaimer NoticeThis may contain information obtained from third parties, including ratings from credit ratings agencies such as Standard & Poor’s. Reproduction and distribution of third party content in any form is prohibited except with the prior written permission of the related third party. Third party content providers do not guarantee the accuracy, completeness, timeliness or availability of any information, including ratings, and are not responsible for any errors or omissions (negligent or otherwise), regardless of the cause, or for the results obtained from the use of such content. THIRD PARTY CONTENT PROVIDERS GIVE NO EXPRESS OR IMPLIED WARRANTIES, INCLUDING, BUT NOT LIMITED TO, ANY WARRANTIES OF MERCHANTABILITY OR FITNESS FOR A PARTICULAR PURPOSE OR USE. THIRD PARTY CONTENT PROVIDERS SHALL NOT BE LIABLE FOR ANY DIRECT, INDIRECT, INCIDENTAL, EXEMPLARY, COMPENSATORY, PUNITIVE, SPECIAL OR CONSEQUENTIAL DAMAGES, COSTS, EXPENSES, LEGAL FEES, OR LOSSES (INCLUDING LOST INCOME OR PROFITS AND OPPORTUNITY COSTS OR LOSSES CAUSED BY NEGLIGENCE) IN CONNECTION WITH ANY USE OF THEIR CONTENT, INCLUDING RATINGS. Credit ratings are statements of opinions and are not statements of fact or recommendations to purchase, hold or sell securities. They do not address the suitability of securities or the suitability of securities for investment purposes, and should not be relied on as investment advice.
Ares Capital Corporation - Not for Publication or Distribution 3
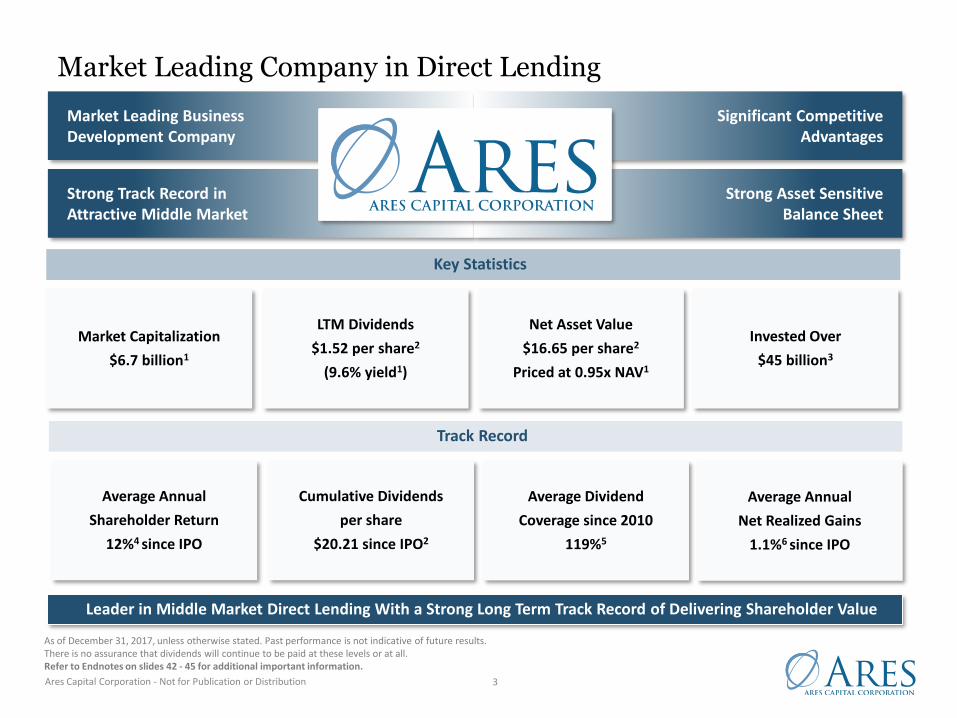
Market Leading Company in Direct Lending
$16.47
Market Leading Business Development Company
Strong Track Record in Attractive Middle Market
Significant CompetitiveAdvantages
Strong Asset Sensitive Balance Sheet
Cumulative Dividends
per share
$20.21 since IPO2
Invested Over
$45 billion3
Track Record
Leader in Middle Market Direct Lending With a Strong Long Term Track Record of Delivering Shareholder Value
Average Dividend
Coverage since 2010
119%5
Average Annual
Net Realized Gains
1.1%6 since IPO
Average Annual
Shareholder Return
12%4 since IPO
Net Asset Value
$16.65 per share2
Priced at 0.95x NAV1
Market Capitalization
$6.7 billion1
LTM Dividends
$1.52 per share2
(9.6% yield1)
Key Statistics
As of December 31, 2017, unless otherwise stated. Past performance is not indicative of future results. There is no assurance that dividends will continue to be paid at these levels or at all.Refer to Endnotes on slides 42 - 45 for additional important information.

Ares Capital Corporation - Not for Publication or Distribution 4
CREDIT
5%8%
10%14%
17%
SyndicatedLoans
High YieldBonds
Europe DirectLending
U.S. DirectLending
StructuredCredit
Overview of Ares Management
1. As of December 31, 2017, AUM amounts include funds managed by Ivy Hill Asset Management, L.P., a wholly owned portfolio company of Ares Capital Corporation and a registered investment adviser.
Please refer to the Performance Notes on slides 47 – 49 for additional definitions, information and notes.
Ares Management, L.P. is a leading global alternative asset manager with three distinct but complementary investment groups
NET PERFORMANCE RETURNS. Credit: 5% for U.S. Syndicated Loan funds, 7% for U.S. High Yield funds, and 13% for Structured Credit. Private Equity: 17% for ACOF I-IV Aggregate, 9% for EIF Aggregate and 8% for Special Situations. Real Estate: 10% for U.S. Equity, 7% for U.S. Debt and 8% for Europe Equity
REAL ESTATE
7%
15% 15%
Debt U.S. Equity Europe Equity
PRIVATE EQUITY
Global FootprintAres ProfileAs of December 31st, 2017
Founded: 1997
AUM(1): $106bn
Employees: 1,000+
Investment Professionals: ~400
Global Offices: 15+
Listing: NYSE – Market Capitalization $5bn
24%
14% 13%
ACOF I-IV Aggregate EIF Aggregate Special Situations
Gross Annualized Returns Since Inception except Europe and U.S. Direct Lending Asset Level Realized Gross IRRs ITD
Net Annual Return On Equity for ACRE since IPO
Gross IRRs Based on Actual and Projected Cash Flows
Gross Asset Level IRRs Since Inception
Gross Annualized IRR Since Inception
Assets Under Management
$71.7 billion $24.5 billion $10.2 billion
Strategies
High Yield Bonds
Syndicated Loans
Structured Credit
Direct Lending/ARCC
Corporate Private Equity
U.S. Power & Energy Infrastructure
Special Situations
Real Estate Private Equity
Real Estate Debt
Historical Returns

Ares Capital Corporation - Not for Publication or Distribution 5
We have experienced teams across the platform that are positioned for excellence in investing and client service
Advantages
Syndication, Trading & Servicing
6 traders in the U.S. and Europe6 dedicated capital markets professionals
~30 direct lending professionals focused solely on asset management
Origination, Research & Investment Management
14 portfolio managers~55 industry research and structured credit professionals
~120 direct origination professionals11 distressed and restructuring specialists(2)
$71.7 billion AUM(1)
25+ Partners averaging 24 years of experience
~235 dedicated investment professionals
Investor Relations & Business Operations
Established investor relations and client service across the Americas,Europe, Asia, Australia and the Middle East
Note: As of December 31, 2017, unless otherwise noted.1. As of December 31, 2017 AUM amounts include funds managed by Ivy Hill Asset Management, L.P., a wholly owned portfolio company of Ares Capital
Corporation and a registered investment adviser. 2. The performance, awards/ratings noted herein relate only to selected funds/strategies and may not be representative of any given client’s experience and
should not be viewed as indicative of Ares’ past performance or its funds’ future performance. All investments involve risk, including possible loss of principal.Please refer to the Performance Notes on slide 50 for additional information on accolades.
Deep Investment Opportunity Set
Leading Platform of Liquid and Direct Lending Strategies
Ares’ Extensive Credit Group Provides Many Benefits to ARCC
Integrated scaled global platform combines direct origination, deep fundamental credit research and broad perspective of relative value
Access to Differentiated Information to Inform
Credit Decisions
Ability to Express Relative Value
Accolades (2)
Global SponsoredDeal of the Year -
2016
Lender of the YearNorth America
2014, 2015 & 2016
ARCC Received Most Honored Designation & Highest
Rankings for Best CEO, CFO, IR Professional and Investor
Relations Program
Top Quartile Rankings for Several Funds
Syndicated Loans
High Yield
Structured Credit / CMBS
Asset Based Lending
Middle Market Cash Flow Loans
Liquid Credit Illiquid Credit
Project Finance
Private Mezz/ Opportunistic
Ares Capital Corporation - Not for Publication or Distribution 6
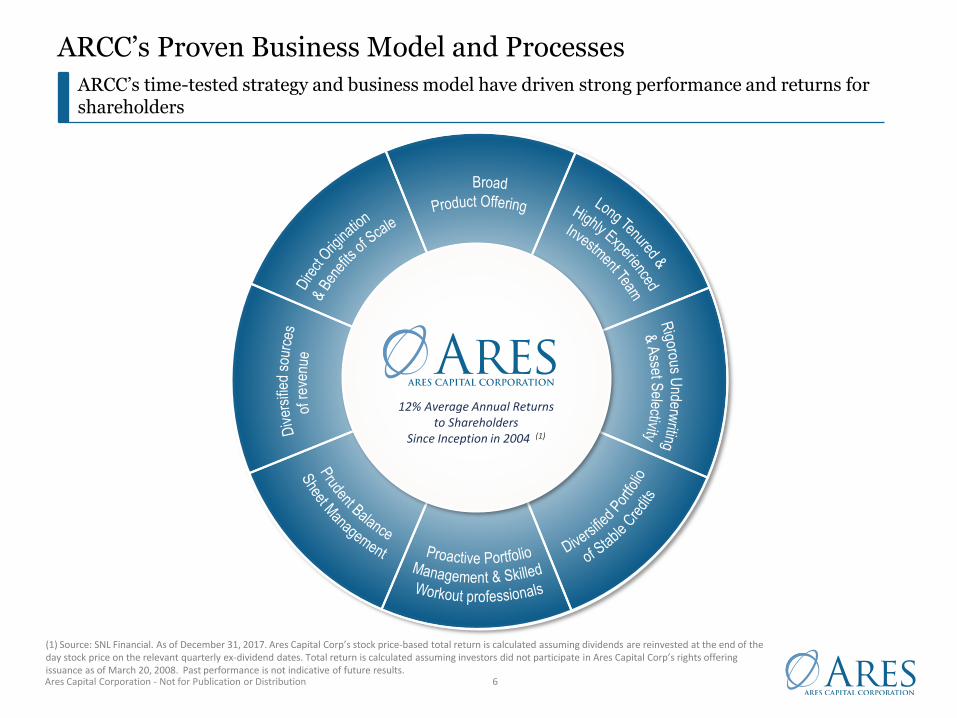
ARCC’s Proven Business Model and Processes
ARCC’s time-tested strategy and business model have driven strong performance and returns for shareholders
(1) Source: SNL Financial. As of December 31, 2017. Ares Capital Corp’s stock price-based total return is calculated assuming dividends are reinvested at the end of the day stock price on the relevant quarterly ex-dividend dates. Total return is calculated assuming investors did not participate in Ares Capital Corp’s rights offering issuance as of March 20, 2008. Past performance is not indicative of future results.
12% Average Annual Returns to Shareholders
Since Inception in 2004 (1)
Ares Capital Corporation - Not for Publication or Distribution 7
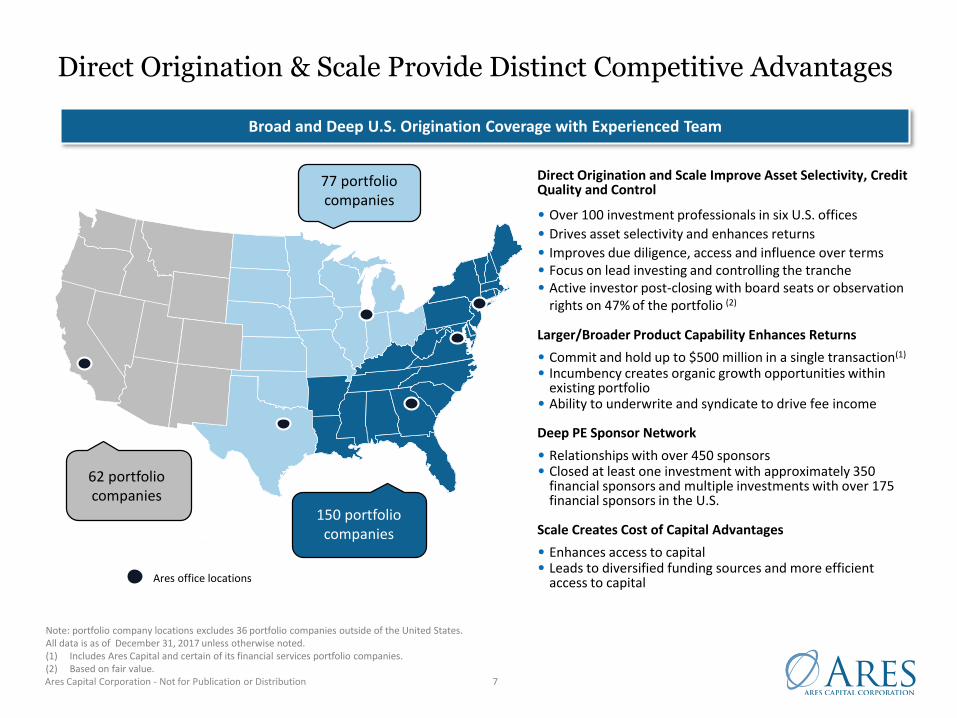
Broad and Deep U.S. Origination Coverage with Experienced Team
Direct Origination & Scale Provide Distinct Competitive Advantages
Direct Origination and Scale Improve Asset Selectivity, Credit Quality and Control
• Over 100 investment professionals in six U.S. offices
• Drives asset selectivity and enhances returns
• Improves due diligence, access and influence over terms• Focus on lead investing and controlling the tranche• Active investor post-closing with board seats or observation
rights on 47% of the portfolio (2)
Larger/Broader Product Capability Enhances Returns
• Commit and hold up to $500 million in a single transaction(1)
• Incumbency creates organic growth opportunities within existing portfolio
• Ability to underwrite and syndicate to drive fee income
Deep PE Sponsor Network
• Relationships with over 450 sponsors• Closed at least one investment with approximately 350
financial sponsors and multiple investments with over 175 financial sponsors in the U.S.
Scale Creates Cost of Capital Advantages
• Enhances access to capital• Leads to diversified funding sources and more efficient
access to capital
Note: portfolio company locations excludes 36 portfolio companies outside of the United States. All data is as of December 31, 2017 unless otherwise noted.(1) Includes Ares Capital and certain of its financial services portfolio companies.(2) Based on fair value.
Ares office locations
77 portfolio companies
150 portfolio companies
62 portfolio companies
Ares Capital Corporation - Not for Publication or Distribution 8
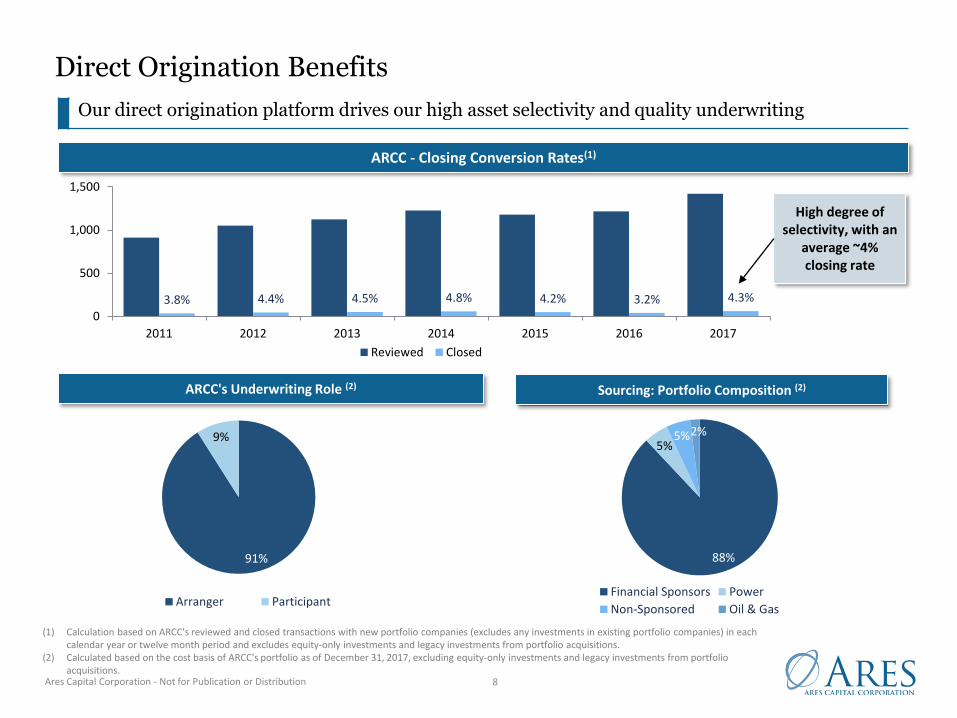
Direct Origination Benefits
Our direct origination platform drives our high asset selectivity and quality underwriting
ARCC - Closing Conversion Rates(1)
High degree of selectivity, with an
average ~4% closing rate
(1) Calculation based on ARCC's reviewed and closed transactions with new portfolio companies (excludes any investments in existing portfolio companies) in each calendar year or twelve month period and excludes equity-only investments and legacy investments from portfolio acquisitions.
(2) Calculated based on the cost basis of ARCC's portfolio as of December 31, 2017, excluding equity-only investments and legacy investments from portfolio acquisitions.
ARCC's Underwriting Role (2) Sourcing: Portfolio Composition (2)
91%
9%
Arranger Participant
3.8% 4.4% 4.5% 4.8% 4.2% 3.2% 4.3%
0
500
1,000
1,500
2011 2012 2013 2014 2015 2016 2017
Reviewed Closed
88%
5%5%2%
Financial Sponsors Power
Non-Sponsored Oil & Gas
Ares Capital Corporation - Not for Publication or Distribution 9
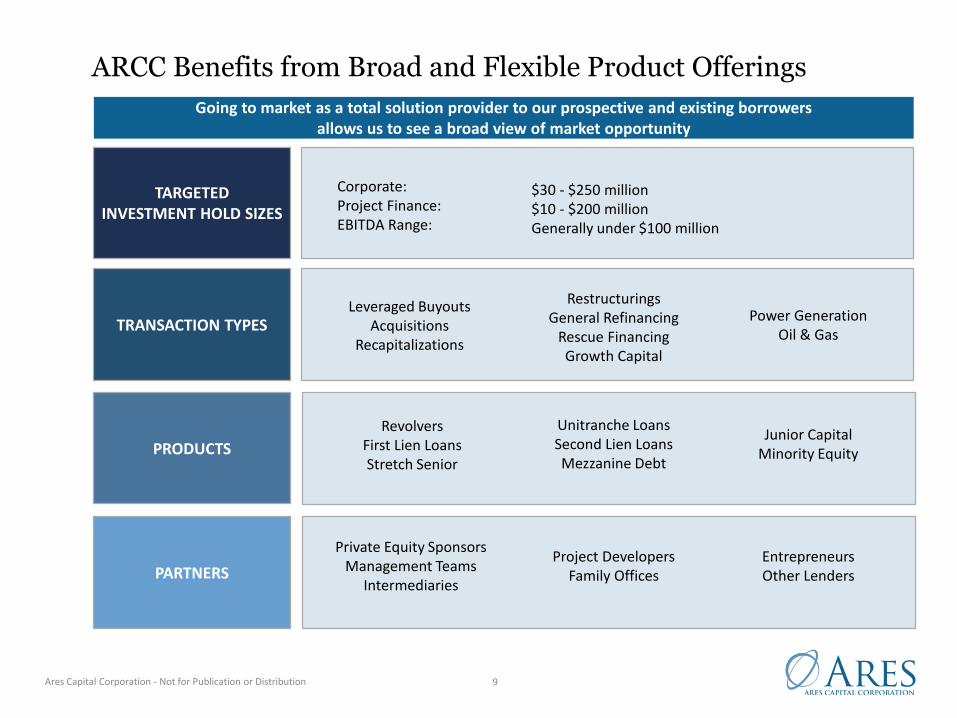
TARGETEDINVESTMENT HOLD SIZES
TRANSACTION TYPES
PRODUCTS
PARTNERS
ARCC Benefits from Broad and Flexible Product Offerings
Corporate:Project Finance:EBITDA Range:
$30 - $250 million$10 - $200 millionGenerally under $100 million
Leveraged BuyoutsAcquisitions
Recapitalizations
RestructuringsGeneral Refinancing
Rescue FinancingGrowth Capital
Power GenerationOil & Gas
RevolversFirst Lien LoansStretch Senior
Unitranche LoansSecond Lien LoansMezzanine Debt
Junior CapitalMinority Equity
Private Equity SponsorsManagement Teams
Intermediaries
Project DevelopersFamily Offices
EntrepreneursOther Lenders
Going to market as a total solution provider to our prospective and existing borrowers allows us to see a broad view of market opportunity
Ares Capital Corporation - Not for Publication or Distribution 10
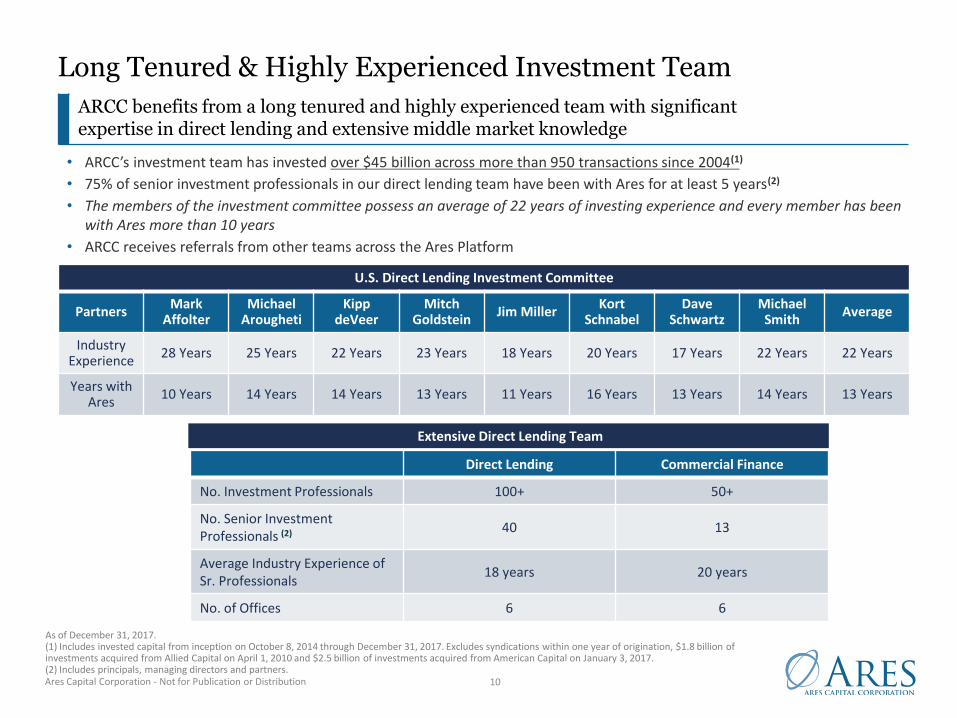
Long Tenured & Highly Experienced Investment Team
ARCC benefits from a long tenured and highly experienced team with significant expertise in direct lending and extensive middle market knowledge
• ARCC’s investment team has invested over $45 billion across more than 950 transactions since 2004(1)
• 75% of senior investment professionals in our direct lending team have been with Ares for at least 5 years(2)
• The members of the investment committee possess an average of 22 years of investing experience and every member has been with Ares more than 10 years
• ARCC receives referrals from other teams across the Ares Platform
U.S. Direct Lending Investment Committee
PartnersMark
AffolterMichael
AroughetiKipp
deVeerMitch
GoldsteinJim Miller
Kort Schnabel
Dave Schwartz
Michael Smith
Average
Industry Experience
28 Years 25 Years 22 Years 23 Years 18 Years 20 Years 17 Years 22 Years 22 Years
Years with Ares
10 Years 14 Years 14 Years 13 Years 11 Years 16 Years 13 Years 14 Years 13 Years
Direct Lending Commercial Finance
No. Investment Professionals 100+ 50+
No. Senior Investment Professionals (2) 40 13
Average Industry Experience of Sr. Professionals
18 years 20 years
No. of Offices 6 6
As of December 31, 2017.(1) Includes invested capital from inception on October 8, 2014 through December 31, 2017. Excludes syndications within one year of origination, $1.8 billion of investments acquired from Allied Capital on April 1, 2010 and $2.5 billion of investments acquired from American Capital on January 3, 2017.(2) Includes principals, managing directors and partners.
Extensive Direct Lending Team
Ares Capital Corporation - Not for Publication or Distribution 11
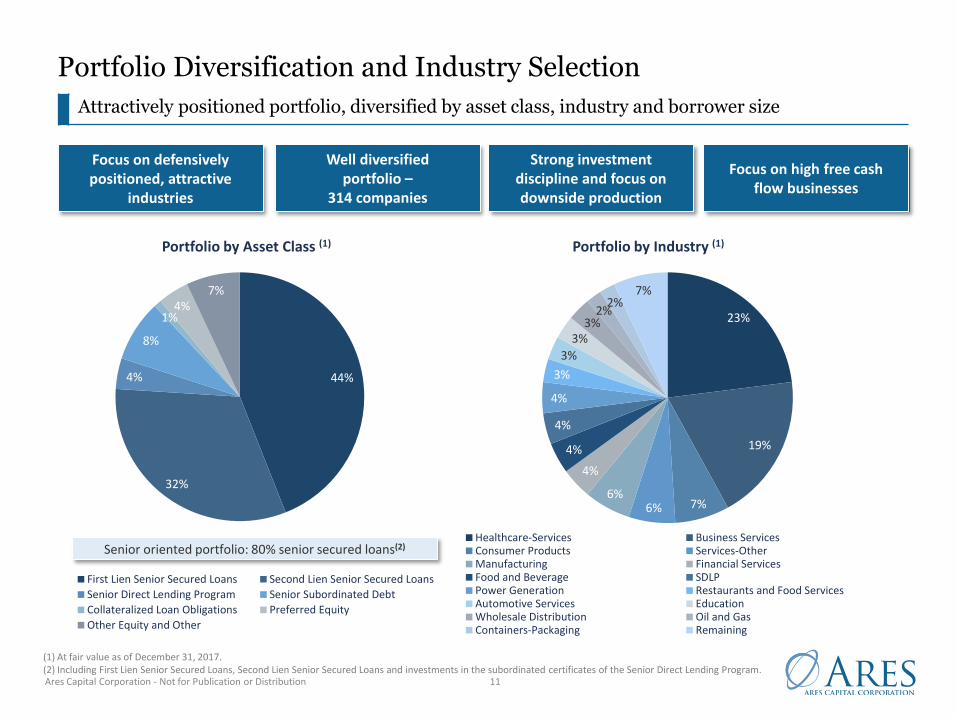
44%
32%
4%
8%
1%4%
7%
Portfolio by Asset Class (1)
First Lien Senior Secured Loans Second Lien Senior Secured Loans
Senior Direct Lending Program Senior Subordinated Debt
Collateralized Loan Obligations Preferred Equity
Other Equity and Other
Portfolio Diversification and Industry Selection
Attractively positioned portfolio, diversified by asset class, industry and borrower size
(1) At fair value as of December 31, 2017.(2) Including First Lien Senior Secured Loans, Second Lien Senior Secured Loans and investments in the subordinated certificates of the Senior Direct Lending Program.
Well diversified portfolio –
314 companies
Focus on high free cash flow businesses
Strong investment discipline and focus on downside production
Senior oriented portfolio: 80% senior secured loans(2)
Focus on defensively positioned, attractive
industries
23%
19%
7%6%6%
4%
4%
4%
4%
3%
3%
3%3%
2%2%
7%
Portfolio by Industry (1)
Healthcare-Services Business ServicesConsumer Products Services-OtherManufacturing Financial ServicesFood and Beverage SDLPPower Generation Restaurants and Food ServicesAutomotive Services EducationWholesale Distribution Oil and GasContainers-Packaging Remaining
Ares Capital Corporation - Not for Publication or Distribution 12
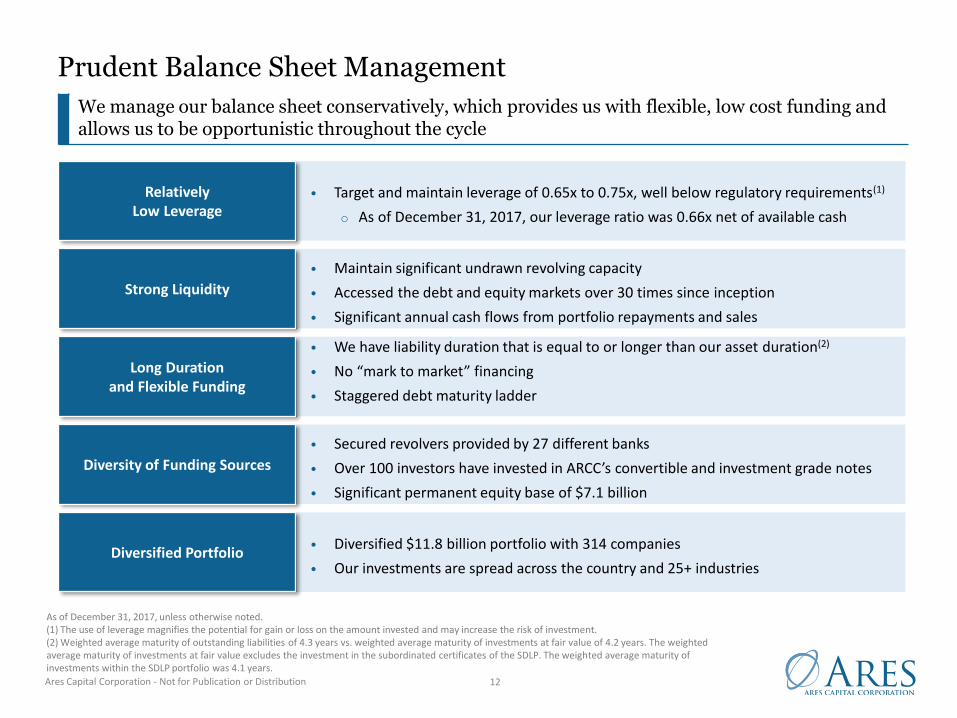
Prudent Balance Sheet Management
We manage our balance sheet conservatively, which provides us with flexible, low cost funding and allows us to be opportunistic throughout the cycle
• Target and maintain leverage of 0.65x to 0.75x, well below regulatory requirements(1)
o As of December 31, 2017, our leverage ratio was 0.66x net of available cash
Relatively Low Leverage
As of December 31, 2017, unless otherwise noted.(1) The use of leverage magnifies the potential for gain or loss on the amount invested and may increase the risk of investment.(2) Weighted average maturity of outstanding liabilities of 4.3 years vs. weighted average maturity of investments at fair value of 4.2 years. The weighted average maturity of investments at fair value excludes the investment in the subordinated certificates of the SDLP. The weighted average maturity of investments within the SDLP portfolio was 4.1 years.
• Maintain significant undrawn revolving capacity
• Accessed the debt and equity markets over 30 times since inception
• Significant annual cash flows from portfolio repayments and sales
Strong Liquidity
• We have liability duration that is equal to or longer than our asset duration(2)
• No “mark to market” financing
• Staggered debt maturity ladder
Long Duration and Flexible Funding
• Secured revolvers provided by 27 different banks
• Over 100 investors have invested in ARCC’s convertible and investment grade notes
• Significant permanent equity base of $7.1 billion
Diversity of Funding Sources
• Diversified $11.8 billion portfolio with 314 companies
• Our investments are spread across the country and 25+ industriesDiversified Portfolio
Ares Capital Corporation - Not for Publication or Distribution
Financial and Portfolio Performance
Ares Capital Corporation - Not for Publication or Distribution 14
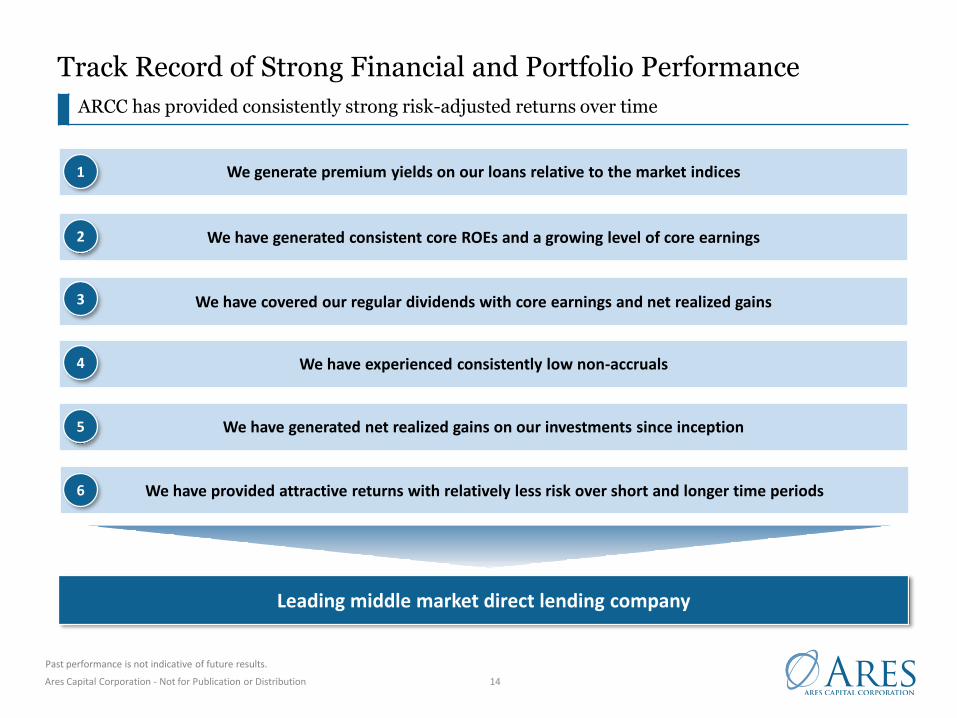
Track Record of Strong Financial and Portfolio Performance
ARCC has provided consistently strong risk-adjusted returns over time
We generate premium yields on our loans relative to the market indices
We have generated consistent core ROEs and a growing level of core earnings
We have covered our regular dividends with core earnings and net realized gains
We have experienced consistently low non-accruals
Leading middle market direct lending company
We have generated net realized gains on our investments since inception
Past performance is not indicative of future results.
We have provided attractive returns with relatively less risk over short and longer time periods
1
2
3
4
5
6
Ares Capital Corporation - Not for Publication or Distribution 15
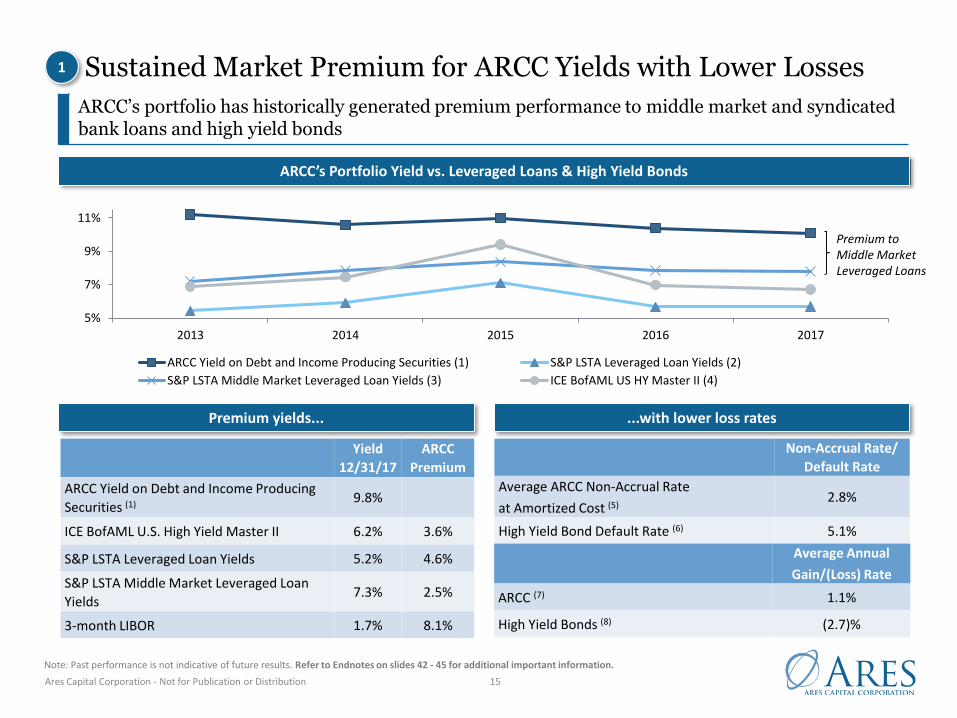
Sustained Market Premium for ARCC Yields with Lower Losses
ARCC’s portfolio has historically generated premium performance to middle market and syndicated bank loans and high yield bonds
Premium yields... ...with lower loss rates
ARCC’s Portfolio Yield vs. Leveraged Loans & High Yield Bonds
5%
7%
9%
11%
2013 2014 2015 2016 2017
ARCC Yield on Debt and Income Producing Securities (1) S&P LSTA Leveraged Loan Yields (2)
S&P LSTA Middle Market Leveraged Loan Yields (3) ICE BofAML US HY Master II (4)
Note: Past performance is not indicative of future results. Refer to Endnotes on slides 42 - 45 for additional important information.
Non-Accrual Rate/
Default Rate
Average ARCC Non-Accrual Rate
at Amortized Cost (5)2.8%
High Yield Bond Default Rate (6) 5.1%
Average Annual
Gain/(Loss) Rate
ARCC (7) 1.1%
High Yield Bonds (8) (2.7)%
Yield
12/31/17
ARCC
Premium
ARCC Yield on Debt and Income Producing
Securities (1)9.8%
ICE BofAML U.S. High Yield Master II 6.2% 3.6%
S&P LSTA Leveraged Loan Yields 5.2% 4.6%
S&P LSTA Middle Market Leveraged Loan
Yields7.3% 2.5%
3-month LIBOR 1.7% 8.1%
Premium to Middle Market Leveraged Loans
1
Ares Capital Corporation - Not for Publication or Distribution 16
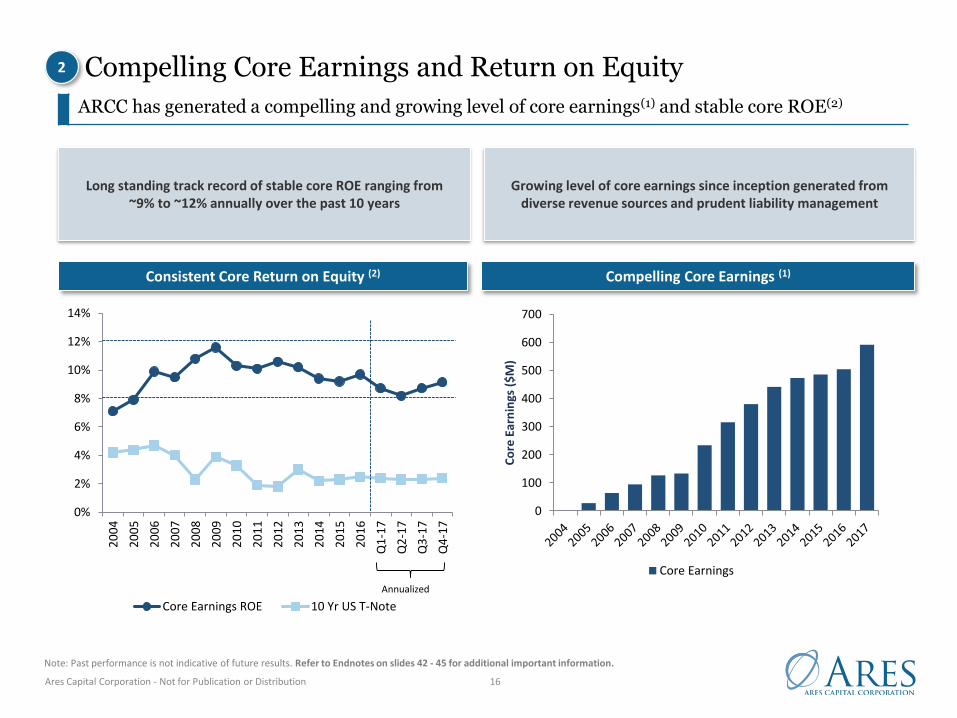
Long standing track record of stable core ROE ranging from ~9% to ~12% annually over the past 10 years
Growing level of core earnings since inception generated from diverse revenue sources and prudent liability management
Consistent Core Return on Equity (2) Compelling Core Earnings (1)
0%
2%
4%
6%
8%
10%
12%
14%
20
04
20
05
20
06
20
07
20
08
20
09
20
10
20
11
20
12
20
13
20
14
20
15
20
16
Q1
-17
Q2
-17
Q3
-17
Q4
-17
Core Earnings ROE 10 Yr US T-Note
0
100
200
300
400
500
600
700
Co
re E
arn
ings
($
M)
Core Earnings
Note: Past performance is not indicative of future results. Refer to Endnotes on slides 42 - 45 for additional important information.
Annualized
2
ARCC has generated a compelling and growing level of core earnings(1) and stable core ROE(2)
Compelling Core Earnings and Return on Equity
Ares Capital Corporation - Not for Publication or Distribution 17
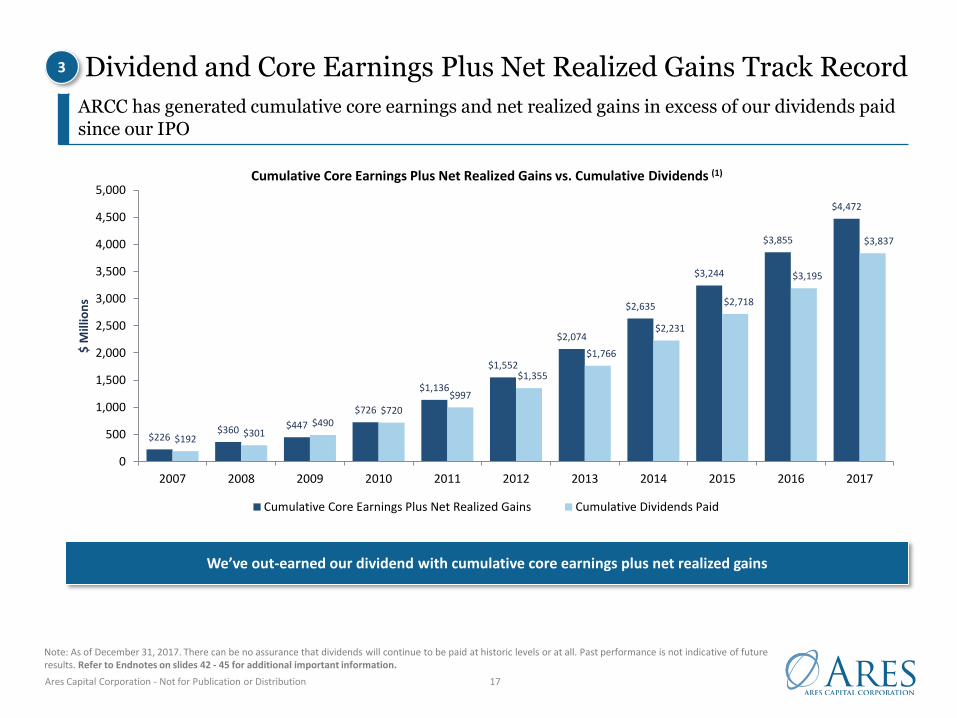
Dividend and Core Earnings Plus Net Realized Gains Track Record
ARCC has generated cumulative core earnings and net realized gains in excess of our dividends paid since our IPO
Note: As of December 31, 2017. There can be no assurance that dividends will continue to be paid at historic levels or at all. Past performance is not indicative of future results. Refer to Endnotes on slides 42 - 45 for additional important information.
We’ve out-earned our dividend with cumulative core earnings plus net realized gains
Cumulative Core Earnings Plus Net Realized Gains vs. Cumulative Dividends (1)
$226 $360 $447
$726
$1,136
$1,552
$2,074
$2,635
$3,244
$3,855
$4,472
$192 $301
$490 $720
$997
$1,355
$1,766
$2,231
$2,718
$3,195
$3,837
0
500
1,000
1,500
2,000
2,500
3,000
3,500
4,000
4,500
5,000
2007 2008 2009 2010 2011 2012 2013 2014 2015 2016 2017
$ M
illio
ns
Cumulative Core Earnings Plus Net Realized Gains Cumulative Dividends Paid
3
Ares Capital Corporation - Not for Publication or Distribution 18
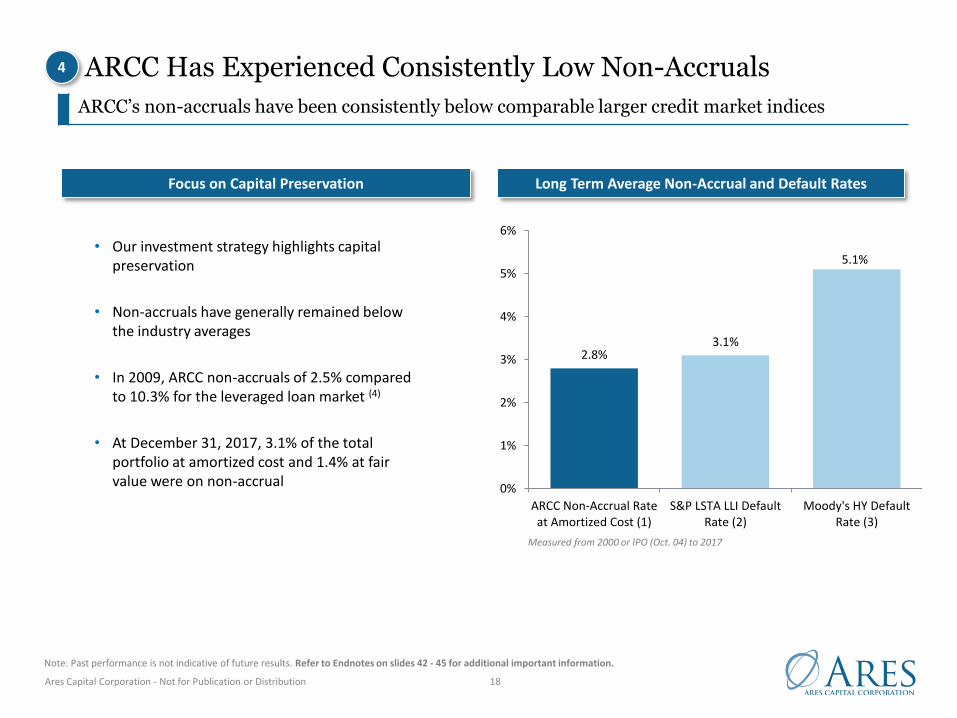
ARCC Has Experienced Consistently Low Non-Accruals
ARCC’s non-accruals have been consistently below comparable larger credit market indices
Long Term Average Non-Accrual and Default Rates
• Our investment strategy highlights capital preservation
• Non-accruals have generally remained below the industry averages
• In 2009, ARCC non-accruals of 2.5% compared to 10.3% for the leveraged loan market (4)
• At December 31, 2017, 3.1% of the total portfolio at amortized cost and 1.4% at fair value were on non-accrual
Note: Past performance is not indicative of future results. Refer to Endnotes on slides 42 - 45 for additional important information.
2.8%3.1%
5.1%
0%
1%
2%
3%
4%
5%
6%
ARCC Non-Accrual Rateat Amortized Cost (1)
S&P LSTA LLI DefaultRate (2)
Moody's HY DefaultRate (3)
4
Focus on Capital Preservation
Measured from 2000 or IPO (Oct. 04) to 2017
Ares Capital Corporation - Not for Publication or Distribution 19
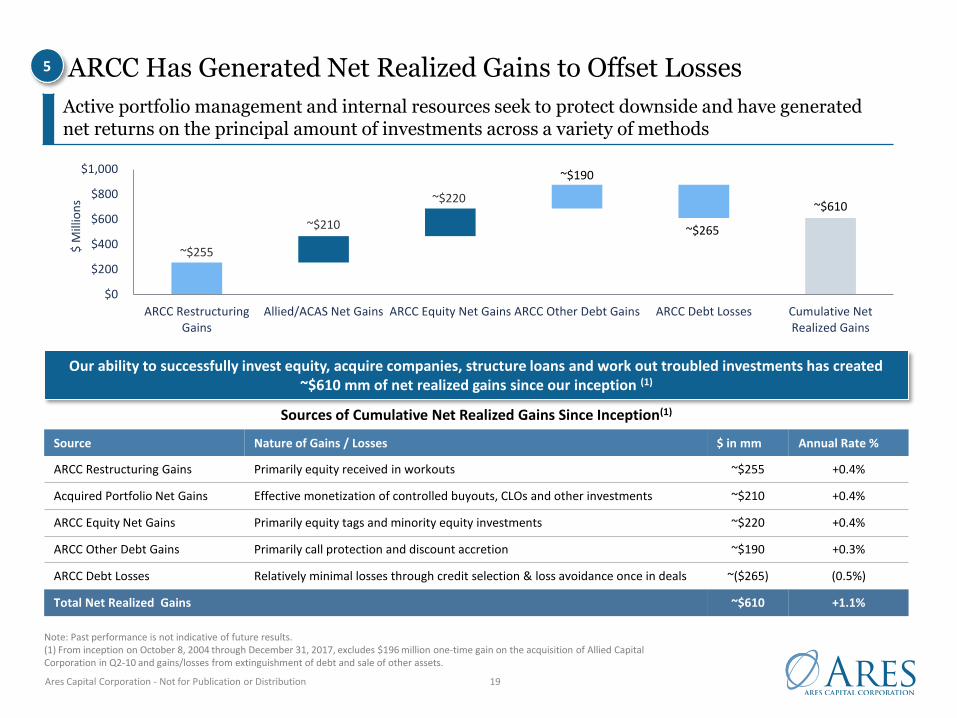
ARCC Has Generated Net Realized Gains to Offset Losses
Active portfolio management and internal resources seek to protect downside and have generated net returns on the principal amount of investments across a variety of methods
Our ability to successfully invest equity, acquire companies, structure loans and work out troubled investments has created ~$610 mm of net realized gains since our inception (1)
Note: Past performance is not indicative of future results. (1) From inception on October 8, 2004 through December 31, 2017, excludes $196 million one‐time gain on the acquisition of Allied Capital Corporation in Q2‐10 and gains/losses from extinguishment of debt and sale of other assets.
Sources of Cumulative Net Realized Gains Since Inception(1)
Source Nature of Gains / Losses $ in mm Annual Rate %
ARCC Restructuring Gains Primarily equity received in workouts ~$255 +0.4%
Acquired Portfolio Net Gains Effective monetization of controlled buyouts, CLOs and other investments ~$210 +0.4%
ARCC Equity Net Gains Primarily equity tags and minority equity investments ~$220 +0.4%
ARCC Other Debt Gains Primarily call protection and discount accretion ~$190 +0.3%
ARCC Debt Losses Relatively minimal losses through credit selection & loss avoidance once in deals ~($265) (0.5%)
Total Net Realized Gains ~$610 +1.1%
~$255
~$210
~$220
~$190
~$265
~$610
$0
$200
$400
$600
$800
$1,000
ARCC RestructuringGains
Allied/ACAS Net Gains ARCC Equity Net Gains ARCC Other Debt Gains ARCC Debt Losses Cumulative NetRealized Gains
$ M
illio
ns
5
Ares Capital Corporation - Not for Publication or Distribution 20
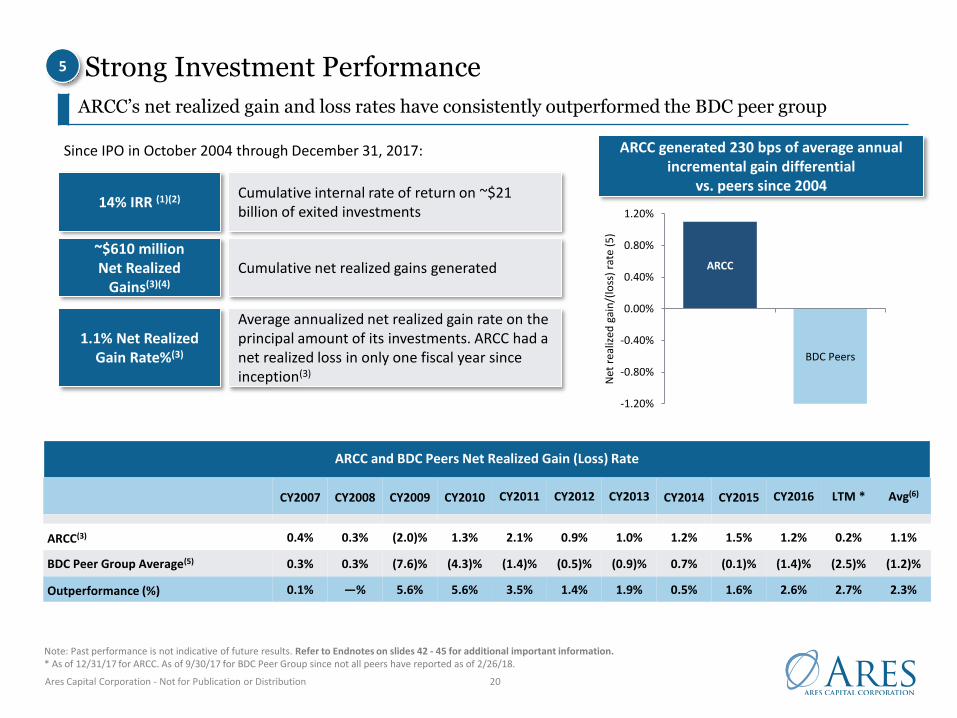
Strong Investment Performance
ARCC’s net realized gain and loss rates have consistently outperformed the BDC peer group
Note: Past performance is not indicative of future results. Refer to Endnotes on slides 42 - 45 for additional important information.* As of 12/31/17 for ARCC. As of 9/30/17 for BDC Peer Group since not all peers have reported as of 2/26/18.
ARCC and BDC Peers Net Realized Gain (Loss) Rate
CY2007 CY2008 CY2009 CY2010 CY2011 CY2012 CY2013 CY2014 CY2015 CY2016 LTM * Avg(6)
ARCC(3) 0.4% 0.3% (2.0)% 1.3% 2.1% 0.9% 1.0% 1.2% 1.5% 1.2% 0.2% 1.1%
BDC Peer Group Average(5) 0.3% 0.3% (7.6)% (4.3)% (1.4)% (0.5)% (0.9)% 0.7% (0.1)% (1.4)% (2.5)% (1.2)%
Outperformance (%) 0.1% —% 5.6% 5.6% 3.5% 1.4% 1.9% 0.5% 1.6% 2.6% 2.7% 2.3%
ARCC
BDC Peers
-1.20%
-0.80%
-0.40%
0.00%
0.40%
0.80%
1.20%
ARCC BDC Peers
Net
rea
lized
gai
n/(
loss
) ra
te (
5)
ARCC generated 230 bps of average annual incremental gain differential
vs. peers since 200414% IRR (1)(2) Cumulative internal rate of return on ~$21
billion of exited investments
~$610 million Net Realized
Gains(3)(4)
Cumulative net realized gains generated
1.1% Net Realized Gain Rate%(3)
Average annualized net realized gain rate on the principal amount of its investments. ARCC had a net realized loss in only one fiscal year since inception(3)
Since IPO in October 2004 through December 31, 2017:
5

Ares Capital Corporation - Not for Publication or Distribution 21
ARCC’s Portfolio Has Generated Higher Returns with Less Risk
Our investment strategy and competitive advantages have led to attractive returns with lower volatility
Annual Returns (Dividends & Change in NAV)(1)
3 Years (2)(3) 5 Years (2)(3) 10 Years(2)(3)
Volatility of Annual Returns (Standard Deviation of Dividends & Change in NAV)(1)
5 Years (2)(3) 10 Years (2)(3)3 Years(2)(3)
Note: Past performance is not indicative of future results. Refer to Endnotes on slides 42 - 45 for additional important information.
6
9.1%
6.3% 5.9%
3.9%
0%
5%
10%
15%
ARCC BDCComparable
Universe
High YieldIndex
Loan Index
10.9%
8.8%
6.4%
4.1%
ARCC BDCComparable
Universe
High YieldIndex
Loan Index
11.2%
6.9%7.7%
4.7%
ARCC BDCComparable
Universe
High YieldIndex
Loan Index
1.5%
4.4%5.9%
3.1%
0%
5%
10%
15%
ARCC BDCComparable
Universe
High YieldIndex
Loan Index
1.8%
4.4%5.2%
2.6%
ARCC BDCComparable
Universe
High YieldIndex
Loan Index
8.9%9.7%
12.2% 11.6%
ARCC BDCComparable
Universe
High YieldIndex
Loan Index
Ares Capital Corporation - Not for Publication or Distribution 22
ARCC (2)
S&P 500 Index
ML HY Master II index
SNL U.S. RICs
CSLLISP LSTA LLI
BKX TR Index
-100%
-50%
0%
50%
100%
150%
200%
250%
300%
350%
400%
Dec-04 Dec-05 Dec-06 Dec-07 Dec-08 Dec-09 Dec-10 Dec-11 Dec-12 Dec-13 Dec-14 Dec-15 Dec-16 Dec-17
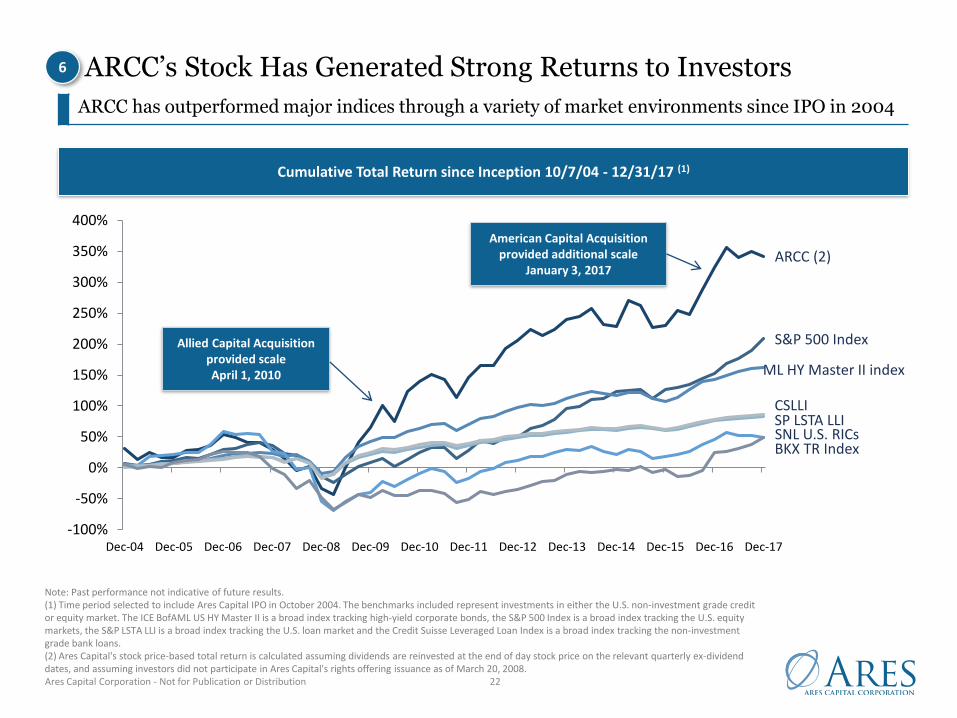
ARCC’s Stock Has Generated Strong Returns to Investors
ARCC has outperformed major indices through a variety of market environments since IPO in 2004
Cumulative Total Return since Inception 10/7/04 - 12/31/17 (1)
Note: Past performance not indicative of future results.(1) Time period selected to include Ares Capital IPO in October 2004. The benchmarks included represent investments in either the U.S. non-investment grade credit or equity market. The ICE BofAML US HY Master II is a broad index tracking high-yield corporate bonds, the S&P 500 Index is a broad index tracking the U.S. equity markets, the S&P LSTA LLI is a broad index tracking the U.S. loan market and the Credit Suisse Leveraged Loan Index is a broad index tracking the non-investment grade bank loans.(2) Ares Capital's stock price-based total return is calculated assuming dividends are reinvested at the end of day stock price on the relevant quarterly ex-dividend dates, and assuming investors did not participate in Ares Capital's rights offering issuance as of March 20, 2008.
Allied Capital Acquisition provided scaleApril 1, 2010
American Capital Acquisition provided additional scale
January 3, 2017
6
Ares Capital Corporation - Not for Publication or Distribution
Current Market Opportunities& Strategic Initiatives
Ares Capital Corporation - Not for Publication or Distribution 24
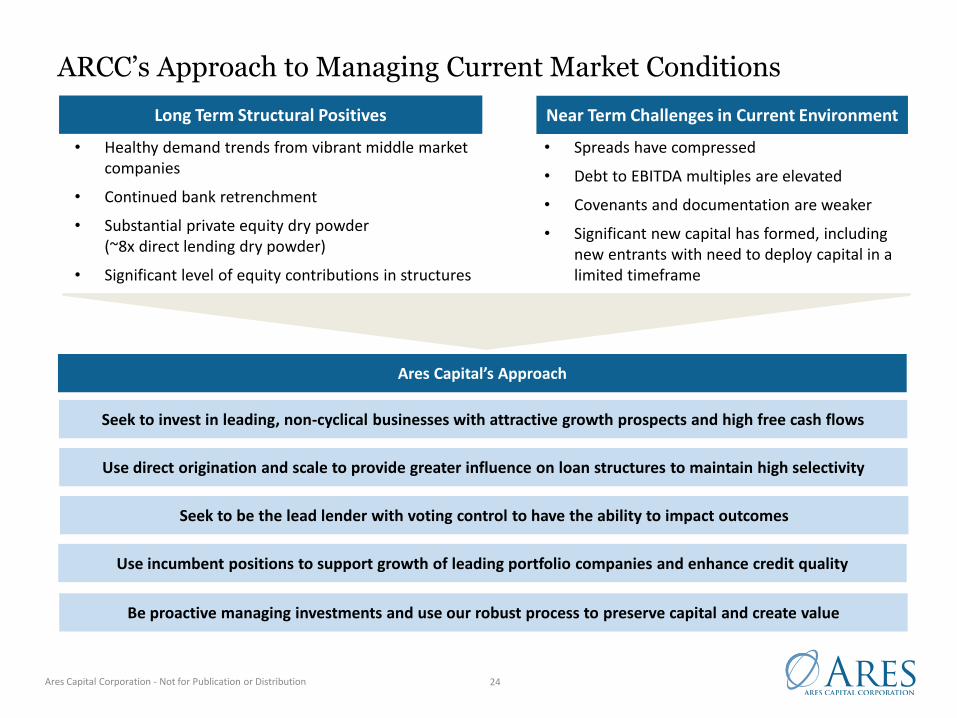
Long Term Structural Positives
Ares Capital’s Approach
Seek to invest in leading, non-cyclical businesses with attractive growth prospects and high free cash flows
Use direct origination and scale to provide greater influence on loan structures to maintain high selectivity
Seek to be the lead lender with voting control to have the ability to impact outcomes
Use incumbent positions to support growth of leading portfolio companies and enhance credit quality
Be proactive managing investments and use our robust process to preserve capital and create value
• Healthy demand trends from vibrant middle market companies
• Continued bank retrenchment
• Substantial private equity dry powder(~8x direct lending dry powder)
• Significant level of equity contributions in structures
Near Term Challenges in Current Environment
• Spreads have compressed
• Debt to EBITDA multiples are elevated
• Covenants and documentation are weaker
• Significant new capital has formed, including new entrants with need to deploy capital in a limited timeframe
ARCC’s Approach to Managing Current Market Conditions
Ares Capital Corporation - Not for Publication or Distribution 25
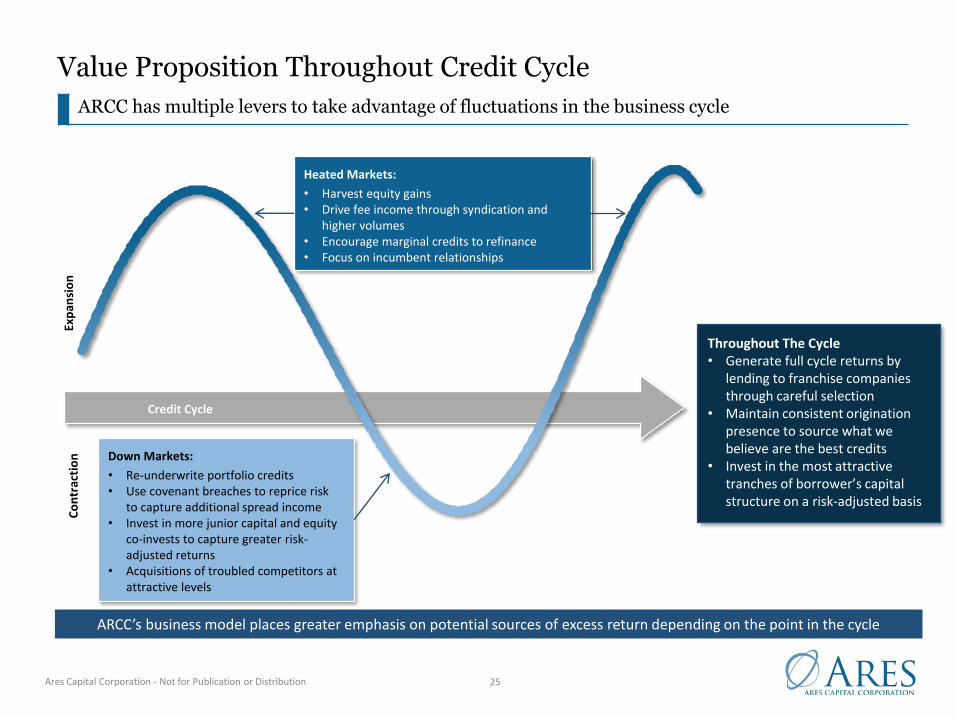
Value Proposition Throughout Credit Cycle
ARCC has multiple levers to take advantage of fluctuations in the business cycle
Heated Markets:
• Harvest equity gains• Drive fee income through syndication and
higher volumes• Encourage marginal credits to refinance• Focus on incumbent relationships
Down Markets:
• Re-underwrite portfolio credits• Use covenant breaches to reprice risk
to capture additional spread income • Invest in more junior capital and equity
co-invests to capture greater risk-adjusted returns
• Acquisitions of troubled competitors at attractive levels
Credit Cycle
Exp
ansi
on
Co
ntr
acti
on
Throughout The Cycle• Generate full cycle returns by
lending to franchise companies through careful selection
• Maintain consistent origination presence to source what we believe are the best credits
• Invest in the most attractive tranches of borrower’s capital structure on a risk-adjusted basis
ARCC’s business model places greater emphasis on potential sources of excess return depending on the point in the cycle
Ares Capital Corporation - Not for Publication or Distribution 26
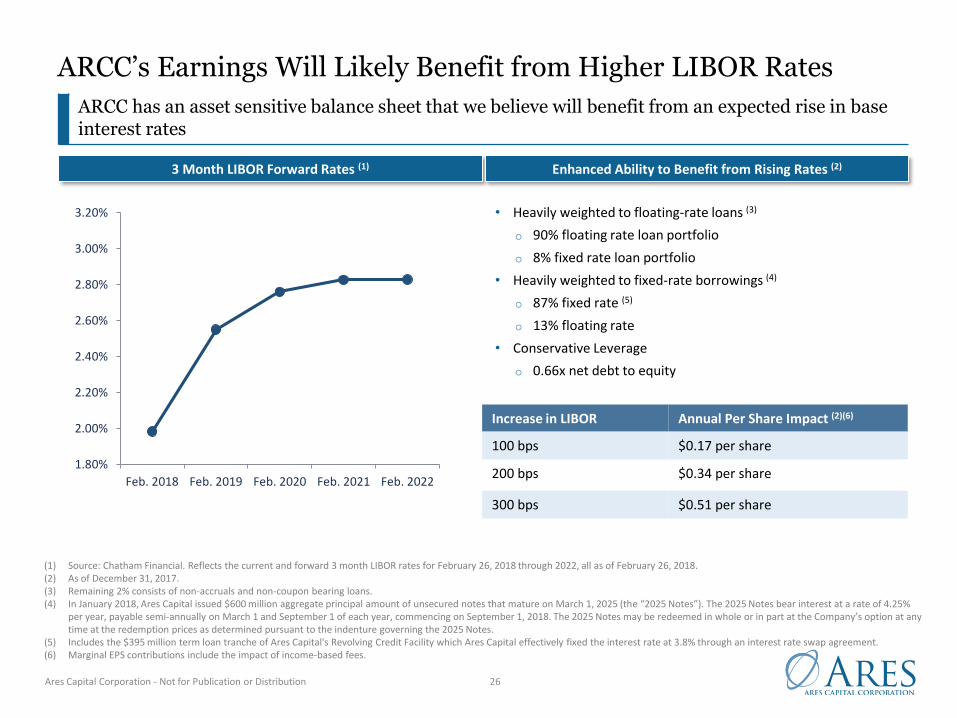
ARCC’s Earnings Will Likely Benefit from Higher LIBOR Rates
ARCC has an asset sensitive balance sheet that we believe will benefit from an expected rise in base interest rates
3 Month LIBOR Forward Rates (1) Enhanced Ability to Benefit from Rising Rates (2)
(1) Source: Chatham Financial. Reflects the current and forward 3 month LIBOR rates for February 26, 2018 through 2022, all as of February 26, 2018.(2) As of December 31, 2017.(3) Remaining 2% consists of non-accruals and non-coupon bearing loans.(4) In January 2018, Ares Capital issued $600 million aggregate principal amount of unsecured notes that mature on March 1, 2025 (the “2025 Notes”). The 2025 Notes bear interest at a rate of 4.25%
per year, payable semi-annually on March 1 and September 1 of each year, commencing on September 1, 2018. The 2025 Notes may be redeemed in whole or in part at the Company’s option at any time at the redemption prices as determined pursuant to the indenture governing the 2025 Notes.
(5) Includes the $395 million term loan tranche of Ares Capital's Revolving Credit Facility which Ares Capital effectively fixed the interest rate at 3.8% through an interest rate swap agreement. (6) Marginal EPS contributions include the impact of income-based fees.
• Heavily weighted to floating-rate loans (3)
o 90% floating rate loan portfolio
o 8% fixed rate loan portfolio
• Heavily weighted to fixed-rate borrowings (4)
o 87% fixed rate (5)
o 13% floating rate
• Conservative Leverage
o 0.66x net debt to equity
Increase in LIBOR Annual Per Share Impact (2)(6)
100 bps $0.17 per share
200 bps $0.34 per share
300 bps $0.51 per share
1.80%
2.00%
2.20%
2.40%
2.60%
2.80%
3.00%
3.20%
Feb. 2018 Feb. 2019 Feb. 2020 Feb. 2021 Feb. 2022
Ares Capital Corporation - Not for Publication or Distribution 27
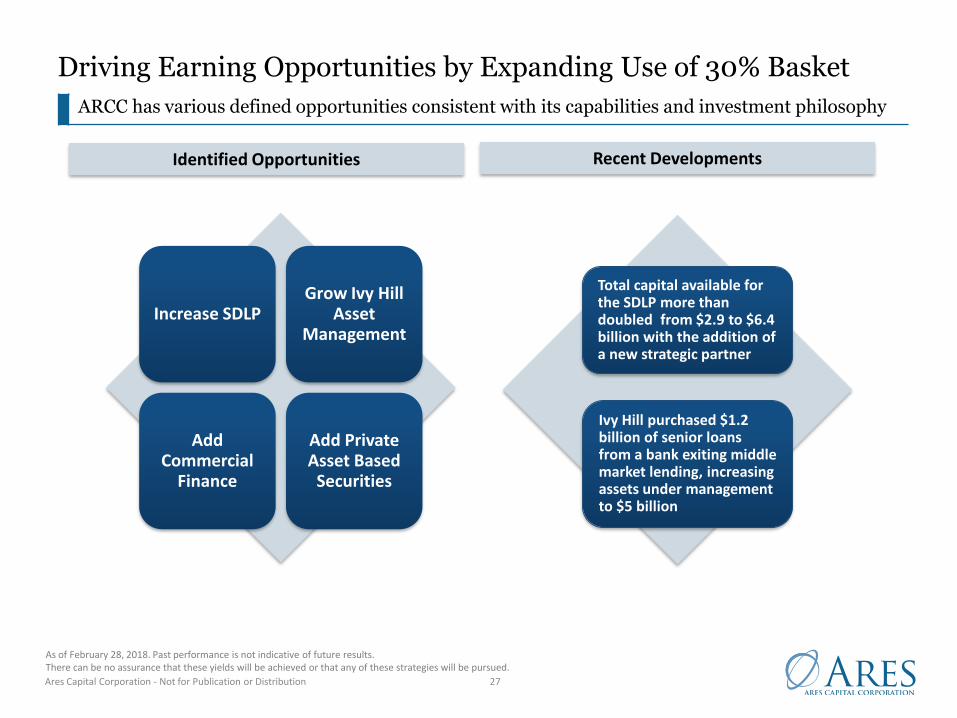
Driving Earning Opportunities by Expanding Use of 30% Basket
As of February 28, 2018. Past performance is not indicative of future results. There can be no assurance that these yields will be achieved or that any of these strategies will be pursued.
ARCC has various defined opportunities consistent with its capabilities and investment philosophy
Total capital available for the SDLP more than doubled from $2.9 to $6.4 billion with the addition of a new strategic partner
Identified Opportunities
Increase SDLPGrow Ivy Hill
Asset Management
Add Commercial
Finance
Add Private Asset Based
Securities
Ivy Hill purchased $1.2 billion of senior loans from a bank exiting middle market lending, increasing assets under management to $5 billion
Recent Developments

Ares Capital Corporation - Not for Publication or Distribution 28
Rotation of American Capital Portfolio Should Help Provide Incremental Returns
We have ~$900 million of remaining non-core investments acquired in the American Capital Acquisition, with a blended yield of 6.7%, which are targeted for reinvestment into higher yields
As of December 31, 2017, unless otherwise noted. There is no guarantee that performance objectives will be achieved.
47%
24%
44%
32%
32%
32%
5%4%
7%
15%
8%
7%
1%3%
13%
4%6% 9% 7%
$10.1 billion $1.7 billion $11.8 billion
0%
20%
40%
60%
80%
100%
Ares Capital ExcludingInvestments Acquired
in the AmericanCapital Acquisition
RemainingInvestments Acquired
in the AmericanCapital Acquisition
Total Ares Capital
Other Equity and Other
Preferred Equity
Collateralized Loan Obligations
Senior Subordinated Loans
Senior Direct Lending Program
Second Lien Senior Secured Loans
First Lien Senior Secured Loans
Progress on ACAS Portfolio
$85 million in net realized gains
$184 million in net unrealized appreciation
Exited over $1.0 billion of lower yielding
investments
Acquired Portfolio Rotation 1/3/17 to 12/31/17
Yield at fair value on remaining investments
acquired increased from 7.4% to 7.8%
Ares Capital Corporation - Not for Publication or Distribution 29
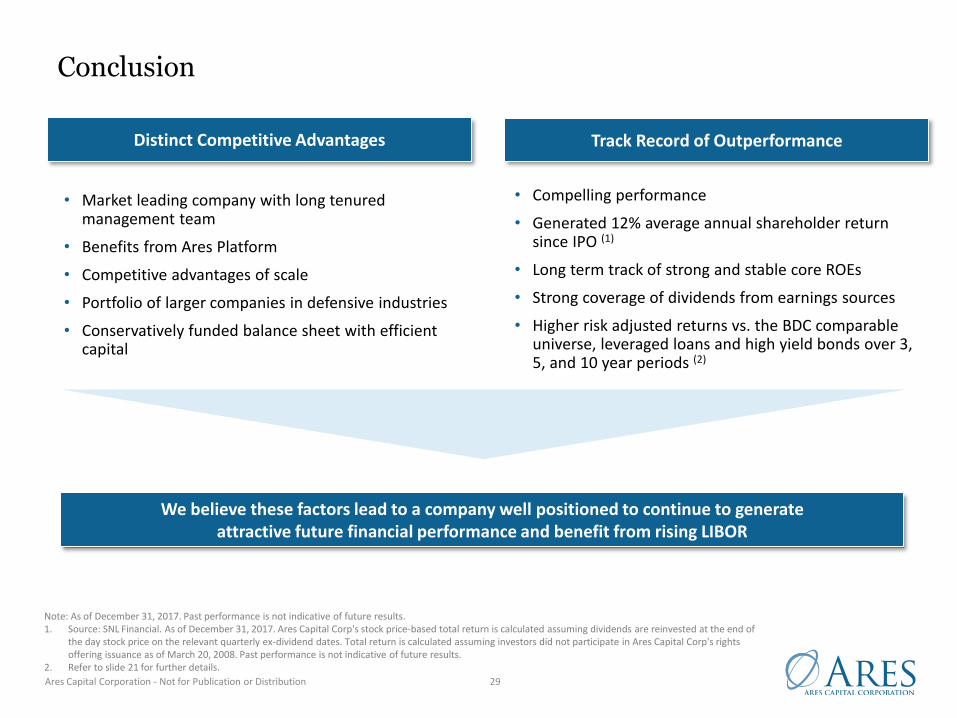
Conclusion
Distinct Competitive Advantages
• Market leading company with long tenured management team
• Benefits from Ares Platform
• Competitive advantages of scale
• Portfolio of larger companies in defensive industries
• Conservatively funded balance sheet with efficient capital
Note: As of December 31, 2017. Past performance is not indicative of future results.1. Source: SNL Financial. As of December 31, 2017. Ares Capital Corp's stock price-based total return is calculated assuming dividends are reinvested at the end of
the day stock price on the relevant quarterly ex-dividend dates. Total return is calculated assuming investors did not participate in Ares Capital Corp's rights offering issuance as of March 20, 2008. Past performance is not indicative of future results.
2. Refer to slide 21 for further details.
We believe these factors lead to a company well positioned to continue to generate attractive future financial performance and benefit from rising LIBOR
Track Record of Outperformance
• Compelling performance
• Generated 12% average annual shareholder return since IPO (1)
• Long term track of strong and stable core ROEs
• Strong coverage of dividends from earnings sources
• Higher risk adjusted returns vs. the BDC comparable universe, leveraged loans and high yield bonds over 3, 5, and 10 year periods (2)
Ares Capital Corporation - Not for Publication or Distribution
Appendix A: Market and Other Investment Considerations

Ares Capital Corporation - Not for Publication or Distribution 31
Drivers of Market Demand
Dry powder statistics suggest plenty of additional capacity for direct lending strategy
Source: Preqin. As of January 2018.
• Direct lending dry powder in North America is currently $52 billion, which represents 14% of buyout dry powder
• We believe scaled providers will benefit from the available capacity
North America Dry Powder – Direct Lending and Buyout
Direct Lending Dry Powder as a % of Buyout Dry Powder
0
50
100
150
200
250
300
350
400
2004 2005 2006 2007 2008 2009 2010 2011 2012 2013 2014 2015 2016 2017 Feb-18
Dry
Po
wd
er
($B
)
Direct Lending Dry Powder Buyout Dry Powder
2% 4% 7% 5% 7% 9% 11% 20% 15% 13% 13% 13%2%2% 14%

Ares Capital Corporation - Not for Publication or Distribution 32
Supply Constraints Create an Attractive Market Opportunity
We believe supply constraints in the middle market have resulted in attractive risk adjusted returns for direct lenders
Total Number of U.S. Banks Continues to Decline (1)
(1) Source: Federal Deposit Insurance Corp Quarterly Banking Profile Q4-17.(2) Source: S&P LCD Leveraged Lending Review Q4-17. Amounts are based on administrative, syndication and documentation agent as well as arranger roles.
Banks' Share of the U.S. Leveraged Loan Market Continues to Shrink (2)
5,000
6,000
7,000
8,000
9,000
10,000
11,000
19
98
19
99
20
00
20
01
20
02
20
03
20
04
20
05
20
06
20
07
20
08
20
09
20
10
20
11
20
12
20
13
20
14
20
15
20
16
20
17
71%
45%
18%12% 9%
29%
55%
82%88% 91%
0%
10%
20%
30%
40%
50%
60%
70%
80%
90%
100%
1994 2000 2006 2012 2017
Foreign/Domestic Banks Non-Bank Companies/Funds
Ares Capital Corporation - Not for Publication or Distribution 33
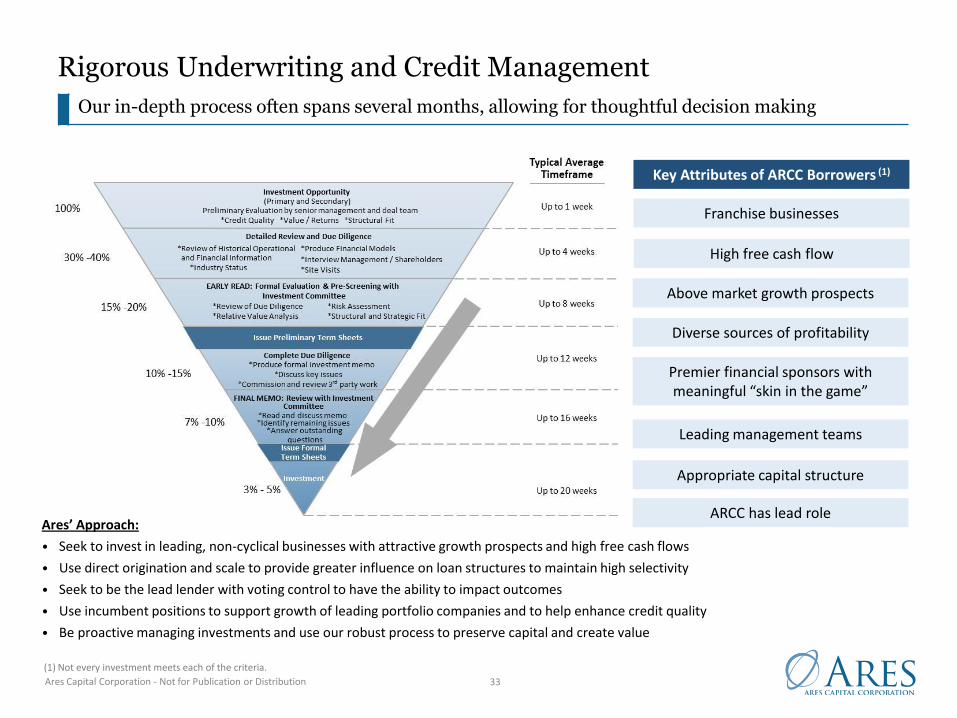
Rigorous Underwriting and Credit Management
Our in-depth process often spans several months, allowing for thoughtful decision making
Key Attributes of ARCC Borrowers (1)
Franchise businesses
High free cash flow
Above market growth prospects
Premier financial sponsors with meaningful “skin in the game”
Leading management teams
ARCC has lead role
Appropriate capital structure
Diverse sources of profitability
Ares’ Approach:
• Seek to invest in leading, non-cyclical businesses with attractive growth prospects and high free cash flows
• Use direct origination and scale to provide greater influence on loan structures to maintain high selectivity
• Seek to be the lead lender with voting control to have the ability to impact outcomes
• Use incumbent positions to support growth of leading portfolio companies and to help enhance credit quality
• Be proactive managing investments and use our robust process to preserve capital and create value
(1) Not every investment meets each of the criteria.
Ares Capital Corporation - Not for Publication or Distribution 34
-6%
-5%
-4%
-3%
-2%
-1%
0%
1%
2%
ARCC BDC 1 BDC 2 BDC 3 BDC 4 BDC 5 BDC 6 BDC 7 BDC 8 BDC 9 BDC 10 BDC 11 BDC 12 BDC 13 BDC 14 BDC 15 BDC 16
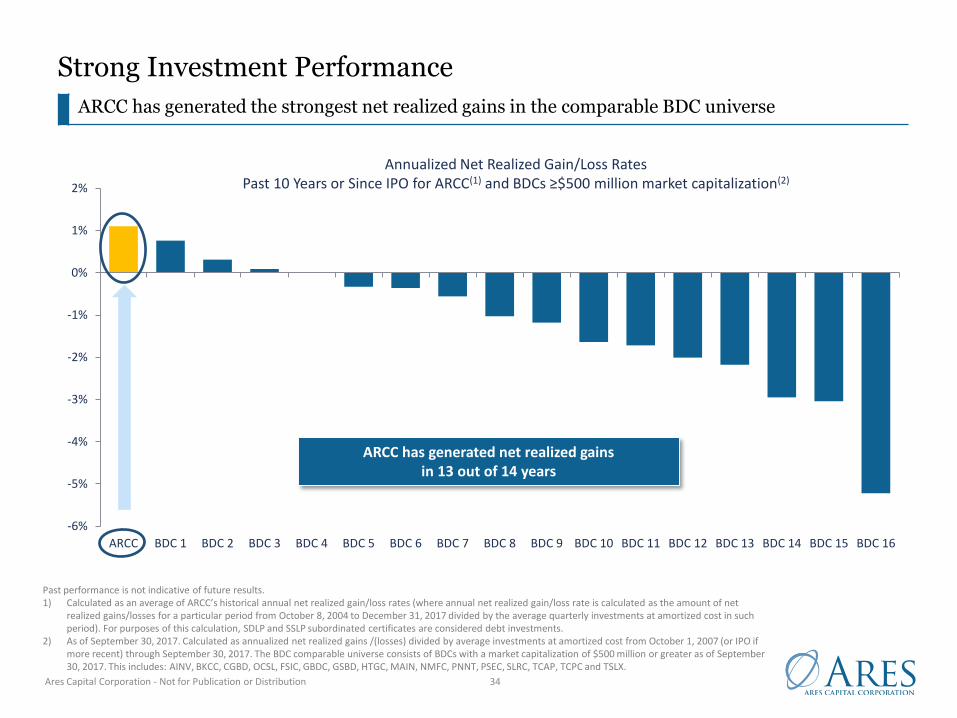
Strong Investment Performance
ARCC has generated the strongest net realized gains in the comparable BDC universe
Past performance is not indicative of future results. 1) Calculated as an average of ARCC’s historical annual net realized gain/loss rates (where annual net realized gain/loss rate is calculated as the amount of net
realized gains/losses for a particular period from October 8, 2004 to December 31, 2017 divided by the average quarterly investments at amortized cost in such period). For purposes of this calculation, SDLP and SSLP subordinated certificates are considered debt investments.
2) As of September 30, 2017. Calculated as annualized net realized gains /(losses) divided by average investments at amortized cost from October 1, 2007 (or IPO if more recent) through September 30, 2017. The BDC comparable universe consists of BDCs with a market capitalization of $500 million or greater as of September 30, 2017. This includes: AINV, BKCC, CGBD, OCSL, FSIC, GBDC, GSBD, HTGC, MAIN, NMFC, PNNT, PSEC, SLRC, TCAP, TCPC and TSLX.
Annualized Net Realized Gain/Loss RatesPast 10 Years or Since IPO for ARCC(1) and BDCs ≥$500 million market capitalization(2)
ARCC has generated net realized gains in 13 out of 14 years
Ares Capital Corporation - Not for Publication or Distribution 35
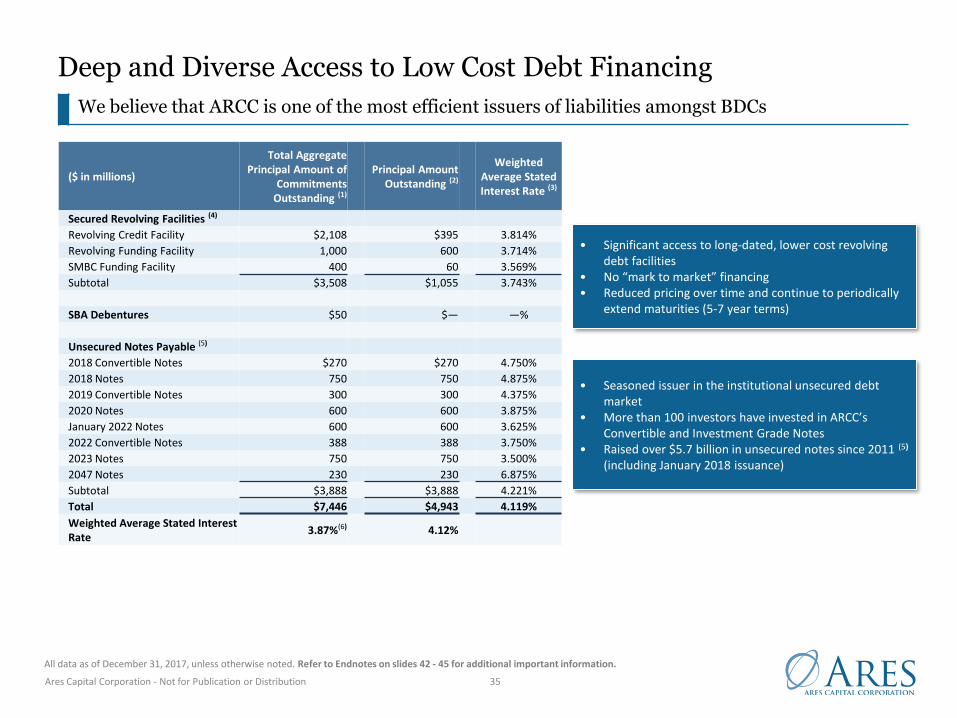
Deep and Diverse Access to Low Cost Debt Financing
We believe that ARCC is one of the most efficient issuers of liabilities amongst BDCs
• Significant access to long-dated, lower cost revolving debt facilities
• No “mark to market” financing• Reduced pricing over time and continue to periodically
extend maturities (5-7 year terms)
• Seasoned issuer in the institutional unsecured debt market
• More than 100 investors have invested in ARCC’s Convertible and Investment Grade Notes
• Raised over $5.7 billion in unsecured notes since 2011 (5)
(including January 2018 issuance)
($ in millions)
Total Aggregate Principal Amount of
Commitments Outstanding (1)
Principal Amount Outstanding (2)
Weighted Average Stated Interest Rate (3)
Secured Revolving Facilities (4)
Revolving Credit Facility $2,108 $395 3.814%
Revolving Funding Facility 1,000 600 3.714%
SMBC Funding Facility 400 60 3.569%
Subtotal $3,508 $1,055 3.743%
SBA Debentures $50 $— —%
Unsecured Notes Payable (5)
2018 Convertible Notes $270 $270 4.750%
2018 Notes 750 750 4.875%
2019 Convertible Notes 300 300 4.375%
2020 Notes 600 600 3.875%
January 2022 Notes 600 600 3.625%
2022 Convertible Notes 388 388 3.750%
2023 Notes 750 750 3.500%
2047 Notes 230 230 6.875%
Subtotal $3,888 $3,888 4.221%
Total $7,446 $4,943 4.119%
Weighted Average Stated Interest Rate
3.87%(6) 4.12%
All data as of December 31, 2017, unless otherwise noted. Refer to Endnotes on slides 42 - 45 for additional important information.
Ares Capital Corporation - Not for Publication or Distribution 36
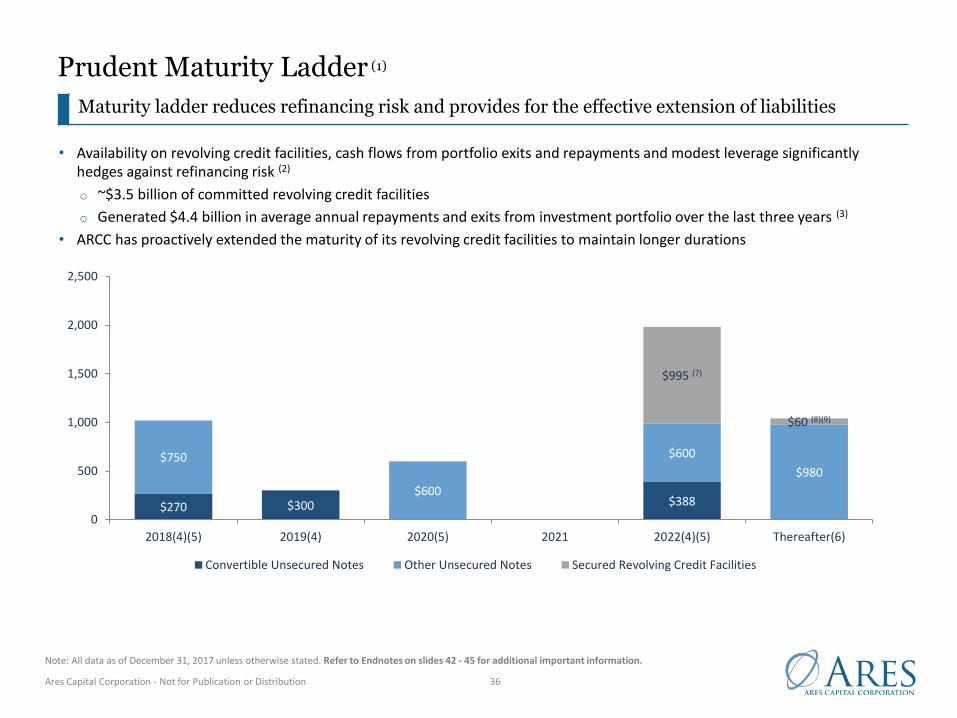
Prudent Maturity Ladder (1)
Maturity ladder reduces refinancing risk and provides for the effective extension of liabilities
• Availability on revolving credit facilities, cash flows from portfolio exits and repayments and modest leverage significantly hedges against refinancing risk (2)
o ~$3.5 billion of committed revolving credit facilities
o Generated $4.4 billion in average annual repayments and exits from investment portfolio over the last three years (3)
• ARCC has proactively extended the maturity of its revolving credit facilities to maintain longer durations
Note: All data as of December 31, 2017 unless otherwise stated. Refer to Endnotes on slides 42 - 45 for additional important information.
$270 $300 $388
$750
$600
$600
$980
$995 (7)
$60 (8)(9)
0
500
1,000
1,500
2,000
2,500
2018(4)(5) 2019(4) 2020(5) 2021 2022(4)(5) Thereafter(6)
Convertible Unsecured Notes Other Unsecured Notes Secured Revolving Credit Facilities
Ares Capital Corporation - Not for Publication or Distribution
Appendix B: Management and Core Earnings Reconciliation
Ares Capital Corporation - Not for Publication or Distribution 38
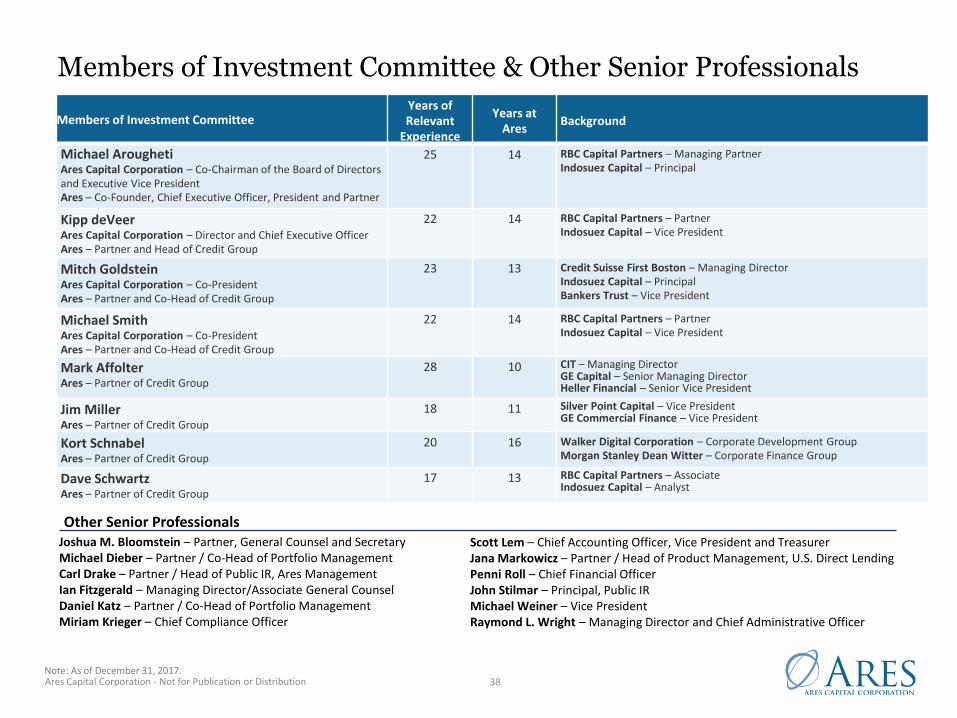
Members of Investment CommitteeYears of Relevant
Experience
Years atAres
Background
Michael AroughetiAres Capital Corporation – Co-Chairman of the Board of Directors and Executive Vice PresidentAres – Co-Founder, Chief Executive Officer, President and Partner
25 14 RBC Capital Partners – Managing PartnerIndosuez Capital – Principal
Kipp deVeerAres Capital Corporation – Director and Chief Executive OfficerAres – Partner and Head of Credit Group
22 14 RBC Capital Partners – PartnerIndosuez Capital – Vice President
Mitch GoldsteinAres Capital Corporation – Co-PresidentAres – Partner and Co-Head of Credit Group
23 13 Credit Suisse First Boston – Managing DirectorIndosuez Capital – PrincipalBankers Trust – Vice President
Michael SmithAres Capital Corporation – Co-PresidentAres – Partner and Co-Head of Credit Group
22 14 RBC Capital Partners – PartnerIndosuez Capital – Vice President
Mark AffolterAres – Partner of Credit Group
28 10 CIT – Managing DirectorGE Capital – Senior Managing DirectorHeller Financial – Senior Vice President
Jim MillerAres – Partner of Credit Group
18 11 Silver Point Capital – Vice PresidentGE Commercial Finance – Vice President
Kort SchnabelAres – Partner of Credit Group
20 16 Walker Digital Corporation – Corporate Development GroupMorgan Stanley Dean Witter – Corporate Finance Group
Dave SchwartzAres – Partner of Credit Group
17 13 RBC Capital Partners – AssociateIndosuez Capital – Analyst
Other Senior ProfessionalsScott Lem – Chief Accounting Officer, Vice President and TreasurerJana Markowicz – Partner / Head of Product Management, U.S. Direct LendingPenni Roll – Chief Financial OfficerJohn Stilmar – Principal, Public IRMichael Weiner – Vice PresidentRaymond L. Wright – Managing Director and Chief Administrative Officer
Joshua M. Bloomstein – Partner, General Counsel and SecretaryMichael Dieber – Partner / Co-Head of Portfolio ManagementCarl Drake – Partner / Head of Public IR, Ares ManagementIan Fitzgerald – Managing Director/Associate General CounselDaniel Katz – Partner / Co-Head of Portfolio ManagementMiriam Krieger – Chief Compliance Officer
Note: As of December 31, 2017.
Members of Investment Committee & Other Senior Professionals
Ares Capital Corporation - Not for Publication or Distribution 39
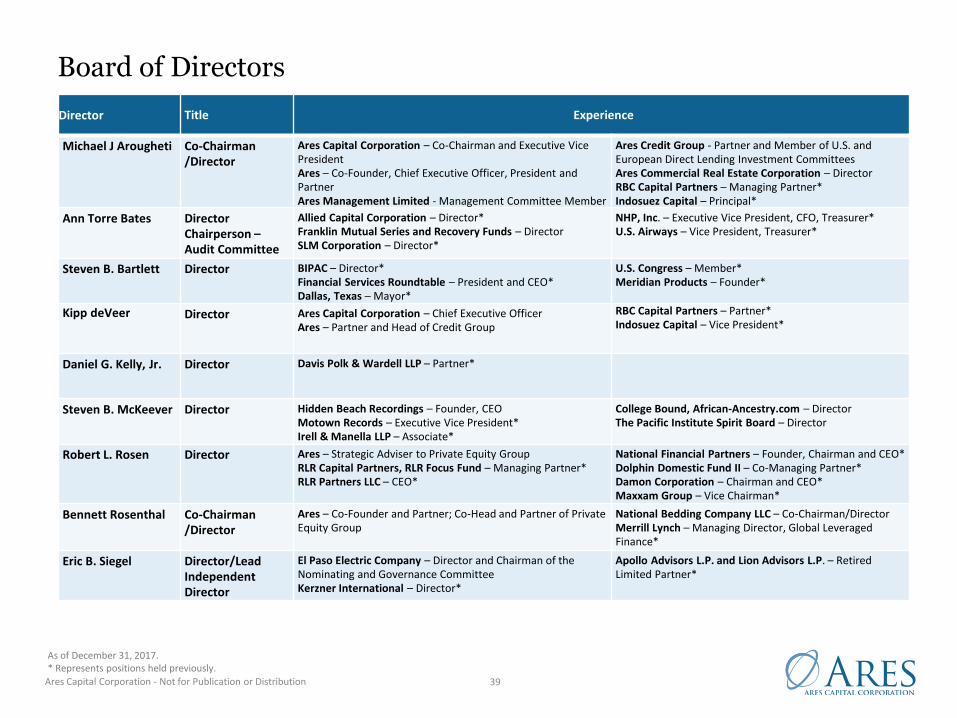
As of December 31, 2017.* Represents positions held previously.
Director Title Experience
Michael J Arougheti Co-Chairman/Director
Ares Capital Corporation – Co-Chairman and Executive Vice PresidentAres – Co-Founder, Chief Executive Officer, President and Partner Ares Management Limited - Management Committee Member
Ares Credit Group - Partner and Member of U.S. and European Direct Lending Investment CommitteesAres Commercial Real Estate Corporation – DirectorRBC Capital Partners – Managing Partner*Indosuez Capital – Principal*
Ann Torre Bates Director Chairperson –Audit Committee
Allied Capital Corporation – Director*Franklin Mutual Series and Recovery Funds – DirectorSLM Corporation – Director*
NHP, Inc. – Executive Vice President, CFO, Treasurer*U.S. Airways – Vice President, Treasurer*
Steven B. Bartlett Director BIPAC – Director*Financial Services Roundtable – President and CEO*Dallas, Texas – Mayor*
U.S. Congress – Member*Meridian Products – Founder*
Kipp deVeer Director Ares Capital Corporation – Chief Executive OfficerAres – Partner and Head of Credit Group
RBC Capital Partners – Partner*Indosuez Capital – Vice President*
Daniel G. Kelly, Jr. Director Davis Polk & Wardell LLP – Partner*
Steven B. McKeever Director Hidden Beach Recordings – Founder, CEOMotown Records – Executive Vice President*Irell & Manella LLP – Associate*
College Bound, African-Ancestry.com – DirectorThe Pacific Institute Spirit Board – Director
Robert L. Rosen Director Ares – Strategic Adviser to Private Equity GroupRLR Capital Partners, RLR Focus Fund – Managing Partner*RLR Partners LLC – CEO*
National Financial Partners – Founder, Chairman and CEO*Dolphin Domestic Fund II – Co-Managing Partner*Damon Corporation – Chairman and CEO*Maxxam Group – Vice Chairman*
Bennett Rosenthal Co-Chairman/Director
Ares – Co-Founder and Partner; Co-Head and Partner of Private Equity Group
National Bedding Company LLC – Co-Chairman/DirectorMerrill Lynch – Managing Director, Global Leveraged Finance*
Eric B. Siegel Director/Lead Independent Director
El Paso Electric Company – Director and Chairman of the Nominating and Governance CommitteeKerzner International – Director*
Apollo Advisors L.P. and Lion Advisors L.P. – Retired Limited Partner*
Board of Directors
Ares Capital Corporation - Not for Publication or Distribution 40
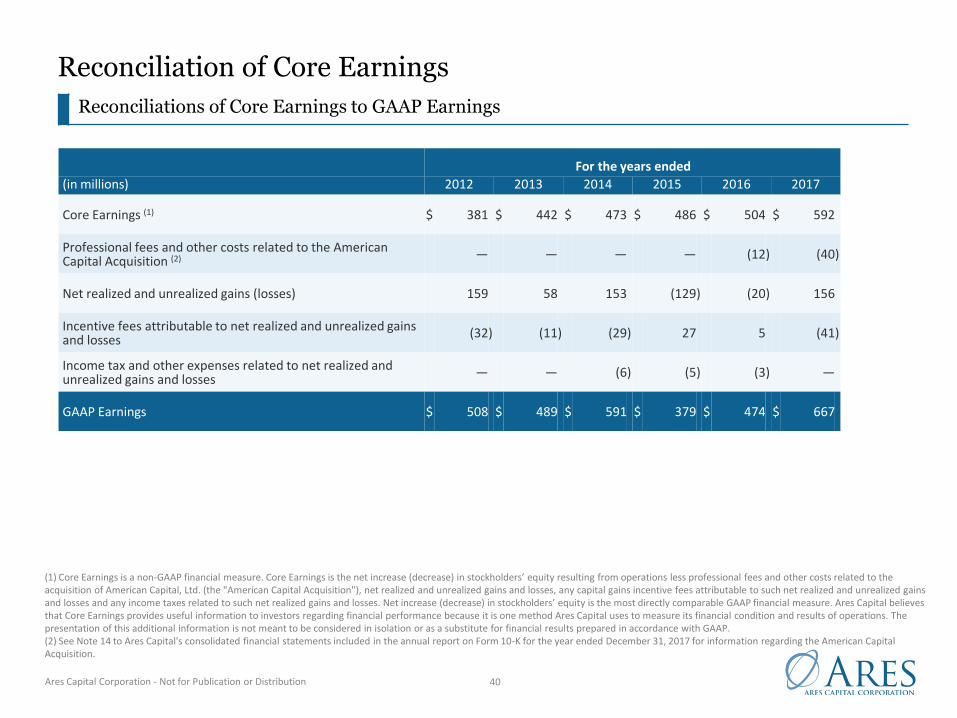
For the years ended
(in millions) 2012 2013 2014 2015 2016 2017
Core Earnings (1) $ 381 $ 442 $ 473 $ 486 $ 504 $ 592
Professional fees and other costs related to the American Capital Acquisition (2) — — — — (12) (40)
Net realized and unrealized gains (losses) 159 58 153 (129) (20) 156
Incentive fees attributable to net realized and unrealized gains and losses
(32) (11) (29) 27 5 (41)
Income tax and other expenses related to net realized and unrealized gains and losses
— — (6) (5) (3) —
GAAP Earnings $ 508 $ 489 $ 591 $ 379 $ 474 $ 667
(1) Core Earnings is a non-GAAP financial measure. Core Earnings is the net increase (decrease) in stockholders’ equity resulting from operations less professional fees and other costs related to the acquisition of American Capital, Ltd. (the "American Capital Acquisition"), net realized and unrealized gains and losses, any capital gains incentive fees attributable to such net realized and unrealized gains and losses and any income taxes related to such net realized gains and losses. Net increase (decrease) in stockholders’ equity is the most directly comparable GAAP financial measure. Ares Capital believes that Core Earnings provides useful information to investors regarding financial performance because it is one method Ares Capital uses to measure its financial condition and results of operations. The presentation of this additional information is not meant to be considered in isolation or as a substitute for financial results prepared in accordance with GAAP. (2) See Note 14 to Ares Capital's consolidated financial statements included in the annual report on Form 10-K for the year ended December 31, 2017 for information regarding the American Capital Acquisition.
Reconciliations of Core Earnings to GAAP Earnings
Reconciliation of Core Earnings
Ares Capital Corporation - Not for Publication or Distribution
Endnotes
Ares Capital Corporation - Not for Publication or Distribution 42
EndnotesSlide 3: Market Leading Company in Direct Lending1. Based on market prices as of February 28, 2018.
2. As of December 31, 2017.
3. Includes invested capital from inception on October 8, 2004 through December 31, 2017. Excludes syndications within one year of origination, $1.8 billion of investments acquired from Allied Capital on April 1, 2010 and $2.5 billion of investments acquired from American Capital on January 3, 2017.
4. Source: SNL Financial. As of December 31, 2017. Ares Capital Corp’s stock price-based total return is calculated assuming dividends are reinvested at the end of the day stock price on the relevant quarterly ex-dividend dates. Total return is calculated assuming investors did not participate in Ares Capital Corp’s rights offering issuance as of March 20, 2008. Past performance is not indicative of future results.
5. Dividend Coverage represents annual core earnings and net realized gains/losses as a percentage of the regular dividend (excluding additional dividends) from 2010 – 2017. Excludes $196 million one‐time gain from the acquisition of Allied Capital (the “Allied Acquisition”) in Q2-10, and gains/losses from extinguishment of debt and the sale of other assets. Net realized gains/losses are net of income tax expense related to realized gains and losses and capital gains incentive fees incurred and payable as calculated under the investment advisory and management agreement.
6. Calculated as an average of the historical annual net realized gain/loss rates (where annual net realized gain/loss rate is calculated as the amount of net realized gains/losses for a particular period from Ares Capital IPO in October 2004 to December 31, 2017 divided by the average quarterly investments at amortized cost in such period). For purposes of this calculation, SSLP and SDLP subordinated certificates are considered debt investments. Excludes $196 million one‐time gain on the Allied Acquisition in Q2‐10 and gains/losses from extinguishment of debt and sale of other assets.
Slide 15: Sustained Market Premium for ARCC Yields with Lower Losses1. The weighted average yield on debt and other income producing securities is computed as (a) annual stated interest rate or yield earned plus the net annual amortization of original issue discount
and market discount or premium earned on accruing debt and other income producing securities, divided by (b) total accruing debt and other income producing securities at fair value.
2. The S&P/LSTA Leveraged Loan Index is a market value-weighted index designed to measure the performance of the U.S. leveraged loan market based upon market weightings, spreads and interest payments. Term loans from syndicated credits must meet the following criteria at issuance in order to be eligible for inclusion in the index: senior secured, minimum initial term of one year, US dollar denominated, minimum initial spread of LIBOR + 125 basis points, $50M initially funded loans. Inception date: January 1, 1997.
3. The Middle Market Index consists of middle market facilities drawn from the larger S&P/LSTA (Loan Syndications and Trading Association) Leveraged Loan Index. It is designed to measure the performance of the U.S. leveraged loan market. S&P/LSTA defines the middle market as deals with an EBITDA of less than $50 million.
4. The ICE BofAML US High Yield Index ("H0A0") tracks the performance of US dollar denominated below investment grade corporate debt publicly issued in the US domestic market. Qualifying securities must have a below investment grade rating (based on an average of Moody’s, S&P and Fitch), at least 18 months to final maturity at the time of issuance, at least one year remaining term to final maturity as of the rebalancing date, a fixed coupon schedule and a minimum amount outstanding of $100 million. Index constituents are capitalization‐weighted based on their current amount outstanding times the market price plus accrued interest. Inception date: August 31, 1986.
5. Represents ARCC’s average non-accrual rate at amortized cost from inception in October 8, 2004 to December 31, 2017.
6. Source: Moody's U.S. Trailing 12-month issuer-weighted spec-grade default rate. Actual speculative grade default data taken from January 2000 to December 31, 2017.
7. Calculated as an average of the historical annual net realized gain/loss rates (where annual net realized gain/loss rate is calculated as the amount of net realized gains/losses for a particular period from Ares Capital IPO in October 2004 to December 31, 2017 divided by the average quarterly investments at amortized cost in such period). For purposes of this calculation, SSLP and SDLP subordinated certificates are considered debt investments. Excludes $196 million one‐time gain on the acquisition of Allied Capital Corporation in Q2‐10 and gains/losses from extinguishment of debt and sale of other assets.
8. Source: Moody’s 2017 Annual Default Study. Reflects average annual loss rate for speculative grade bonds from 2000-2017.

Ares Capital Corporation - Not for Publication or Distribution 43
Endnotes
Slide 16: Compelling Core Earnings and Return on Equity1. Core Earnings is a non-GAAP financial measure. Core Earnings is the net increase (decrease) in stockholders’ equity resulting from operations less professional fees and other costs related to
the American Capital Acquisition, net realized and unrealized gains and losses, any capital gains incentive fees attributable to such net realized and unrealized gains and losses and any income taxes related to such net realized gains and losses. Net increase (decrease) in stockholders’ equity is the most directly comparable GAAP financial measure. Ares Capital believes that Core Earnings provides useful information to investors regarding financial performance because it is one method Ares Capital uses to measure its financial condition and results of operations. The presentation of this additional information is not meant to be considered in isolation or as a substitute for financial results prepared in accordance with GAAP.
2. Core return on equity calculated as Core Earnings as defined in item (1) above divided by average equity over the relevant time period.
Slide 17: Dividend and Core Earnings Plus Net Realized Gains Track Record1. Core Earnings is a non-GAAP financial measure. Core Earnings is the net increase (decrease) in stockholders’ equity resulting from operations less professional fees and other costs related to
the American Capital Acquisition, net realized and unrealized gains and losses, any capital gains incentive fees attributable to such net realized and unrealized gains and losses and any income taxes related to such net realized gains and losses. Net increase (decrease) in stockholders’ equity is the most directly comparable GAAP financial measure. Ares Capital believes that Core Earnings provides useful information to investors regarding financial performance because it is one method Ares Capital uses to measure its financial condition and results of operations. The presentation of this additional information is not meant to be considered in isolation or as a substitute for financial results prepared in accordance with GAAP.
Slide 18: ARCC Has Experienced Consistently Low Non-Accruals1. Represents ARCC’s average non-accrual rate at amortized cost from inception in October 8, 2004 to December 31, 2017.
2. Source: S&P LCD data for LSTA Leveraged Loan Index (“LLI”). Calculated as average of rolling twelve month default rates for the LLI from January 2000 to December 31, 2017.
3. Source: Moody’s U.S. Trailing 12-month issuer-weighted speculative grade default rate. Actual speculative grade default data taken from January 2000 to December 31, 2017.
4. Source: S&P LCD data for LSTA Leveraged Loan Index (“LLI”).
Ares Capital Corporation - Not for Publication or Distribution 44
EndnotesSlide 20: Strong Investment Performance 1. Based on original cash invested, net of syndications, of approximately $19.3 billion and total proceeds from such exited investments of approximately $24.9 billion.
2. Internal rate of return ("IRR") is the discount rate that makes the net present value of all cash flows related to a particular investment equal to zero. Internal rate of return is gross of management fees and expenses related to investments as these fees and expenses are not allocable to specific investments. The effect of such management and other expenses may reduce, maybe materially, the IRR’s shown herein. Investments are considered to be exited when the original investment objective has been achieved through the receipt of cash and/or non-cash consideration upon the repayment of Ares Capital’s debt investment or sale of an investment, or through the determination that no further consideration was collectible and, thus, a loss may have been realized. These IRR results are historical results relating to Ares Capital’s past performance and are not necessarily indicative of future results, the achievement of which cannot be assured.
3. Calculated as an average of the historical annual net realized gain/loss rates (where annual net realized gain/loss rate is calculated as the amount of net realized gains/losses for a particular period from Ares Capital IPO in October 2004 to December 31, 2017 divided by the average quarterly investments at amortized cost in such period). For purposes of this calculation, SDLP and SSLP subordinated certificates are considered debt investments.
4. As of December 31, 2017. Excludes $196 million one‐time gain on the acquisition of Allied Capital Corporation in Q2‐10 and gains/losses from extinguishment of debt and sale of other assets.
5. BDC peer group consists of BDCs with a market capitalization of $500 million or greater as of September 30, 2017 or who are under common management with a BDC that meets these criteria. Peers include: AINV, BKCC, CGBD, OCSL, OCSI, FSIC, GBDC, GSBD, HTGC, MAIN, NMFC, PFLT, PNNT, PSEC, SLRC, SUNS, TCAP, TCPC and TSLX.
6. Annual average from October 8, 2004 through December 31, 2016, and the last twelve month period ending September 30, 2017. For ARCC, the last twelve month period is as of December 31, 2017.
Slide 21: ARCC’s Portfolio Has Generated Higher Returns with Less Risk1. Returns are calculated as annualized average returns of dividends paid plus changes in net asset value over the time periods represented.
2. The High Yield Index represents the ICE BofAML Master II Index (“H0A0”) and the Loan Index represents the S&P/LSTA U.S. Leveraged Loan Index (“SPLLI”).
3. The BDC comparable universe consists of BDCs with a market capitalization of $500 million or greater as of September 30, 2017. This includes: AINV, BKCC, CGBD, FSIC, GBDC, GSBD, HTGC, MAIN, NMFC, OCSL, PNNT, PSEC, SLRC, TCAP, TCPC and TSLX. Of this universe, the following companies have been public for at least 3 years: AINV, BKCC, FSIC, GBDC, HTGC, MAIN, NMFC, OCSL, PNNT, PSEC, SLRC, TCAP, TCPC and TSLX. The following companies have been public for at least 5 years: AINV, BKCC, GBDC, HTGC, MAIN, NMFC, OCSL, PNNT, PSEC, SLRC, TCAP and TCPC. The following companies have been public for at least 10 years: AINV, BKCC, HTGC, PNNT, PSEC and TCAP. Data is presented as of September 30, 2017.

Ares Capital Corporation - Not for Publication or Distribution 45
EndnotesSlide 35: Deep and Diverse Access to Low Cost Debt Financing1. Subject to borrowing base, leverage and other restrictions. Represents total aggregate amount committed or outstanding, as applicable, under such instrument.
2. Represents the total aggregate principal amount outstanding as of December 31, 2017.
3. Effective stated rate as of December 31, 2017. In December 2017, Ares Capital entered into an interest rate swap agreement to effectively fix the interest rate in connection with the $395 million term loan tranche of the Revolving Credit Facility. The stated interest rate for the Revolving Credit Facility reflects the fixed interest rate of 2.064% plus the applicable spread of 1.75%, or 3.814% on the term loan tranche.
4. Requires periodic payments of interest and may require repayments of a portion of the outstanding principal once their respective reinvestment periods end but prior to the stated maturity.
5. In January 2018, Ares Capital issued $600 million aggregate principal amount of unsecured notes that mature on March 1, 2025 (the “2025 Notes”). The 2025 Notes bear interest at a rate of 4.25% per year, payable semi-annually on March 1 and September 1 of each year, commencing on September 1, 2018. The 2025 Notes may be redeemed in whole or in part at the Company’s option at any time at the redemption prices as determined pursuant to the indenture governing the 2025 Notes.
6. Assumes all committed capital is fully drawn. In December 2017, Ares Capital entered into an interest rate swap agreement to effectively fix the interest rate in connection with the $395 million term loan tranche of the Revolving Credit Facility. The stated interest rate for the Revolving Credit Facility reflects the fixed interest rate of 2.064% plus the applicable spread of 1.75%, or 3.814% on the term loan tranche.
Slide 36: Prudent Maturity Ladder1. Represents the total aggregate principal amount outstanding due on the stated maturity date.
2. The use of leverage magnifies the potential for gain or loss on the amount invested and may increase the risk of investment.
3. Represents an average of the three years ended December 31, 2017.
4. While Ares Capital expects to settle each of the 2019 Convertible Notes and 2022 Convertible Notes of $300.0 million and $388.00 million, respectively, in cash, Ares Capital has the option to settle each in cash, shares of common stock or a combination of cash and shares of common stock. The 2018 Convertible Notes of $270.0 million were repaid, in cash, at maturity in January 2018.
5. The 2018 High Grade Notes, the 2020 High Grade Notes, the 2022 High Grade Notes, the 2023 High Grade Notes may be redeemed in whole or in part at any time at Ares Capital’s option at a redemption price equal to par plus a “make whole” premium, as determined in the indenture governing the 2018 High Grade Notes, the 2020 High Grade Notes, the 2022 High Grade Notes, and the 2023 High Grade Notes and any accrued and unpaid interest.
6. The 2047 Notes with an aggregate principal amount of $230.0 million may be redeemed in whole or in part at any time or from time to time at Ares Capital's option at par redemption price of $25 per security plus accrued and unpaid interest.
7. As of December 31, 2017, the end of the reinvestment period for the Revolving Funding Facility is January 3, 2019. Subsequent to the end of this reinvestment period and prior to the stated maturity date of January 3, 2022, any principal proceeds from sales and repayments of loan assets held by Ares Capital CP Funding LLC will be used to repay the aggregate principal amount outstanding.
8. As of December 31, 2017, the end of the reinvestment period for the SMBC Funding Facility is September 14, 2018. Subsequent to the end of this reinvestment period and prior to the stated maturity date of September 14, 2023, any principal proceeds from sales and repayments of loan assets held by Ares Capital JB Funding LLC will be used to repay the aggregate principal amount outstanding.
9. In January 2018, Ares Capital issued the 2025 Notes. The 2025 Notes bear interest at a rate of 4.25% per year, payable semi-annually on March 1 and September 1 of each year, commencing on September 1, 2018. The 2025 Notes may be redeemed in whole or in part at Ares Capital’s option at any time at the redemption prices as determined pursuant to the indenture governing the 2025 Notes.
Ares Capital Corporation - Not for Publication or Distribution
Performance Notes

Ares Capital Corporation - Not for Publication or Distribution 47
Performance Notes to Overview of Ares Management SlideInformation respecting prior performance whether of a particular fund or investment strategy is not and should not be interpreted as a guaranty of future performance. Moreover, no assurancecan be given that unrealized, targeted or projected valuations or returns will be achieved. Future results are subject to any number of risks and factors, many of which are beyond the control ofAres. As with any investment, there is always the potential for gains as well as the possibility of losses.
Performance returns are as of December 31, 2017. Gross and net returns are rounded to the nearest whole number. Returns include the reinvestment of income and other earnings. Gross returnsdo not reflect the deduction of management fees, performance fees and carried interest, as applicable, or any other expenses that may be incurred in the management of the account. Net returnsfor the U.S. Bank Loan Aggregate and U.S. High Yield Composites are reduced by management fees; all other net returns are after giving effect to management fees, performance fees and carriedinterest, as applicable, and other expenses. The performance represented on this slide is considered representative of strategies currently available for investment. We believe aggregatedperformance returns reflect our overall performance returns in a strategy, but are not necessarily investable funds or products themselves. The performance does not represent all assets managedby Ares. The return earned by investors may vary materially from those presented. There can be no assurance that unrealized values or projected returns will be achieved.
Credit• Performance for U.S. Syndicated Loans is represented by the U.S. Bank Loan Aggregate Composite which includes all actual, fully discretionary, fee-paying, portfolios that are benchmarked to
the Credit Suisse Leveraged Loan Index and primarily invested in U.S. Dollar denominated banks loans. Portfolios may have limited allocations to high yield and structured securities. Portfoliosin the U.S. Bank Loan Aggregate Composite have an emphasis on capital appreciation and income. For periods prior to January 1, 2010 the U.S. Bank Loan Aggregate Composite included thebank loan segments of multi-asset class portfolios. The inception date of the U.S. Bank Loan Aggregate Composite is November 1997. From January 1, 2000 through January 1, 2010, cash wasallocated on a monthly basis to the bank loan segments based on relative assets. For periods prior to January 1, 2000 cash was not allocated to the bank loan segments. As of January 1, 2010the U.S. Bank Loan Aggregate Composite no longer includes bank loan segments of multi-asset class portfolios. The benchmark for the U.S. Bank Loan Aggregate Composite is the Credit SuisseLeveraged Loan Index. The index is designed to mirror the investable universe of the U.S. Dollar-denominated leveraged loan market. Investment track record of 15+ years dates prior tocomposite inception when Ares managed syndicated loans and high yield assets as part of its CLO strategy.
• Performance for U.S. High Yield is represented by the U.S. High Yield Composite, which includes all actual, fully discretionary, fee-paying, separately managed portfolios that primarily invest inU.S. high yield fixed income securities and are benchmarked to the ICE BofAML US High Yield Master II Constrained Index. Portfolios in the U.S. High Yield Composite have an emphasis oncapital appreciation and income. The benchmark for the U.S. High Yield Composite is the ICE BofAML US High Yield Master II Constrained Index, which tracks the performance of U.S. Dollar-denominated below investment grade corporate debt publicly issued in the U.S. domestic market with a maximum issuer exposure of 2%. The inception date of the U.S. High Yield Composite isMay 2007. Investment track record of 15+ years dates prior to composite inception when Ares managed syndicated loans and high yield assets as part of its CLO strategy.
• Gross performance for the Structured Product Core Composite is an annualized gross internal rate of return (“IRR”) that is calculated using the combined capital draw dates from the fee-paying limited partners in each fund for the composite and a combined fund valuation for the composite as of the period end date. The inception date of the IRRs for the Structured ProductCore Composite is August 11, 2008, which is the date of the first capital calls in the composite. IRRs include the reinvestment of income and other earnings and reflect the deduction of alltrading expenses. IRRs are presented as annualized returns. The gross IRR does not reflect the deduction of management fees, performance fees and carried interest, as applicable, andoperating and administrative expenses. Returns include the reinvestment of income and other earnings and reflect the deduction of all trading expenses. The net IRR reflects the deduction ofmanagement fees, performance fees and carried interest as if the composite was liquidated, and operating and administrative expenses. Actual expenses allocated to fee-paying limitedpartners are used in the net IRR calculation.
• Benchmark returns are provided to represent the investment environment existing during the time period shown. The returns for the ICE BofAML US High Yield Master II Constrained Index andthe Credit Suisse Leveraged Loan Index include the reinvestment of income and other earnings, but do not include transaction costs, management fees or other costs. Returns for the HFRIFund Weighted Composite Index are calculated using a time-weighted rate of return and are net of all fees.
• Gross performance for the U.S. Bank Loan Aggregate Composite and U.S. High Yield Composite does not reflect the deduction of investment advisory fees or any other expenses that may beincurred in the management of the account. Returns include the reinvestment of income and other earnings and reflect the deduction of all trading expenses. Net returns for the U.S. BankLoan Aggregate Composite and U.S. High Yield Composite are net of model investment advisory fees and are derived by subtracting 1/12th of the highest applicable fee on a monthly basisfrom the gross returns. Net returns for the Credit Opportunities Composite are net of actual management fees, performance fees and carried interest, as applicable, and other expensesallocated to investors. Performance fees and carried interest, as applicable, are accrued monthly.
• Gross performance for the Structured Product Core Composite is an annualized gross internal rate of return (“IRR”) that is calculated using the combined capital draw dates from the fee-paying limited partners in each fund for the composite and a combined fund valuation for the composite as of the period end date. The inception date of the IRRs for the Structured ProductCore Composite is August 11, 2008, which is the date of the first capital calls in the composite. IRRs include the reinvestment of income and other earnings and reflect the deduction of alltrading expenses. IRRs are presented as annualized returns. The gross IRR does not reflect the deduction of management fees, performance fees and carried interest, as applicable, andoperating and administrative expenses. Returns include the reinvestment of income and other earnings and reflect the deduction of all trading expenses. The net IRR reflects the deduction ofmanagement fees, performance fees and carried interest as if the composite was liquidated, and operating and administrative expenses. Actual expenses allocated to fee-paying limitedpartners are used in the net IRR calculation.
• Actual fees of the portfolios in each composite may vary depending on, among other things, the applicable fee schedule and portfolio size. Composites may contain accounts with performancebased fees. Investment management fees are described in Part 2 of the adviser’s Form ADV. All returns are expressed in U.S. Dollars.
Ares Capital Corporation - Not for Publication or Distribution 48
Credit (continued)• Performance footnote for Europe Direct Lending Aggregate IRR: As of December 31, 2017. Represents the performance of all realized investments made by the Ares European Direct Lending
Team in its commingled middle market direct lending funds (ACE I, ACE II and ACE III) since inception in July 2007, including all Separately Managed Accounts (“SMAs”) managed within theEuropean Direct Lending strategy. This includes investments in the ESSLP, a joint venture to which Ares and GE Commercial Bank SAS are parties, which are calculated based on capitalcontributed to the joint venture and do not reflect returns to the ESSLP from investments made by the joint venture. Realized gross asset level Internal Rate of Return is to the fund and not tothe fund's investors. IRR is the discount rate that makes the net present value of all cash flows related to a particular investment equal to zero. Internal Rate of Return is shown on an assetlevel and represents the cash flows to and from investments and is gross of management fees, performance fees and carried interest, as applicable, and expenses related to investments asthese fees and expenses are not allocable to specific investments and may differ among funds. The effect of such management and other expenses may reduce, maybe materially, the IRR'sshown herein. IRR includes realized returns and excludes the impact of fund / SMA‐level leverage where applicable. Investments are considered to be exited when the original investmentobjective has been achieved through the receipt of cash and/or non‐cash consideration upon the repayment or sale of an investment, or through the determination that no furtherconsideration was collectible and, thus, a loss may have been realized.
• ACE I fund level returns are not shown for ACE I due to its internally managed structure from 2007-2013.• ACE II and ACE III are made up of two feeder funds, one denominated in U.S. Dollars and one denominated in Euros. For ACE II, the gross and net IRRs for the Euro denominated feeder fund are
12.5% and 9.5%, respectively. For ACE III, the gross and net IRR for the U.S. dollar denominated feeder fund are 17.5% and 12.8%, respectively. The IRR is an annualized since inception internalrate of return of cash flows to and from the fund and the fund’s residual value at the end of the measurement period. The cash flow dates used in the IRR calculations are based on the actualdates of the cash flows. The gross IRRs reflect returns to all partners and are calculated before giving effect to management fees, performance fees as applicable, and other expenses. The netIRRs reflect returns to the fee-paying limited partners and if applicable, exclude interests attributable to the non-fee paying limited partners and/or the general partner who does not paymanagement fees or performance fees. The net IRRs are calculated after giving effect to management fees, performance fees as applicable, and other expenses. We are not showing the U.S.dollar denominated ACE II feeder fund gross and net IRRs here due to the U.S. GAAP mark-to-market reporting of the foreign currency hedging program in this feeder fund. It will be holdingthe foreign currency hedges until maturity, and therefore is expected to ultimately recognize a gain while mitigating the currency risk associated with the initial principle investments.
• Performance footnote for U.S. Direct Lending: As of December 31, 2017, Ares Capital Corporation (“ARCC”) performance statistics are shown as representative of the Ares U.S. Direct LendingGroup’s long term performance track record. Based on original cash invested, net of syndications, of approximately $20.6 billion and total proceeds from such exited investments ofapproximately $26.4 billion. Internal rate of return (“IRR”) is the discount rate that makes the net present value of all cash flows related to a particular investment equal to zero. Internal rate ofreturn is gross of management fees, performance fees and carried interest, as applicable, and expenses related to investments as these fees and expenses are not allocable to specificinvestments. The effect of such management and other expenses may reduce, maybe materially, the IRR’s shown herein. Investments are considered to be exited when the original investmentobjective has been achieved through the receipt of cash and/or non-cash consideration upon the repayment of ARCC’s debt investment or sale of an investment, or through the determinationthat no further consideration was collectible and, thus, a loss may have been realized.
Private Equity• ACOF I-IV Aggregate, as of December 31, 2017, refers to the gross performance for the Ares Corporate Opportunities Funds Aggregate, comprised of ACOF I, ACOF II, ACOF III and ACOF IV (each
defined below). The ACOF I-IV Aggregate is an annualized gross internal rate of return (“IRR”) that is calculated on the basis of monthly inflows and outflows of cash to and from investmentsand Unrealized Values, assuming such inflows and outflows occurred as of month end and all remaining investments were sold at the values shown through the end of March 2017. Theinception date of the IRRs for the ACOF I-IV Aggregate is May 2003 and is the date of the first investment. The net and gross returns reflect reinvestment of certain gains and other proceeds tothe extent permitted under the applicable governing documents. IRRs are presented as annualized returns and do not take into consideration the timing of contributions and distributions toand from the funds. The “Unrealized Value” includes Ares’ valuations of unrealized investments and accrued and unpaid cash interest as of December 31, 2017. The gross IRR does not reflectthe deduction of management fees, carried interest and operating and administrative expenses, and is calculated using cash flows and investment valuations attributable to all partners. Thenet IRR for the same period was 17%. Net IRR reflects the deduction of management fees, carried interest as if the ACOF I-IV Aggregate was liquidated, and operating and administrativeexpenses, and is calculated using cash flows and investment valuations attributable to the fee-paying limited partners. Actual expenses allocated to fee-paying limited partners are used in thenet IRR calculation. Performance for Ares Corporate Opportunities Fund V (“ACOF V”) is not included in the ACOF I-IV Aggregate, as ACOF V is early in its investment period and has not yetreached two years from its first investment. ACOF I refers to Ares Corporate Opportunities Fund, L.P. (vintage 2003). ACOF II refers to Ares Corporate Opportunities Fund II, L.P. (vintage2006). ACOF III refers to Ares Corporate Opportunities Fund III, L.P. (vintage 2008). ACOF IV refers to Ares Corporate Opportunities Fund IV, L.P. (vintage 2012). Gross IRRs for the period are20% for ACOF I, 19% for ACOF II, 31% for ACOF III and 24% for ACOF IV. Net IRRs for the period are 14% for ACOF I, 14% for ACOF II, 23% for ACOF III and 16% for ACOF IV.
• Performance for U.S. power and energy infrastructure is represented by the EIF Aggregate, as of December 31, 2017, which includes the Early Funds and the USPF Funds, each as definedbelow. The Gross IRR for the EIF Aggregate is 14.1% and is calculated based on aggregate monthly cash flows to/from each investment, including the equity that was funded to the investment,cash flows attributable to any reinvestment of proceeds, and the unrealized value for all unrealized investments as of December 31, 2017. Gross IRR does not reflect the effect of managementfees, carried interest, fund-level expenses or, in some cases, project-level expenses. The Net IRR for the EIF Aggregate is 9% and is calculated based on aggregate monthly cash flows to/fromeach fund’s limited partners, plus each fund’s net asset value as of December 31, 2017. Net IRR reflects the return to limited partners after giving effect to management fees, carried interestand other fund expenses, including the impact of the use of subscription financing. The Early Funds include Energy Investors Fund L.P., Energy Investors Fund II, L.P., and Project Finance FundIII, L.P., vintage years 1989, 1992, and 1995, respectively. Certain funds utilize a credit facility during the capital raising and investment period and for general cash management purposesduring the investment period. Net IRRs would be lower had the funds called capital from limited partners instead of utilizing the credit facility. The USPF Funds include United States PowerFund, L.P. (“USPF”), United States Power Fund II, L.P. and USPF II Institutional Fund, L.P. (together, the “USPF II Funds”), United States Power Fund III, L.P. (“USPF III”) and EIF United StatesPower Fund IV, L.P. (“USPF IV”), vintage years 2002, 2005, 2007, and 2010, respectively. As of December 31, 2017, (i) Gross IRRs for the Early Funds, USPF, the USPF II Funds, USPF III and USPFIV are 18.2%, 29.4%, 6.9%, 7.7% and 10.1%, respectively, and (ii) Net IRRs for the Early Funds, USPF, the USPF II Funds, USPF III and USPF IV are 15.4%, 25.0%, 4%, 5.1% and 6.6%, respectively.Gross and Net IRRs for the Early Funds are presented on a pro forma basis and exclude twenty investments (representing 22.7% of the total equity invested by the Early Funds) of a type thatAres EIF no longer focuses on, and has not focused on since 2002 (i.e., investments in companies whose principal assets or operations were outside of the U.S. and Canada, as well as a wastewater treatment facility). If such investments were included, the Gross and Net IRR for the Early Funds would be 16.6% and 10.5%, respectively.
Performance Notes to Overview of Ares Management Slide
Ares Capital Corporation - Not for Publication or Distribution 49
Private Equity (continued)• SSF I-IV Aggregate, as of December 31, 2017, refers to the gross performance for the Special Situations Funds Aggregate, comprised of SSF I, SSF I-b, SSF III and SSF IV (each defined below),
which includes all closed-end commingled, fully discretionary, fee-paying portfolios that invest primarily in distressed debt, post-reorganization equities and other special situationsinstruments. Portfolios in the SSF I-IV Aggregate may invest in currency forwards to hedge currency risk and credit default swaps or options contracts to hedge industry or issuer risk. The SSF I-IV Aggregate is an annualized gross internal rate of return (“IRR”) that is calculated using the combined capital draw dates from the fee-paying limited partners in each fund and a combinedfund valuation as of the period end date. The inception date of the IRRs for the SSF I-IV Aggregate is September 2007, which is the date of the first capital calls. IRRs include the reinvestmentof income and other earnings and reflect the deduction of all trading expenses. IRRs are presented as annualized returns. The gross IRR does not reflect the deduction of management fees,performance fees and carried interest, as applicable, and operating and administrative expenses. The net IRR reflects the deduction of management fees, performance fees and carriedinterest, as applicable, as if the SSF I-IV Aggregate was liquidated, and operating and administrative expenses. Actual expenses allocated to fee-paying limited partners are used in the net IRRcalculation. Past performance is not indicative of future results. SSF I refers to Ares Special Situations Fund, L.P. (vintage 2007). SSF I-b refers to Ares Special Situations Fund I-B, L.P. (vintage2009). SSF III refers to Ares Special Situations Fund III, L.P. (vintage 2010). SSF IV refers to Ares Special Situations Fund IV, L.P. (vintage 2015).
Real Estate• Performance returns presented herein are as of December 31, 2017 unless otherwise more specifically noted. The U.S. Equity aggregate and Europe Equity aggregate performance returns
reflect real estate investment strategies that are focused on income and appreciation (for value-add) and primarily appreciation (for opportunistic). Performance returns are based on actualcash activities through December 31, 2017, with all remaining assets and liabilities of each respective fund or investment existing as of December 31, 2017 assumed to be liquidated at theestimated values indicated in the respective financial statements with proceeds therefrom assumed to be distributed accordingly. Performance returns presented do not include funds wherethe initial investment was made less than two years prior to December 31, 2017.
• Performance for Debt is represented by Ares Commercial Real Estate Corporation (“ACRE”) performance statistics. Performance for U.S. Equity is represented by an aggregate of our U.S. realestate equity strategies, comprised of VEF I, VEF II, VEF III, VEF IV, VEF V, VEF VI, US Fund VII, US Fund VIII, AREIF I, AREIF II, AREIF III, AREIF IV, AREIF V and AREOF. Performance for EuropeEquity is represented by an aggregate of our European real estate equity strategies, comprised of IF, EF II, EF III, EF IV, EPEP I and co-investments by third party investors alongside investmentsmade by these funds.
• Gross IRR is an internal rate of return generally based on aggregate periodic cash flow activities between a specific fund and its respective investments (or portfolio of investments, asapplicable), including cash flows attributable to any sales, dispositions, reinvestment of proceeds, financing and/or refinancing and operating activities. Gross IRRs do not reflect or include theimpact of applicable management fees, performance fees or carried interest, fund level expenses, working capital, use of subscription financing and other expenses. Net IRR is an internal rateof return generally based on aggregate periodic cash flow activities and generally reflects and includes the impact of applicable management fees, performance fees or carried interest as if thefunds or investments in existence as of December 31, 2017 were liquidated at estimated fair values and proceeds distributed accordingly, fund level expenses, working capital, use ofsubscription financing and other expenses. The General Partner and any of its affiliates that do not bear management fee or carried interest are excluded for purposes of calculating the netIRR. Certain funds utilize a credit facility during the capital raising and investment period and for general cash management purposes during the investment period. Net IRRs would be lowerhad the funds called capital from limited partners instead of utilizing the credit facility.
• As of the period indicated, the U.S. Equity aggregate gross IRR is 15% and the net IRR is 10%. The U.S. Equity aggregate reflects the U.S. real estate equity strategies and includes investments inand the results of the following funds: (a) U.S. Equity Value-Add Funds: Value Enhancement Fund I, L.P. (“VEF I,” vintage 1993), Value Enhancement Fund II, L.L.C. (“VEF II,” vintage 1995),Value Enhancement Fund III, L.L.C. (“VEF III,” vintage 1997), Value Enhancement Fund IV, L.P. (“VEF IV,” vintage 1999), Value Enhancement Fund V, L.P. (“VEF V,” vintage 2001), ValueEnhancement Fund VI, L.P. (“VEF VI,” vintage 2005), Ares US Real Estate Fund VII, L.P. and Ares US Real Estate Fund VII 892, L.P. (collectively, "US Fund VII," vintage 2007), and Ares US RealEstate Fund VIII, L.P. ("US Fund VIII," vintage 2013); and (b) U.S. Equity Opportunistic Funds: Apollo Real Estate Investment Fund I, L.P. (“AREIF I,” vintage 1993), Apollo Real Estate InvestmentFund II, L.P. (“AREIF II,” vintage 1995), Apollo Real Estate Investment Fund III, L.P. (“AREIF III,” vintage 1997), Apollo Real Estate Investment Fund IV, L.P. (“AREIF IV,” vintage 1999), Apollo RealEstate Investment Fund V, L.P. (“AREIF V,” vintage 2004) and Ares US Real Estate Opportunity Fund, L.P. (“AREOF,” vintage 2008). Please note that AREIF I-IV were global funds, with the abilityto invest both within and outside of the U.S. AREIF I and II had no geographic investment limitations; AREIF III and IV were permitted to invest up to 30% of their aggregate commitments todeals outside of the U.S. The cash flow activities of AREIF I-IV (including investments made outside of the U.S.) are included in the gross and net IRRs of the U.S. real estate equity strategies.The gross and net IRRs of the U.S. real estate equity strategies presented herein do not include the investments in or the performance results of (a) funds with strategies other than value addand opportunistic, (b) single-investor investment accounts, and (c) co-investments made by third party investors alongside the U.S. Equity Value-Add and U.S. Opportunistic funds.
• As of the period indicated, the Europe Equity aggregate gross IRR is 15% and the net IRR is 8%. The Europe Equity aggregate reflects the European real estate equity strategies and includesinvestments in and the results of the following funds and co-investments: (a) European Equity Opportunistic Funds: Ares European Real Estate Fund I (EU), L.P. and Ares European Real EstateFund I (IF), L.P. (collectively, “IF,” vintage 2001), Ares European Real Estate Fund II, L.P. and Ares European Real Estate Fund II (Euro), L.P. (collectively, “EF II,” vintage 2004), Ares European RealEstate Fund III, L.P. and Ares European Real Estate Fund III (Euro), L.P. (collectively, “EF III,” vintage 2007) and Ares European Real Estate Fund IV, L.P. and Ares European Real Estate IV (Euro),L.P. (collectively, “EF IV,” vintage 2013); (b) European Equity Value-Add Funds: AREA European Property Enhancement Program, L.P. (“EPEP I,” vintage 2012); and (c) co-investments made bythird party investors alongside investments made by IF, EF II, EF III, EF IV and EPEP I. For purposes of calculating aggregate gross IRRs and net IRRs for the European real estate equitystrategies, the periodic cash flows for funds and co-investments that were denominated in currencies other than United States Dollars (USD) were converted to USD using a constant exchangerate based on the respective average spot rate over the life-to-date of such funds and co-investments.
• The performance data for Ares Commercial Real Estate Corporation (“ACRE”) shown herein does not include all debt-related assets and strategies managed by the Ares Real Estate Group. Thereturn shown for ACRE is the average annualized return on equity for the period since IPO of the company through December 31, 2017 and is calculated as the average of net income dividedby common equity (excluding minority interests) at the end of each fiscal quarter for the applicable period on an annualized basis. The return on equity reflects the implicit costs of un-invested capital, as well as the leverage utilized by ACRE, management fees, administrative fees reimbursed to manager as well as other expenses and costs incurred by ACRE or shareholdersof the company.
Performance Notes to Overview of Ares Management Slide
Ares Capital Corporation - Not for Publication or Distribution 50
• ARCC received the 2018 All- America Executive Team award alongside 43 other companies. Various Ares personnel received first place awards in the following categories: CEO, CFO, IRProfessional and IR program. 248 other institutions also received a first-, second-, or third-place ranking in one or more of those four categories. Institutional Investor based these awards onthe opinions of 1,940 portfolio managers and buy-side analysts, and 826 sell-side analysts who participated in this survey.
• Institutional Investor logo from Institutional Investor, November 7, 2017 ©2017 Institutional Investor, LLC. All rights reserved. Used by permission and protected by the Copyright Laws of theUnited States. The printing, copying, redistribution, or retransmission of this Content without express written permission is prohibited.
• Lipper Rankings reported in Lipper Marketplace Best Money Managers, September 30, 2017. Lipper Marketplace is the source of the long-only and multi-strategy credit rankings. Lipper’s BestMoney Managers rankings consider only those funds that meet the following qualification: performance must be calculated “net” of all fees and commissions; must include cash; performancemust be calculated in U.S. dollars; asset base must be at least $10 million in size for “traditional” U.S. asset classes (equity, fixed income, and balanced accounts); and, the classification of theproduct must fall into one of the categories which they rank. Lipper defines Short Duration as 1-5 years. Lipper’s Active Duration definition does not specify a time period but rather refers toan Active rather than Passive strategy. Ares Institutional Loan Fund was ranked 11 out of 58 for the 20 quarters ended September 30, 2017. Composites for Ares U.S. Bank Loan Aggregate andAres U.S. High Yield additionally received rankings of 9 of 58 and 3 of 40, respectively, for the 20 quarters ended September 30, 2017.
• Private Equity International selected Ares Management as Mid-Cap Lender of the Year – North America for 2014 and Ares Capital Corporation as Lender of the Year – North America for 2015and 2016– Awards based on an industry wide global survey across 60 categories conducted by Private Equity International. In the Mid-Cap Lender of the Year in North America category(renamed to Lender of the Year in 2015), Ares was listed as one of three shortlisted firms as suggested by the editorial board of PEI Media. Survey participants voted independently. In addition,survey participants could nominate another firm not listed in the category.
• Private Debt Investor selected Ares Capital Corporation as Global Sponsored Deal of the Year (Qlik Technologies) for 2016. Awards based on an industry wide global survey across 43 categoriesconducted by Private Debt Investor. In the Global Sponsored Deal of the Year category Ares was listed as one of four shortlisted firms as suggested by the editorial board of PEI Media. Surveyparticipants voted independently. In addition, survey participants could nominate another firm not listed in the category.
Performance Notes to Ares Credit Group Slide
Ares Capital Corporation - Not for Publication or Distribution