Corporate Finance - Aramex Vs. Agility Financial Ratios Analysis (Final)
Page 1
14 MAR 2016
FY 2015 Results4Q 2015 ResultsManagement Update Long-term PerformanceHussein Hachem, CEO
Bashar Obeid, CFO Outlook & Guidance
Investor Presentation
4Q and FY 2015 Results

Page 2
Disclaimer
Cautionary Note Regarding Forward-Looking Statements
FY 2015 Management Presentation
14 March 2015
This presentation has been prepared solely for informational purposes. The presentation may contain forward looking statements, which reflect our beliefs or current
expectations and assumptions regarding the future of the business, future plans and strategies, projections, anticipated events and trends, the economy and other
future conditions. Forward looking statements are neither historical facts nor assurances of future performance and can generally be identified by terminology including
"anticipate”, "aspire", "believe", "project", "estimate", "expect", "forecast", "strategy", "target", "trend", "future", "likely", "may", "should", "will", "intend", "plan", "goal",
"objective", "seek", “roadmap”, and other words of similar meaning or similar expressions.
By their nature, forward looking information and statements are subject to known and unknown uncertainties, risks and changes in circumstances that are difficult to
predict and not in our control. Our actual results of operations and financial conditions may differ materially from that or those indicated in the forward looking
statements. You should not place undue reliance on any of these forward looking statements.
Any forward looking statement made by us in the presentation is based only on information currently available to us and speaks only as to the date on which this
presentation is made. Past performance is not a reliable indication of future performance. We make no representations or warranties as to the accuracy, or
completeness of the information and shall not have any liability for any representations, express or implied, regarding the information contained in, or for any omissions
from, the information included in this presentation. We undertake no obligation to publicly update any forward looking statement whether as a result of new information,
future developments or otherwise. The information contained in the presentation is prepared to assist prospective investors in making their own evaluation of the
Company.

Page 3
FY 2015 Results4Q 2015 ResultsManagement Update Long-term PerformanceHussein Hachem, CEO
Bashar Obeid, CFO Outlook & Guidance
ManagementUpdate
14 MAR 2016

Page 4
Aramex Today
Aramex is a global provider of logistics and transportation solutions
Aramex Today
Key Messages
Management Focus
Financial Performance
Value Creation
Core Beliefs
13,830 Employees
350+ offices in 60 Countries
Listed on Dubai Financial Market
AED 4.3 billion market cap
FY 2015 Management Presentation
14 March 2015

Page 5
Key Messages
Aramex is well positioned for future growth
Leader in Transport and Logistics →
Asset-light →
Efficiency →
Acquisitions →
Growth →
Shareholder participation →
Aramex is a market leader with a strong management track record of success
We remain focused on delivering an asset-light business model
We are transitioning towards a leaner, more agile business model
We are investing in plug and play acquisitions to grow our footprint
We expect to grow in all relevant financial KPIs (Revenues, EBITDA, Margins, ROE)
Our shareholders will participate with growth of dividends following FCF growth
FY 2015 Management Presentation
14 March 2015
Page 6
Management Focus
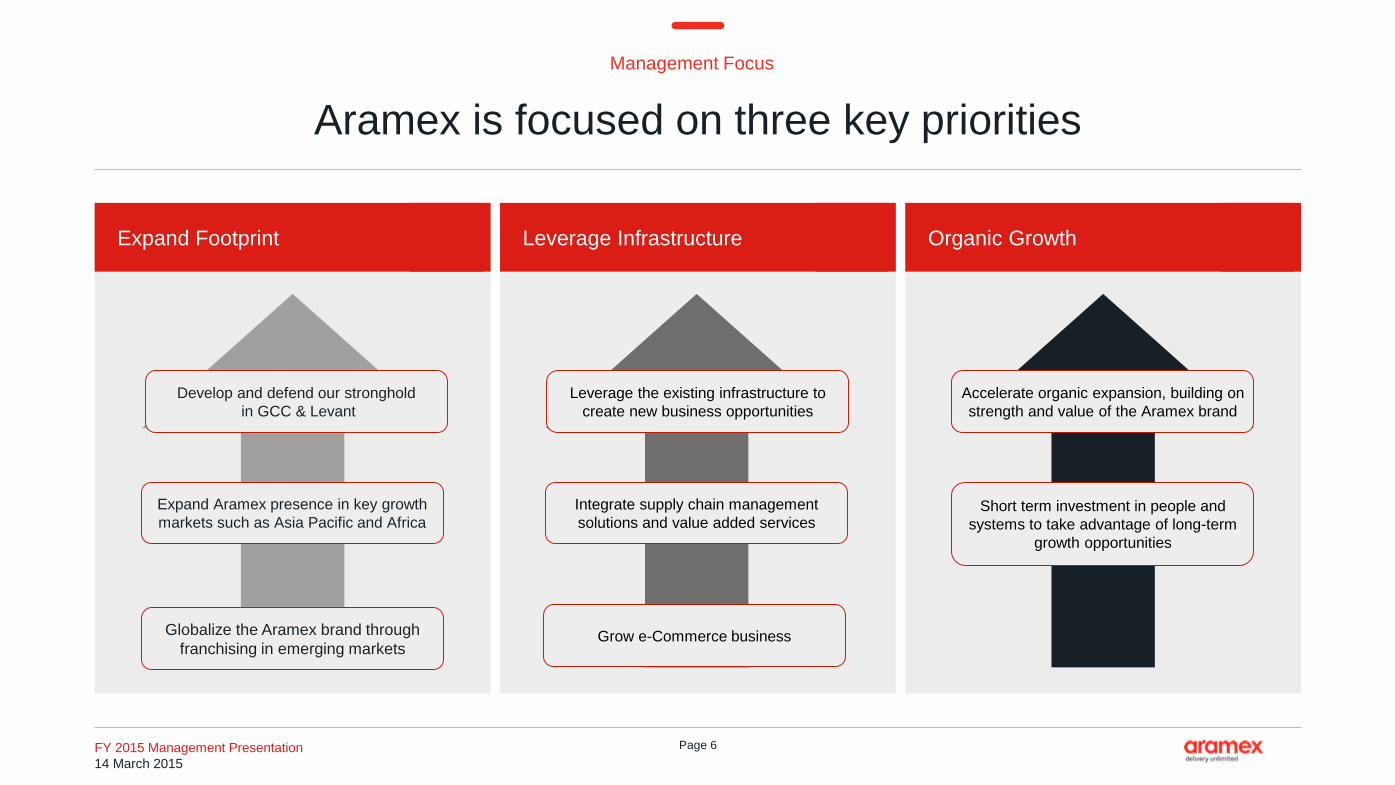
Aramex is focused on three key priorities
Leverage InfrastructureExpand Footprint Organic Growth
Develop and defend our stronghold
in GCC & Levant
Expand Aramex presence in key growth
markets such as Asia Pacific and Africa
Globalize the Aramex brand through
franchising in emerging markets
Leverage the existing infrastructure to
create new business opportunities
Integrate supply chain management
solutions and value added services
Grow e-Commerce business
Accelerate organic expansion, building on
strength and value of the Aramex brand
Short term investment in people and
systems to take advantage of long-term
growth opportunities
FY 2015 Management Presentation
14 March 2015

Page 7
Financial Performance
Aramex continues to deliver solid performance
FY 2015 Results → Performance across key indicators
REVENUES →5% growth overall, including 4.4%
adverse impact from FX
2,571 3,072 3,321 3,643 3,837
2011 2012 2013 2014 2015
EBITDA → Year on year improvement
306 364 425 461 470
2011 2012 2013 2014 2015
EPS → -2% offset by special item0.144 0.167 0.190 0.217 0.213
2011 2012 2013 2014 2015
ROE → In line with management agenda
11.3% 12.1% 13.3% 14.7% 14.4%
2011 2012 2013 2014 2015
FY 2015 Management Presentation
14 March 2015

Page 8
Dividend Payout (per share) Ratio
2012 AED 0.100 52.2%
2013 AED 0.115 60.6%
2014 AED 0.140 62.8%
2015e Target >60%
Market Capitalization (AED m) →
92 239
679
2,090
3,045
2,635
2,928
4,451 4,539 4,627
0
500
1,000
1,500
2,000
2,500
3,000
3,500
4,000
4,500
5,000
1997Listing onNasdaq
2002Delisting
fromNasdaq
2005Listing on
DFM
2009 2010 2011 2012 2013 2014 2015
Value Creation
Aramex shareholders consistently participate in growth
FY 2015 Management Presentation
14 March 2015

Page 9
Core Beliefs
We believe in transforming our business to succeed in a digital world
Business Model Disruption →
Shipping is changing →
Ecosystem →
Technology →
Devices →
Talent →
We believe that the current logistics model will not last
All the way from bulk to containers to pallets to boxes to pieces – new industry
dynamics apply to all players in the industry
We believe in winning with an ecosystem that connects “sharing” platforms
We believe that technology has already accelerated the pace of industry change
We believe that devices are becoming smarter and are connecting the unconnected
Better technology will enable employees to become more efficient
FY 2015 Management Presentation
14 March 2015

Page 10
Operational Roadmap
Three key components drive our operational roadmap
Growth Innovation Transformation
Organic Growth In-house R&D People
Platform
Infrastructure
CultureM&A M&A
FY 2015 Management Presentation
14 March 2015

Page 11
Growth
M&A: Focus is on eCommerce and last mile delivery
Aramex →
21 Jan 2016 →
Strong last mile delivery network →
Value Add →
Scale →
Target →
100% acquisition at AED 293.65 million; cash + debt
1,500 courier franchisees across Australia, New Zealand, Ireland, Northern Ireland
and South Africa.
Asset-light, 63 regional depots, technology savvy, new market exposure
Fastway transports 16 million parcels globally to 75,000 customers each year
EPS accretive from day one
2020Fastway Ltd – last mile delivery
FY 2015 Management Presentation
14 March 2015

Page 12
M&A: Focus is on eCommerce and last mile delivery
Aramex →
In FY 2015 →
Geographies →
Focus areas →
Purpose →
Target →
6 small acquisitions of eCommerce and last mile delivery networks
2 x India, 1x Canada, 1x Brazil, 1x Saudi Arabia, 1 x Dubai
Parcel delivery, Food delivery, Laundry delivery
Integration into existing Aramex network
EPS accretive within 3 years
2020Startup Portfolio
Growth
FY 2015 Management Presentation
14 March 2015

Page 13
14 MAR 2016
4Q 2015 Results
FY 2015 Results4Q 2015 ResultsManagement Update Long-term PerformanceHussein Hachem, CEO
Bashar Obeid, CFO Outlook & Guidance

Page 14
Financial & Performance Highlights
Q4 2015 Financial Highlights
Income Statement
Quarter Movement (%)
4Q 15 3Q 15 4Q 14 q-o-q y-o-y
Revenue 1,003.3 937.5 956.8 7.0% 4.9%
Cost of services (434.9) (409.9) (428.6) -6.1% -1.5%
Gross profit 568.4 527.5 528.1 7.7% 7.6%
Overheads (497.0) (437.8) (421.0) -13.5% -18.0%
Income before tax 72.5 88.1 107.6 -17.7% -32.6%
Profit after tax from cont. operations 66.8 78.6 96.8 -15.0% -31.0%
Profit for the period 66.8 78.6 97.3 -15.0% -31.4%
Attributable income 57.6 74.6 89.4 -22.8% -35.6%
EBIT (Operating income) 71.2 88.6 105.8 -19.6% -32.7%
EBITDA 93.5 110.7 127.2 -15.6% -26.5%
Income Statement (AED m) →
FY 2015 Management Presentation
14 March 2015

Page 15
Financial & Performance Highlights
Q4 2015 Financial Highlights
5% Revenues increase mainly driven by
double-digit growth in Express business (14.5%
y-o-y); CoR remained stable (+1.5%)
Total Overheads were offset by AED 46.4 m
provision for management incentive plan
Attributable income decline reflects special
item, excluding this Aramex grew attributable
income by 16.4% to AED 104 m
Management Comments →
956.8 937.51,003.3
Q4 2014 Q3 2015 Q4 2015
428.6 409.9434.9
Q4 2014 Q3 2015 Q4 2015
421.0 437.8497.0
Q4 2014 Q3 2015 Q4 2015
89.4
74.6
57.6
Q4 2014 Q3 2015 Q4 2015
Revenues (AED m) CoR (AED m)
Total Overheads (AED m) Attributable Income (AED m)
FY 2015 Management Presentation
14 March 2015
Page 16
Management Incentivization
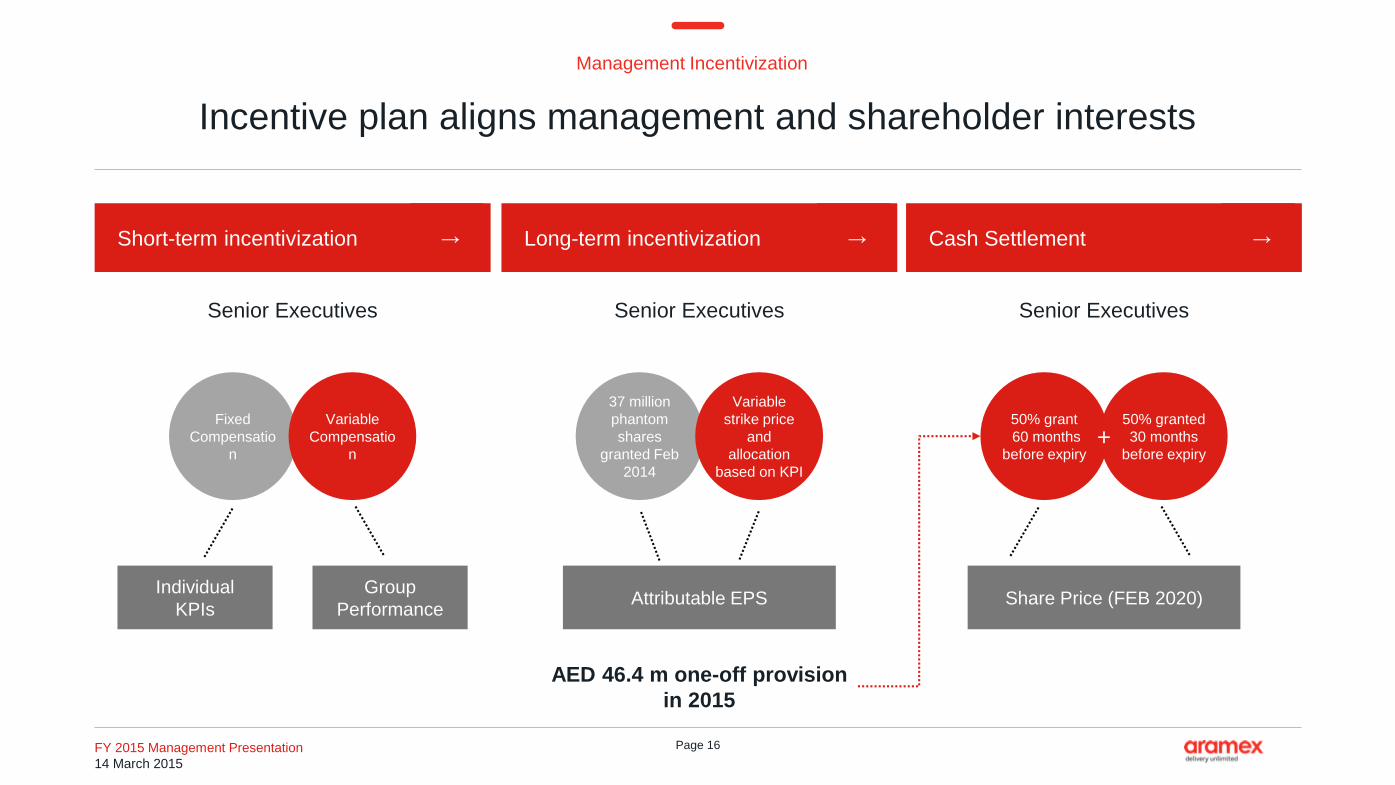
Incentive plan aligns management and shareholder interests
Short-term incentivization → Long-term incentivization → Cash Settlement →
Fixed
Compensatio
n
Variable
Compensatio
n
Individual
KPIs
Group
PerformanceAttributable EPS Share Price (FEB 2020)
Senior Executives Senior ExecutivesSenior Executives
37 million
phantom
shares
granted Feb
2014
Variable
strike price
and
allocation
based on KPI
50% grant
60 months
before expiry
50% granted
30 months
before expiry+
AED 46.4 m one-off provision
in 2015
FY 2015 Management Presentation
14 March 2015

Page 17
Financial & Performance Highlights
Q4 2015 Financial Highlights
Income Statement
Quarter Movement (%)
4Q 15 3Q 15 4Q 14 q-o-q y-o-y
EPS (AED) 0.039 0.051 0.061 -23% -36%
Gross profit margin (%) 57% 56% 55% 0% 1%
Net profit margin (%) 6.7% 8.4% 10.2% -1.7% -3.5%
EBITDA margin % 9.3% 11.8% 13.3% -2.5% -4.0%
ROE % 10.7% 13.7% 16.5% -3.1% -5.9%
ROA % 6.7% 9.4% 11.1% -2.7% -4.5%
Debt/Equity % 16.2% 7.6% 7.6% -8.7% -8.6%
BVPS (AED) 1.48 1.48 1.48 0% 0%
Financial Ratios (AED m) →
FY 2015 Management Presentation
14 March 2015

Page 18
14 MAR 2016
FY 2015 Results4Q 2015 ResultsManagement Update Long-term PerformanceHussein Hachem, CEO
Bashar Obeid, CFO Outlook & Guidance
2015 Results

Page 19
Financial & Performance Highlights
Aramex continues to deliver solid revenue growth
Revenue generation
Despite market volatility, low oil price and
regional instability, very solid revenue growth
of 5.3% for 2015
Growth primarily in international and domestic
express as well as in Middle East & Africa
Currencies
FX fluctuations adversely impacted
FY 2015 revenues by 4.4%
Revenues (AED m) →
2,212
2,571
3,0723,321
3,6433,837
500
1,000
1,500
2,000
2,500
3,000
3,500
4,000
4,500
2010 2011 2012 2013 2014 2015
CAGR
11.6%
FY 2015 Management Presentation
14 March 2015

Page 20
Financial & Performance Highlights
Strong underlying result across the business
EBITDA before special items:
Aramex generated strong underlying result
across the business
EBITDA before special items (AED m) →
275306
364
425461
516
100
200
300
400
500
600
2010 2011 2012 2013 2014 2015
CAGR
13.4%
EBITDA Margin %
FY 2015 Management Presentation
14 March 2015

Page 21
Financial & Performance Highlights
Aramex maintains performance across key indicators
EBITDA margin before special items (%) → Net Profit Margin (%) → Return on Equity (%) →
10.4%
9.4%8.8%
9.5% 9.5%9.0%
0.0%
2.0%
4.0%
6.0%
8.0%
10.0%
12.0%
2010 2011 2012 2013 2014 2015
12.4%11.9% 11.9%
12.8% 12.7%13.5%
0.0%
2.0%
4.0%
6.0%
8.0%
10.0%
12.0%
14.0%
16.0%
2010 2011 2012 2013 2014 2015
11.5% 11.3%12.1%
13.3%
14.7% 14.4%
0.0%
2.0%
4.0%
6.0%
8.0%
10.0%
12.0%
14.0%
16.0%
2010 2011 2012 2013 2014 2015
FY 2015 Management Presentation
14 March 2015

Page 22
Financial & Performance Highlights
Growth momentum across geographies in 2015
Revenues by Geography (AED m)→
3,643.2
145.4
-43.5
43.9
47.8 3,836.8
FY 2014 Middle East &Africa
Europe North America Asia andOthers
FY 2015
Middle East & Africa72%
Europe14%
North America
3%Asia and Others11%
FY 2015
FY 2015 Management Presentation
14 March 2015

Page 23
Financial & Performance Highlights
Growth momentum in core business segments
Revenues by segment (AED m) →
3,643.2
159.7
56.7
-41.3
7.8 10.73,836.8
FY 2014 InternationalExpress
DomesticExpress
FreightForwarding
Logistics Other FY 2015
Express36%
Freight Forwarding
31%
Domestic21%
Logistics6%
Other 6%
FY 2015
FY 2015 Management Presentation
14 March 2015

Page 24
Financial & Performance Highlights
Aramex balance sheet remains strong and liquid
2015 Highlights → Total Assets (AED m) → Asset Movement Y-o-Y (AED m) →
620 707
687 731
1,9012,007
2014 2015
Cash Receivables Other Assets
3,2073,445
Total balance sheet grew by 7.4%
Total assets increased by AED 238 m
Cash up by AED 87.3 m; 20.5% of total assets
Receivables up AED 44.6 m, 21.2% of total
assets
PPE increased AED 173 m
Goodwill impairment of AED 50
3,207 87 45
-29
173
-50
12
3,445
FY 2015 Management Presentation
14 March 2015
Page 25
Financial & Performance Highlights
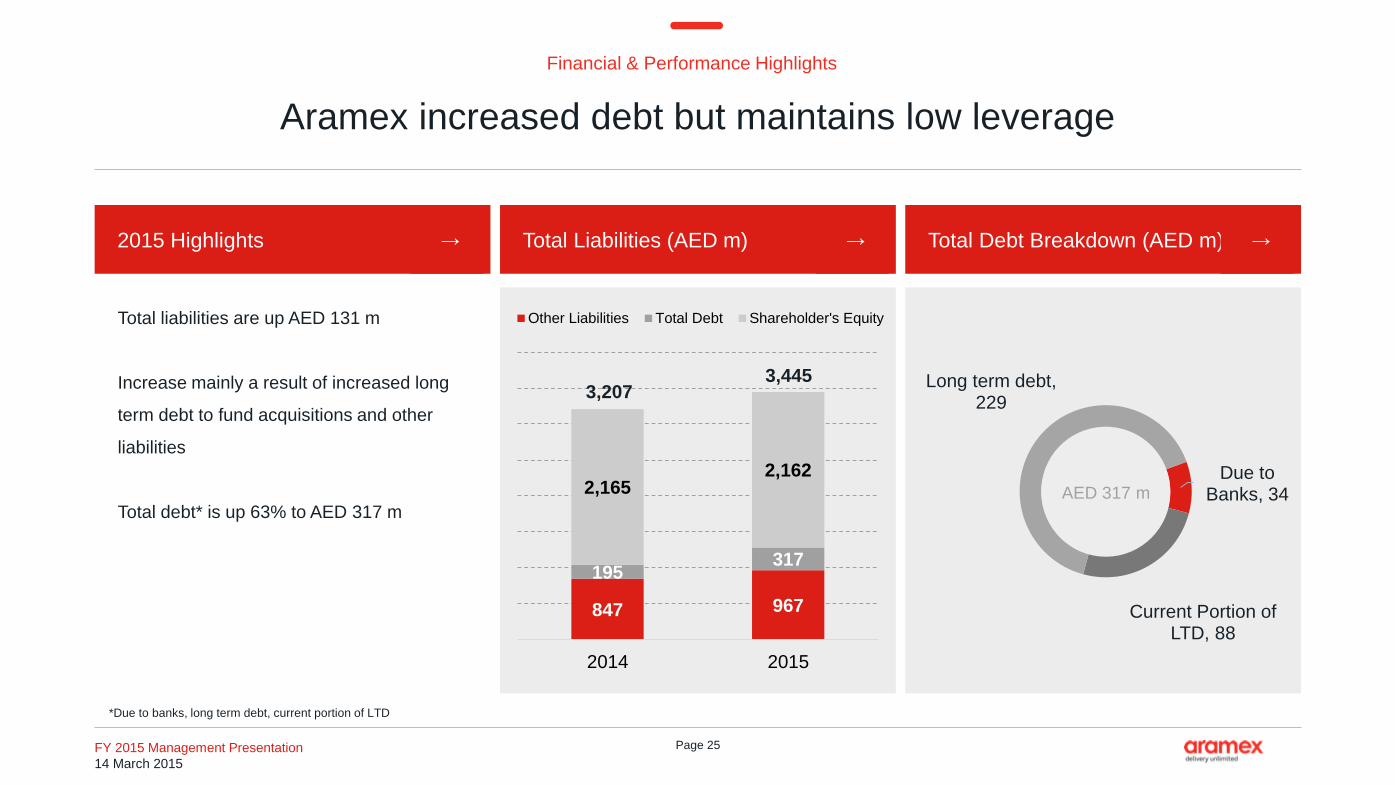
Aramex increased debt but maintains low leverage
2015 Highlights → Total Liabilities (AED m) → Total Debt Breakdown (AED m) →
Total liabilities are up AED 131 m
Increase mainly a result of increased long
term debt to fund acquisitions and other
liabilities
Total debt* is up 63% to AED 317 m
*Due to banks, long term debt, current portion of LTD
847 967
195317
2,1652,162
2014 2015
Other Liabilities Total Debt Shareholder's Equity
3,2073,445
Due to Banks, 34
Current Portion of LTD, 88
Long term debt, 229
AED 317 m
FY 2015 Management Presentation
14 March 2015

Page 26
14 MAR 2016
Long-term Performance
FY 2015 Results4Q 2015 ResultsManagement Update Long-term PerformanceHussein Hachem, CEO
Bashar Obeid, CFO Outlook & Guidance

Page 27
Financial & Performance Highlights
Aramex has a track record of delivering operational excellence
We delivered a consistently strong
performance since 2010
2010-2015 CAGR
Revenues 11.6%
Cost of Revenues 10.4%
EBITDA: 11.3%
EBITDA before special items: 13.4%
Aramex 2010-2015 (Indexed) →
100
110
120
130
140
150
160
170
180
190
200
2010 2011 2012 2013 2014 2015
Revenues CoR EBITDA before special items EBITDA
FY 2015 Management Presentation
14 March 2015

Page 28
Financial & Performance Highlights
Aramex shareholders rewarded by long term performance
Share Price Change: 118.6%
Annualized return: 13.9%
Total Return
(dividends reinvested): 180.4%
Annualized Total Return:
(dividends reinvested) 18.7%
Performance (Jan 2010-Dec 2015) →
0.00
0.50
1.00
1.50
2.00
2.50
3.00
3.50
2010 2011 2012 2013 2014 2015
47.8% -9.42% 12.2% 55.6% 6.59% 6.23%Total
Return
2016
FY 2015 Management Presentation
14 March 2015

Page 29
2,212
698279
480102 65 3,837
0
500
1,000
1,500
2,000
2,500
3,000
3,500
4,000
FY 2010 Express FreightForwarding
Domestic Logistics Other FY 2015
Financial & Performance Highlights
Components of Aramex’s growth story
Contribution by Business (AED m) →2010-2015
Growth story since 2010
CAGR Express 15.0%
CAGR Freight Forwarding 5.4%
CAGR Domestic 19.6%
CAGR Logistics 14.7%
CAGR Other 7.0%
FY 2015 Management Presentation
14 March 2015

Page 30
Financial & Performance Highlights
Express business is outgrowing freight forwarding
Evolution of revenue mix since 2010 points
to Express business outgrowing other
businesses; this is a direct result of the
growing eCommerce business
Combined domestic and international
Express contribution +11.2% of revenues
since 2010
Freight forwarding has consistently declined
by -10.4% of total revenues since 2010
Segmental Revenues (%) → 5%10%8%19%Y-o-Y Total
Revenue
Growth
46.1% 46.9% 50.8% 51.2% 54.4% 57.3%
41.8% 41.8% 38.1% 37.1% 34.2% 31.4%
12.1% 11.4% 11.1% 11.7% 11.4% 11.3%
0%
10%
20%
30%
40%
50%
60%
70%
80%
90%
100%
2010 2011 2012 2013 2014 2015
Express (Domestic & International) Freight Forwarding Logistics & Other
16%
FY 2015 Management Presentation
14 March 2015

Page 31
Financial & Performance Highlights
Defending and developing our market position in growth markets
2,212.0
1,200.1 136.7 64.0
224.0 3,836.8
0
500
1,000
1,500
2,000
2,500
3,000
3,500
4,000
FY 2010 Middle East Europe North America Asia & Other FY 2015
Contribution by Geography (AED m)→
Growth story since 2010
CAGR Middle East 12.1%
CAGR Europe 5.9%
CAGR North America 18.8%
CAGR Asia & Other 16.7%
2010-2015
FY 2015 Management Presentation
14 March 2015

Page 32
Financial & Performance Highlights
Aramex balance sheet Evolution
Aramex consistently grows its balance sheet
We maintain a prudent approach towards
managing our debt
Debt*/ Equity low at 8.2%
Debt / EBITDA: 67%
Total Asset (AED m) →
2,2862,493
2,715
2,986
3,207
3,445
1.1% 2.2% 2.0%
8.5% 7.6% 8.2%
0%
5%
10%
15%
20%
25%
30%
35%
40%
45%
50%
500
1,000
1,500
2,000
2,500
3,000
3,500
2010 2011 2012 2013 2014 2015
*Debt for this purpose consists of interest-bearing short & long term liabilities
Debt / Equity (%)
FY 2015 Management Presentation
14 March 2015

Page 33
14 MAR 2016
Outlook & Guidance
FY 2015 Results4Q 2015 ResultsManagement Update Long-term PerformanceHussein Hachem, CEO
Bashar Obeid, CFO Outlook & Guidance
Page 34
Outlook & Guidance
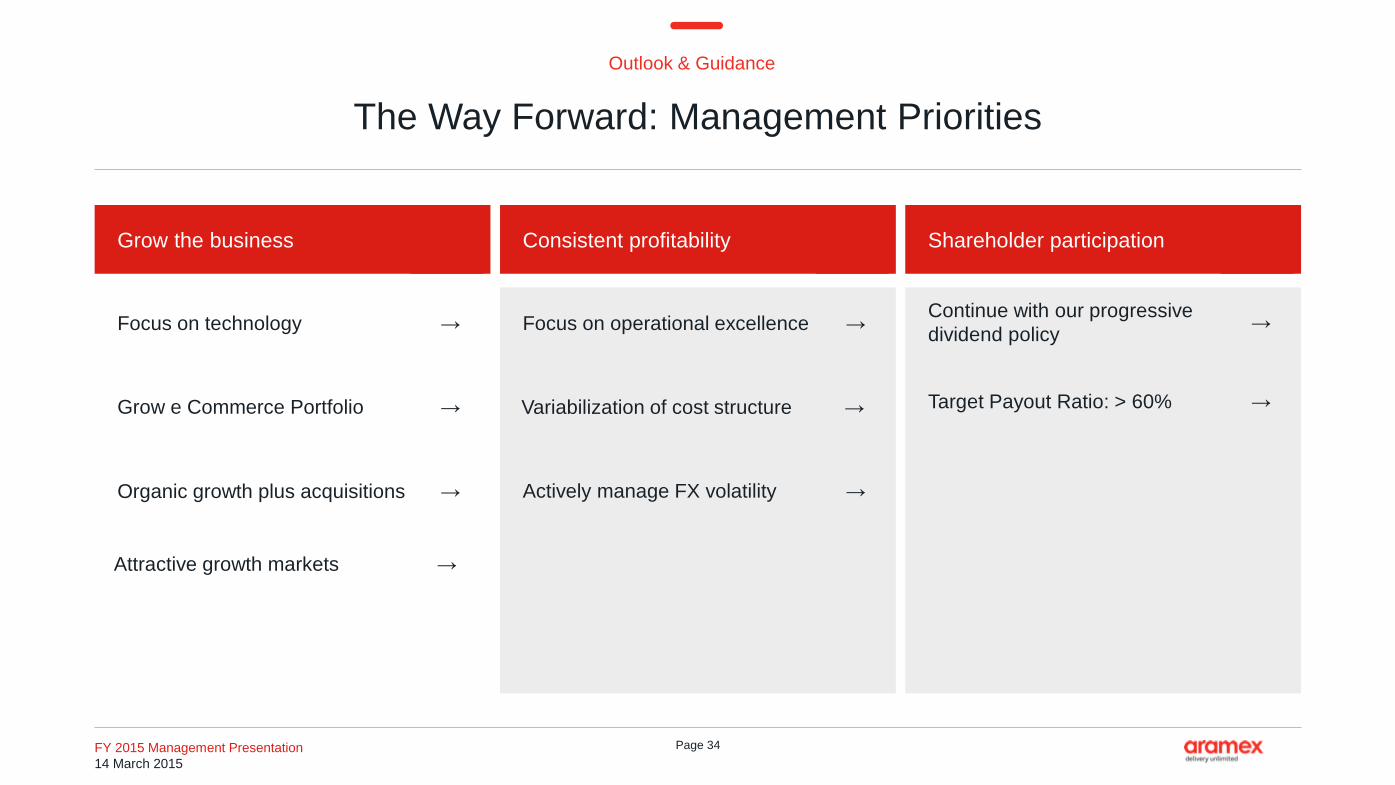
The Way Forward: Management Priorities
Grow the business Consistent profitability Shareholder participation
Focus on technology →
Grow e Commerce Portfolio →
Organic growth plus acquisitions →
Focus on operational excellence →Continue with our progressive
dividend policy→
Target Payout Ratio: > 60% →Variabilization of cost structure →
Attractive growth markets →
Actively manage FX volatility →
FY 2015 Management Presentation
14 March 2015

Page 35
Outlook & Guidance
Management Ambition: Guidance
2015 Actual 2016 Target (AED m)
Express
Freight Forwarding
Domestic
Logistics
Other
Total
AED 1,387 m
AED 1,203 m
AED 811 m
AED 205 m
AED 229 m
AED 3,837 m
Double-digit growth
Slight decrease
Double-digit growth
Slight increase
Slight increase
Considerable increase
→ 13%
→
3.3%
7.5%
3.9%
4.9%
5.3%
FY 2015 Management Presentation
14 March 2015
Page 36
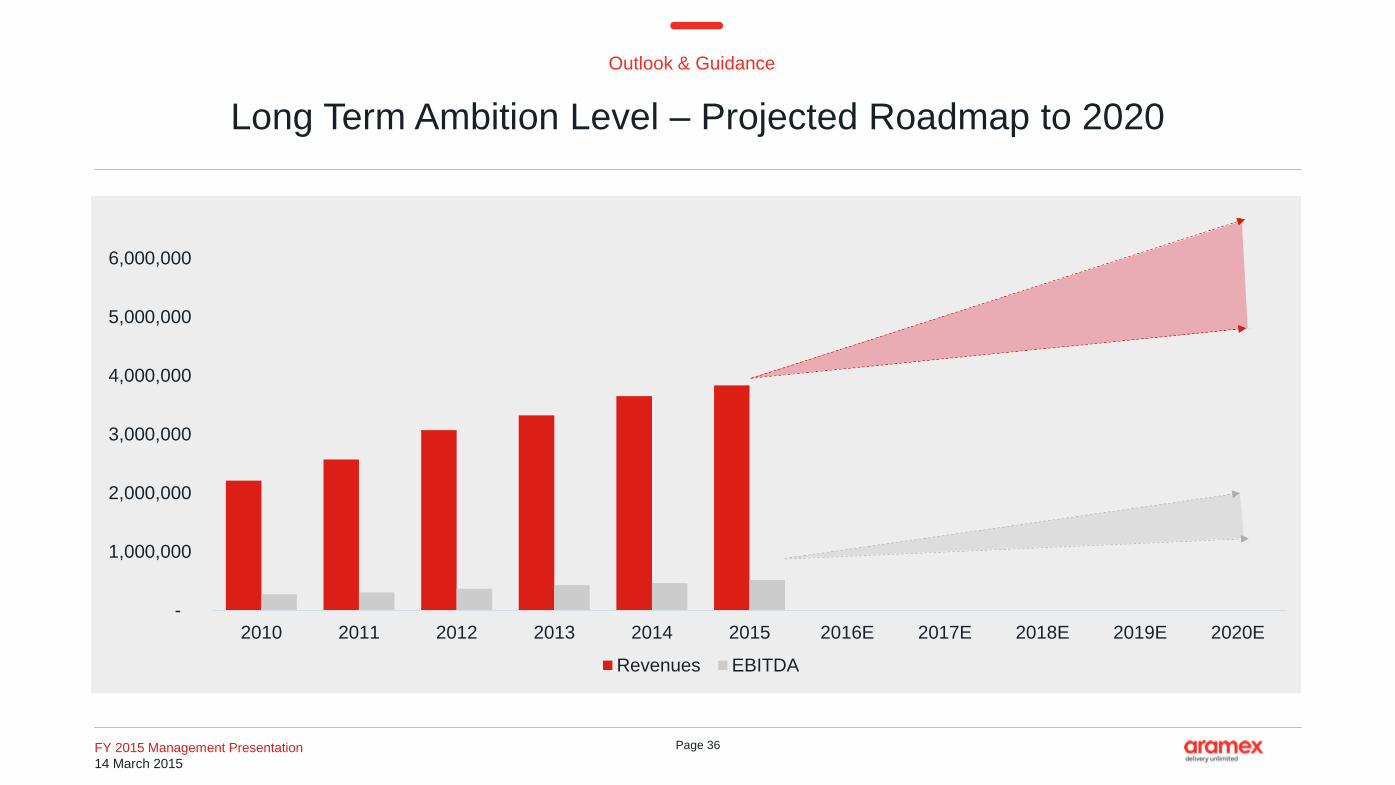
-
1,000,000
2,000,000
3,000,000
4,000,000
5,000,000
6,000,000
2010 2011 2012 2013 2014 2015 2016E 2017E 2018E 2019E 2020E
Revenues EBITDA
Outlook & Guidance
Long Term Ambition Level – Projected Roadmap to 2020
FY 2015 Management Presentation
14 March 2015

Page 37
Aramex
Investor Relations Contacts
Hussein Hachem
CEO
Bashar Obeid
CFOMohammad Al Qassem
Investor Relations
Investor Relations:[email protected]
Tel +971 4 2118464
Dubai – UAE
www.aramex.com/investors
Download Aramex App:
FY 2015 Management Presentation
14 March 2015

Page 38