Investor Presentation & Fact sheet: Q3 FY 21
19
Investor Presentation & Fact sheet: Q3 FY 21 February 2021
Transcript of Investor Presentation & Fact sheet: Q3 FY 21
Investor Presentation & Fact sheet: Q3 FY 21February 2021

www.happiestminds.com2
This presentation may contain certain forward-looking statements, which involves risks and
uncertainties that could cause our future results to differ materially from those in such forward-
looking statements. The COVID-19 pandemic could decrease our customers’ technology spend,
delaying prospective customers’ purchasing decisions, and impact our ability to provide services; all of
which could adversely affect our future revenue, margin and overall financial performance. Our
operations could also be negatively impacted by a range of external factors not within our control
including those due to the pandemic. We do not undertake to update any of our forward-looking
statements that may be made from time to time by us or on our behalf.

www.happiestminds.com3
Next Generation Digital Transformation, Infrastructure, Security and Product Engineering Services Company
IPO In September 2020
Promoter
• 100 % digitally
executed IPO
• Heavily
oversubscribed with
healthy listing gains
Reflects
• Our growth and
profitability
• Management Team
& Corporate
governance
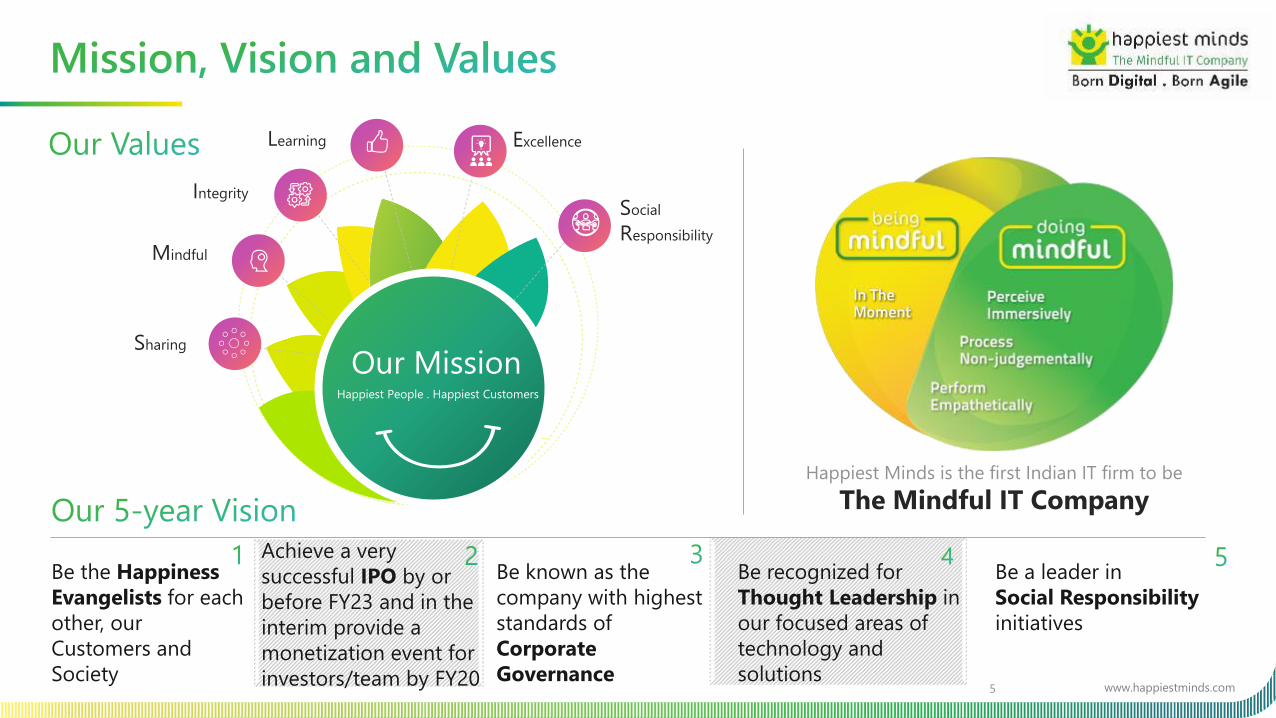
Mission Statement
SMILES Values
Sharing, Mindful, Integrity,
Learning, Excellence, Social
Responsibility
across 7 Countries
Happiest
Minds
Digital
• Ranked IT Services
• Top India’s Best Workplaces
for Women
• Top India’s Best Workplaces
• Top India’s Best Workplaces
for IT/IT-BPM
rating
on Glassdoor
#2 for Indian IT Services
Agile
2019
*All logos are properties of their respective owners Note 1: Trailing 12 months Revenue from existing customers; 2: ROCE / ROE is nine months annualized
Ashok Soota
Digital
38 Fortune2000 / Forbes200 /
Billion $ corporations
Active clients RoCE1
RoE93% of repeat business 2
www.happiestminds.com4
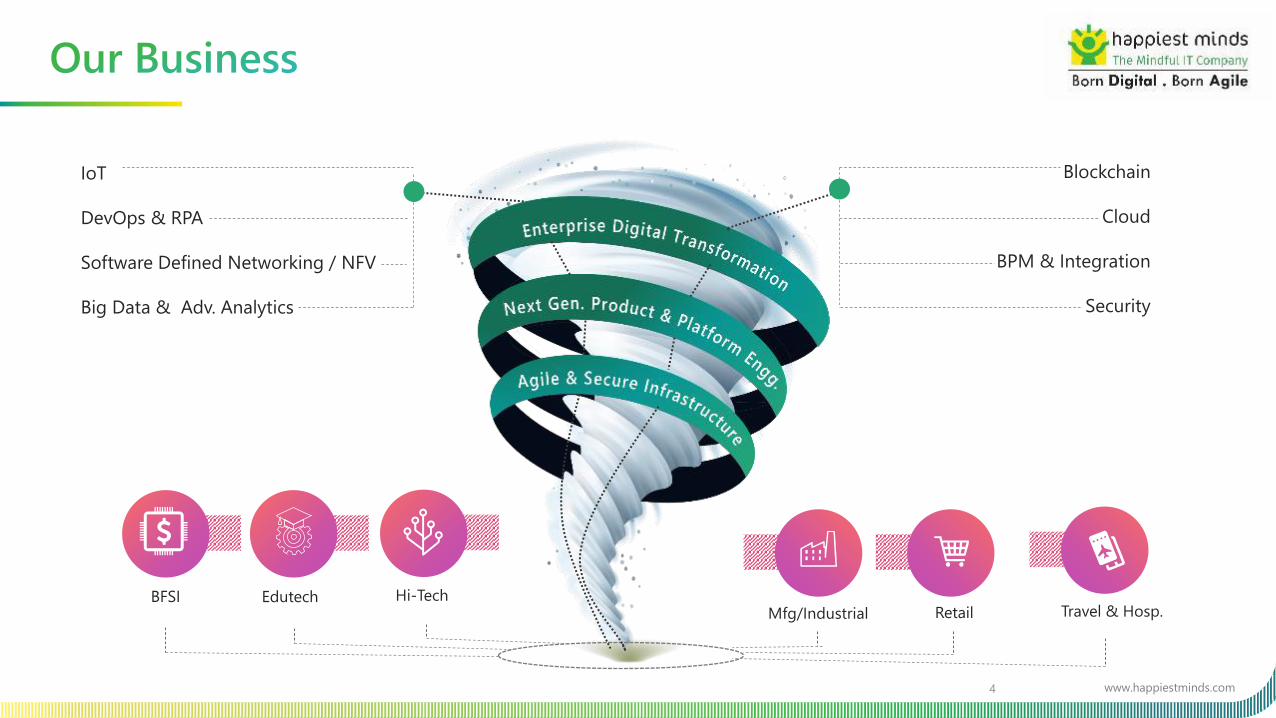
IoT
DevOps & RPA
Software Defined Networking / NFV
Big Data & Adv. Analytics
EdutechRetail
Hi-TechMfg/Industrial Travel & Hosp.
Blockchain
Cloud
BPM & Integration
Security
BFSI
www.happiestminds.com5
Be the Happiness
Evangelists for each
other, our
Customers and
Society
Achieve a very
successful IPO by or
before FY23 and in the
interim provide a
monetization event for
investors/team by FY20
Be known as the
company with highest
standards of
Corporate
Governance
Be recognized for
Thought Leadership in
our focused areas of
technology and
solutions
Be a leader in
Social Responsibility
initiatives
Sharing
Mindful
Integrity
Our MissionHappiest People . Happiest Customers
Learning
Social
Responsibility
Excellence
Happiest Minds is the first Indian IT firm to be
The Mindful IT Company
www.happiestminds.com6
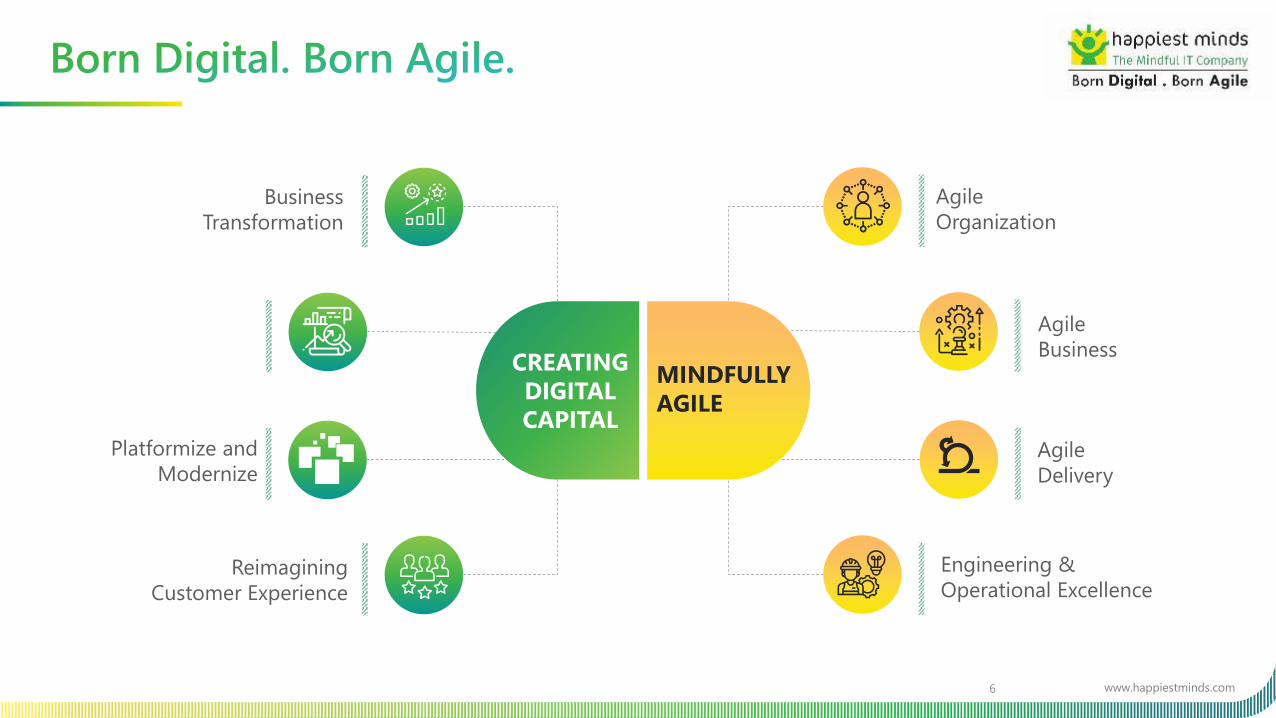
Engineering &
Operational ExcellenceReimagining
Customer Experience
Business
Transformation
Agile
Organization
Agile
Business
Agile
Delivery
CREATING
DIGITAL
CAPITAL
MINDFULLY
AGILE
Platformize and
Modernize
www.happiestminds.com7
www.happiestminds.com8
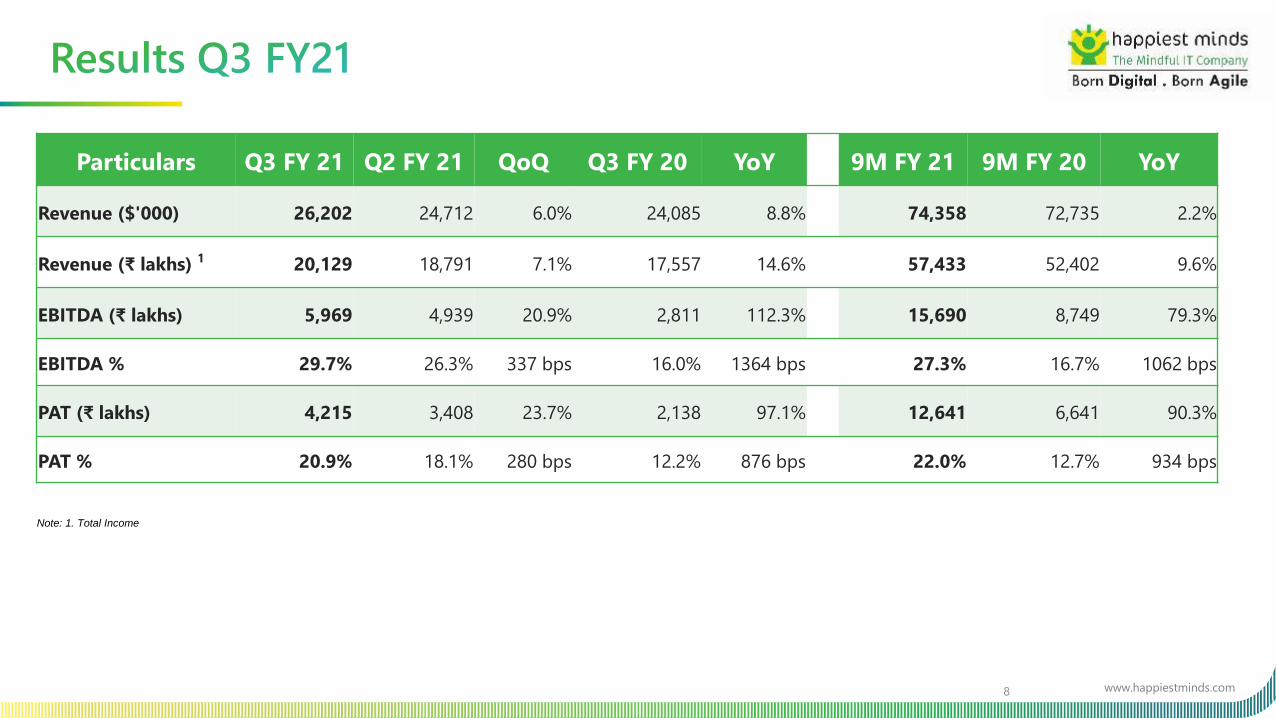
Note: 1. Total Income
Particulars Q3 FY 21 Q2 FY 21 QoQ Q3 FY 20 YoY 9M FY 21 9M FY 20 YoY
Revenue ($'000) 26,202 24,712 6.0% 24,085 8.8% 74,358 72,735 2.2%
Revenue (₹ lakhs) 1 20,129 18,791 7.1% 17,557 14.6% 57,433 52,402 9.6%
EBITDA (₹ lakhs) 5,969 4,939 20.9% 2,811 112.3% 15,690 8,749 79.3%
EBITDA % 29.7% 26.3% 337 bps 16.0% 1364 bps 27.3% 16.7% 1062 bps
PAT (₹ lakhs) 4,215 3,408 23.7% 2,138 97.1% 12,641 6,641 90.3%
PAT % 20.9% 18.1% 280 bps 12.2% 876 bps 22.0% 12.7% 934 bps
www.happiestminds.com9
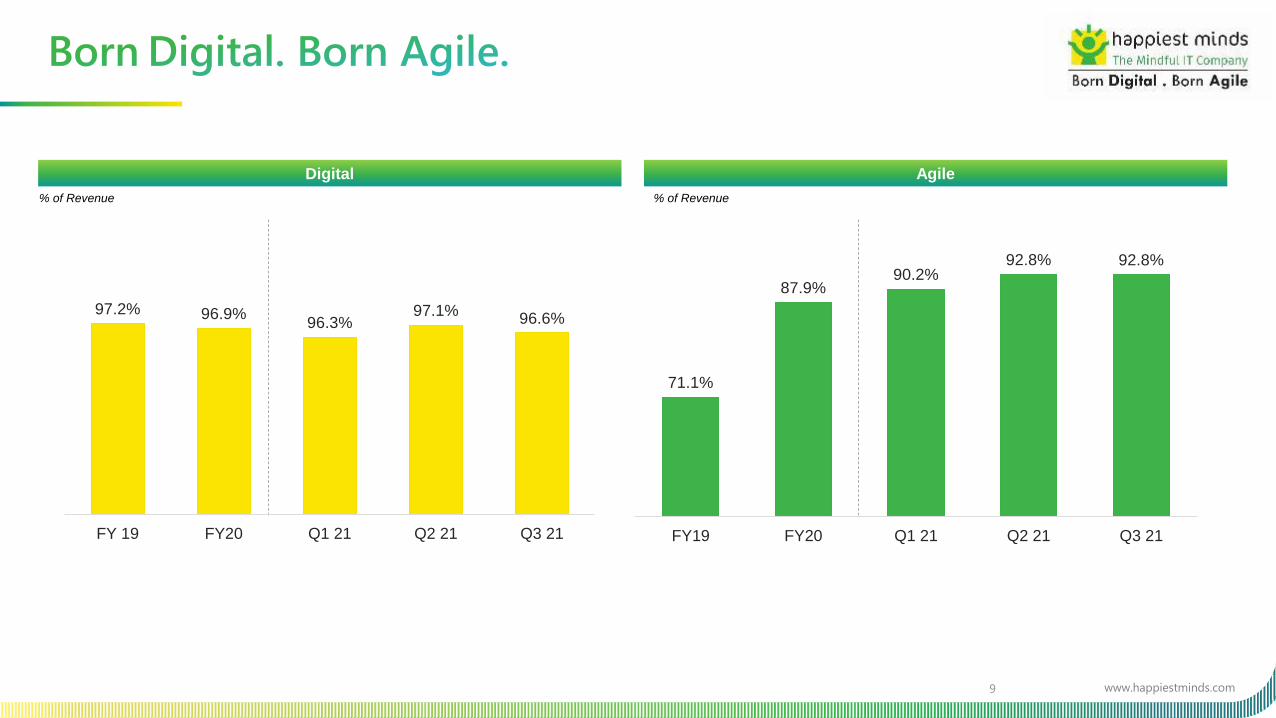
Digital
% of Revenue
Agile
% of Revenue
97.2% 96.9%96.3%
97.1%96.6%
FY 19 FY20 Q1 21 Q2 21 Q3 21
71.1%
87.9%90.2%
92.8% 92.8%
FY19 FY20 Q1 21 Q2 21 Q3 21

www.happiestminds.com10
Total revenue mix (Q3 FY 21)1
Note: 1. Calculated based on total income split, 2. FCF Conversion = FCF/EBITDA and FCF = EBITDA – Capex. 3. Attrition % for TTM Trailing 12 Months
48,912
60,181
71,423
18,699 18,791 20,129
FY18 FY19 FY20 Q1 21 Q2 21 Q3 21
Total Income (₹ Lakhs)
Total Revenue EBITDA
762
6,628
11,312
4,782 4,9395,969
FY18 FY19 FY20 Q1 21 Q2 21 Q3 21
(₹ Lakhs) Margin%
1.6% 11.0% 26.3%15.8% 25.6% 29.7%
649
6,549
11,266
4,772 4,9315,920
FY18 FY19 FY20 Q1 21 Q2 21 Q3 21
(₹ Lakhs) FCF Conversion
High FCF2 conversion
%
85.2% 98.8% 99.6% 99.8% 99.8% 99.2%
Utilization & Happiest Minds, offshore/onsite
4.7% 5.4% 4.6% 4.7% 4.9% 5.0%
95.3% 94.6% 95.4% 95.3% 95.1% 95.0%
FY18 FY19 FY20 Q1 21 Q2 21 Q3 21
Onsite Offshore
Utilization
2,885
%
2,462 2,6662,253 2,658 2,721
77.3% 76.9%68.4% 74.9% 78.7% 81.6% 25.2%
18.7%
16.0%14.1% 13.1%
FY19 FY20 Q1 21 Q2 21 Q3 21
Voluntary Attrition % 3
21.5%
24.8%
49.5%
4.2%
IMSS DBS PES Oth Inc

www.happiestminds.com11Notes: 1. TME: Travel, Media and Entertainment, 2. Based on quarter revenues on an annualized basis. 3. Top 20 includes Top 1, 5 & 10
11
Revenue model
Q3 21
Model Geography Digital Revenue1 Vertical1
(% Revenue)
Revenue Concentration3
(#)
Million $ Customers2
16
21
2523 24 25
FY18 FY19 FY20 Q1 21 Q2 21 Q3 21
77.8%
22.2%
T&M FP
72.2%
10.6%
13.4%3.8%
Americas Europe India ROW
41.0%
21.6%
8.7%
14.4%
11.0%3.4%
Digital Infra / Cloud SAAS
Security Analytics / AI
IoT Others
24.9%
20.2%
2.2%14.4%
17.4%
7.0%
6.9%7.0%
Edu Tech Hitech Retail TME
BFSI Industrial MFG Others
14.8%
34.4%
49.4%
66.5%
Top 1 Top 5 Top 10 Top 20

www.happiestminds.com1212
Onsite/Offshore
By Revenue
Avg. annual revenue / active customer
(USD ‘000)
21.4% 22.0% 22.5% 21.0% 21.9% 19.0%
78.6% 78.0% 77.5% 79.0% 78.1% 81.0%
FY18 FY19 FY20 Q1 21 Q2 21 Q3 21
Onsite Offshore
471 502
615 615 659
683
FY18 FY19 FY20 Q1 21 Q2 21 Q3 21

www.happiestminds.com13
FY18 FY19 FY20 FY21Q1 FY21Q2 FY21 Q3 FY21 9M
Customer Industry group
Edutech 18.0% 21.3% 21.3% 27.0% 27.0% 24.9% 26.3%
Hitech 24.6% 21.0% 21.0% 20.5% 19.5% 20.2% 20.1%
BFSI 17.9% 18.2% 17.5% 17.4% 16.3% 17.4% 17.0%Travel, Media and
Entertainment (TME) 11.0% 13.8% 17.1% 12.9% 13.0% 14.4% 13.5%
Retail 7.0% 6.9% 7.5% 5.7% 4.5% 2.2% 4.1%
Industrial 6.2% 8.1% 7.0% 6.4% 6.9% 7.0% 6.8%
Manufacturing 3.2% 3.8% 3.7% 5.6% 6.8% 6.9% 6.5%
Others 12.3% 6.9% 4.9% 4.6% 6.0% 7.0% 5.9%
Digital Service Offerings
Digital infrastructure/Cloud - 40.9% 31.2% 43.7% 41.1% 41.0% 41.6%
SaaS - 28.6% 29.4% 23.6% 24.6% 21.6% 23.4%
Security solutions - 10.2% 14.9% 7.6% 7.4% 8.7% 7.6%
Analytics/AI - 9.1% 11.6% 12.1% 13.5% 14.4% 13.4%
IoT - 8.4% 9.8% 9.3% 10.5% 11.0% 10.9%
Total - 97.2% 96.9% 96.3% 97.1% 96.6% 96.8%
Automation as a % of total
revenue 20.7% 24.2% 24.3% 27.8% 25.5%

www.happiestminds.com14
FY18 FY19 FY20 FY21Q1 FY21Q2 FY21 Q3 FY21 9M
Location of external customer
USA 73.5% 75.5% 77.5% 77.3% 77.3% 72.2% 75.5%
India 11.7% 11.9% 11.9% 10.9% 10.9% 13.4% 11.8%
Europe 11.4% 9.5% 7.2% 9.8% 9.2% 10.6% 9.9%
ROW 3.4% 3.1% 3.4% 2.0% 2.6% 3.8% 2.9%
Number of customers based on quarter
revenues on an annualized basis (#)
$ 10 M + 1 1 1 1 1 1
$ 5M to $ 10M 2 2 - 1 - 2 2
$ 3M to $ 5M 2 1 9 4 6 5 5
$ 1M to $ 3M 12 17 15 17 17 17 17
Total 16 21 25 23 24 25 25
Revenue mix by delivery
Onsite 21.4% 22.0% 22.5% 21.0% 21.9% 19.0% 20.6%
Offshore 1 78.6% 78.0% 77.5% 79.0% 78.1% 81.0% 79.3%
Revenue by Contract type
Fixed Price 18.4% 16.8% 19.0% 18.8% 19.3% 22.2% 20.7%
Time and Material 81.6% 83.2% 81.0% 81.2% 80.7% 77.8% 79.3%
Active customers
# of active customers 173 163 157 148 152 155 155
Fortune2000 / Forbes200 / Billion $
corporations
# of customers 37 36 39 38 38
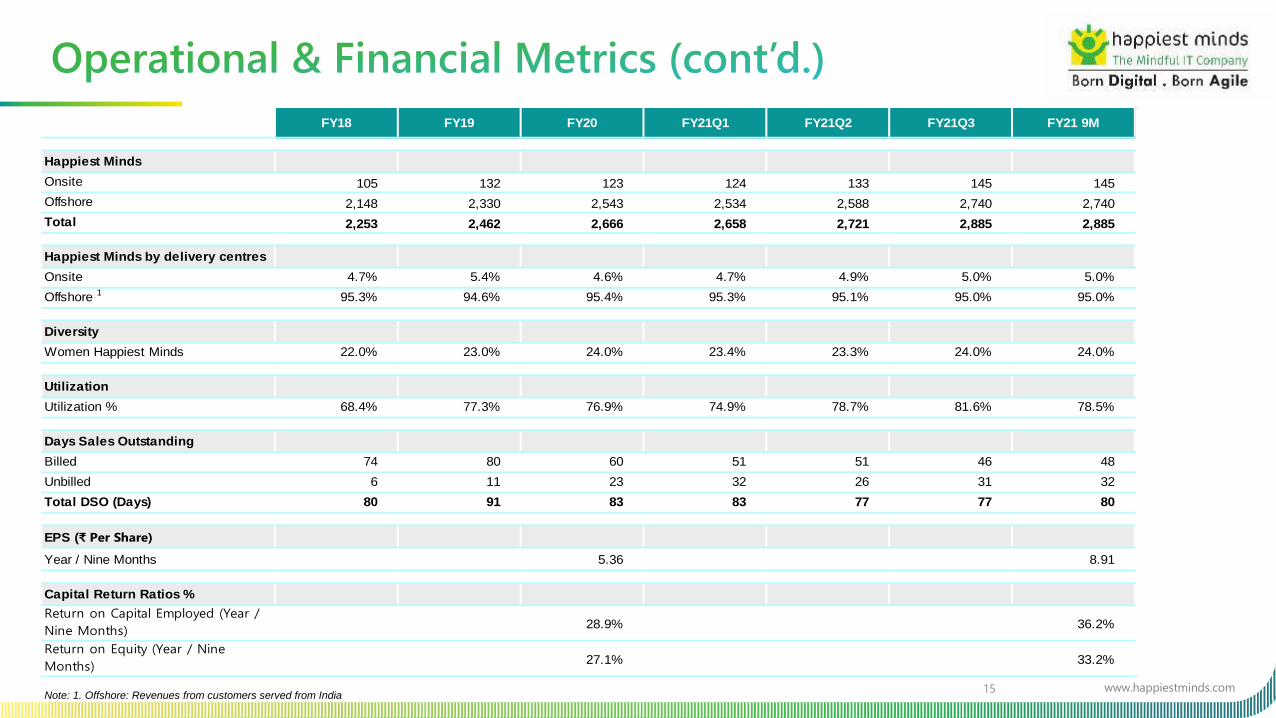
Note: 1. Offshore: Revenues from customers served from India
www.happiestminds.comNote: 1. Offshore: Revenues from customers served from India
15
FY18 FY19 FY20 FY21Q1 FY21Q2 FY21Q3 FY21 9M
Happiest Minds
Onsite 105 132 123 124 133 145 145
Offshore 2,148 2,330 2,543 2,534 2,588 2,740 2,740
Total 2,253 2,462 2,666 2,658 2,721 2,885 2,885
Happiest Minds by delivery centres
Onsite 4.7% 5.4% 4.6% 4.7% 4.9% 5.0% 5.0%
Offshore 1 95.3% 94.6% 95.4% 95.3% 95.1% 95.0% 95.0%
Diversity
Women Happiest Minds 22.0% 23.0% 24.0% 23.4% 23.3% 24.0% 24.0%
Utilization
Utilization % 68.4% 77.3% 76.9% 74.9% 78.7% 81.6% 78.5%
Days Sales Outstanding
Billed 74 80 60 51 51 46 48
Unbilled 6 11 23 32 26 31 32
Total DSO (Days) 80 91 83 83 77 77 80
EPS (₹ Per Share)
Year / Nine Months 5.36 8.91
Capital Return Ratios %
Return on Capital Employed (Year /
Nine Months) 28.9% 36.2%
Return on Equity (Year / Nine
Months)27.1% 33.2%
www.happiestminds.com16
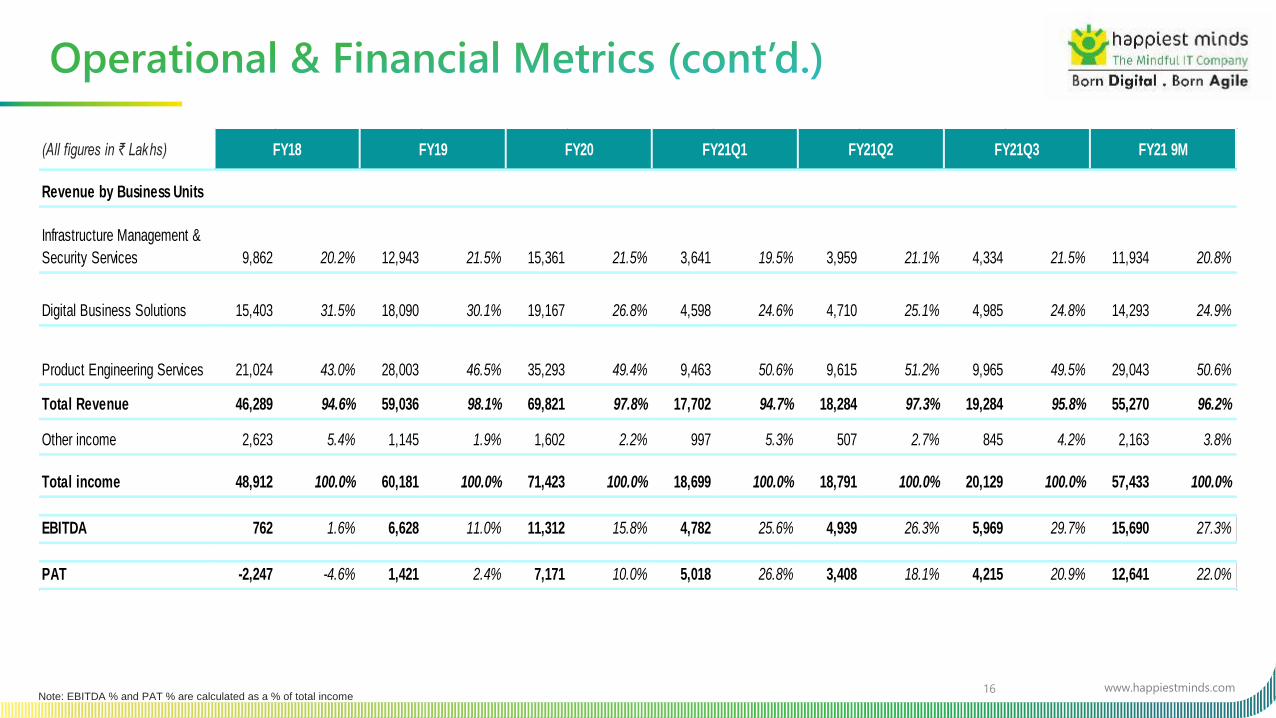
(All figures in ₹ Lakhs)
Revenue by Business Units
Infrastructure Management &
Security Services 9,862 20.2% 12,943 21.5% 15,361 21.5% 3,641 19.5% 3,959 21.1% 4,334 21.5% 11,934 20.8%
Digital Business Solutions 15,403 31.5% 18,090 30.1% 19,167 26.8% 4,598 24.6% 4,710 25.1% 4,985 24.8% 14,293 24.9%
Product Engineering Services 21,024 43.0% 28,003 46.5% 35,293 49.4% 9,463 50.6% 9,615 51.2% 9,965 49.5% 29,043 50.6%
Total Revenue 46,289 94.6% 59,036 98.1% 69,821 97.8% 17,702 94.7% 18,284 97.3% 19,284 95.8% 55,270 96.2%
Other income 2,623 5.4% 1,145 1.9% 1,602 2.2% 997 5.3% 507 2.7% 845 4.2% 2,163 3.8%
Total income 48,912 100.0% 60,181 100.0% 71,423 100.0% 18,699 100.0% 18,791 100.0% 20,129 100.0% 57,433 100.0%
EBITDA 762 1.6% 6,628 11.0% 11,312 15.8% 4,782 25.6% 4,939 26.3% 5,969 29.7% 15,690 27.3%
PAT -2,247 -4.6% 1,421 2.4% 7,171 10.0% 5,018 26.8% 3,408 18.1% 4,215 20.9% 12,641 22.0%
FY21 9MFY21Q3FY18 FY19 FY20 FY21Q1 FY21Q2
Note: EBITDA % and PAT % are calculated as a % of total income

www.happiestminds.com17
Summary Profit & Loss statement
(All figures in ₹ Lakhs) FY18 FY19 FY20 FY21 Q1 FY21 Q2 FY21 Q3 FY21 9M
Income
Operating revenue 46,289 59,036 69,821 17,702 18,284 19,284 55,270
Other income 2,623 1,145 1,602 997 507 845 2,163
Total income 48,912 60,181 71,423 18,699 18,791 20,129 57,433
Cost of revenue 32,652 36,987 42,927 9,978 10,401 11,155 31,534
Gross margin 13,637 22,049 26,894 7,724 7,884 8,129 23,737
% 29.5% 37.3% 38.5% 43.6% 43.1% 42.2% 42.9%
SG&A cost 15,498 16,566 17,184 3,939 3,452 3,005 10,210
EBITDA 762 6,628 11,312 4,782 4,939 5,969 15,690
% 1.6% 11.0% 15.8% 25.6% 26.3% 29.7% 27.3%
Depreciation 2,075 2,478 2,023 512 512 516 1,540
EBIT (1,313) 4,150 9,289 4,270 4,427 5,453 14,150
% -2.7% 6.9% 13.0% 22.8% 23.6% 27.1% 24.6%
Finance cost 995 1,594 802 186 160 126 472
PBT before exceptional items * (2,308) 2,556 8,487 4,084 4,267 5,327 13,678
% -4.7% 4.2% 11.9% 21.8% 22.7% 26.5% 23.8%
Exceptional Items + - 1,258 1,126 - - - -
PBT * (2,308) 1,298 7,361 4,084 4,267 5,327 13,678
% -4.7% 2.2% 10.3% 21.8% 22.7% 26.5% 23.8%
Income tax expense (61) (123) 190 (934) 859 1,112 1,037
PAT * (2,247) 1,421 7,171 5,018 3,408 4,215 12,641
% -4.6% 2.4% 10.0% 26.8% 18.1% 20.9% 22.0%
* PBT before exceptional items, PBT and PAT " for FY18 & FY19 are restated as per IndAs, forming part of our offer documents.
+ Exceptional items for FY19 & FY20 refer to Impairment of Goodwill.

www.happiestminds.com18
Condensed Balance Sheet
(All figures in ₹ Lakhs ) 31.03.2018 31.03.2019 31.03.2020 30.06.2020 30.09.2020 31.12.2020
Assets
Non-current Assets
Property, plant and equipment 264 214 93 77 60 72
Goodwill 2,961 1,736 610 610 611 611
Financial & Other assets 7,685 6,003 5,598 6,266 5,788 5,040
Total non-current assets (A) 10,910 7,953 6,301 6,953 6,459 5,723
Current assets
Financial & Other assets
i. Trade receivable 9,437 12,927 11,487 9,851 10,302 9,765
ii. Cash & Cash equivalents, Investments & Other financial
assets16,928 19,610 31,967 39,196 52,387 54,286
iii. Other assets 1,424 862 1,060 1,308 1,721 1,531
Total current assets (B) 27,789 33,399 44,514 50,355 64,410 65,582
Total assets (A + B) 38,699 41,352 50,815 57,308 70,869 71,305
Equity and Liabilities
Total equity (A) (10,888) (6,605) 26,531 31,901 46,380 50,836
Non-current liabilities
Financial liabilities 5,797 3,814 1,863 1,674 1,518 1,248
Provisions & Deferred tax liability 935 940 1,255 1,508 1,513 1,662
Total non-current liabilities (B) 6,732 4,754 3,118 3,182 3,031 2,910
Current liabilities
Financial & Contract liabilities
i. Trade payable 2,498 2,878 3,442 3,600 6,307 3,781
ii. Others 38,866 38,591 15,947 15,907 12,402 10,931
Provisions & Other current liabilities 1,491 1,734 1,777 2,718 2,749 2,847
Total current liabilities (C) 42,855 43,203 21,166 22,225 21,458 17,559
Total liabilities (D = B + C) 49,587 47,957 24,284 25,407 24,489 20,469
Total equity and liabilities (A + D) 38,699 41,352 50,815 57,308 70,869 71,305

www.happiestminds.com
India | United States | United Kingdom | Canada | Australia | Dubai