Investor Presentation 3Q2016 & 9M2016 Results - … Presentation 3Q2016 & 9M2016 Results ... Concha...
53
Investor Presentation 3Q2016 & 9M2016 Results December 7, 2016
Transcript of Investor Presentation 3Q2016 & 9M2016 Results - … Presentation 3Q2016 & 9M2016 Results ... Concha...

Investor Presentation 3Q2016 & 9M2016 Results
December 7, 2016

Agenda
1. Highlights 3Q2016
2. 3Q2016 review
3. 2016 Accumulated figures
4. What to expect after Brexit?
5. Financial position
6. Drivers of growth
• Higher volumes: 6.5%
• Flat sales: -0.2% – FX negative contribution
• Premiumization: – Exports sales, growth of 11% in volume
(YTD).
– Domestic sales, growth of 13% in volume
(YTD).
• Lower EBITDA: -12.1% Negative FX and Higher Cost of Wine
• Lower Net Income: -14.6%
Highlights: 3Q 2016 vs 3Q 2015
3

Agenda
1. Highlights 3Q2016
2. 3Q2016 Review
3. 2016 Accumulated Figures
4. What to expect after Brexit?
5. Financial Position
6. Drivers of growth

• 2.1 Sales and Volumes
• 2.2 Premiumization
• 2.3 FX Impact
• 2.4 Performance & Results
2. 3Q2016 Review

Consolidated Sales 3Q2016(million Ch$)
6
Vol: +5.4% Px: +1.6%
Vol: +3.6%
Vol: +7.5% Vol: +34.4%
Vol: +10.3%
Px: +6.3% Vol: +20%
-

Consolidated Volumes 3Q2016
7
-0.3%
-90.1%
+20.0%
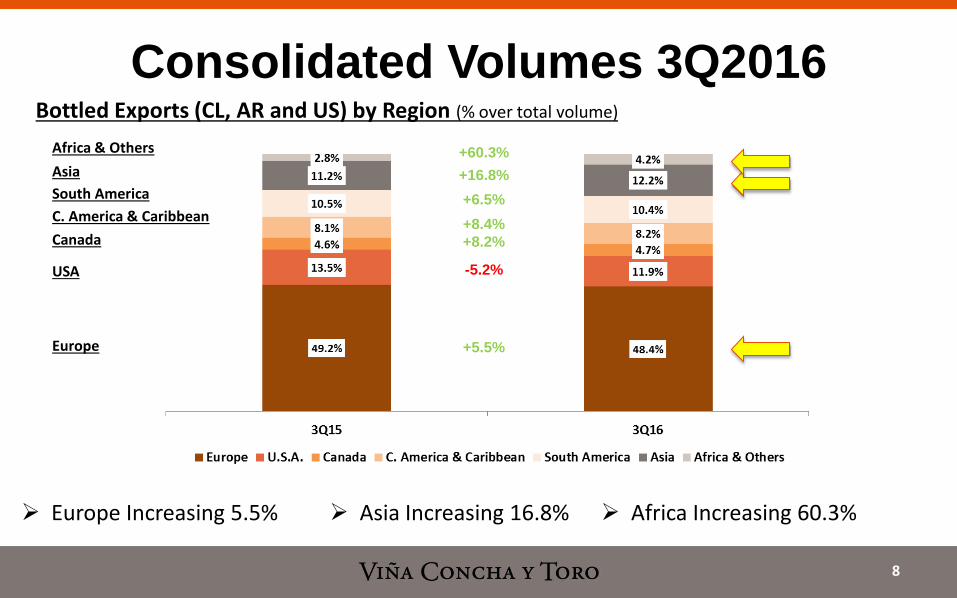
Consolidated Volumes 3Q2016
8
Bottled Exports (CL, AR and US) by Region (% over total volume)
Europe Increasing 5.5% Africa Increasing 60.3% Asia Increasing 16.8%
+5.5%
-5.2%
+8.2%
+6.5%
+60.3%
+8.4%
+16.8%
Europe
USA
Canada
C. America & Caribbean
South America
Asia
Africa & Others
• 2.1 Sales and Volumes
• 2.2 Premiumization
• 2.3 FX Impact
• 2.4 Performance & Results
2. 3Q2016 Review

Premiumization of Sales
10
• Premium Growth: +8.2% in 3Q2016 • Representing
28.5% over total volume 48.9% over total sales
• Growth driven by core brands • Casillero del Diablo • Trivento Reserve • 1000 Stories
Sales in Volume
PREMIUMIZATION 2.1
Sales in Value

Performance Premium Core Brands
11
Casillero del Diablo: +8.4% (Base 100 = 3Q2015, volume)
PREMIUMIZATION 2.1
Trivento Reserve: +22.1% (Base 100 = 3Q2015, volume)

• 2.1 Sales and Volumes
• 2.2 Premiumization
• 2.3 FX Impact
• 2.4 Performance & Results
2. 3Q2016 Review

Foreign Exchange 3Q2016 in Sales
13
Currency % over Sales FX Change (Currency/CLP)
USD 36.8% -2.7%
CLP 19.8% 0%
GBP 17.2% -17.4%
EUR 11.2% -2.5%
BRL 5.4% 5.2%
CAD 3.4% -2.0%
SEK 2.2% -2.6%
MXN 1.9% -14.4%
ARG 1.3% -39.7%
NOK 0.8% -3.4%

• 2.1 Sales and Volumes
• 2.2 Premiumization
• 2.3 FX Impact
• 2.4 Performance & Results
2. 3Q2016 Review

Operating Results 3Q2016
15
Results Impacted by: • Negative impact of FX fluctuations • Higher costs derived from a weak
harvest in 2016
Operating Income
(Million Ch$)
EBITDA
(Million Ch$)
Net Income
(Million Ch$)

Agenda
1. Highlights 3Q2016
2. 3Q2016 Review
3. 2016 Accumulated Figures
4. What to expect after Brexit?
5. Financial Position
6. Drivers of growth

• 3.1 Sales and Volumes
• 3.2 Premiumization
• 3.3 Distribution Strategy
• 3.4 Fetzer Vineyards
• 3.5 FX Impact
• 3.6 Performance & Results
3. 2016 Accumulated Figure

Consolidated Sales 9M2016 (million Ch$)
18
+7.0%

Consolidated Sales 9M2016 (million Ch$)
19
Vol: +6.4% Px: +3.2%
Vol: +12.5%
Vol: +6.8% Vol:
+48.7%
Vol: +11.0% Vol: +24.5% Vol: 5.7%
bottled
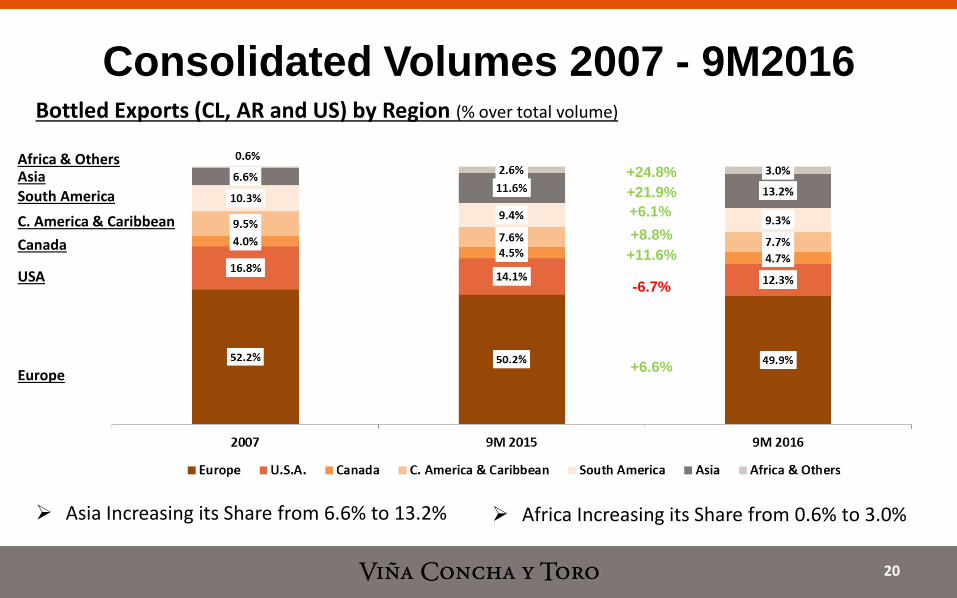
Consolidated Volumes 2007 - 9M2016
20
Bottled Exports (CL, AR and US) by Region (% over total volume)
Asia Increasing its Share from 6.6% to 13.2% Africa Increasing its Share from 0.6% to 3.0%
Europe
USA
Canada
C. America & Caribbean
South America Asia Africa & Others
+6.6%
-6.7%
+11.6%
+6.1%
+24.8%
+8.8%
+21.9%

Asia leading the growth in bottled exports
21
Concha y Toro in Asia (VCT Asia)
In 2010 the Company created a new Commercial Region focus exclusively in Asia.
In 2010 the Company started operations in Singapore through a distribution subsidiary
In 2013 the Company entered in China with a Commercial Office (Shanghai)
In 2014 the Company signed a JV in Japan to explore new brands in the Japanese market
In overall there are 34 people working in Asia

Asia leading the growth in bottled exports
22
Sales VCT Asia (thousand USD) Sales VCT Asia (thousand cases)
Asia duplicated sales in value and volume since the starting of Asian operations in 2010
936 1,248
1,337 1,574
1,835
2,243
2,787

Asia leading the growth in bottled exports
23
98 129
173
236 261
331
413
Premium Sales VCT Asia (thousand cases)
Premium categories growing faster than total sales in Asia

Leading Position over Chilean Bottled Exports
24
** Since 2013, the Company started exporting bulk wine to be bottled in UK ~3.0 million cases per year
Source: Chilean Custom

Top 3 Winery in Volume in the Chilean Domestic Market
25
Source: Nielsen

3. 2016 Accumulated Figure
• 3.1 Sales and Volumes
• 3.2 Premiumization
• 3.3 Distribution Strategy
• 3.4 Fetzer Vineyards
• 3.5 FX Impact
• 3.6 Performance & Results
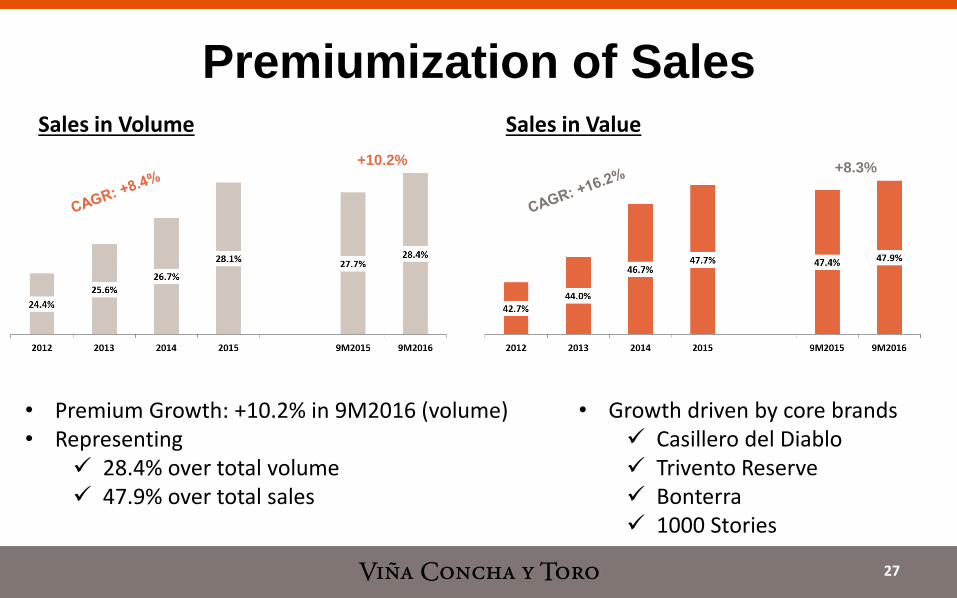
Premiumization of Sales
27
Sales in Volume Sales in Value
• Premium Growth: +10.2% in 9M2016 (volume) • Representing
28.4% over total volume 47.9% over total sales
• Growth driven by core brands Casillero del Diablo Trivento Reserve Bonterra 1000 Stories
+10.2% +8.3%

28
PREMIUMIZATION 2.1
Performance Premium Core Brands
• Casillero del Diablo + 13% in volume YoY
• Trivento Reserve + 36% in volume YoY
• Bonterra + 4% in volume YoY
• 1000 Stories + 407% in volume YoY

29
PREMIUMIZATION 2.1
Total Bonterra’s Sales: +19.2% vs $11 – 11.99 Category at +8.1%
Bonterra Cabernet Sauvignon: +17.8% Bonterra Chardonnay: +28.8% vs just 3.8% category growth at the same price point Bonterra Merlot: The FASTEST growing SKU in the range, +25.6% vs the rest of the
Merlot category +7.2% Bonterra Sauvignon Blanc: +13%
Source: Nielsen 52 weeks to 10/09/16

3. 2016 Accumulated Figure
• 3.1 Sales and Volumes
• 3.2 Premiumization
• 3.3 Distribution Strategy
• 3.4 Fetzer Vineyards
• 3.5 FX Impact
• 3.6 Performance & Results

Distribution Subsidiaries: Driving the Growth
31
Concha y Toro UK: +7% VCT Chile: +6% Trivento Domestic: +25%
Distribution Subsidiaries (bottled sales) 9M 2016 vs 9M 2015
VCT Nordics: +6% VCT MX: +17% Fetzer Domestic: +6%

3. 2016 Accumulated Figure
• 3.1 Sales and Volumes
• 3.2 Premiumization
• 3.3 Distribution Strategy
• 3.4 Fetzer Vineyards
• 3.5 FX Impact
• 3.6 Performance & Results

Fetzer Vineyards – Sales (thousand liters)
33
+5.7%
+7.4%
-89.8%
+24.5%

3. 2016 Accumulated Figure
• 3.1 Sales and Volumes
• 3.2 Premiumization
• 3.3 Distribution Strategy
• 3.4 Fetzer Vineyards
• 3.5 FX Impact
• 3.6 Performance & Results

Foreign Exchange 9M2016 in Sales
35
Currency % over Sales FX Change (Currency/CLP)
USD 35.1% 5.2%
CLP 19.9% 0%
GBP 18.8% -4.1%
EUR 10.6% 5.5%
BRL 5.2% 26.7%
CAD 3.4% 1.2%
SEK 2.6% 6.6%
MXN 2.4% -9.3%
ARG 1.1% -36.0%
NOK 0.9% 0.1%

3. 2016 Accumulated Figure
• 3.1 Sales and Volumes
• 3.2 Premiumization
• 3.3 Distribution Strategy
• 3.4 Fetzer Vineyards
• 3.5 FX Impact
• 3.6 Performance & Results

Operating Results 9M2016
37
EBITDA
(Million Ch$) +7.3%
EBITDA Margin
(% over sales)
*
*Reimbursement of insurance after the earthquake of 2010

Net Income 9M2016 (million Ch$)
38
+7.4%

Agenda
1. Highlights 3Q2016
2. 3Q2016 review
3. 2016 Accumulated figures
4. What to expect after Brexit?
5. Financial position
6. Drivers of growth

Concha y Toro UK
40
• UK market at Glance
• FX scenario across wine producers
• Measures to keep profitability
• Strong positioning of Concha y Toro’s brands in UK

Concha y Toro UK
41
UK market at glance The sixth largest consumer of wine in the world
- 144 million cases per year - Consumption: ~20 liters per capita per year
The UK is not a producer country.
UK is the second importer of wine in the world

Concha y Toro UK
42
• FX scenario across wine producers
GBP Depreciation (Currency/GBP, base 100)
Brexit hit world’s currencies. GBP depreciating against currencies of main producer countries.
UK Wine Category per Origin

Concha y Toro UK
43
• Measures to keep profitability the Company implemented an increase in prices in order to mitigate the impact of
the Pound’s devaluation
the Company has been assessing several initiatives in order to obtain efficiencies in its processes and brand´s investments
• Consumer’s perception and preferences for the Company’s products set a better platform to undergo this complex scenario

Concha y Toro UK
44
• Strong Positioning and Successful Track-Record of Growth
• Milestones: Casillero del Diablo: top 4 selling brand. Top selling cabernet sauvignon Cono Sur: top selling pinot noir Trivento Reserve: top selling malbec
Volume (thousand cases)

Agenda
1. Highlights 3Q2016
2. 3Q2016 review
3. 2016 Accumulated figures
4. What to expect after Brexit?
5. Financial position
6. Drivers of growth

Conservative Capital Structure (As of Sep-16)
Net Financial Debt / Equity
Net Financial Debt / EBITDA (1)
EBITDA (1) / Financial Expenses (1)
Liabilities: Current Liabilities + Non Current Liabilities
Financial Debt: Other current financial liabilities + Other non current financial liabilities -
Derivatives
Net Financial Debt: Other current financial liabilities + Other non current financial liabilities -
Derivatives – Cash and cash equivalents
(1) Last 12 months
Financial expenses excludes financial income
(*) As convenant, the issuer should have a Leverage not higher that 1.4 times. Leverage:
Liabilities / Equity.
(**) As convenant, the issuer should have a EBITDA/Financial expenses ratio at least 2.5 times.
Source: Superintendencia de Valores y Seguros (SVS)
46
2,5(**)
1.2(*)

Agenda
1. Highlights 3Q2016
2. 3Q2016 review
3. 2016 Accumulated figures
4. What to expect after Brexit?
5. Financial position
6. Drivers of growth

Drivers of Growth
Premiumization: +10.2% in volume and +8.3% in value (9M2016)
Distribution Subsidiaries: representing 66.4% of volumes sold
Brand Building: Bonterra awarded as American Winery of the Year by
Wine Enthusiast
Fetzer Vineyards: Bottled sales growing +7.4% in volume (9M2016).
Domestic bottled sales: +5.7% in volume
Export bottled sales: +24.5% in volume
48

Investor Presentation 3Q2016 & 9M2016 Results
December 7, 2016

V. Exhibits
50

Bottled Sales 3Q2016 & 9M2016
51
(1) Export Volumes include exports to third parties and sales volumes of the company's distribution subsidiaries (UK, Nordics, Brazil, Singapore, Mexico). (2) This figure excludes shipments to the company’s distribution subsidiaries. (*) This figure includes bulk wine sales.
51
3Q16 3Q15Change
(%)9M 2016 9M 2015
Change
(%)
20,182 18,844 7.1% 52,359 47,655 9.9%
111,215 113,726 -2.2% 312,033 295,053 5.8%
2,168 1,991 8.9% 5,127 4,497 14.0%
5,678 5,342 6.3% 15,958 13,892 14.9%
15,649 15,582 0.4% 43,084 40,294 6.9%
1,473 1,315 12.0% 4,260 3,717 14.6%
156,365 156,801 -0.3% 432,821 405,107 6.8%
11,447 11,320 1.1% 37,338 33,419 11.7%
1,988 2,086 -4.7% 5,089 5,602 -9.2%
13,435 13,406 0.2% 42,427 39,021 8.7%
169,800 170,206 -0.2% 475,247 444,128 7.0%
3Q16 3Q15Change
(%)9M 2016 9M 2015
Change
(%)
20,006 18,985 5.4% 52,709 49,515 6.4%
58,276 54,209 7.5% 156,983 146,951 6.8%
1,634 1,215 34.4% 5,122 3,444 48.7%
3,075 2,787 10.3% 8,038 7,239 11.0%
4,068 4,430 -8.2% 11,801 12,072 -2.2%
495 412 20.0% 1,388 1,115 24.5%
87,553 82,039 6.7% 236,041 220,336 7.1%
5,763 5,562 3.6% 18,870 16,774 12.5%
5,763 5,562 3.6% 18,870 16,774 12.5%
93,316 87,601 6.5% 254,911 237,110 7.5%
Average Price (per liter) Currency
Chile Domestic Market - wine Ch$ 1,008.8 992.5 1.6% 993.4 962.4 3.2%
Export Markets US$ 2.93 3.13 -6.4% 2.99 3.19 -6.1%
Argentina Domestic US$ 2.01 2.50 -19.8% 1.80 2.16 -16.7%
Argentina Exports US$ 3.09 3.11 -0.5% 3.11 3.20 -2.7%
U.S.A. Domestic US$ 5.84 5.50 6.3% 5.42 5.44 -0.4%
U.S.A. Exports US$ 4.50 4.77 -5.7% 4.54 5.22 -13.1%
Total Other Operating Segment
Total Wine Operating Segment
Total Wine Operating Segment
Total Other Operating Segment
U.S.A. Domestic
Other Revenues
Consolidated Volume
U.S.A. Exports⁽²⁾
Chile Domestic Market - New Business
Total Volume⁽*⁾ (thousand liters)
Chile Domestic Market - wine
Export markets⁽¹⁾
Argentina Domestic
Argentina Exports⁽²⁾
Consolidated Sales
Total Sales⁽*⁾ (in Ch$ million)
Chile Domestic Market - wine
Chile Domestic Market - new business
Export markets⁽¹⁾
Argentina Domestic
Argentina Exports⁽²⁾
U.S.A. Domestic
U.S.A. Exports⁽²⁾

Chilean Harvest through years
52
Historical Harvest Volume (million liters)
52

Significant shift in Chilean bulk wine price curve
53
Chilean Bulk Wine Price (Cabernet Sauvignon, Maule Valley)
53