Investor Presentation - parauco.com · - 1 - 1 investor presentation february 2017 contacts sarah...
38
Investor Presentation FEBRUARY 2017 CONTACTS SARAH INMON (HEAD OF INVESTOR RELATIONS) | EDUARDO PEREZ MARCHANT (CORPORATE FINANCE MANAGER) TEL: (562) 22990510 | EMAIL: [email protected]
Transcript of Investor Presentation - parauco.com · - 1 - 1 investor presentation february 2017 contacts sarah...

- 1 -
1
Investor PresentationFEBRUARY 2017
CONTACTS
SARAH INMON (HEAD OF INVESTOR RELATIONS) | EDUARDO PEREZ MARCHANT (CORPORATE FINANCE MANAGER)
TEL: (562) 22990510 | EMAIL: [email protected]

- 2 -
2
disclaimer
2
This document has been prepared by Parque Arauco for the purpose of providing general infor-
mation about the Company. The Company assumes no responsibility for, or makes any represen-
tation or warranty, express or implied, with respect to, the accuracy, adequacy or completeness
of the information contained herein. The Company expressly disclaims any liability based on such
information, errors therein or omissions therefrom.
This presentation includes certain statements, estimates and forecasts provided by the Company
with respect to it’s anticipated future performance and involves significant elements or subjec-
tive judgment and analysis that may or may not prove to be accurate or correct. There can be no
assurance that these statements, estimates and forecasts will be attained and actual outcomes
and results may differ materially from what is estimated or forecast herein.
The information contained herein has been prepared to assist interested parties in making their
own evaluation of the company and does not purport to be all - inclusive or to contain all the infor-
mation that a potential counterparty may desire. In all cases, interested parties should conduct
their own independent investigation and analysis of the Company. Interested parties can only
rely on the result of their own investigation and the representations and warranties made in any
definitive agreement that may be executed.

- 3 -
3
INTRODUCTION
OUR OPERATIONS
INVESTMENT HIGHLIGHTS
FUTURE DEVELOPMENTS

Source: Parque Arauco(1) Does not include Marina Arauco nor Mall Center Curicó (2) Revenues from January 2016- December 2016. Exchange rate: US$= CLP 676.74(3) Source: Bloomberg
parque arauco OPERATIONAL METRICS BY COUNTRY
OPERATIONAL METRICS BY FORMAT
Shareholder structure (December 2016)
46.5% Chile
62.1% Chile
Colombia14.6%
Colombia7.0%
Peru30.9%
Peru38.9%
Parque Arauco is the third largest shopping center operator in Chile , the second largest Peru, and the fourth largest in Colombia.
Total GLA (m2)1 454,000 380,000 143,000 977,000
Owned GLA 383,108 270,000 124,775 777,883
Revenues 2016 (US$MM)2 147 73 17 237
# of Operations 26 18 3 46
TOTAL GLA1
977,000 m2
TOTALREVENUES2
US$MM 237
INTRODUCTION
Parque Arauco at a glance
MARKET CAP3
US$MM 2,020
24% Foreign
investment Funds
22% Local brokers
2% Local Mutual
Funds
5% Others
26% Controlling Group
5% Said Yarur Family
3% Abumohor Family
13% Local pension Funds
Indicator/ Country CHILE PERU COLOMBIA TOTAL
Daily Traded Volume 2016: US$MM 1.885.5%
Regional
Outlet5.2%
Strip center4.0%
Neighborhood5.3%
TOTAL REVENUES2
US$MM 23779.9%
Regional
Outlet6.2%
Strip center4.0%
Neighborhood9.9%
TOTAL GLA1
977,000 m2

- 5 -
5
INTRODUCTION
In the last five years Parque Arauco has doubled GLA, revenues
and EBITDA
GLA(1) m2
Revenues(1) US$ MM EBITDA(1) US$ MM
+2.0X
+1.9X +1.8X
Source: Parque Arauco. Exchange Rate: US$= 676,74(1) Does not include Marina Arauco nor Mall Center Curicó nor Mall Costa Pacífico in Coronel.
1982 Parque Arauco Kennedy opens as first shopping center in Chile1993 Arauco Maipu inaugurates in Santiago1995 Parque Arauco S.A. IPO1997 Inauguration of Marina Arauco in Viña del Mar, Chile2006 Parque Arauco expands into Peru with the purchase of a 45% stake in MegaPlaza Norte in Lima2008 Parque Arauco acquires Arauco Estación in Santiago, Chile2010 Parque Arauco opens first mall in Colombia, Parque Arboleda in Pereira2011 Capital increase for US$145 MM2012 Parque Arauco enters outlet format in Chile by acquiring Arauco Premium Outlet Buenaventura2014 Capital increase for US$182 MM2015 Purchase of minority shareholders in Colombia and Peru2016 Capital increase for US$100 MM
2011 2012 2013 20152014 2016
479,200 559,700693,100
728,500 818,500947,000
2011 2012 2013 20152014 2016
127 137158
185 215237
2011 2012 2013 20152014 2016
91 96109
126 148163
6
9%
Real Cap Rate(1) Real WACC (2) Spread Over Real WACC
6%
3%
Source: Parque Arauco (1) Real caprate is the yield on cost rate averaged by amount invested and considers the following properties: Arauco Express Calama, Arauco Express Ciudad Empresarial I, Arauco Express Colón, Arauco Express Huechuraba, Arauco Express Irarrázaval, Arauco Express Las Brujas, Arauco Express Luis Pasteur, Arauco Express Manuel Montt, Arauco Express Palmares, Arauco Premium Outlet Buenaventura, Arauco Premium Outlet Curauma, Arauco Premium Outlet San Pedro, Arauco Premium Outlet Coqumbo, Arauco Quilicura, MegaPlaza Chimbote, MegaPlaza Express Villa El Salvador, MegaPlaza Express Chincha, InOutlet Faucett, Viamix Chorrillos, Viamix Las Malvinas, InOutlet Premium Lurín, MegaPlaza Cañete, MegaPlaza Express Barranca, MegaPlaza Pisco, El Quinde Cajamarca, El Quinde Ica, Plaza Jesús María, Parque Caracolí.(2) Weighted Average Cost of Capital
INTRODUCTION
The spread over the cost of capital of our last projects is
approximately 3%

- 7 -
7
Total Return1, last 15 yearsAnnualized, local currency
Total Return1, last 5 yearsAnnualized, local currency
INTRODUCTION
Total Return
Parque Arauco’s value creation is proven by the fact that it has had one of the highest “Total
Return” of the real estate sector in the last years
Kepl
ierr
e
Keplierre
Gen
eral
Gro
wth
General Growth
Sim
on
Simon
S&P
500
S&P 500
Ham
mer
son
HammersonIgua
tem
i
Uni
bail
Mac
eric
h
Macerich
Fibr
a U
no
Fala
bella
Falabella
Parq
ue A
rauc
o
Parque Arauco
Mul
tipla
n
Taub
man
Taubman
Intu
Intu
Intu
Alia
nsce
BR M
alls
IPSA IPSA
Cenc
osud
17%18%
18%
18%
16%
13%
13%
10%
9%
8%
7%
3%
11%
14%
7%
16%
10%
13%
3%
16%
10%
14%
4%
15%
8%
12%
1%-7%
Source: Bloomberg(1) Total return includes dividends as of December 31,2016.
-2%

INTRODUCTION
Revenue type and contract duration
CONTRACT LENGTH (BASED ON º/º OF revenues)
FIXED VS VARIABLE RENTAL REVENUES as of December 30, 2016
41%
10%
10%
39% 100%
‹2 YEARS 2-3 YEARS 3-4 YEARS ›4 YEARS TOTAL
Variable Revenues15%
85% Fixed Revenues
OUR RENTAL REVENUES ARE DERIVED PRIMARILY FROM FIXED CONTRACTS AND ARE PROTECTED AGAINST INFLATION
39º/º OF OUR CONTRACTS HAVE A DURATION OF MORE THAN 4 YEARS AND THE AVERAGE LENGTH IS 6.5 YEARS
Other Revenues15%
85% Rental Revenues

- 9 -
9
INTRODUCTION
OUR OPERATIONS
INVESTMENT HIGHLIGHTS
FUTURE DEVELOPMENTS

- 10 -
10
MEGAPLAZA NORTE - PERÚ
LARCOMAR - PERÚ
LA COLINA- COLOMBIA
PARQUE ARAUCO KENNEDY - CHILE ARAUCO MAIPÚ - CHILE
ARAUCO ESTACIÓN - CHILE
OUR OPERATIONS
PortfolioParque Arauco has iconic and dominant shopping centers in Chile, Peru and Colombia

- 11 -
11
OUR OPERATIONS
Portfolio
Parque arauco is concentrated in Santiago and Lima, which makes the company a “market specialist” in these cities
Source: Parque Arauco(1) Santiago represents 90% of the NOI of Chile and Lima represents 65% of the NOI of Peru.NOI: Net Operating Income: Ingresos ordinarios + Costo de ventas + Gastos de Administración - Depreciación y Amortización + NOI Empresas relacionadas
San Antonio
Chillán
Concepción
Maipú
Kennedy
Buenaventura Outlet
Estación Central
Quilicura
Santiago
Antofagasta
Coquimbo
Lima
Cañete
Arequipa
Pisco
Villa El SalvadorVilla Chorrillos
Larcomar
MegaPlaza Norte
InOutlet Faucett
Cajamarca
InOutlet PremiumLurín
Plaza Jesús María
SANTIAGO1: 58% DEL NOI DE PARQUE ARAUCO LIMA1: 19% DEL NOI DE PARQUE ARAUCO

- 12 -
12
OUR OPERATIONS
Portfolio
Parque Arauco has 6 regional shopping centers, 4 outlets and 14 strip centers in Chile. the average age of the portfolio is 17 years.
Parque Arauco Kennedy 113,500 100% 113,500 98.6% 1982
Arauco Maipú 73,500 100% 73,500 99.0% 1993
Arauco Chillán 32,000 100% 32,000 100.0% 2007
Arauco Estación 66,500 83% 55,195 97.4% 2008
Arauco San Antonio 28,500 51% 14,535 94.2% 2009
Arauco Express 33,000 53% 17,378 84.9% 2012
Arauco Premium Outlets(1) 45,000 100% 45,000 92.4% 2012
Arauco Quilicura 32,000 100% 32,000 99.8% 2013
Mall Costa Pacífico 30,000 100% 30,000 N/A 2017
Total Chile 454,000 84% 413,108 96.7%
Year of
incorporationOccupancy% OwnershipGLA (m2)
Owned GLA (m2)
Source: Parque Arauco(1) Arauco Premium Outlet has four outlets located in Santiago, Concepción, Coquimbo and Curauma. (2) Arauco Express has 14 Stripcenters in Chile: 11 strip centers in Santiago, 1 in Viña del Mar, 1 in Calama, and 1 in Antofagasta.
San Antonio
Chillán
Concepción
Maipú
Kennedy
Buenaventura Outlet
Estación Central
Quilicura
Santiago
Chile
Antofagasta
Coquimbo
- 13 -
13
OUR OPERATIONS
Portfolio
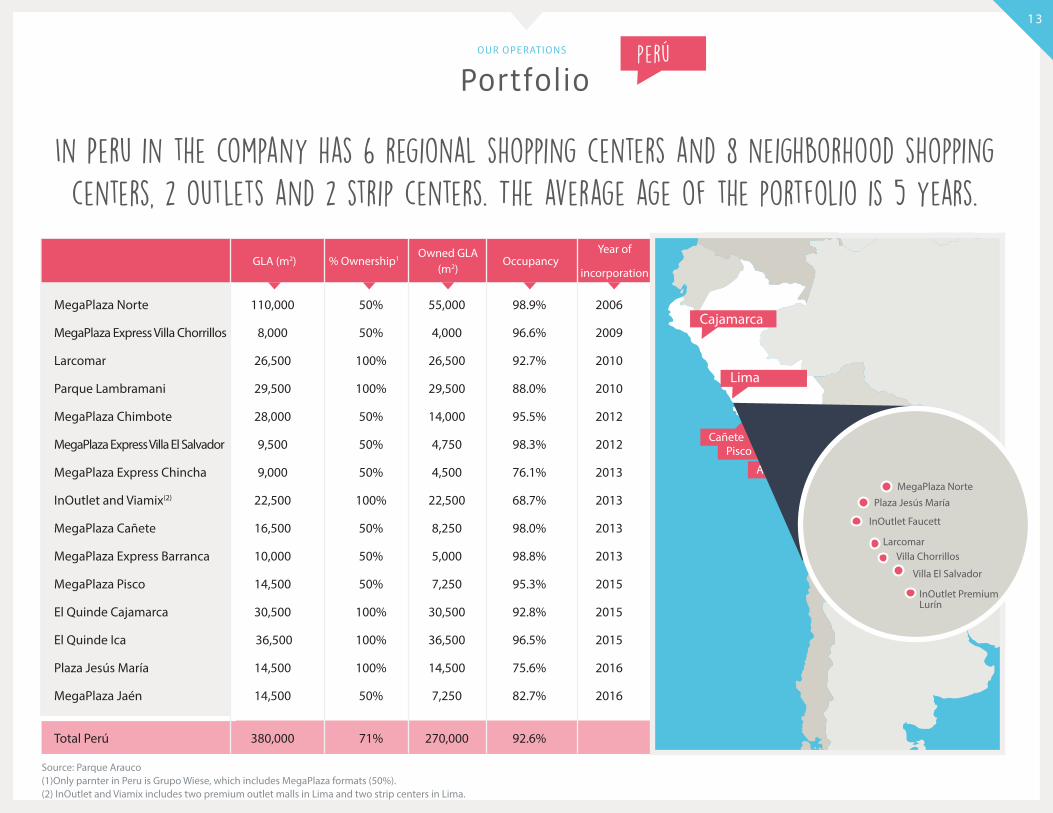
In Peru in the company has 6 regional shopping centers and 8 neighborhood shopping centers, 2 outlets and 2 strip centers. The average age of the portfolio is 5 years.
perú
MegaPlaza Norte 110,000 50% 55,000 98.9% 2006
MegaPlaza Express Villa Chorrillos 8,000 50% 4,000 96.6% 2009
Larcomar 26,500 100% 26,500 92.7% 2010
Parque Lambramani 29,500 100% 29,500 88.0% 2010
MegaPlaza Chimbote 28,000 50% 14,000 95.5% 2012
MegaPlaza Express Villa El Salvador 9,500 50% 4,750 98.3% 2012
MegaPlaza Express Chincha 9,000 50% 4,500 76.1% 2013
InOutlet and Viamix(2) 22,500 100% 22,500 68.7% 2013
MegaPlaza Cañete 16,500 50% 8,250 98.0% 2013
MegaPlaza Express Barranca 10,000 50% 5,000 98.8% 2013
MegaPlaza Pisco 14,500 50% 7,250 95.3% 2015
El Quinde Cajamarca 30,500 100% 30,500 92.8% 2015
El Quinde Ica 36,500 100% 36,500 96.5% 2015
Plaza Jesús María 14,500 100% 14,500 75.6% 2016
MegaPlaza Jaén 14,500 50% 7,250 82.7% 2016
Total Perú 380,000 71% 270,000 92.6%
Year of
incorporationOccupancy% Ownership1GLA (m2)
Owned GLA (m2)
Source: Parque Arauco(1)Only parnter in Peru is Grupo Wiese, which includes MegaPlaza formats (50%).(2) InOutlet and Viamix includes two premium outlet malls in Lima and two strip centers in Lima.
Ica
Lima
Cañete
Arequipa
Pisco
Villa El Salvador
Villa ChorrillosLarcomar
MegaPlaza Norte
InOutlet Faucett
Cajamarca
InOutlet Premium Lurín
Plaza Jesús María

- 14 -
14
OUR OPERATIONS
Portfolio
Parque Arauco has 3 regional shopping centers in Colombia and the average age of the portfolio is 3 years
COLOMBIA
Parque Arboleda 40,500 55% 22,275 95.7% 2010
Parque Caracoli 38,500 100% 38,500 88.4% 2013
Parque La Colina 64,000 100% 64,000 N/A 2016
Total Colombia 143,000 87% 124,775 91.6%
Bucamaranga
Pereira
Year of
incorporationOccupancy % OwnershipGLA (m2)
Owned GLA (m2)
Source: Parque Arauco
Bogotá

- 15 -
15
INTRODUCTION
OUR OPERATIONS
INVESTMENT HIGHLIGHTS
FUTURE DEVELOPMENTS

- 16 -
16
1.Strong results in a challenging macroeconomic environment.
2.Stable and diversified revenues
4.Solid corporate governance and increased concern with
sustainability
6.Important growth
opportunities.
3.Strong commercial relationships with local and global businesses.
5.Conservative debt
structure and outstanding financial performance.
investment highlights
- 17 -
17
STRONG RESULTS IN A CHALLENGING MACROECONOMIC ENVIRONMENT
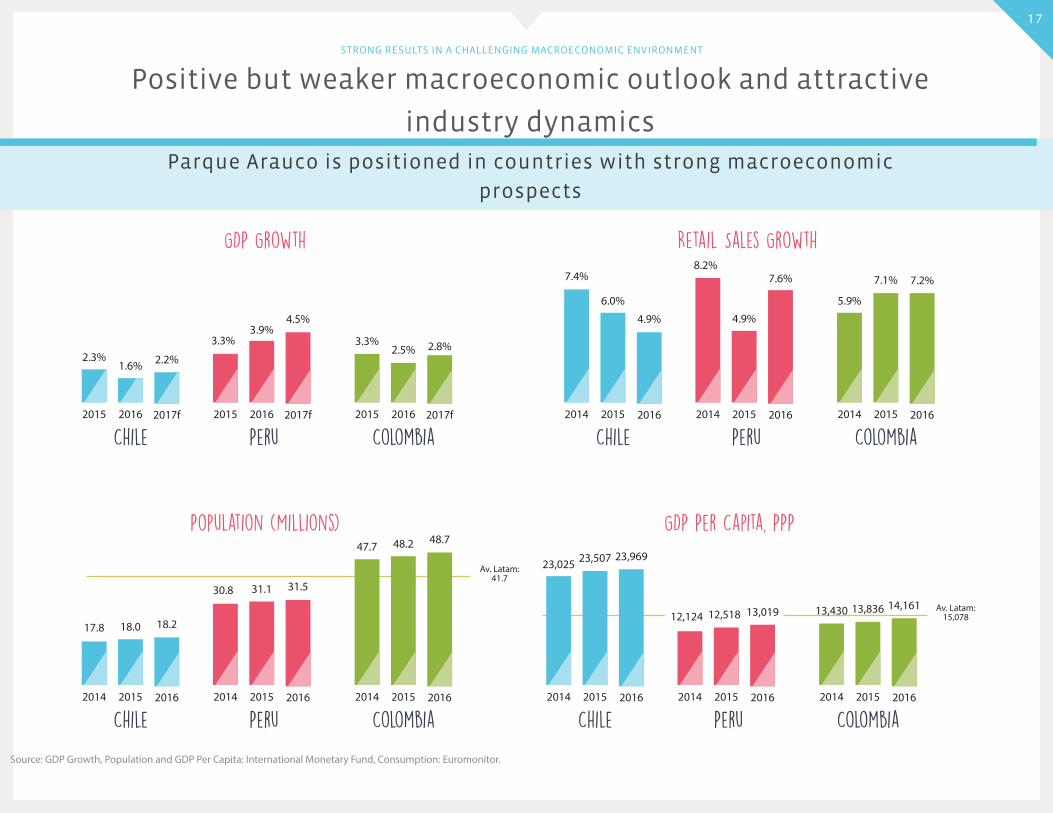
Positive but weaker macroeconomic outlook and attractive
industry dynamicsParque Arauco is positioned in countries with strong macroeconomic
prospects
GDP Growth
Chile2015
2.3%
2016
1.6%
2017f
2.2%
Peru2015
3.3%
2016
3.9%
2017f
4.5%
Colombia2015
3.3%
2016
2.5%
2017f
2.8%
Retail Sales Growth
Chile2014
7.4%
2015
6.0%
2016
4.9%
Peru2014
8.2%
2015
4.9%
2016
7.6%
Colombia2014
5.9%
2015
7.1%
2016
7.2%
Population (Millions)
Chile2014
17.8
2015
18.0
2016
18.2
Peru2014
30.8
2015
31.1
2016
31.5
Colombia2014
47.7
2015
48.2
2016
48.7GDP Per Capita, PPP
Chile2014
23,025
2015
23,507
2016
23,969
Peru2014
12,124
2015
12,518
2016
13,019
Colombia2014
13,430
2015
13,836
2016
14,161 Av. Latam:15,078
Av. Latam:41.7
Source: GDP Growth, Population and GDP Per Capita: International Monetary Fund, Consumption: Euromonitor.

- 18 -
18
STRONG RESULTS IN A CHALLENGING MACROECONOMIC ENVIRONMENT
Results have been positive in all three countries
1Q1
Chile
Tenant sales2 Revenues2 NOI2
PERU
COLOMBIA
940,4881,024,996
+9.0%
2,577,2022,749,836
+6.7%
349,727 376,439
+7.6%
91,47999,417
217,877
244,318
+12.1%
40,61444,446
+9.4%
80,80288,850
+10.0%
163,124189,124
+16.4%
29,080 33,346
+14.7%
(1) GLA in Chile does not include Mall Costa Pacífico.(2) Chile in MMCLP, Peru in MSoles and Colombia in MMCOP. (2) Not including overhead expenses (Corporate headquarters, regional Services Center, Chile Division, Peru Division and Colombia Division)
2015
409,500 424,000
+3.5%
GLA1
337,500 380,000
+12.6%
71,500143,000
+100.0%
+8.7%
2016 2015 2016 2015 2016 2015 2016
2015 2016 2015 2016 2015 2016 2015 2016
2015 2016 2015 2016 2015 2016 2015 2016

- 19 -
19
Strong Same Store Growth and a Healthy Occupancy Cost
1) Peru’s Same Store Sales and Same Store Rent in 4Q16 do not include Larcomar due to contingencies.
CHILE SAME STORE SALES / CH %
3Q16
7.2
4Q15
5.5
1Q16
7.7
2Q16
4.1
4Q16
2.6
PERU SAME STORE SALES1 / CH %
3Q16
2.0
4Q15
2.2
1Q16
6.8
2Q16
1.6
4Q16
0.4
COLOMBIA SAME STORE SALES / CH %
3Q16
5.7
4Q15
8.6
1Q16
11.5
2Q16
9.2
4Q16
8.3
CHILE SAME STORE RENT / CH %
3Q16
6.2
4Q15
6.8
1Q16
5.8
2Q16
4.3
4Q16
2.7
PERU SAME STORE RENT1 / CH %
3Q16
5.8
4Q15
3.0
1Q16
9.3
2Q16
3.8
4Q16
4.6
COLOMBIA SAME STORE RENT / CH %
3Q16
5.3
4Q15
12.5
1Q16
11.2
2Q16
8.4
4Q16
5.5
CHILE OCCUPANCY COST
4Q15
10.1%
4Q16
10.0%54%
Others
46%Anchor Stores
PERU OCCUPANCY COST
4Q15
7.2%
4Q16
6.7%
36%Others
64%Anchor Stores
COLOMBIA OCCUPANCY COST
4Q15
9.6%
4Q16
9.2%
69%Others
31%Anchor Stores
STABLE AND DIVERSIFIED REVENUES

- 20 -
20
socio-economic level diversification (º/º revenues)
Country level diversification (º/º revenues) Format level Diversification (º/º revenues)
42
48 10 100
Medium to HighIncome: Includes
ABC1 and C2 in Chile, A and B in Peru and 6, 5 and 4 in Colombia
Medium Income:Includes C3 and D in
Chile, C and D in Peru and 3 in
Colombia
Medium to LowIncome: Includes
E in Chile and Peru and 2 and 1 in
Colombia
Source: Parque Arauco. Based on socio-economic composition of community in which malls are located.
62.1% Chile
7.0% Colombia
30.9% Peru
STABLE AND DIVERSIFIED REVENUES
Parque Arauco diversifies its market risks at a
country, format, and socio-economic level
85.5% Regional
Outlet5.2%
Strip center4.0%
Neighborhood5.3%

- 21 -
21
STABLE AND DIVERSIFIED REVENUES
With a 39% market share in Chile, Parque Arauco
is the market leader in the outlet format in the Andean region
Arauco Premium Outlet Curauma, Chile InOutlet Faucett, Perú
Arauco Premium Outlet Buenaventura, Chile Arauco Premium Outlet Concepción, Chile
InOutlet Premium Outlet Lurin, Perú Arauco Premium Outlet Coquimbo, Chile
Outlets currently in our portfolio
Keys to the Premium Outlet Format
(1) LocationLocated near main cities
(2) BrandsPremium name-brands
(3) DiscountsMore than 30% discount
- 22 -
22
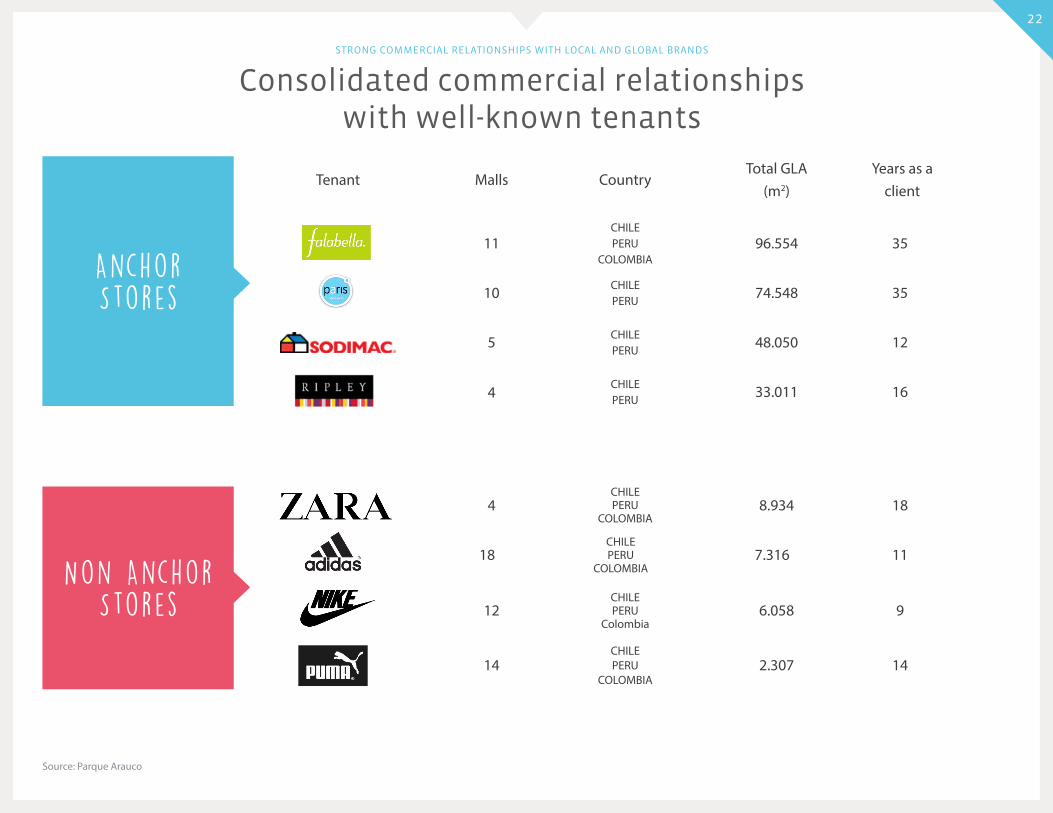
Anchor Stores
Non AnchorStores
Tenant Malls
11
4
10
5
12
Years as a client
35
16
35
12
9
Total GLA(m2)
96.554
33.011
74.548
48.050
6.058
Country
CHILEPERU
COLOMBIA
CHILEPERU
CHILEPERU
CHILEPERU
CHILEPERU
Colombia
18 117.316CHILEPERU
COLOMBIA
4 188.934CHILEPERU
COLOMBIA
14 142.307CHILEPERU
COLOMBIA
Source: Parque Arauco
STRONG COMMERCIAL RELATIONSHIPS WITH LOCAL AND GLOBAL BRANDS
Consolidated commercial relationships with well-known tenants
- 23 -
23
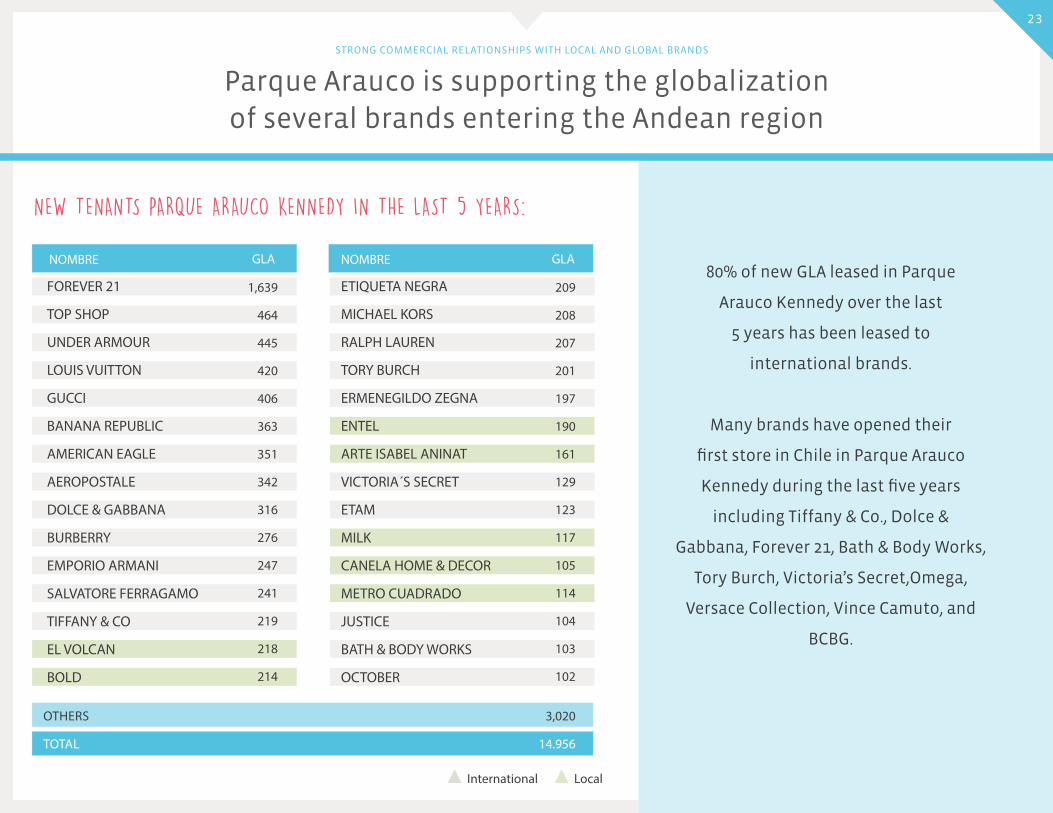
NEW TENANTS PARQUE ARAUCO KENNEDY IN THE LAST 5 YEARS:
80% of new GLA leased in Parque
Arauco Kennedy over the last
5 years has been leased to
international brands.
Many brands have opened their
first store in Chile in Parque Arauco
Kennedy during the last five years
including Tiffany & Co., Dolce &
Gabbana, Forever 21, Bath & Body Works,
Tory Burch, Victoria’s Secret,Omega,
Versace Collection, Vince Camuto, and
BCBG.
OTHERS
TOTAL
3,020
14.956
GLA GLANOMBRE NOMBRE
FOREVER 21
TOP SHOP
UNDER ARMOUR
LOUIS VUITTON
GUCCI
BANANA REPUBLIC
AMERICAN EAGLE
AEROPOSTALE
DOLCE & GABBANA
BURBERRY
EMPORIO ARMANI
SALVATORE FERRAGAMO
TIFFANY & CO
EL VOLCAN
BOLD
ETIQUETA NEGRA
MICHAEL KORS
RALPH LAUREN
TORY BURCH
ERMENEGILDO ZEGNA
ENTEL
ARTE ISABEL ANINAT
VICTORIA´S SECRET
ETAM
MILK
CANELA HOME & DECOR
METRO CUADRADO
JUSTICE
BATH & BODY WORKS
OCTOBER
1,639
464
445
420
406
363
351
342
316
276
247
241
219
218
214
209
208
207
201
197
190
161
129
123
117
105
114
104
103
102
STRONG COMMERCIAL RELATIONSHIPS WITH LOCAL AND GLOBAL BRANDS
Parque Arauco is supporting the globalization of several brands entering the Andean region
International Local
- 24 -
24
workplace Recognition
Investor Relations recognition
Management recognition
Sustainability REcognition
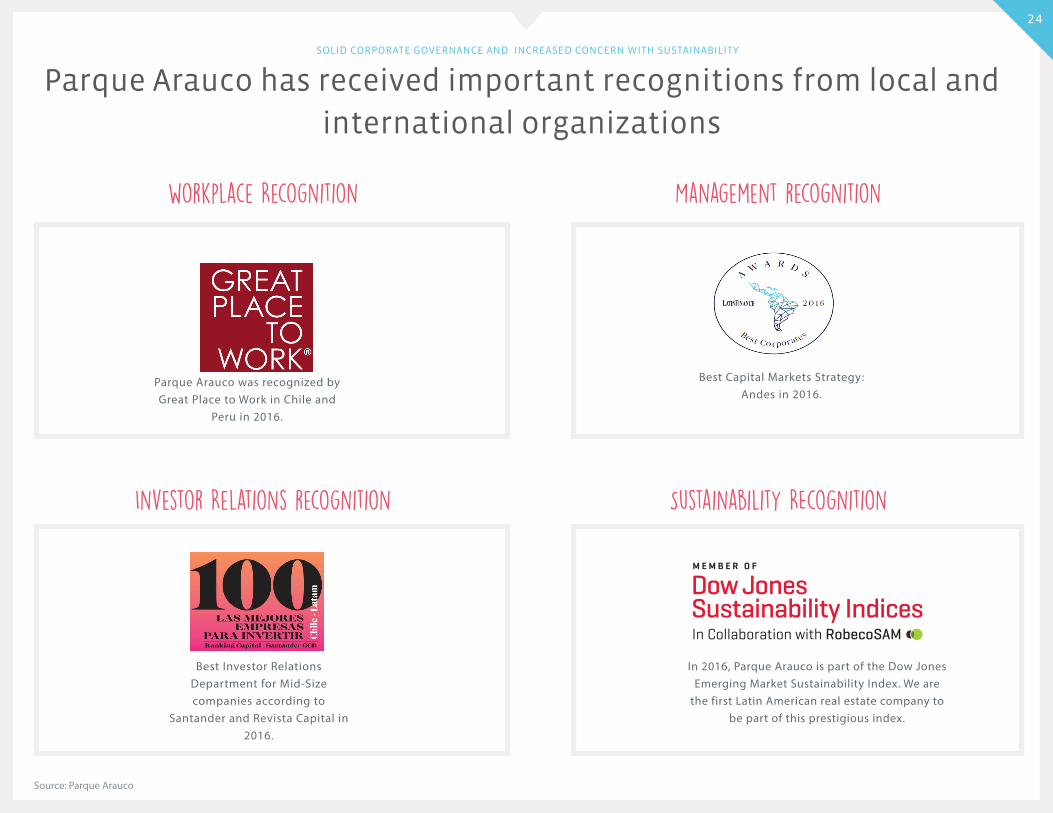
Best Capital Markets Strategy: Andes in 2016.
In 2016, Parque Arauco is part of the Dow Jones Emerging Market Sustainability Index. We are
the first Latin American real estate company to be part of this prestigious index.
Best Investor Relations Department for Mid-Size companies according to
Santander and Revista Capital in 2016.
Source: Parque Arauco
SOLID CORPORATE GOVERNANCE AND INCREASED CONCERN WITH SUSTAINABILITY
Parque Arauco has received important recognitions from local and
international organizations
Parque Arauco was recognized by Great Place to Work in Chile and
Peru in 2016.

- 25 -
25
Source: Parque Arauco
SOLID CORPORATE GOVERNANCE AND INCREASED CONCERN WITH SUSTAINABILITY
In the last year we have continued advancing on our sustainability strategy
ESG workstreams
soc ial
• Communication with neighboring communities: Community relations strategy advancement
• Cultural activities: Hosting cultural activities in our malls
• Social spaces: Providing spaces to social organizations
• Donations: Definition of corporate donation policy
Envi ronment
• Baseline measurement: Environmental assessment and definition of baseline carbon emissions in Chile, Peru and Colombia
• Sustainable Construction: Sustainable building criteria applied in InOutlet Lurín in Peru and Parque La Colina in Colombia
• Environmentally friendly operation: Environmental experts visited assets in Chile, Peru and Colombia, providing a diagnostic report and improvement recommendations
Corporate governance
• Talent attraction: Attract and retain talent through working conditions
• Risk management: Creation of a risk executive committee to identify, evaluate and manage risks
• Ethical behavior: Important ethical behavior campaign, including virtual games with ethical dilemmas in Chile, Peru and Colombia

- 26 -
26
2011 2012 2013 20152014 3Q16
0.87x0.78x
0.89x0.81x
1.15x 1.18x
< 1.40x
2011 2012 2013 20152014 2016
3.84x3.42x
3.89x
3.31x 3.33x3.04x
2011
2011
2012
2012
2013
2013
2015
2015
2014
2014
3Q16
2016
0.41x
3.34x
0.43x
3.85x
0.59x
5.00x
0.47x
4.25x
0.76x
5.87x
0.72x
5.88x
Liabilities / Equity
ebitda/financial expenses
Net Financial Debt / Equity
net financial debt/EBITDA
< 1.50x
> 2.50x
CONSERVATIVE DEBT STRUCTURE AND OUTSTANDING FINANCIAL PERFORMANCE
Parque Arauco’s policy is to finance projects with 50% debt
and 50% equity, and is comfortably within all its covenants

- 27 -
27
DEC. 2014
Summary of debt by currency
Liability amortization profile and duration2
116
2535
106
168
94
922
196
25-36months
13-24months
0-3months
49-60months
7-12months
11-20years
37-48months
4-6months
6-10years
21-35years
0
95
23
138
88
300
158
6
74
186
25-36months
13-24months
0-3months
49-60months
7-12months
11-20years
37-48months
4-6months
6-10years
21-35years
128
5.0 years 1
6.7 years 1
DECEMBER 2014 (US$MM)
DECEMBER 2016 (US$MM)
IMPROVEMENT IN LOCAL DEBT RATINGFitch: AA- Feller: AA- ICR:AA-
BBB- BBB BBB+ A- AA-A AAA+ AA+
Source: Parque Arauco(1) Average age(2) Does not include accrued interests and the exchange rate is at the close of December 31, 2016.
54%UF
7% CLP
16% PEN
14% USD
CONSERVATIVE DEBT STRUCTURE AND OUTSTANDING FINANCIAL PERFORMANCE
During the last 24 months, the Company has improved its debt rating, eliminated debt in Dollars, and considerably
increased the duration of its liabilities
9% COP
Summary of debt rates
96% Fixed
4% Variable
93% Fixed
7% Variable DEC.
2016DEC.2014
DEC. 2016
68%UF
5% CLP
16% PEN
11% COP

- 28 -
28
ONSERVATIVE DEBT STRUCTURE AND OUTSTANDING FINANCIAL PERFORMANCE
The cost of debt has decreased importantly in the past 5 years
The cost of debt of Parque Arauco has decreased 160 points from 4.1% to 2.5%
The spread five years ago had collateral agreements, while the current spread is unsecured
with no collateral.
Date: 12-12-2014Base: 1.66%Spread: 1.74%Duration: 14.3
Date: 04-17-2015Base: 1.62%Spread: 1.68%Duration: 14.77
Source: Risk America
Date: 10-12-2016Base: 1.46%Spread: 1.02%Duration: 12.71
Generic long-term bond issued by Parque Arauco in Chile

- 29 -
29
IMPORTANT GROWTH OPPORTUNITIES
Parque Arauco has 0.9 million m2 and a 2% market participation in Latin American and a 8% market participation in the Andean
Region.
MEXICOGLA: 17.4 million m2
38% of total
ANDEAN REGIONGLA: 11.3 million m2
25% of total
ARGENTINAGLA: 2.1 million m2
5% of total
BRAZILGLA: 14.7 million de m2
32% of total
Source: Prepared using information published by the International Council of Shopping Centers (ICSC)., and Parque Arauco analysis
LATIN AMERICAGLA: 45.5 million m2
Indicator
Total GLA (th)GLA Parque Arauco (th)Market ShareRank
CHILE
3,60042412%#3
PERU
2,10038018%#2
COLOMBIA
5,6001433%#4

- 30 -
30
IMPORTANT GROWTH OPPORTUNITIES
Parque Arauco participates in markets with a growing retail market
GDP Per Person vs. GLA per 1,000 inhabitants1
GLA
per
1,0
00 h
abit
ants
GLA
per
1,0
00 h
abit
ants
Canada
USA
France
Italy
Spain
Chile
Chile
Argentina
Brazil
Brazil
Mexico
Mexico
Colombia
Colombia
South Africa
South Africa
2,500
2,000
1,500
1,000
500
-
500
400
300
200
100
-10,000 20,000 30,000 40,000
Peru
Peru
Portugal
Portugal
GDP per person, PPP (log scale)
GDP per person, PPP
Argentina
AT Kearney GRDI1 window of opportunity
Opening Peaking Maturing Closing
Chile
Mexico
Brasil
PeruColombia
5,000 50,000
(1) Global Retail Development Index
(1) Source: International Council of Shopping Centers, World Bank

- 31 -
31
IMPORTANT GROWTH OPPORTUNITIES
Parque Arauco’s growth has come from greenfield projects and M&A
Total GLA
in 2006
194,745
55,651
83,70824,595
91,62527,676
80,242
132,85837,400
90,000
947,000
Total GLA
in 2007
Total GLA
in 2010
Total GLA
in 2014
Total GLA
in 2008
Total GLA
in 2011
Total GLA
in 2015
Total GLA
in 2009
Total GLA
in 2013
Total GLA
in 2012
New GLA
in 2016
Greenfields650,643 m2
M&A296,357 m2
Greenfield M&A
69%
31%
Total GLA2016
128,500

- 32 -
32
INTRODUCTION
OUR OPERATIONS
INVESTMENT HIGHLIGHTS
FUTURE DEVELOPMENTS

- 33 -
33
New Projects Country
Country
Format
Format
Estimated Opening Date
Estimated Opening Date
Total Investment in local currency1
Total Investment in local currency1
Total InvestmentUSDMM2
Total InvestmentUSDMM2
Owned GLAm2
Owned GLAm2
% Ownership
% Ownership
Total GLA m2
Total GLAm2expansions
1) Projects in Chile in UF, in Peru in ThPEN and in Colombia in MCOP 2) Exchange rate as of December 31, 2016: 226,347.1 CLP/UF, 669.5 CLP/USD, 3,00.3 COP/USD, 3.4 PEN/USD. 2) In addition to the 11,000 m2, this expansion includes a 401 room Hilton by Hilton Hotel and largest hotel convention center in Santiago.
Parque Angamos
MegaPlaza Villa El Salvador II
MegaPlaza Express Huaral
Various Projects SCP
Viamix Colonial
Arauco Premium Outlet Bogotá
Subtotal
Chile
Peru
Peru
Peru
Peru
Colombia
Chile
Colombia
Chile
Peru
Peru
Peru
Chile
Peru
Peru
Chile
Chile
Chile
Peru
Peru
Peru
Chile
Peru
Colombia
55%
50%
50%
100%
100%
100%
100%
100%
53%
100%
50%
50%
53%
50%
N/A
N/A
100%
53%
50%
100%
100%
100%
100%
100%
1H18
2H17
1Q17
2H18
1Q17
1H17
1Q17
4Q16
4Q16
4Q16
4Q16
2Q16
2Q16
2Q16
2Q16
2Q16
1Q16
1Q16
1Q16
1Q16
1Q16
2H21
2H17
2H17
886,000
36,000
38,000
180,000
25,000
78,000
1,520,000
672,000
320,000
9,500
53,000
38,000
319,000
47,000
28,600
2,137,500
309,000
115,000
9,000
76,000
53,500
5,355,000
39,500
17,500
Neighborhood
Neighborhood
Neighborhood
Neighborhood
Strip Center
Outlet
Regional
Regional
Strip Center
Strip Center
Regional
Regional
Strip Center
Neighborhood
N/A
N/A
Outlet
Strip Center
Regional
Outlet
Neighborhood
Regional / Hotel
Regional
Hotel
6,050
5,500
8,250
19,500
3,000
13,000
55,300
30,000
64,00
3,160
1,500
4,750
3,750
2,370
7,250
4,620
N/A
6,000
1,843
1,250
8,500
14,000
149.372
11,000
N/A
N/A
11,000
11,000
11,000
16,500
19,500
3,000
13,000
74,000
30,000
64,000
6,000
1,500
9,500
7,500
4,500
14,500
N/A
N/A
6,000
3,500
2,500
8,500
14,000
173,000
11,000
N/A
N/A
11,000
35
11
11
54
7
26
144
60
224
13
3
16
11
13
14
9
84
12
5
3
23
16
506
211
12
6
229
Total
Remaining investment as of December 31, 2016
215,672258,000 879
311
Parque Arauco Kennedy Expansion2
Renovación Parque Lambramani
Hotel Bucaramanga
Subtotal
Mall Costa Pacífico
Parque La Colina
Arauco Express Antofagasta
Viamix Chorrillos Expansion
MegaPlaza Norte Libertadores Expansion
Megaplaza Norte Cine Conquistadores Expansion
Arauco Express Ciudad Empresarial II
MegaPlaza Express Jaen
MegaPlaza Chimbote Minority Interest
Inmobiliaria Viña del Mar Minority Interest
Arauco Premium Outlet Coquimbo
Arauco Express Recoleta
MegaPlaza Chimbote Expansion
InOutlet Premium Lurín
Plaza Jesús María
Subtotal
Parque Arauco has announced projects that will add 228,000 m2 of GLA over the next few years
and will require an investment of US$ 819 million.
Future Developments 2016 and Onwards
Type
projects incorporated in 2016 Country Format Oeening DateTotal Investment in local currency1
Total Investment USDMM1
Owned GLA m2% OwnershipTotal GLA
m2Type
Type
Greenfield
Greenfield
Greenfield
Greenfield
Greenfield
Greenfield
Acquisition
Greenfield
Greenfield
Expansion
Expansion
Expansion
Greenfield
Greenfield
Minority Interest
Minority Interest
Greenfield
Greenfield
Expansion
Greenfield
Acquisition
Expansion
Renovation
Expansion

- 34 -
34
Parque La Colina was inaugurated in December 2016
Committed brands:

- 35 -
35
We announced a new expansion of Parque Arauco Kennedy
Project Details:
Investment: 5,355,000 UF5-star hotel: Hilton by HiltonRooms: 401Convention center: 3,000 m2
Parking spots: 700Additional GLA: 11,000 m2
- The project will have the first five star Hilton hotel in Chile, a convention center, as well as the incorporation of new stores and more parking.
- The five star Hilton hotel will have 401 rooms, two restaurants, three bars, two pools, a gym and an executive lounge. It will have the largest hotel convention center in the country, with the possibility of hosting over 2,800 people.
- The expansion will include a new flagship Falabella store with almost 25,000 m2 of GLA. This store will occupy the first four floors of the expansion.
Hotel Operator:

- 36 -
36
M2 % OwnershipTotal Cost
(Local Currency)1
Total Cost
(USD MM)nameQuilicura
Buenaventura
Chicureo
Los Andes
Others in Chile
Total Chile
Parque El Golf - San Isidro
Chimbote
Talara
Ica
Chiclayo
Others MegaPlaza
Total Peru
Neiva
Valledupar
Barranquilla
Total Colombia
Total
25,486
115,864
47,614
39,254
55,567
293,785
14,790
42,657
30,675
12,643
6,608
211,417
318,790
49,537
46,000
56,166
151,703
754,278
78,000
455,000
206,000
117,000
445,000
1,301,000
109,000
18,000
9,400
13,500
6,300
115,000
271,200
18,000
30,000
76,000
124,000
3
18
8
5
17
51
32
5
3
4
2
34
81
6
10
25
41
171
100%
100%
100%
100%
100%
100%
70%
100%
100%
100%
100%
50%
65%
100%
100%
100%
100%
86%
The company also has a valuable landbank which will serve as the base for future development.
Landbank
1) Landbank in Chile in UF, in Peru in ThPEN and in Colombia in MCOP

- 37 -
37
Adjusted FFO Margin - AFFO / revenues
AFFO -Adjusted Funds From Operations: Net Profit - Depreciation & Amortization - Other Income/expenses - Share of Profit (Loss) of Associates Accounted - Foreign Exchange Differences - Income (Loss) for indexed assets and liabilities - Gains (losses) from the difference between the previous book value and the fair value of financial assets - Deferred tax+ Associates accounted Adjusted FFO
Controlling Adjusted FFO -AFFO attributable to the shareholders of the company
Controlling FFO -FFO attributable to the shareholders of the company
EBITDA - Earnings Before Income Tax Depreciation and Amortization: Revenues + Cost of Sales + Administration Expenses - Depreciation and Amortization
EBITDA margin -EBITDA divided by revenues
EPS -Earnings Per Share: Net income attributable to the equity holders of the company/weighted average number of shares outstanding
FFO -Funds From Operations: Net Profit - Depreciation & Amortization - Share of Profit (Loss) of Associates Accounted + Associates Accounted FFO
GLA -Gross Leasable Area. Equivalent to the sum of all the areas available for lease
Green Field Projects - Organic development of new shopping centers
Landbank -Land held by the company for future development
LTM -Refers to information from the last twelve months
Monthly Revenues / m2 -Monthly revenues divided by GLA
weighted by average occupancy for the period
Monthly Sales/m2 -Monthly tenant sales divided by GLA weighted by average occupancy for the period
Neighborhood Mall -A shopping mall with a GLA between 6,000 and 20,000 m2
Net income margin -Net profit / revenues
NOI -Net Operating Income: Revenues + Cost of Sales + Administration Expenses - Depreciation & Amortization + Associates accounted NOI
Occupancy -GLA paying rent divided by total GLA
Occupancy cost -Minimum rent, plus variable rent, plus common expenses, plus a promotion fund that the tenants pay Parque Arauco divided by the sales of the tenant.
Owned GLA -Total GLA weighted by Parque Arauco’s interest in the mall
Pipeline -Greenfield and expansion projects under development
Premium Outlet - Shopping center located outside of the city offering name brand clothing and goods for a reduced price
Regional Mall - A shopping mall with a GLA over 20,000 m2.
SSR -Same Store Rent: Percentage change in rent collected from tenants that paid rent in both of the periods compared
SSS -Same Store Sales: Percentage change in sales from tenants that reported sales in both of the periods compared
Strip Center -A shopping center with a GLA less than 6,000 m2
Tenant Sales Tenant sales of the consolidated assets
UF -Unidad de Fomento: A chilean currency unit indexed according to inflation daily
37
Glossary

- 38 -
38


![[db tech showcase Tokyo 2015] DATA WAREHOUSE BASICS by Wiliiam Inmon](https://static.fdocuments.us/doc/165x107/588681ba1a28ab962a8b6ea9/db-tech-showcase-tokyo-2015-data-warehouse-basics-by-wiliiam-inmon.jpg)